Munich/Germany  09. May 2010
Ceilometer 24 h
log (range corrected signal) at 1064 nm
../chm15kx/images/2010/rc_1000509.png
Maisach/Germany  09. May 2010
Eyjafjallajökull (volcanic ash)
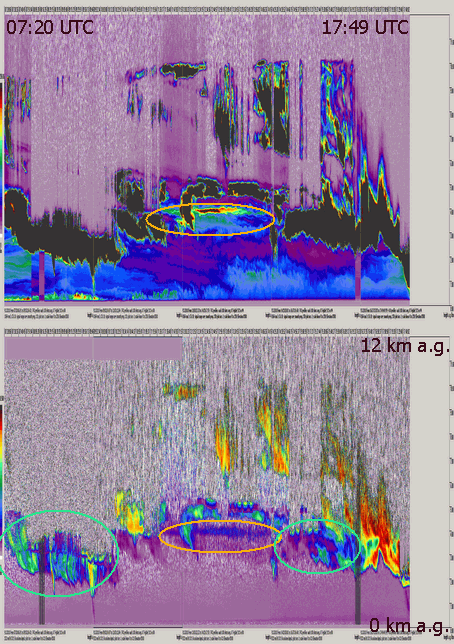
time compressed overview with comments (for details see the quicklooks below and here )
100509_small_with_comments.png

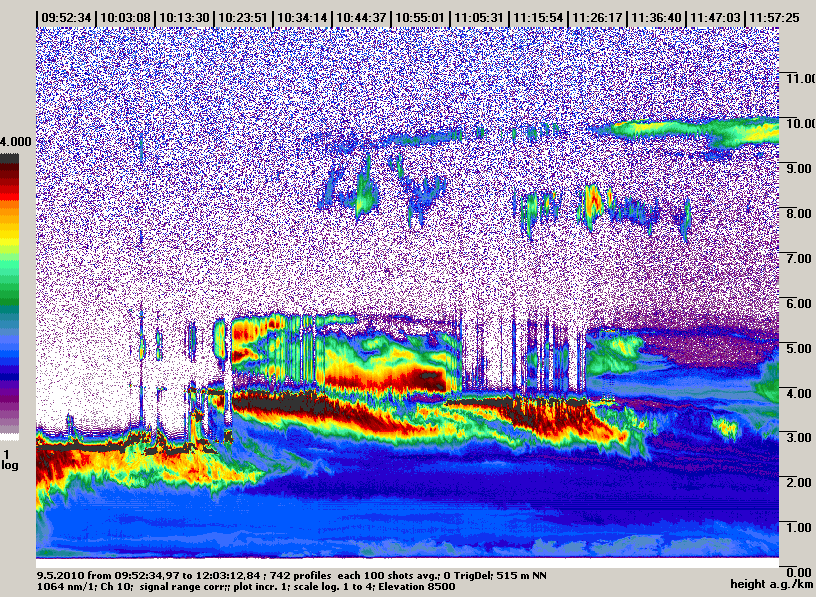
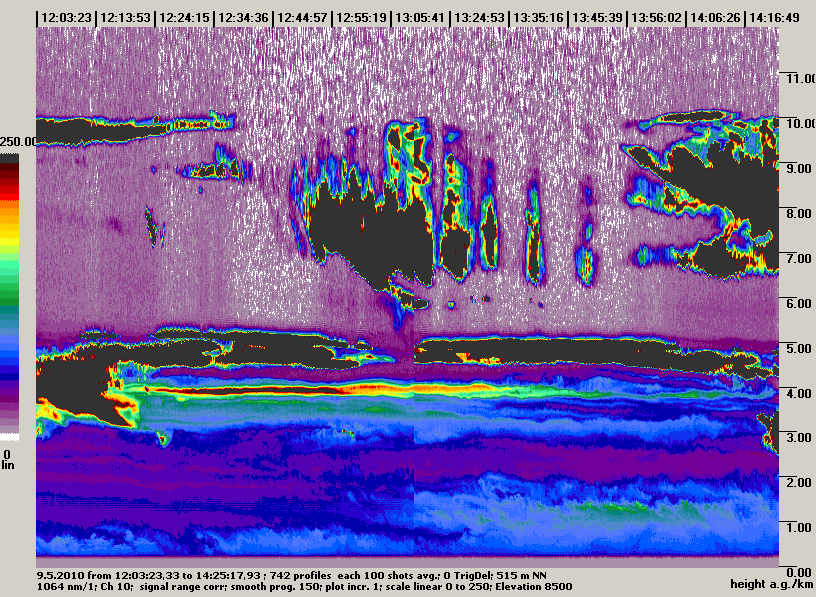
range corrected backscattter signals at 1064 nm (linear scale)


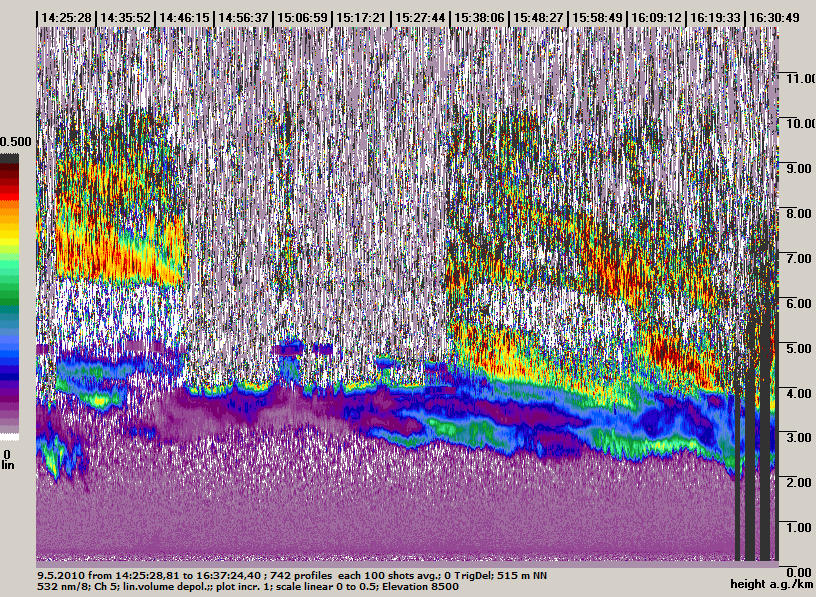
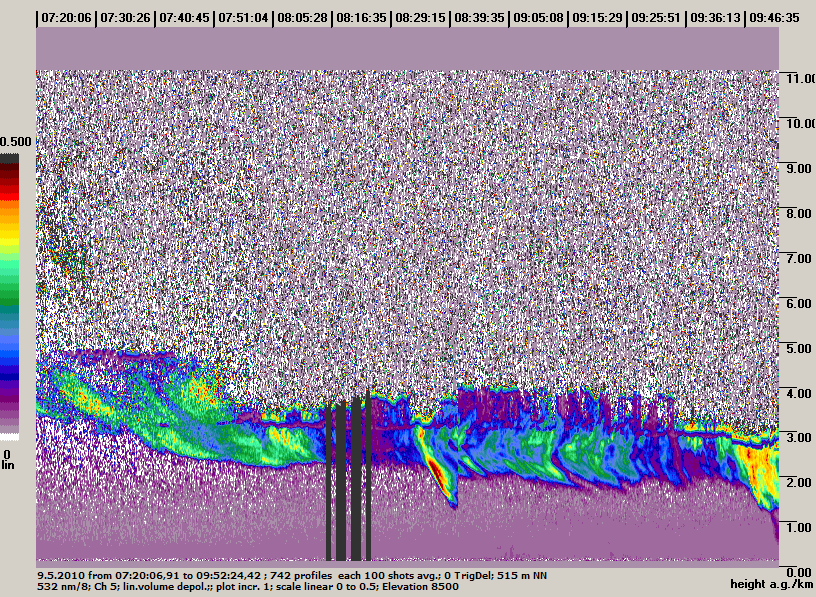
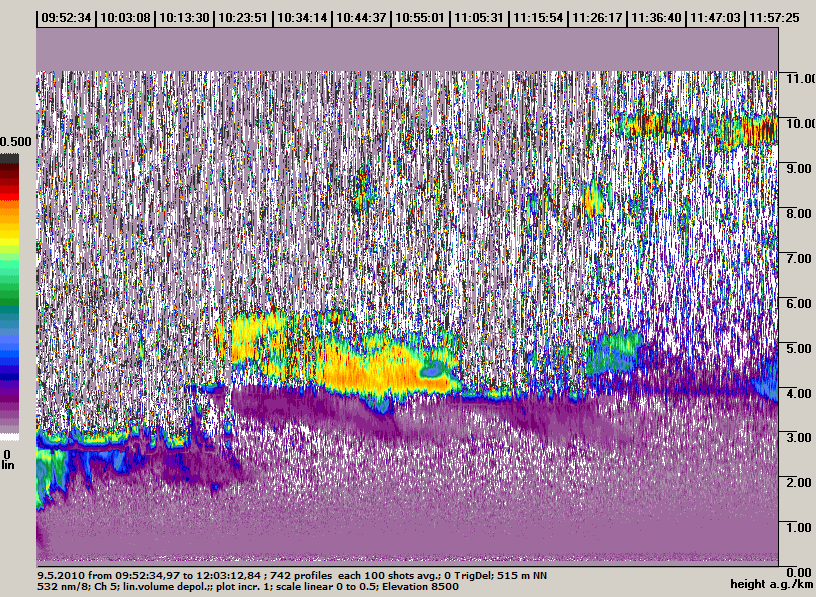
volume linear depolarisation ratio at 532 nm


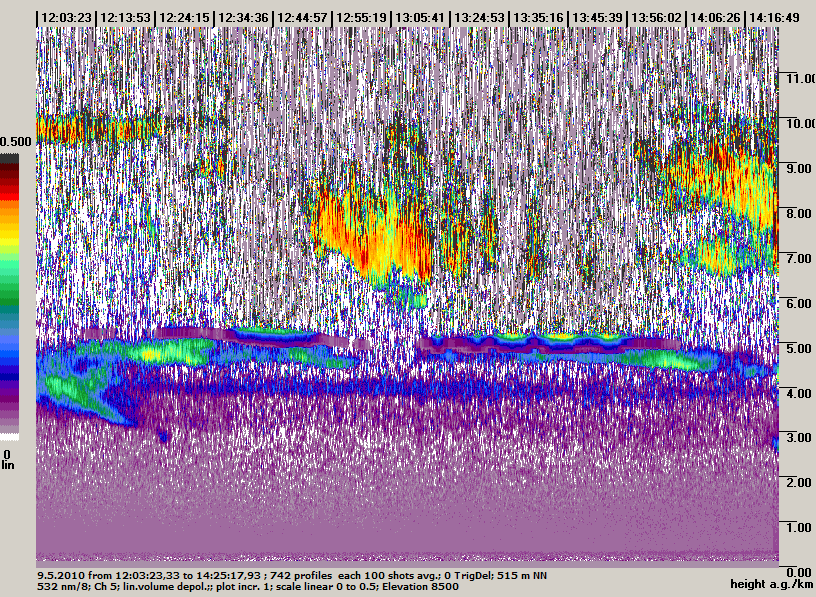
The depolarization in the orange ellipse indicates a volcanic ash layer.

In the areas within the green ellipses we see ice formation in clouds which is possibly influenced by volcanic ash.

The depolarisation values in yellow to red are typical for cirrus clouds.


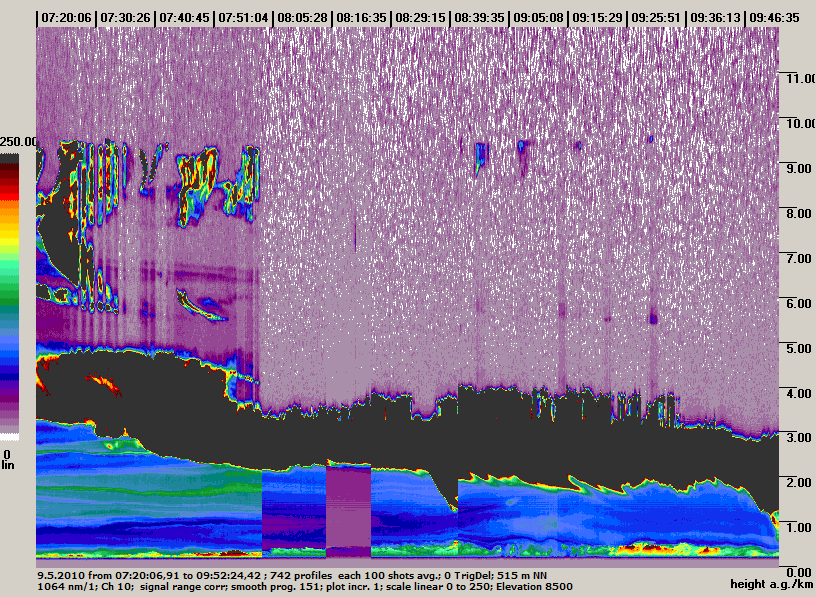
1064 nm, log(range corrected signal)   07:20 - 09:52 UTC Mulis    532 nm volume linear depolarisation ratio
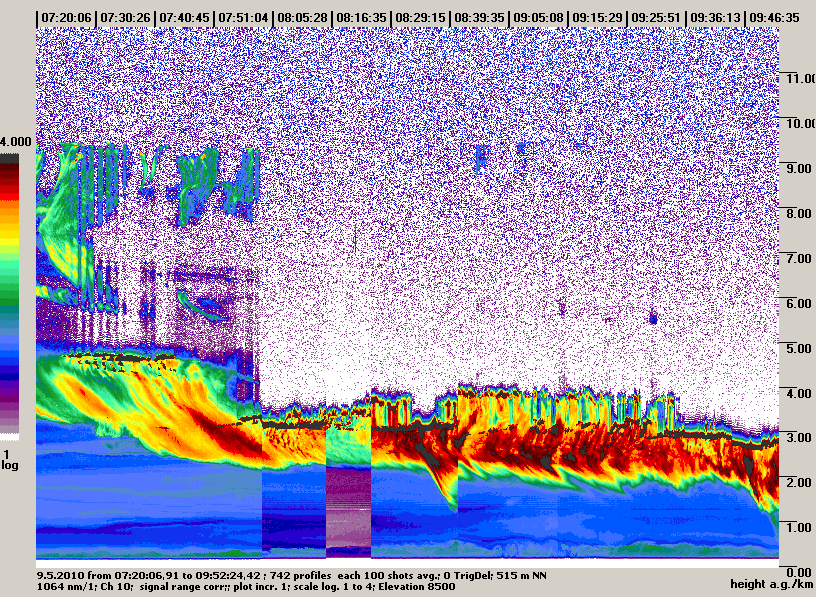
100509/100509-07200691-09522442-1064nm-SID1-S+P-0.png 100509/100509-07200691-09522442-532nm-SID8-LDep-2.png
1064 nm, range corrected signal                                                        
100509/100509-07200691-09522442-1064nm-SID1-S+P-1.png

1064 nm, log(range corrected signal)   09:52 - 12:03 UTC Mulis    532 nm volume linear depolarisation ratio
100509/100509-09523497-12031284-1064nm-SID1-S+P-0.png 100509/100509-09523497-12031284-532nm-SID8-LDep-0.png
1064 nm, range corrected signal                                                        
100509/100509-09523497-12031284-1064nm-SID1-S+P-1.png 100509/radiosounding100509_12UTC_small.png

1064 nm, range corrected signal    12:03 - 14:25 UTC Mulis    532 nm volume linear depolarisation ratio
100509/100509-12032333-14251793-1064nm-SID1-S+P-0.png 100509/100509-12032333-14251793-532nm-SID8-LDep-0.png
1064 nm, log(range corrected signal)                                                                  
100509/100509-12032333-14251793-1064nm-SID1-S+P-2.png

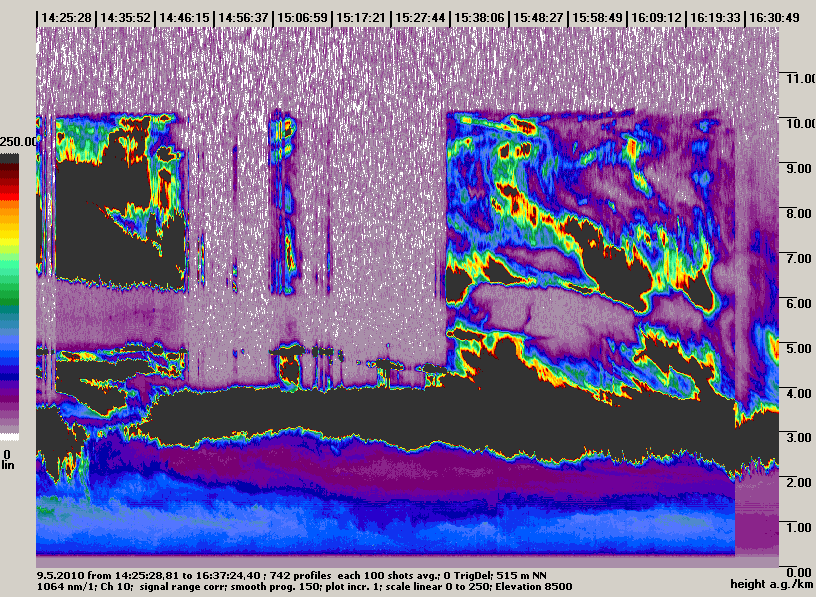
1064 nm, range corrected signal    14:25 - 16:37 UTC Mulis    532 nm volume linear depolarisation ratio
100509/100509-14252881-16372440-1064nm-SID1-S+P-0.png 100509/100509-14252881-16372440-532nm-SID8-LDep-0.png
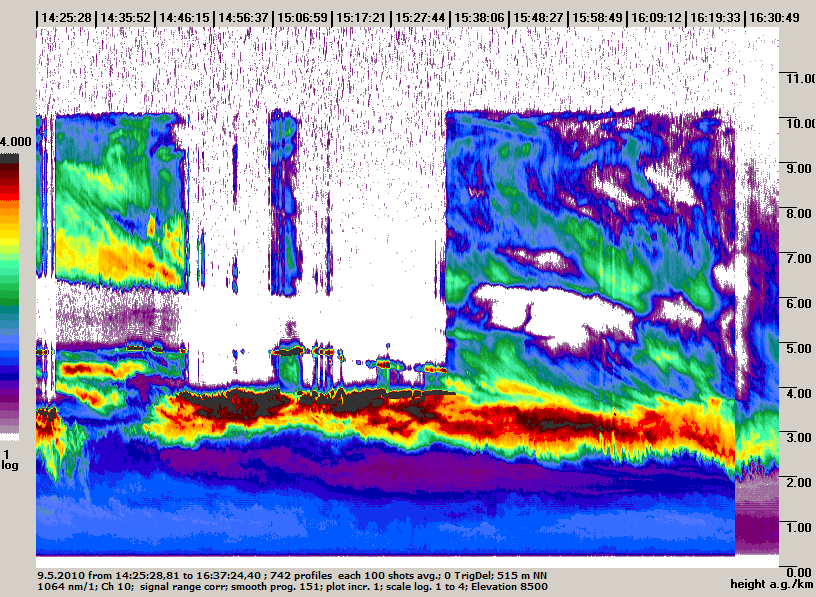
1064 nm, log(range corrected signal)                                                                  
100509/100509-14252881-15593174-1064nm-SID1-S+P-1.png

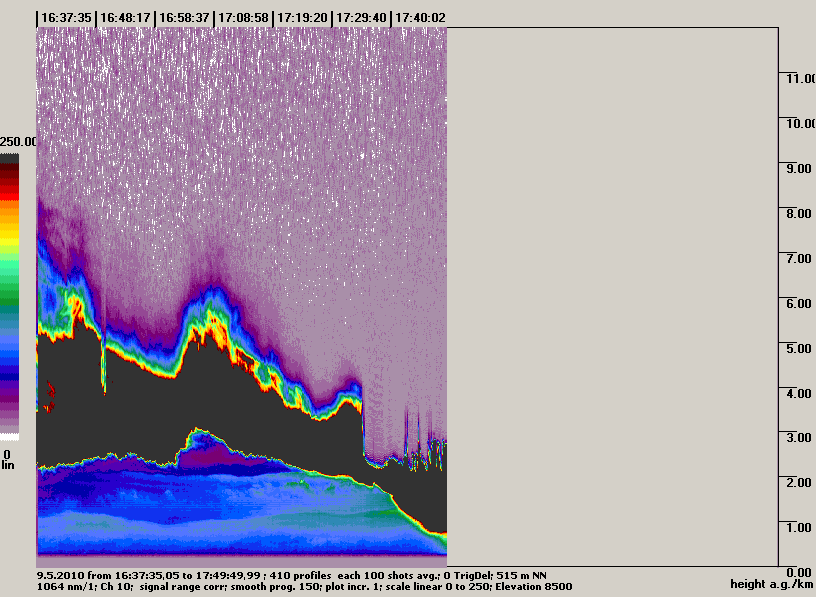
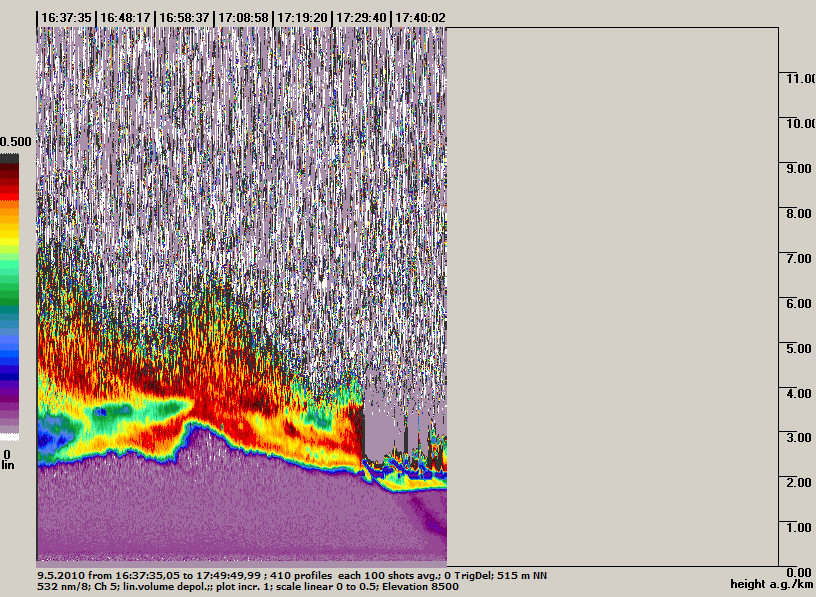
1064 nm, range corrected signal    16:37 - 17:49 UTC Mulis    532 nm volume linear depolarisation ratio
100509/100509-16373505-17494999-1064nm-SID1-S+P-0.png 100509/100509-16373505-17494999-532nm-SID8-LDep-0.png
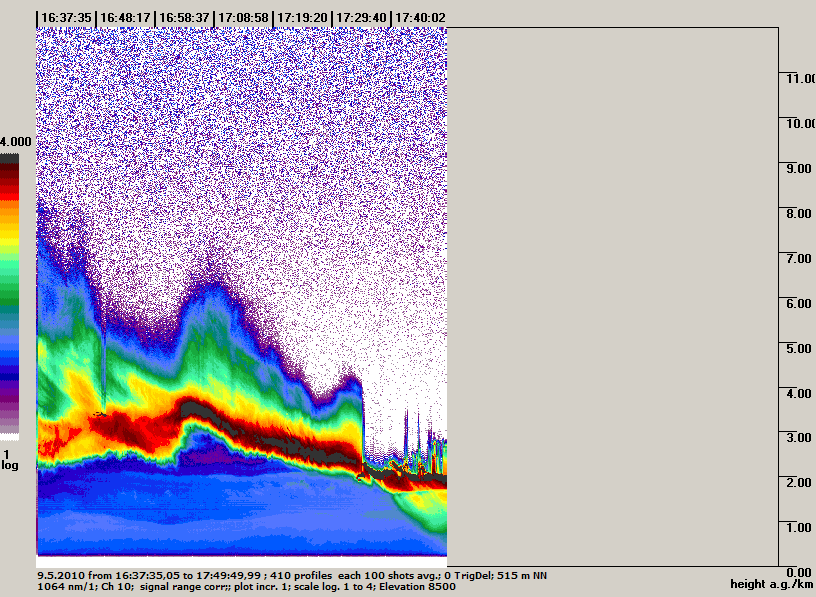
1064 nm, log(range corrected signal)                                                                  
100509/100509-16373505-17494999-1064nm-SID1-S+P-1.png
 

Analyses

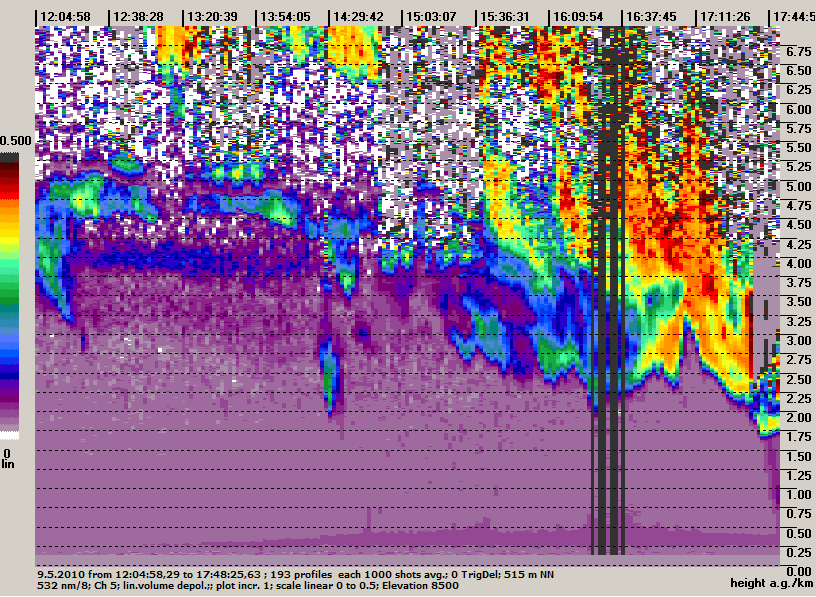
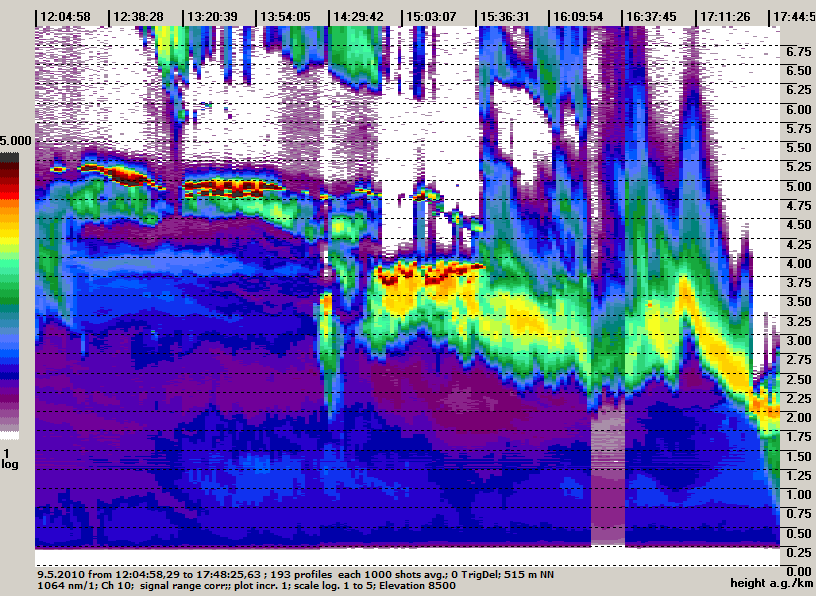
12:04 - 17:48 UTC Mulis 100 seconds averages
1064 nm, range corrected signal
                      532 nm volume linear depolarisation ratio
100509/100509-12045829-17482563-1064nm-SID1-S+P-0.png 100509/100509-12045829-17482563-532nm-SID8-LDep-0.png
1064 nm, log(range corrected signal)                                                                  
100509/100509-12045829-17482563-1064nm-SID1-S+P-1.png
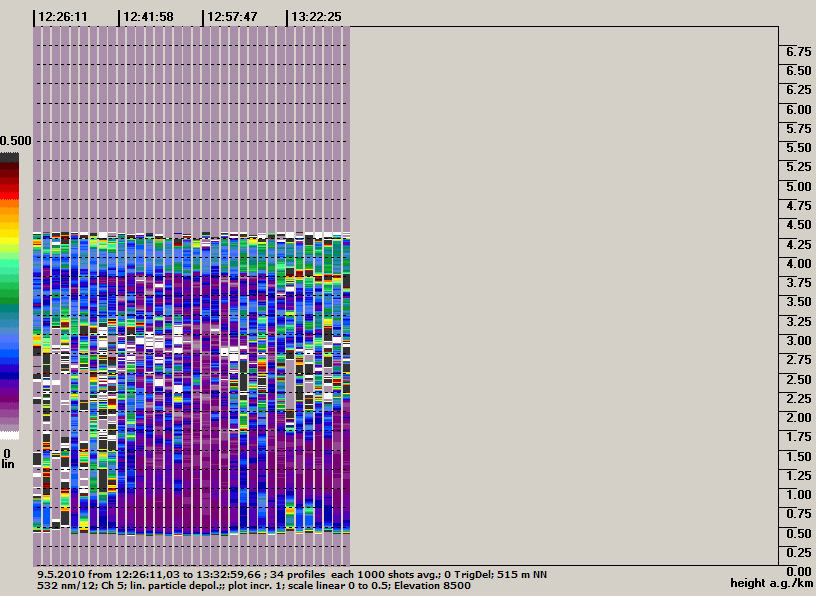
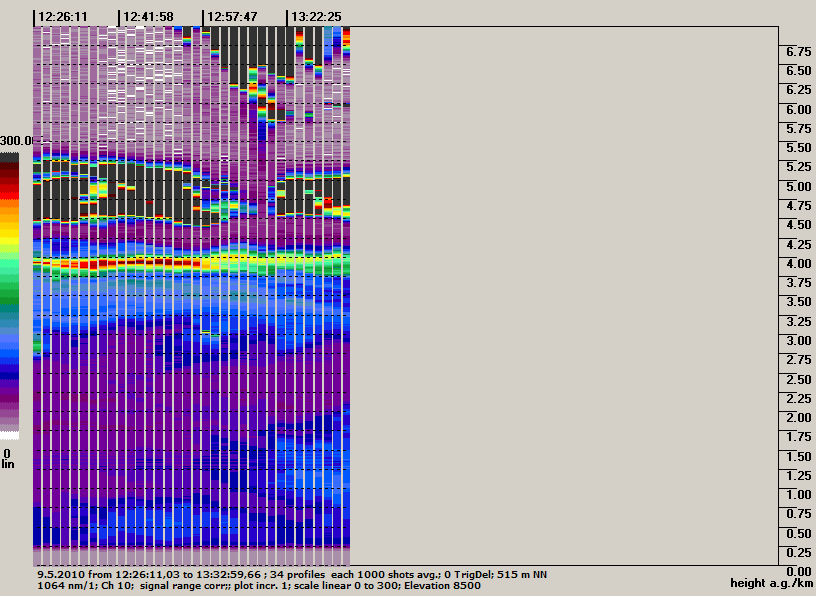
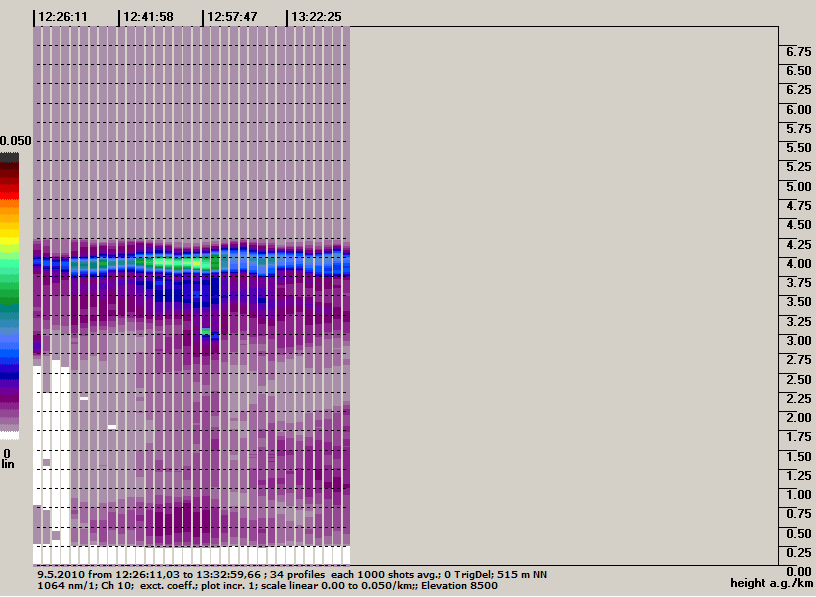
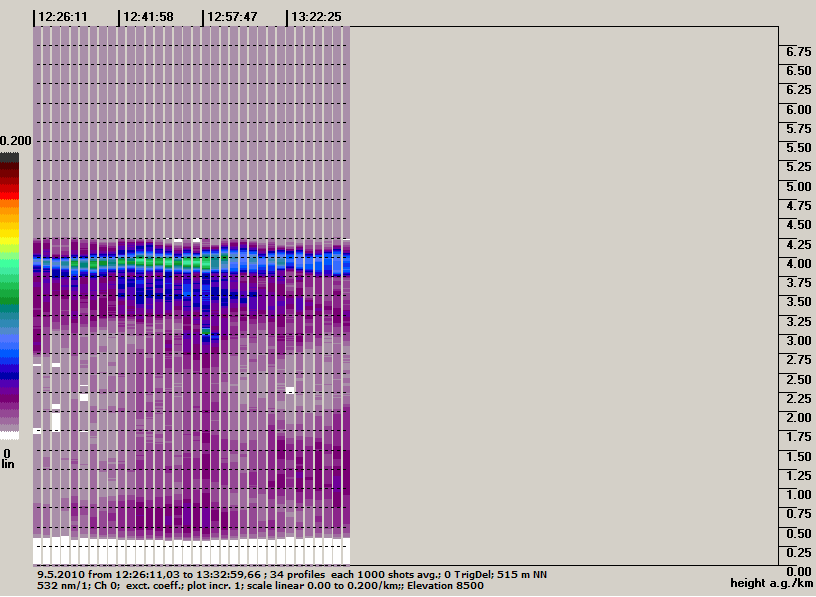
12:26 - 13:32 UTC Mulis  100 seconds averages
          1064 nm, range corrected signal                            1064 nm extinction coefficient [1/km] (Klett 55 sr)
100509/100509-12261103-13325966-1064nm-SID1-S+P-0.png 100509/100509-12261103-13325966-1064nm-SID1-exco-0.png
532 nm extinction coefficient [1/km] (Klett 55 sr)                            532 nm particle linear depolarisation ratio
100509/100509-12261103-13325966-532nm-SID1-exco-0.png 100509/100509-12261103-13325966-532nm-SID12-LDepA-0.png


MIM Lidar Links:  Locations  MaisachMunich     Quicklooks