Coverage of the Eyjafjallajökull (volcanic ash) episode with lidar measurements of the linear volume depolarization ratio at 532 nm
by the Meteorological Institute of the LMU-University, Munich.
The
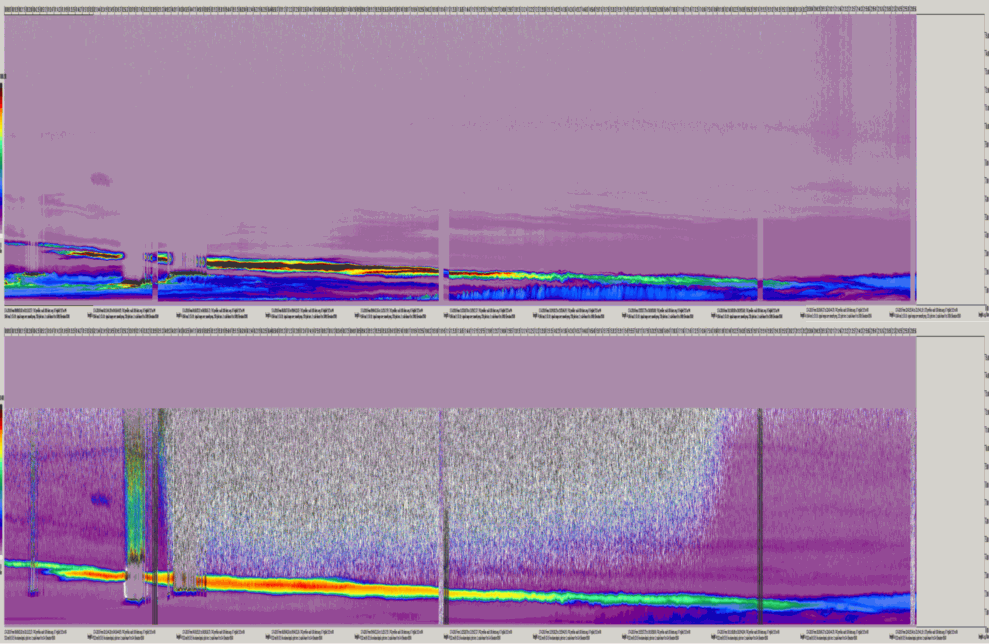
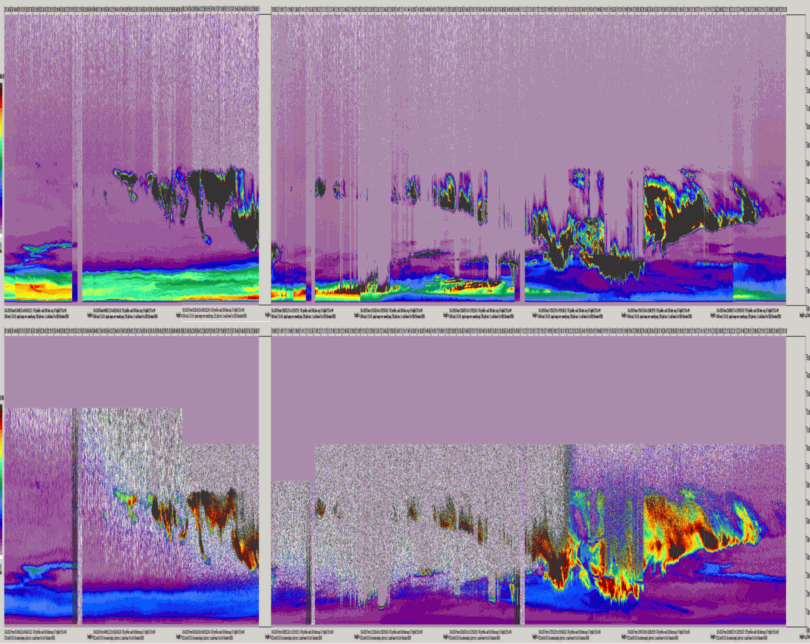
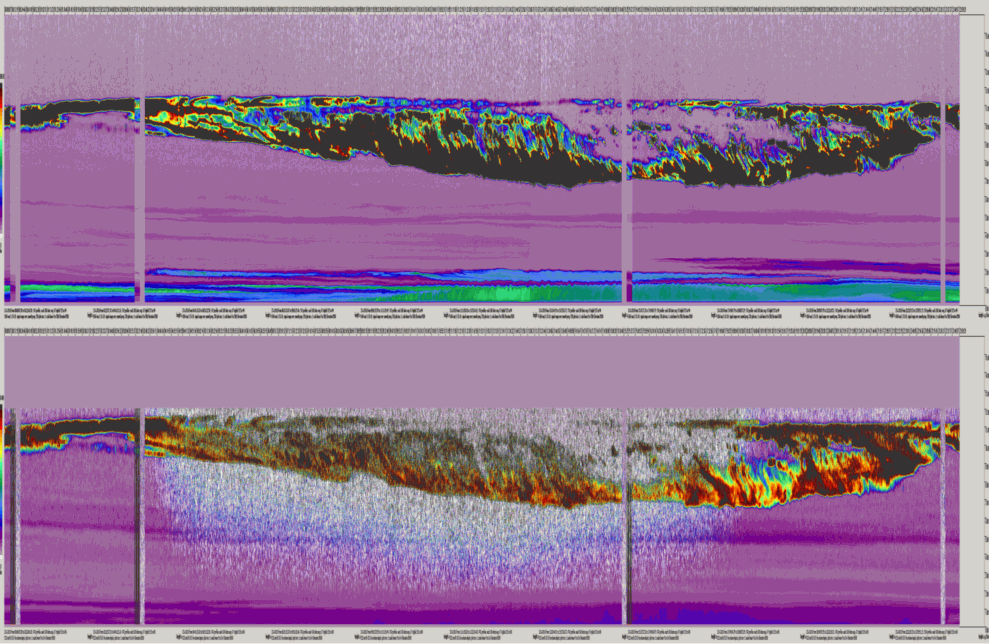
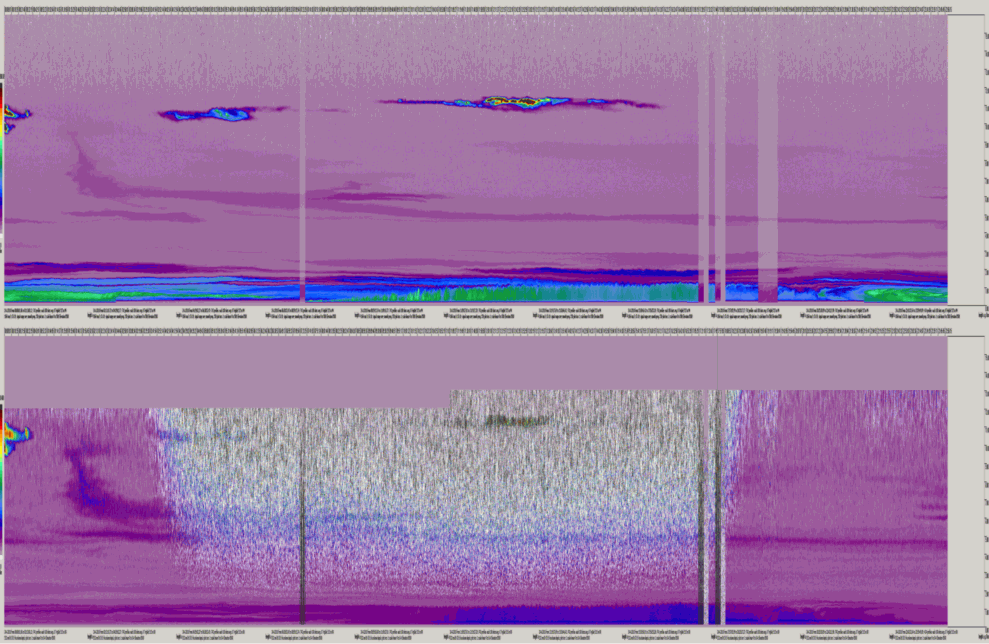
following plots show on top the 10 s averaged, range corrected backscatter
signal at 1064 nm, which roughly shows the amount of particles in
the
atmosphere, and below the volume linear
depolarization ratio at
532
nm, i.e. the backscatter signal cross polarized to the linear
laser polarization divided by the parallel polarized backscatter
signal. The horizontal axis is the time (UTC), and the vertical
axis the height above ground in km. The altitude in Maisach is 515 m
NN. The temporal resolution of the measurements is 1/(10 seconds), and
the
height resolution increases between 7.5 m near ground to some hundred
meters at 16 km. The noise in the upper part of the depolarization
plots during day stems from the skylight background. Depolarization
plots have a slightly different height averaging than the backscatter
plots because of the higher noise level, which can sometimes give the
impression of multiple scattering effects. Please contact me for
details.
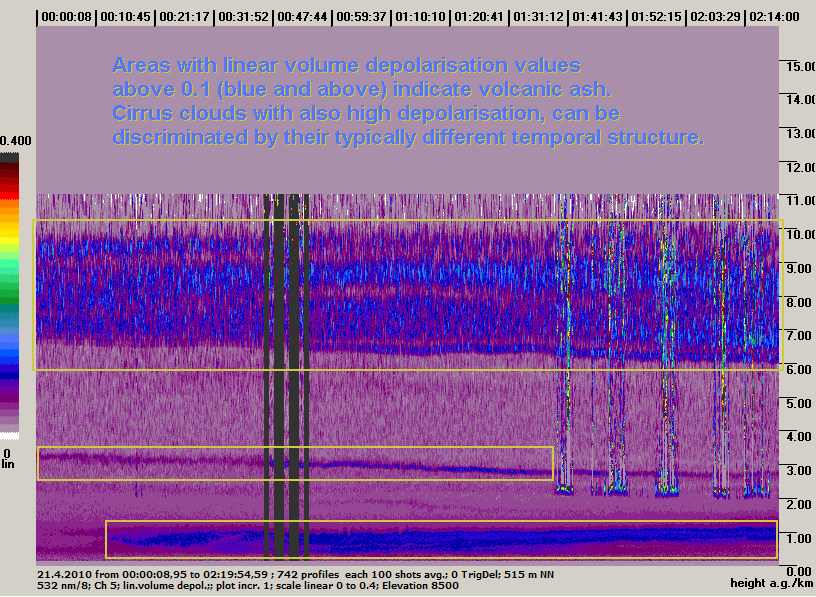
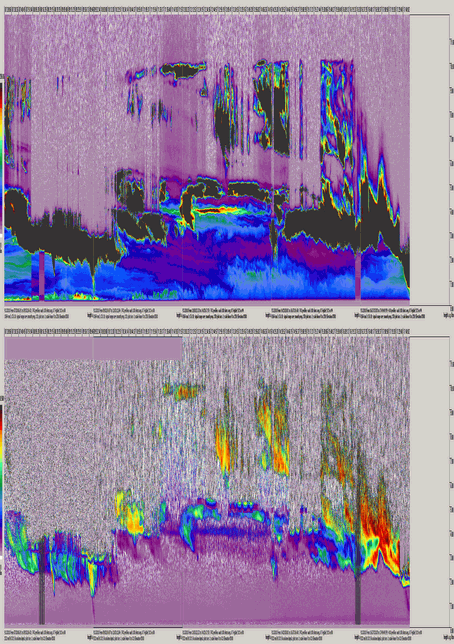
Volcanic ash particles are strongly depolarizing, similar to mineral dust and ice crystals in cirrus clouds, and can hence often be identified by enhanced depolarization structures in the plots of this episode. The plot at right shows an example with areas very probably containing volcanic ash. However, as this discrimination technique for volcanic ash can be ambiguous, we use additional signals, which are not shown here, to achieve a high confidence level.
The animation for each day shows the same plots as below but overlayed and alternating between the volume linear depolarisation ratio and the range corrected signal. In this way the depolarising (volcanic ash, cirrus, Saharan dust) layers can better be identified. The animated plots are horizontally compressed to fit on one page. The times and heights can be found on the full plots. The animations are Windows executable files and must be downloaded to your PC end executed. The animation can be stopped and restarted by pressing the space key, and when stopped the plots can manually be alternated by pressing the cursor left or right key. Leave the animation with the Esc key. According to my daily updated virus scanner (Sophos) the files are free of viruses. However, I do not guarantee for any damage these files could do to your PC or to you. Use them at your own risk (I guess I have to say that...).
More plots,data, and info here and there.
16. April 2010 (download animation)
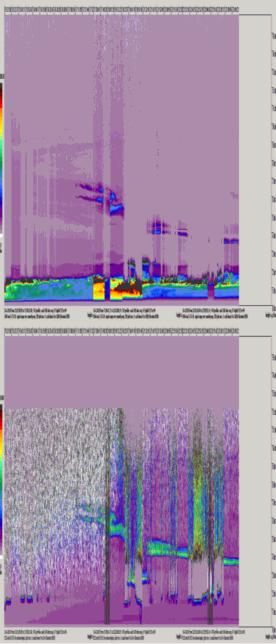 | range corrected backscatter signal at 1064 nm linear volume depolarization ratio at 532 nm (calibrated) |
17. April 2010 (download animation)
18. April 2010 (download animation)
19. April 2010 (download animation)
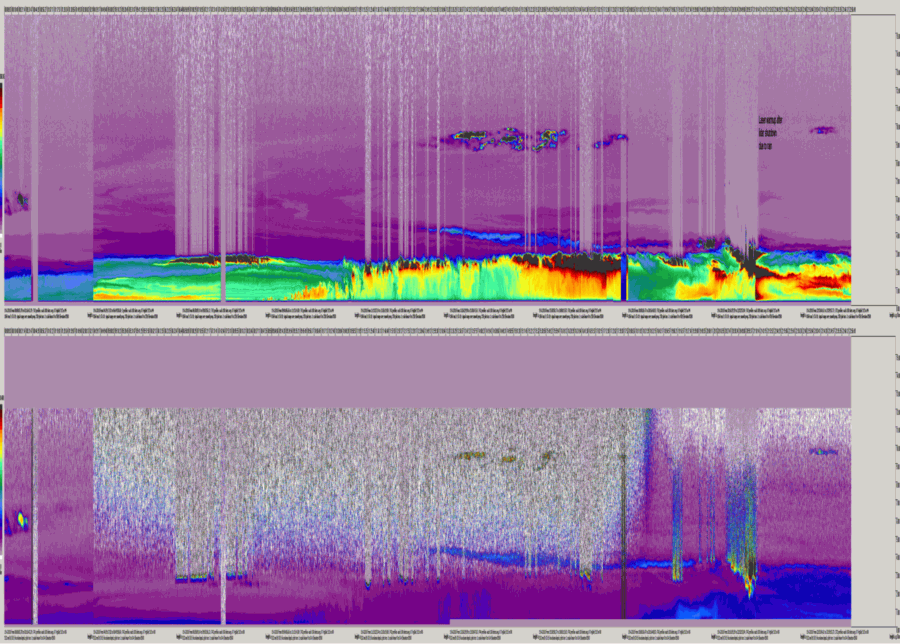
20. April 2010 (download animation)
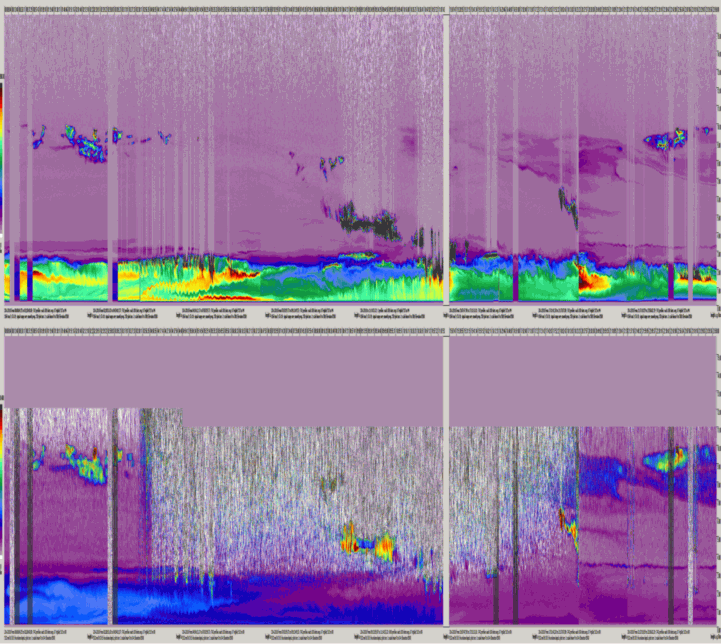
21. April 2010 (download animation)
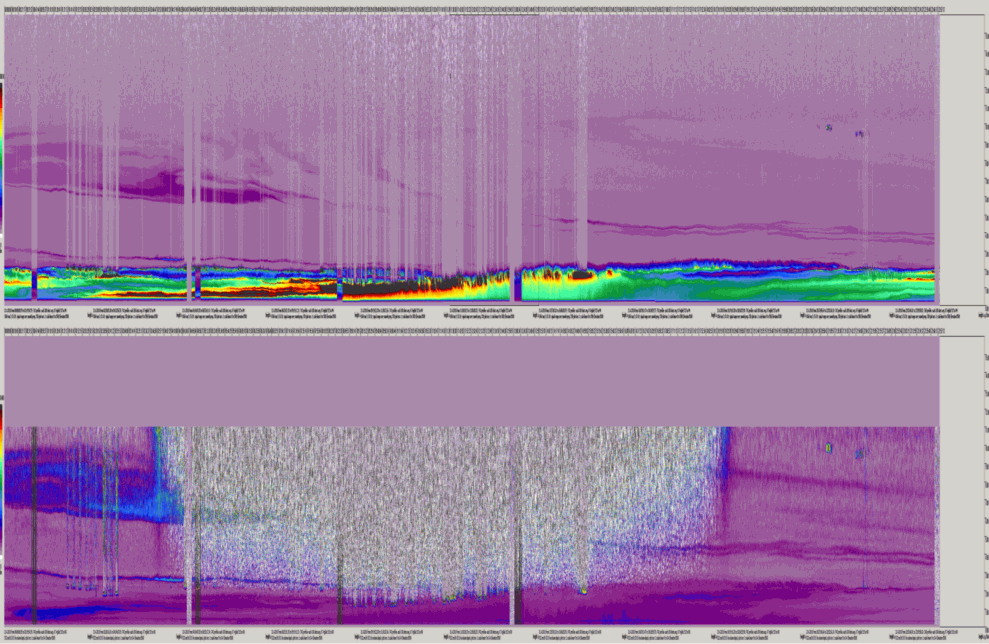
22. April 2010 (download animation)
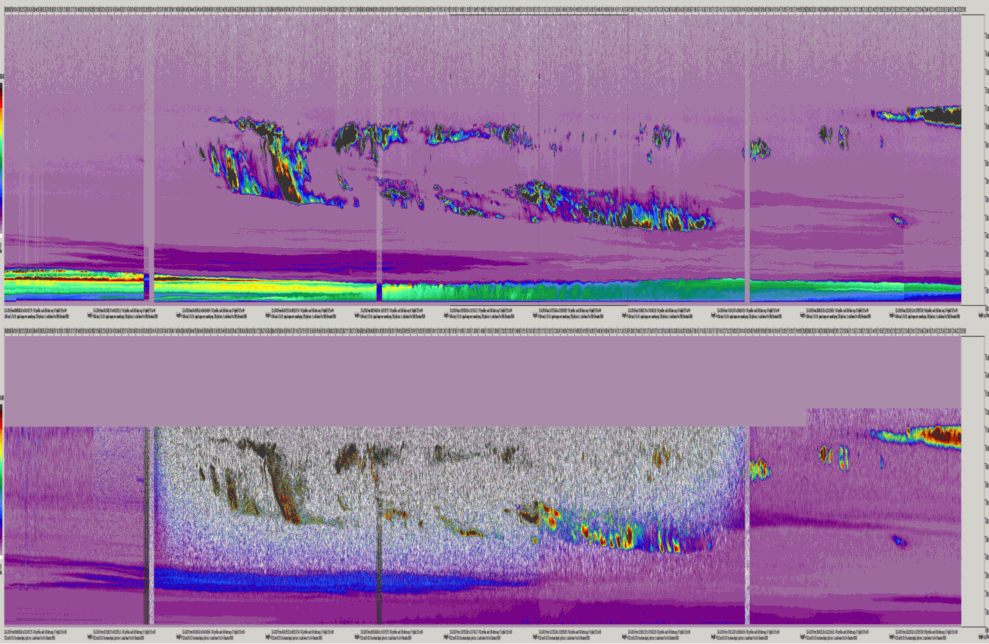
23. April 2010 (download animation)
24. April 2010 (download animation)
09. May 2010
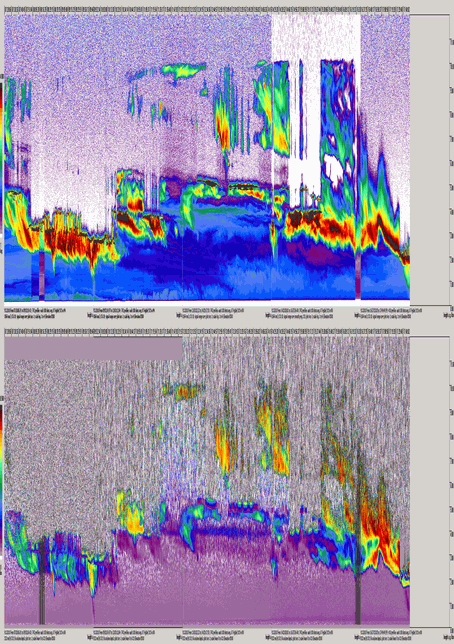
linear scale range corrected signal (download animation) logarithmic scale range corrected signal (download animation)
MIM Lidar Links: Locations Maisach, Munich Quicklooks