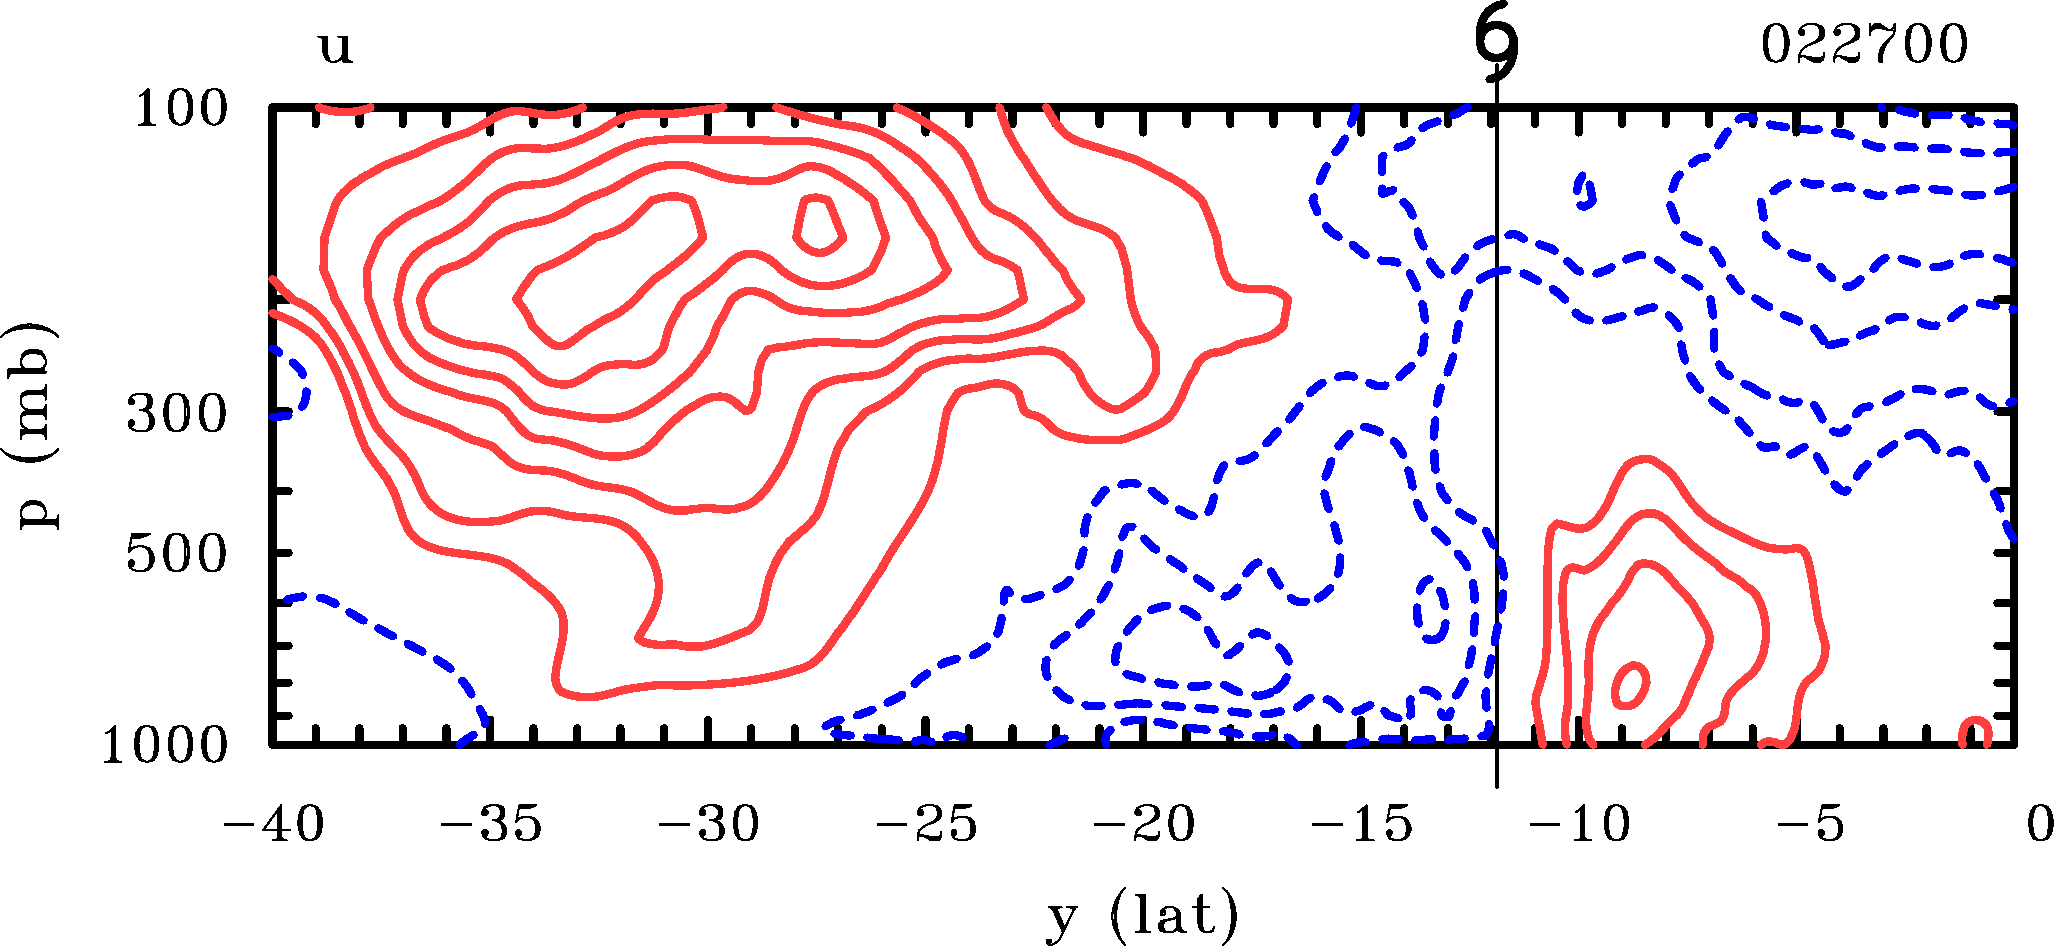
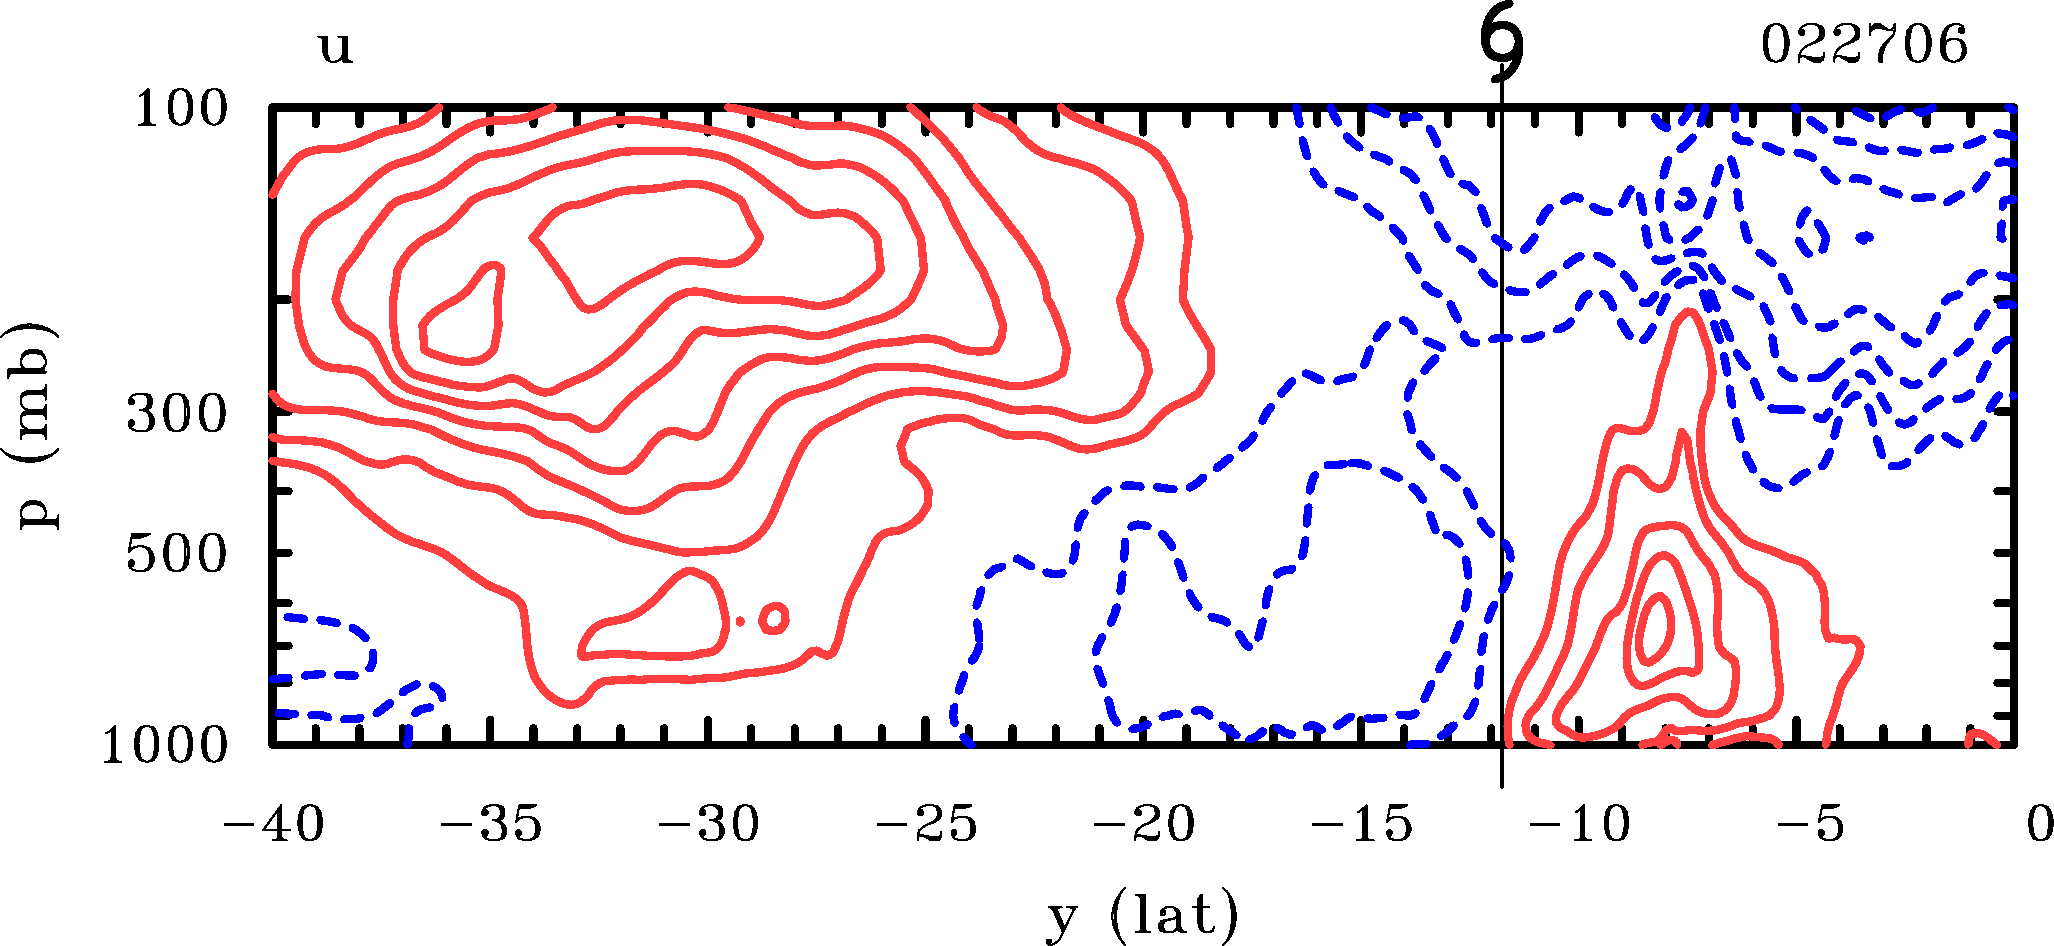
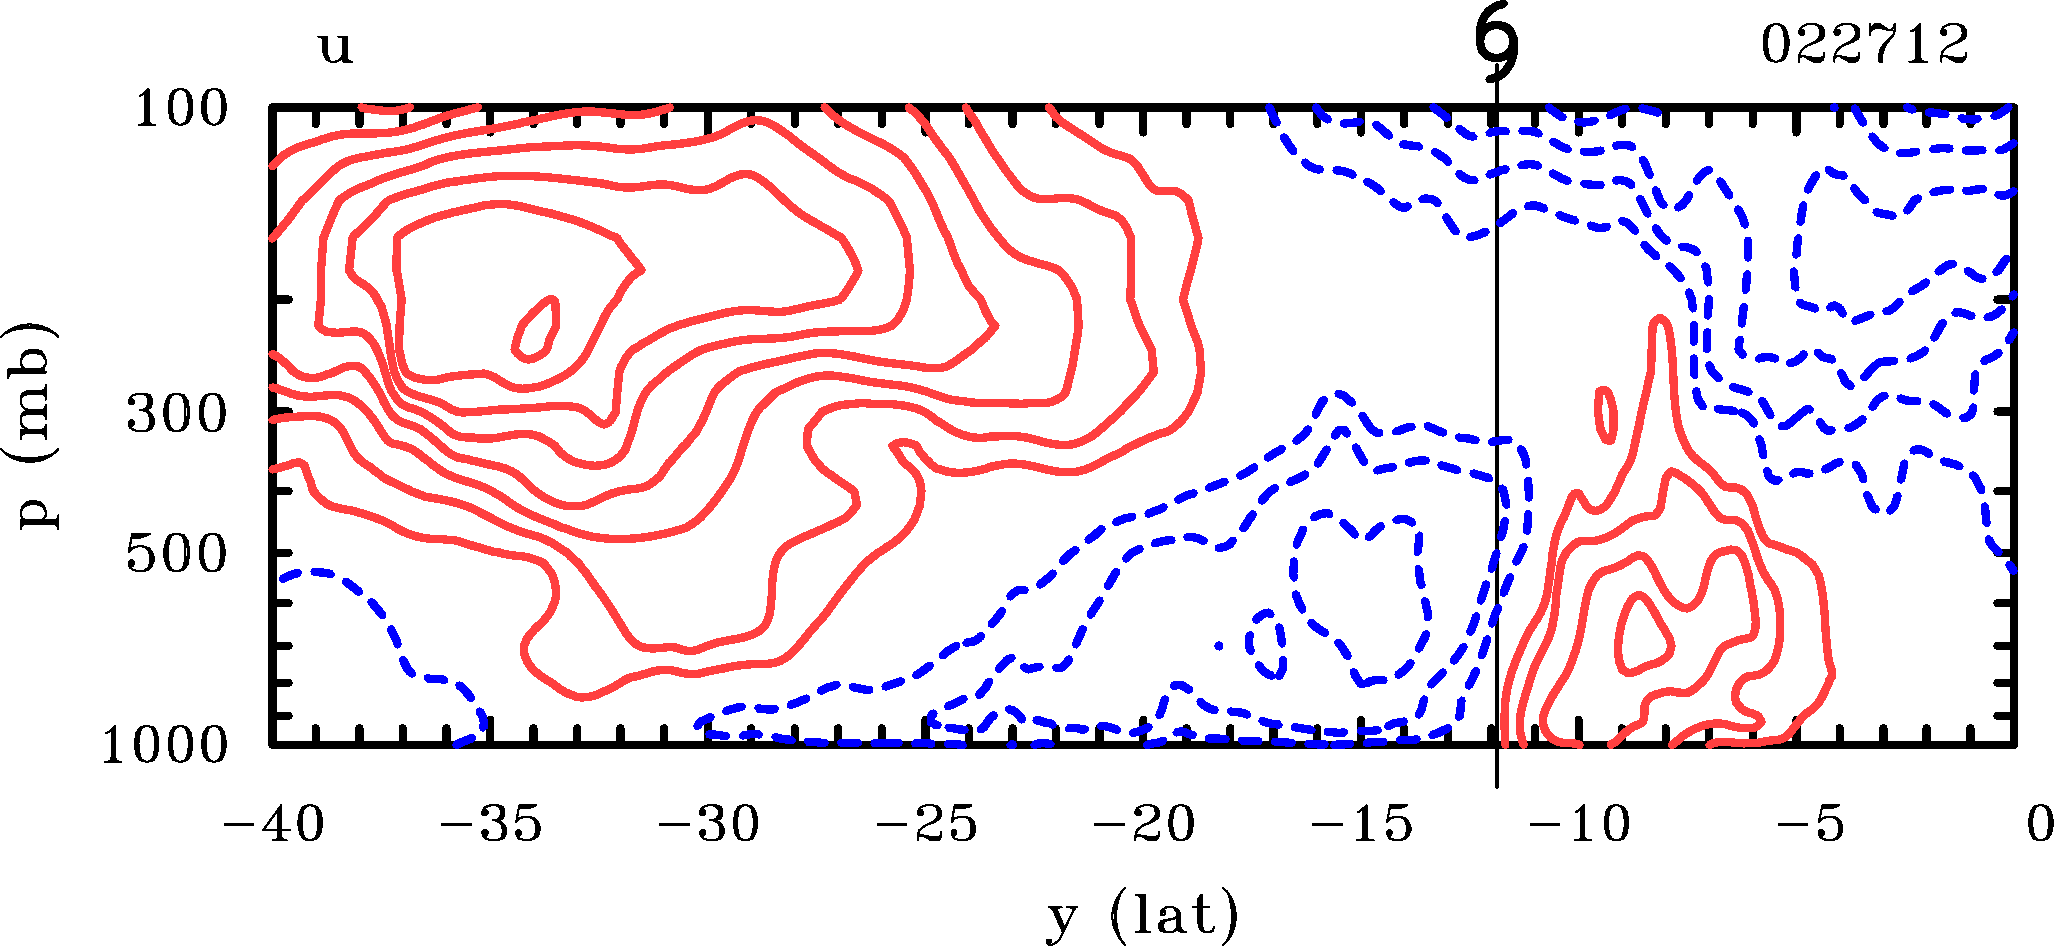
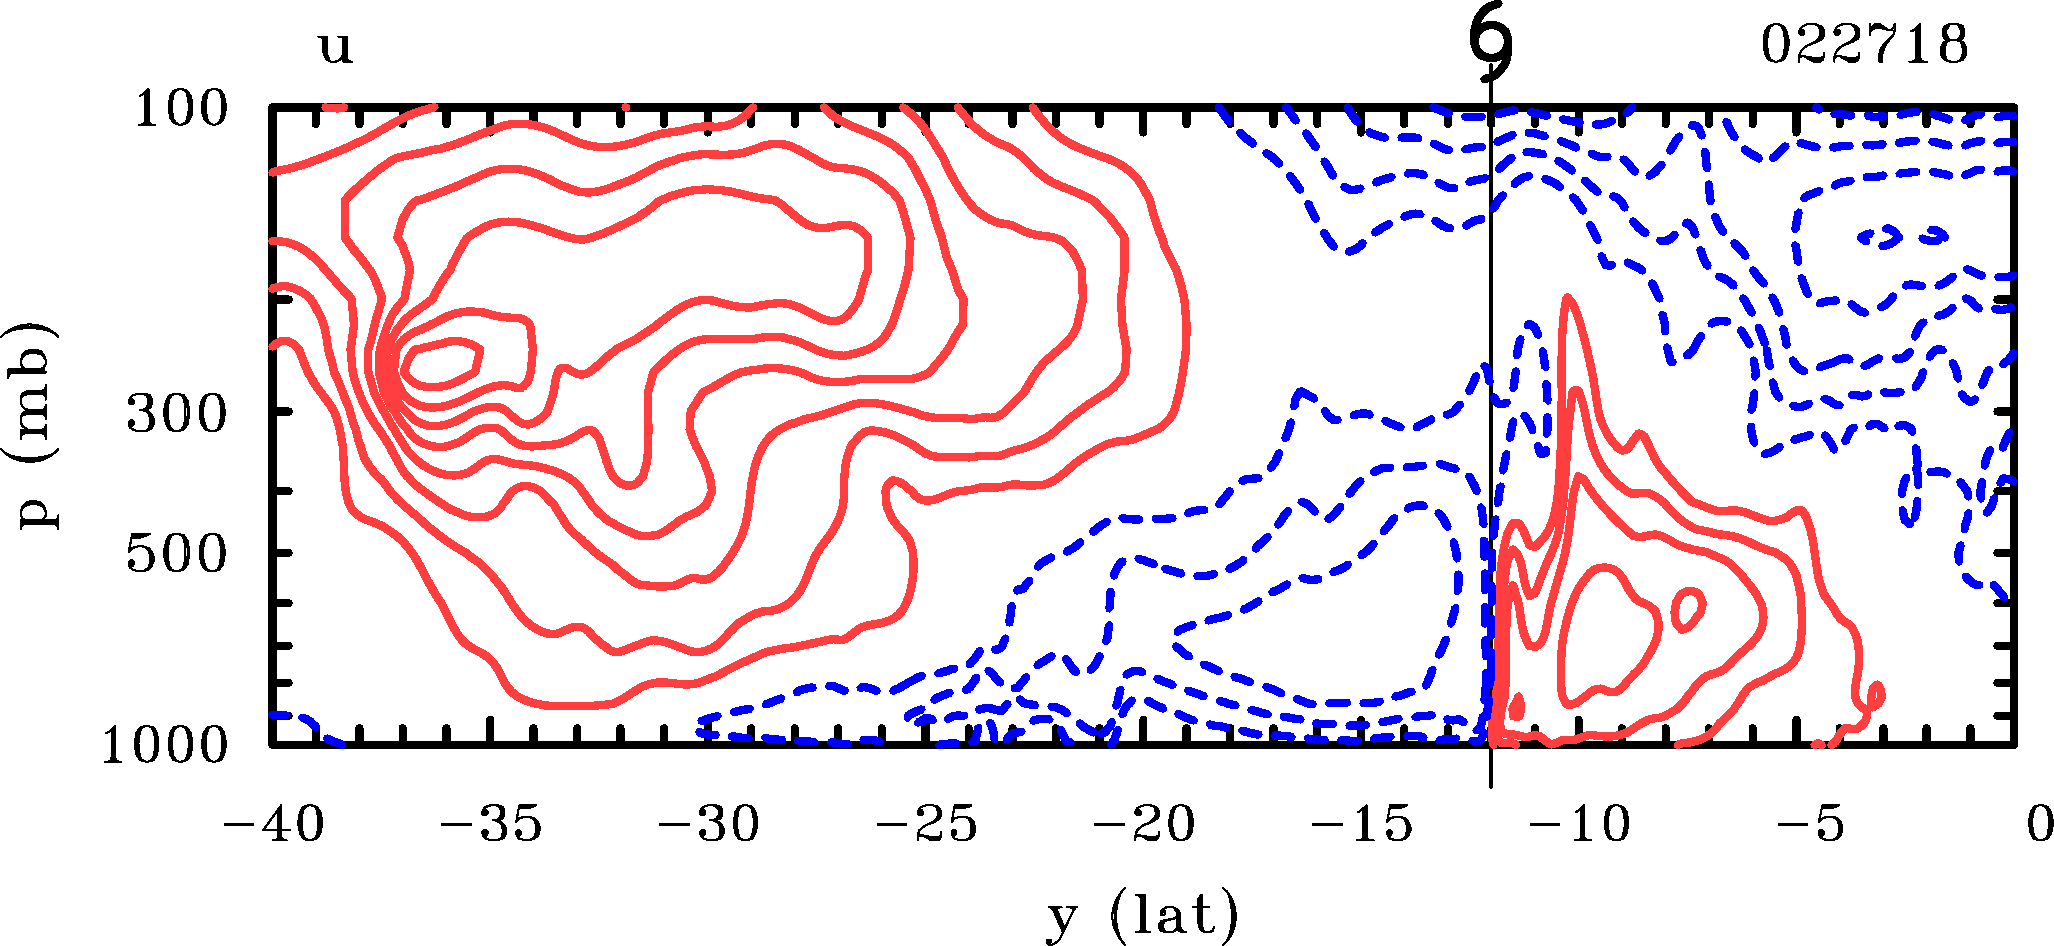
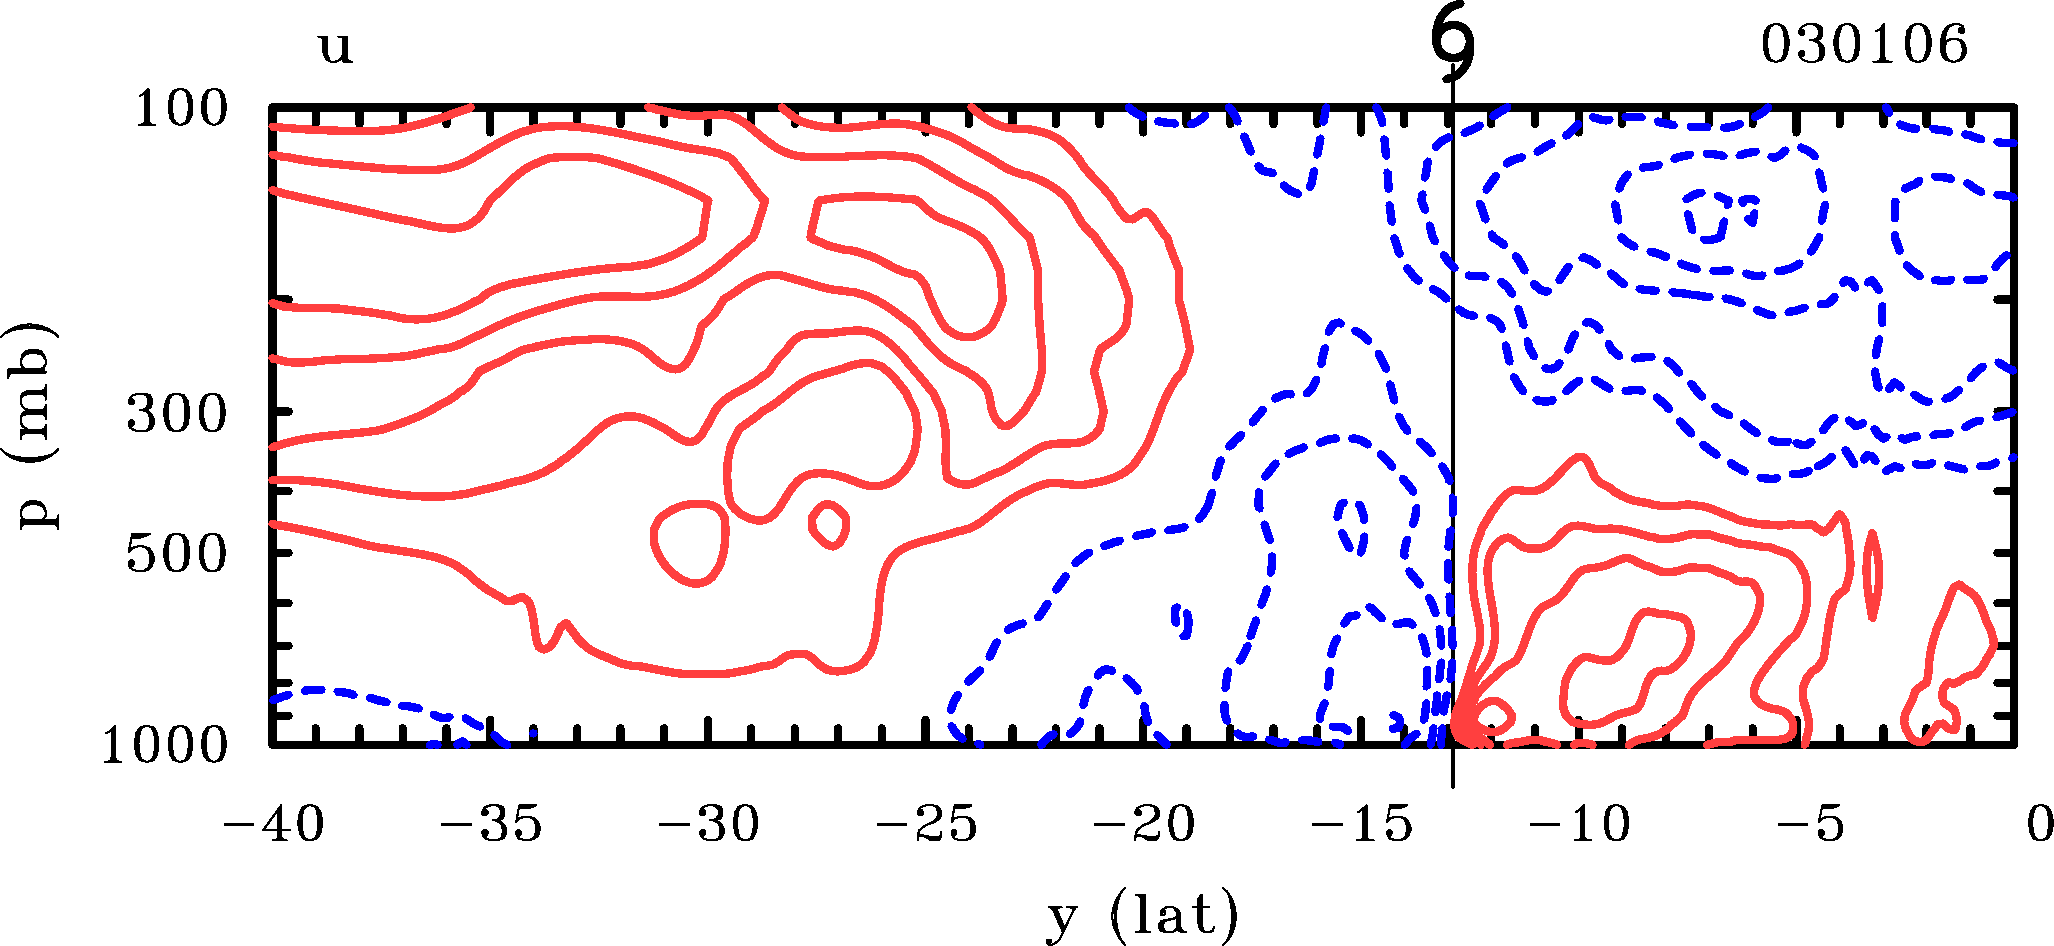
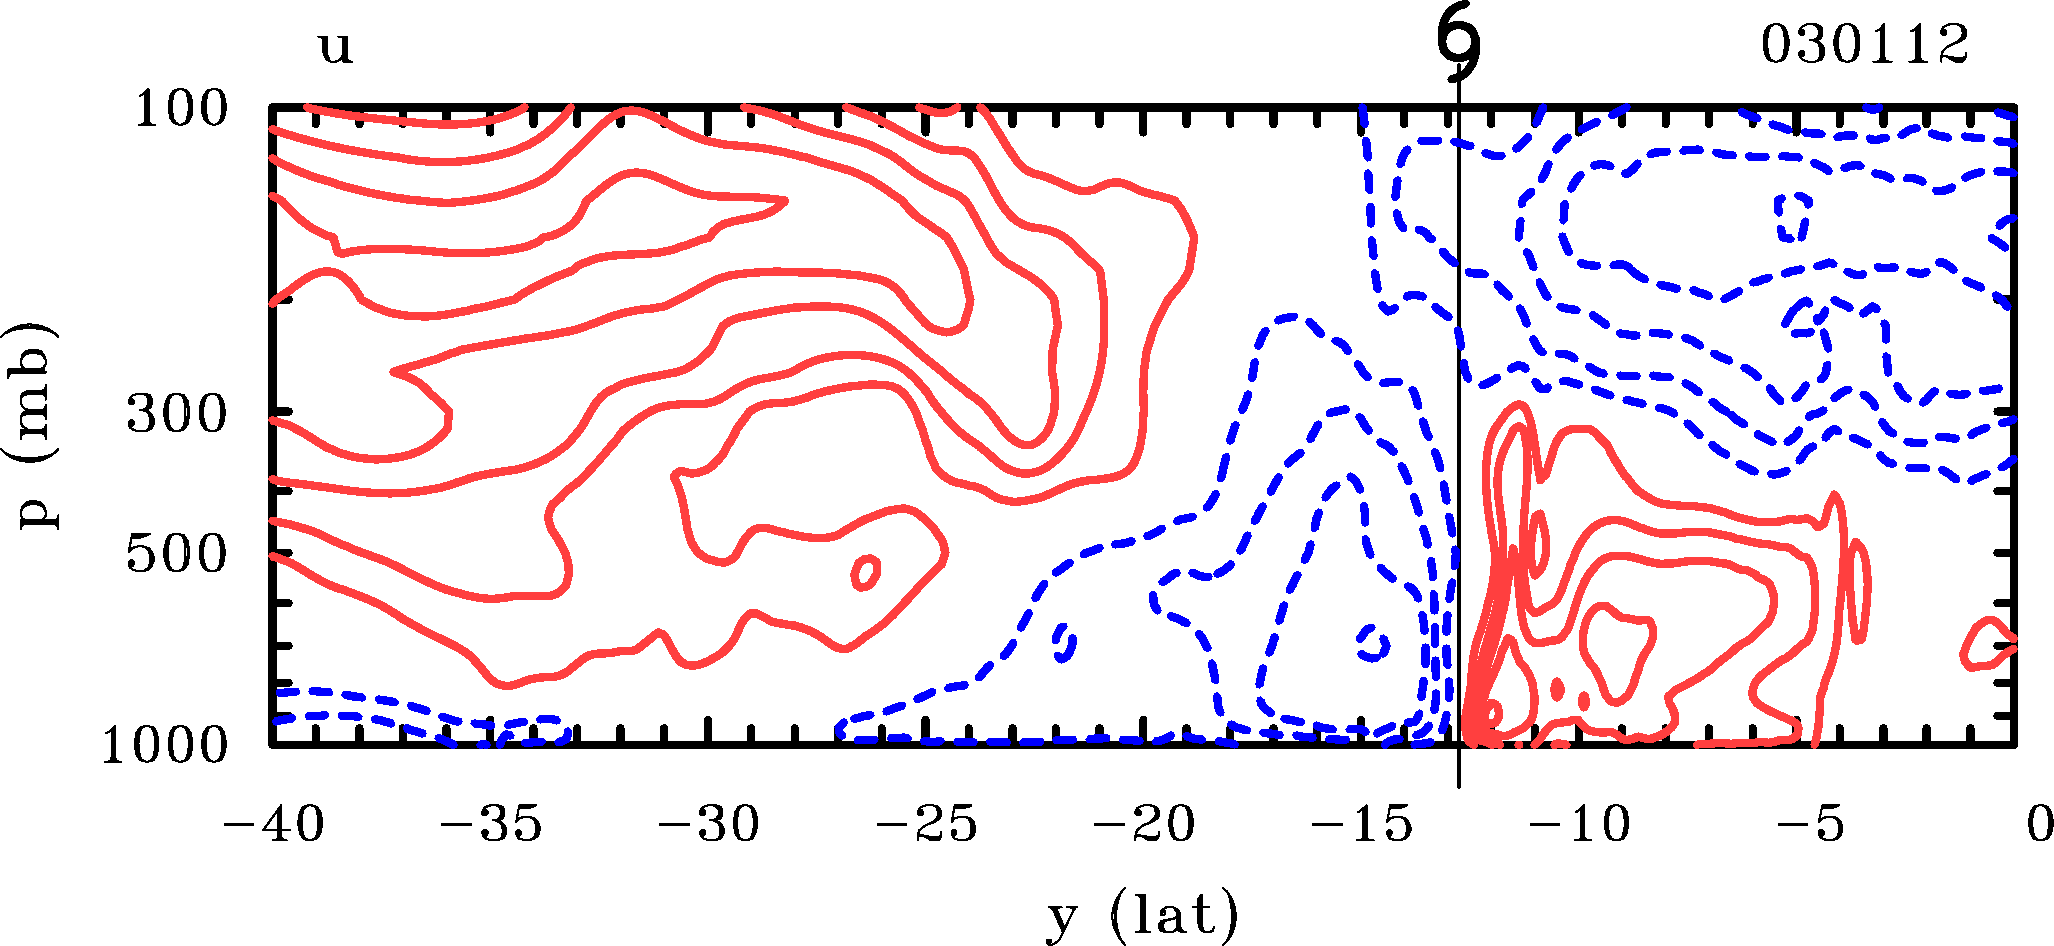
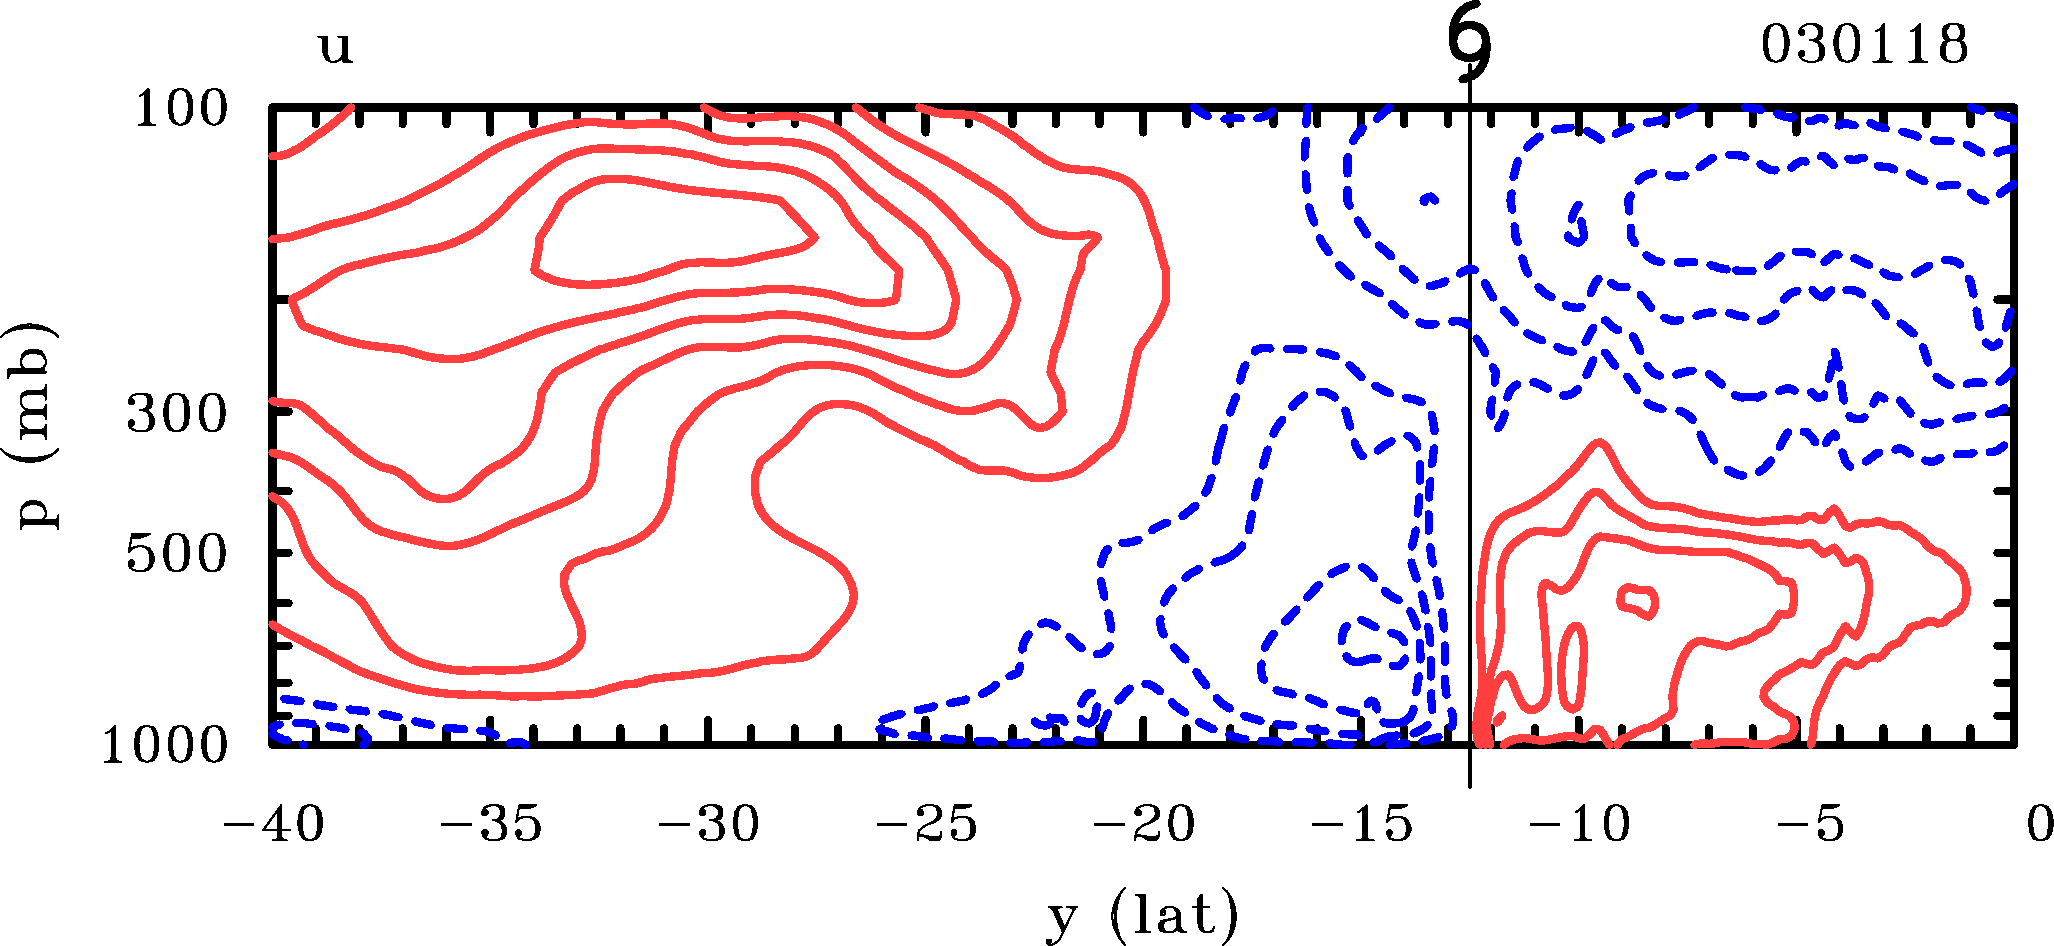
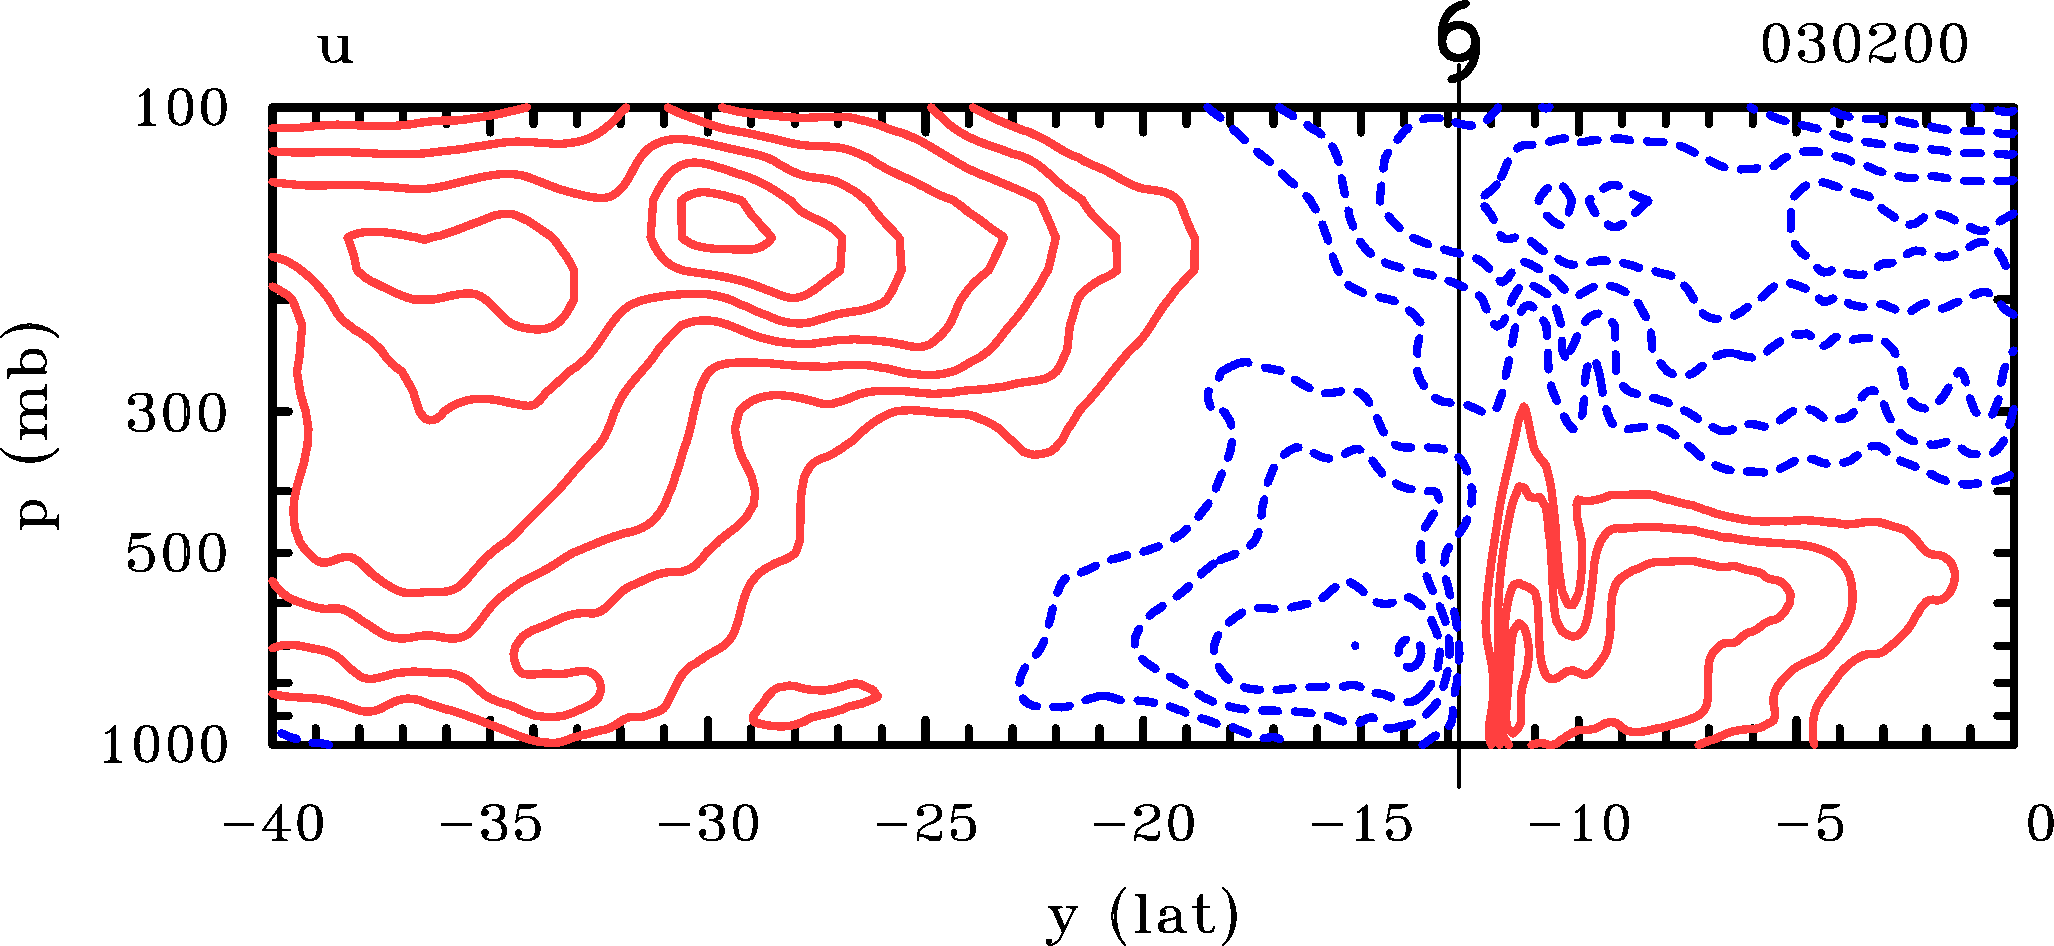
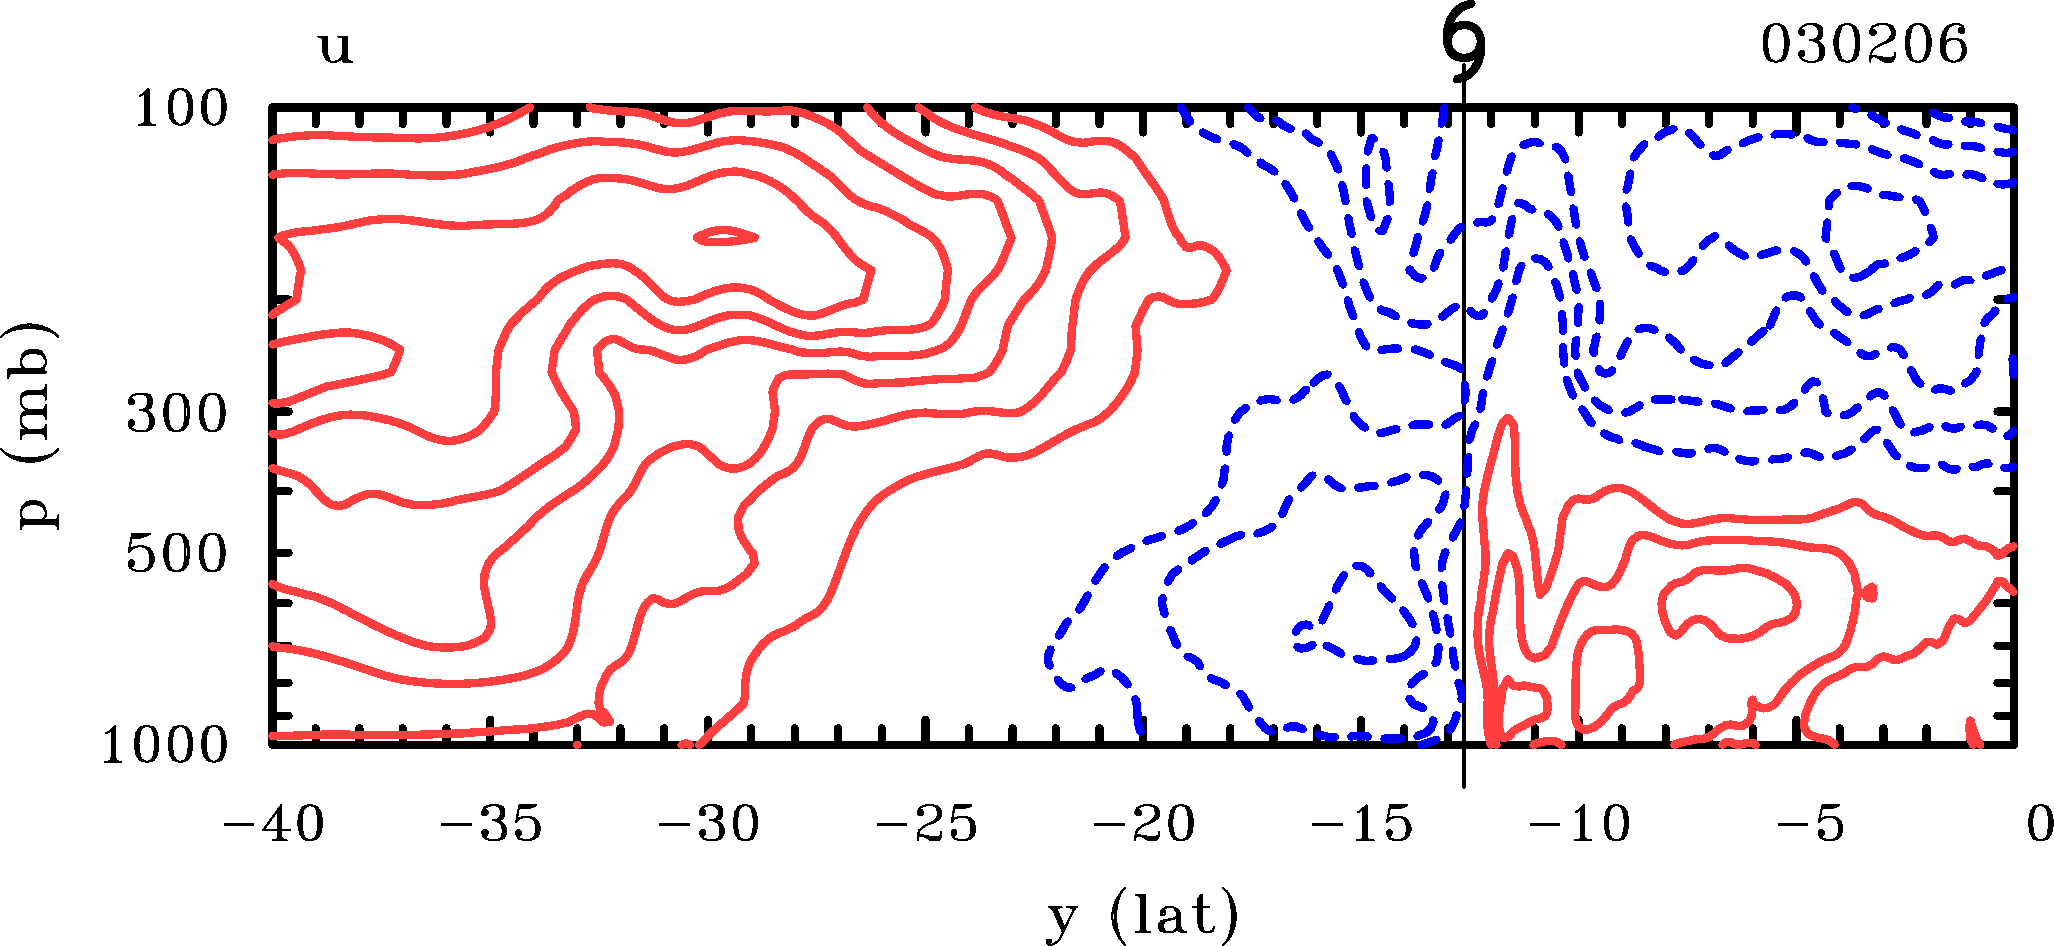
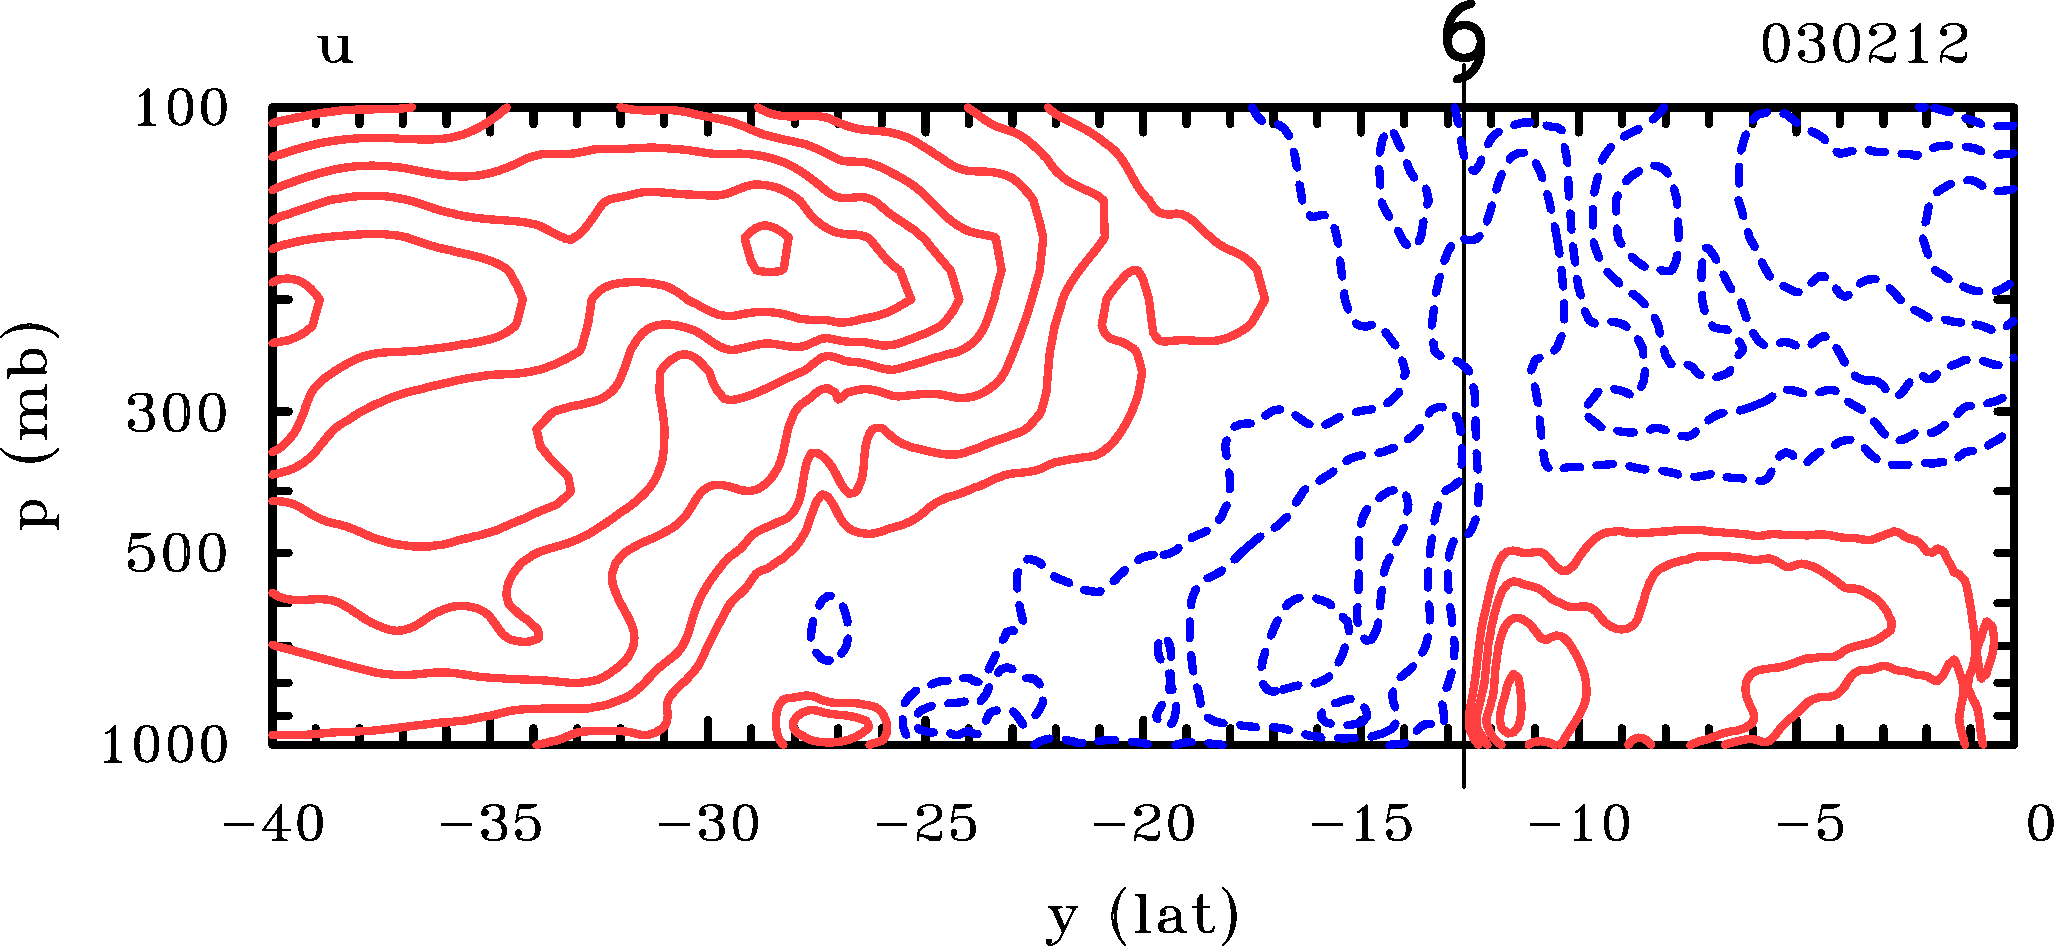
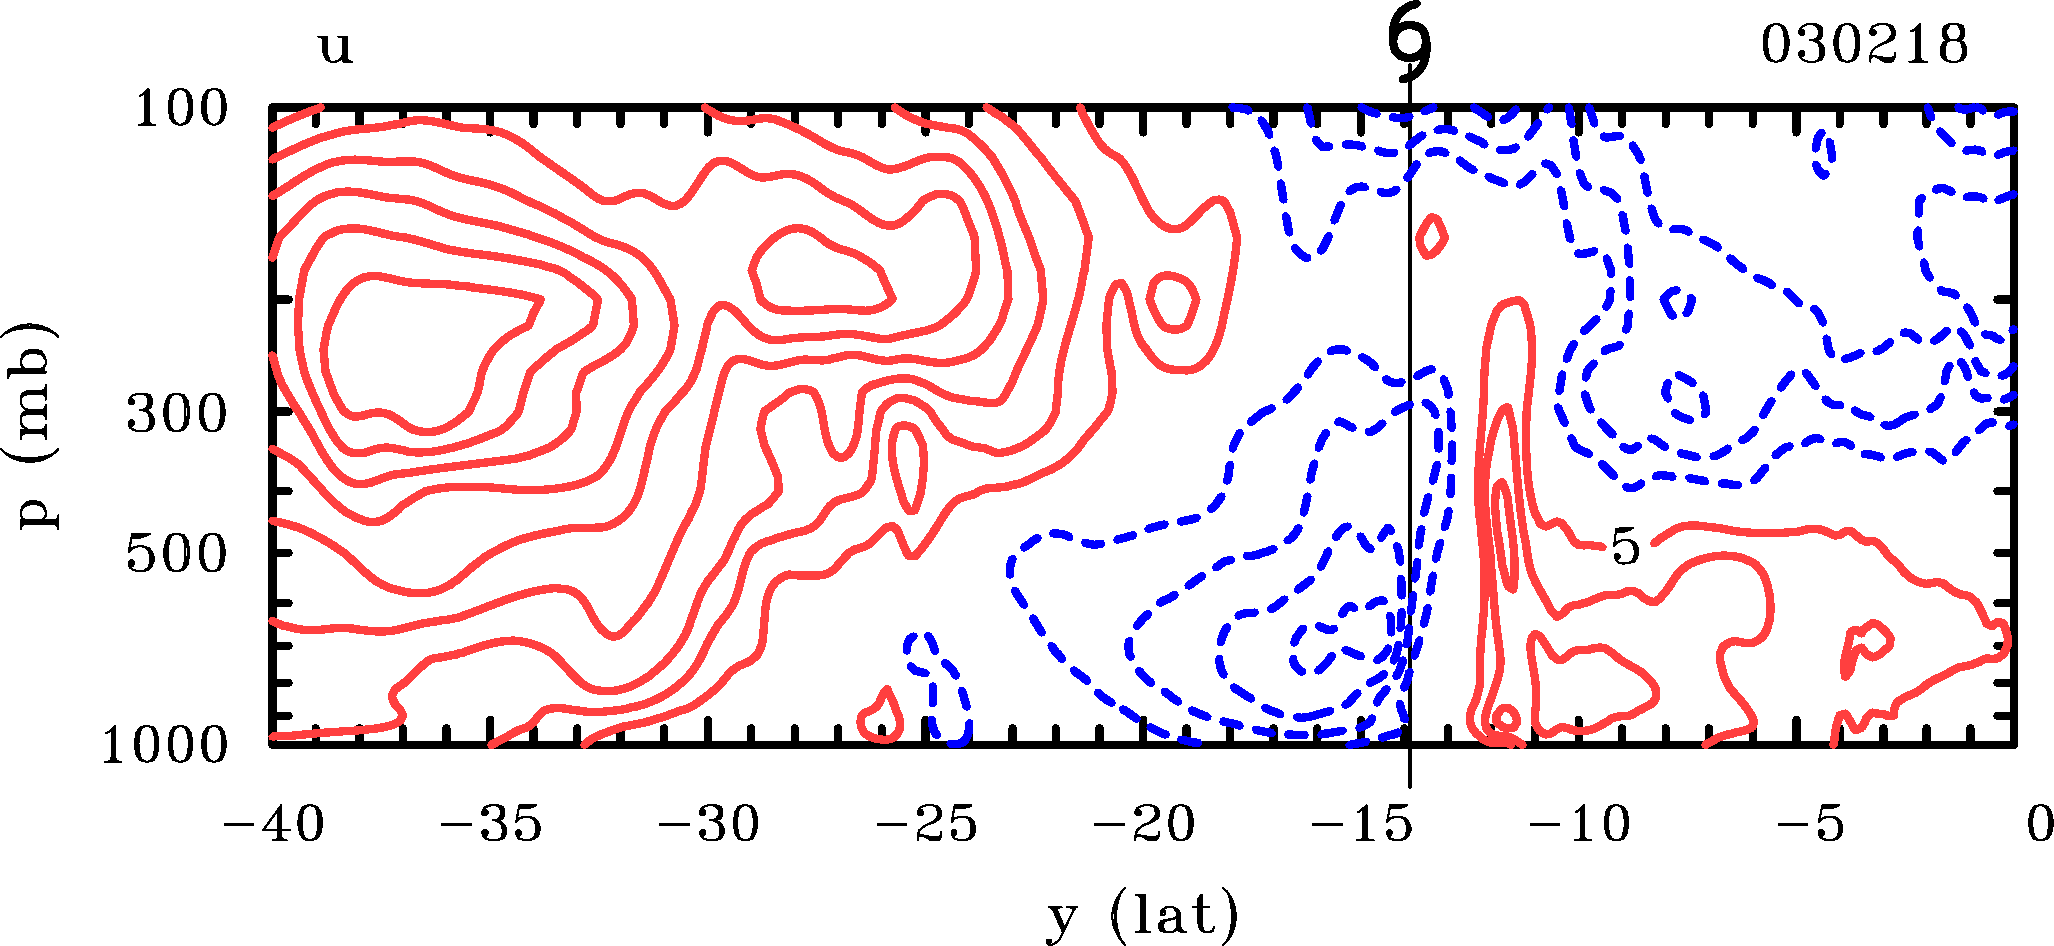
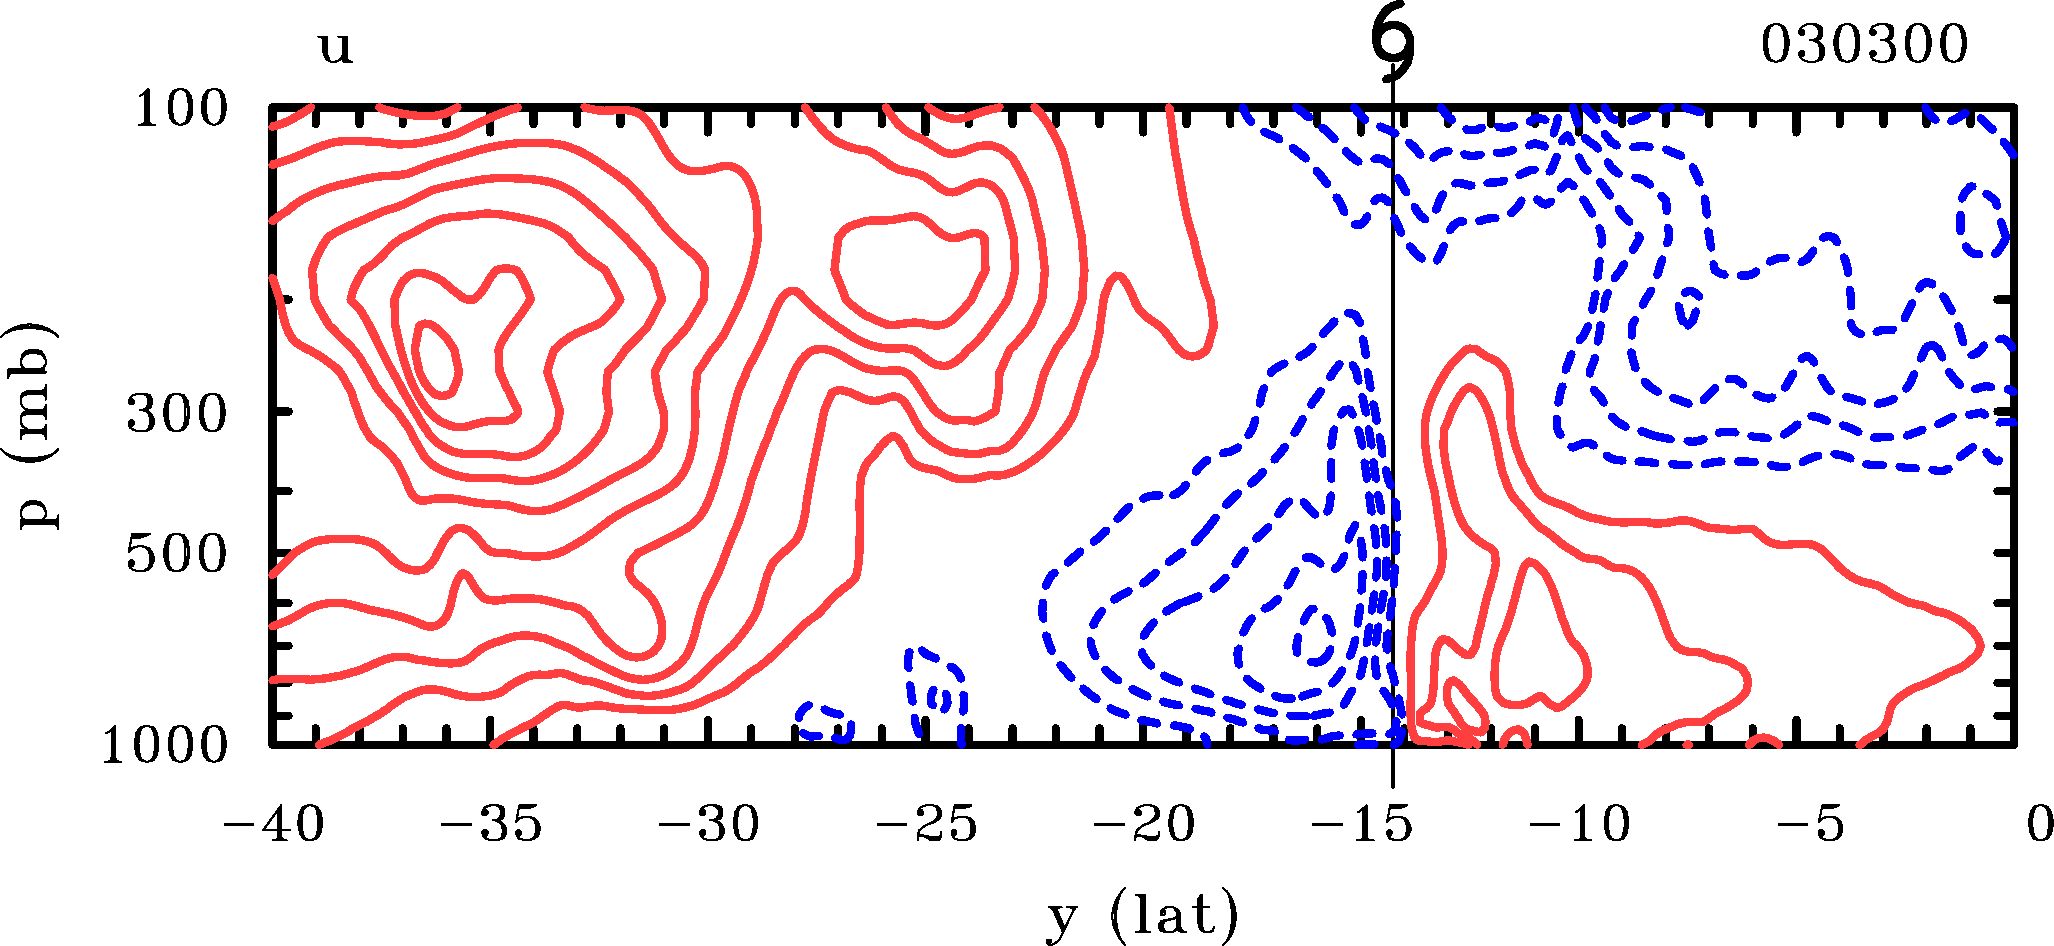
Genesis of TC George February 2007
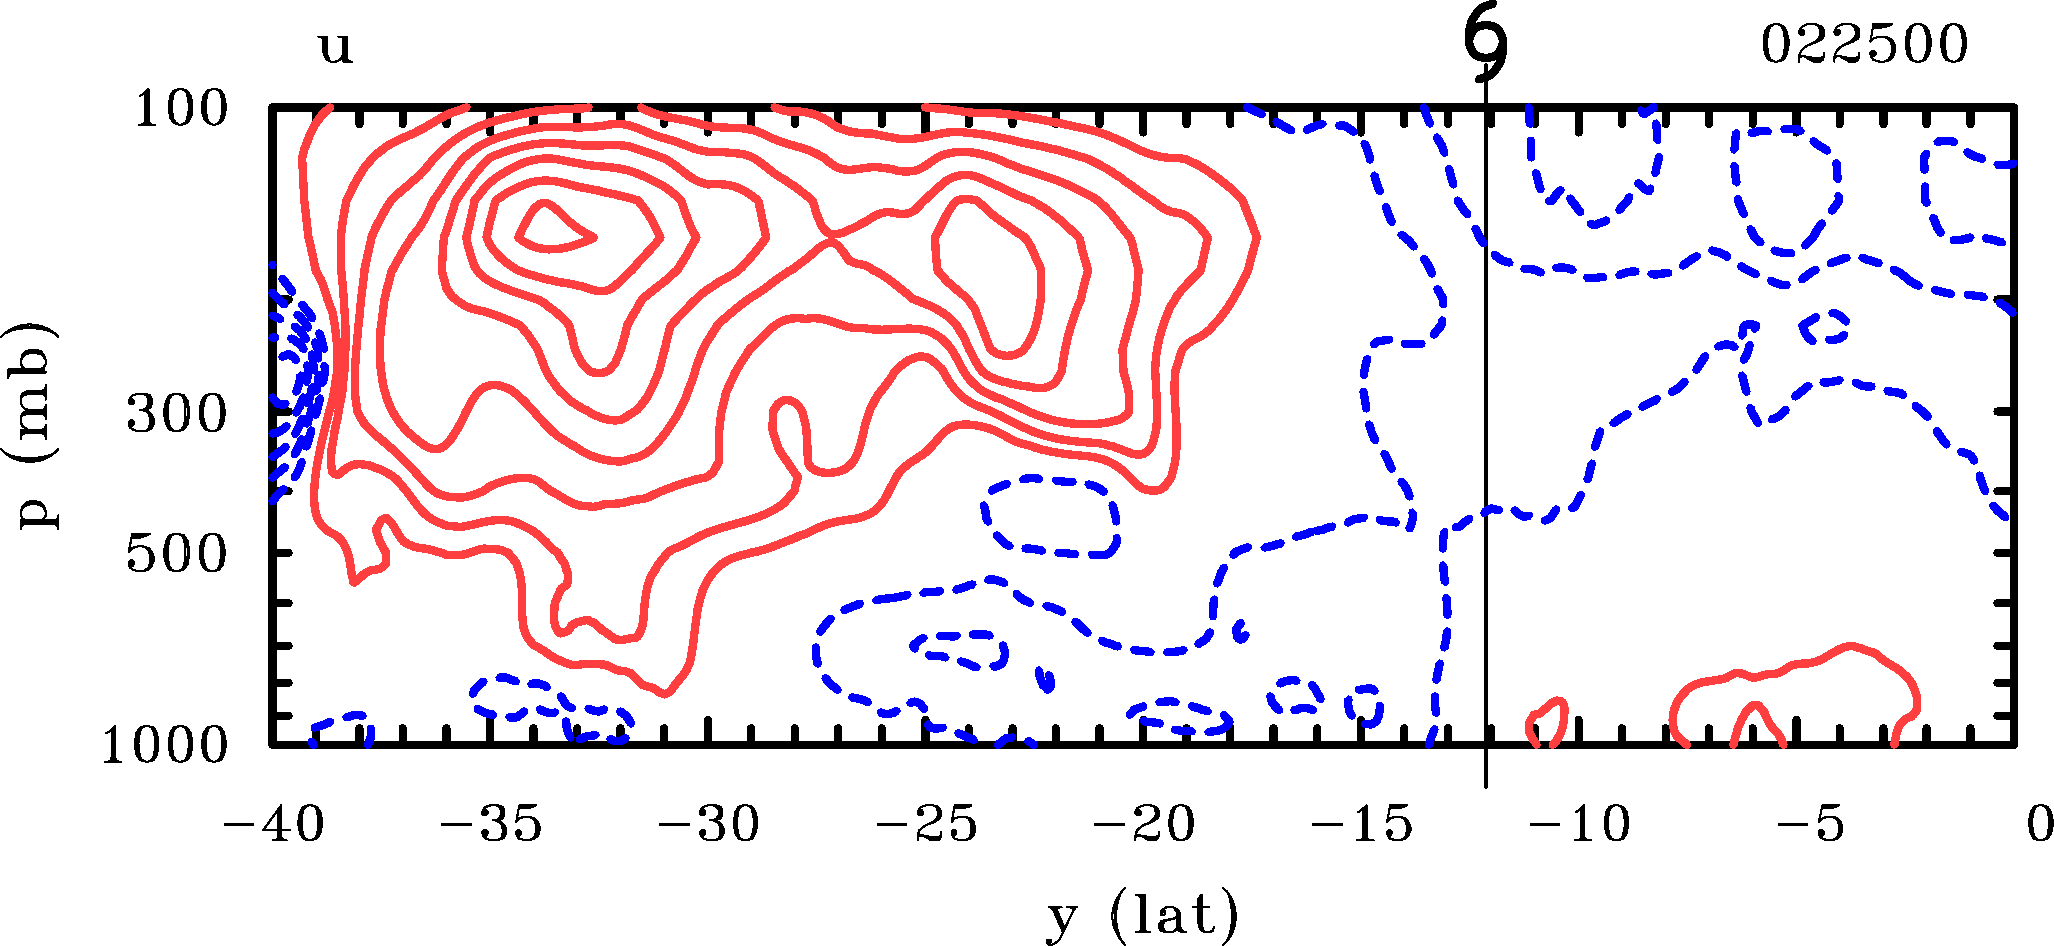
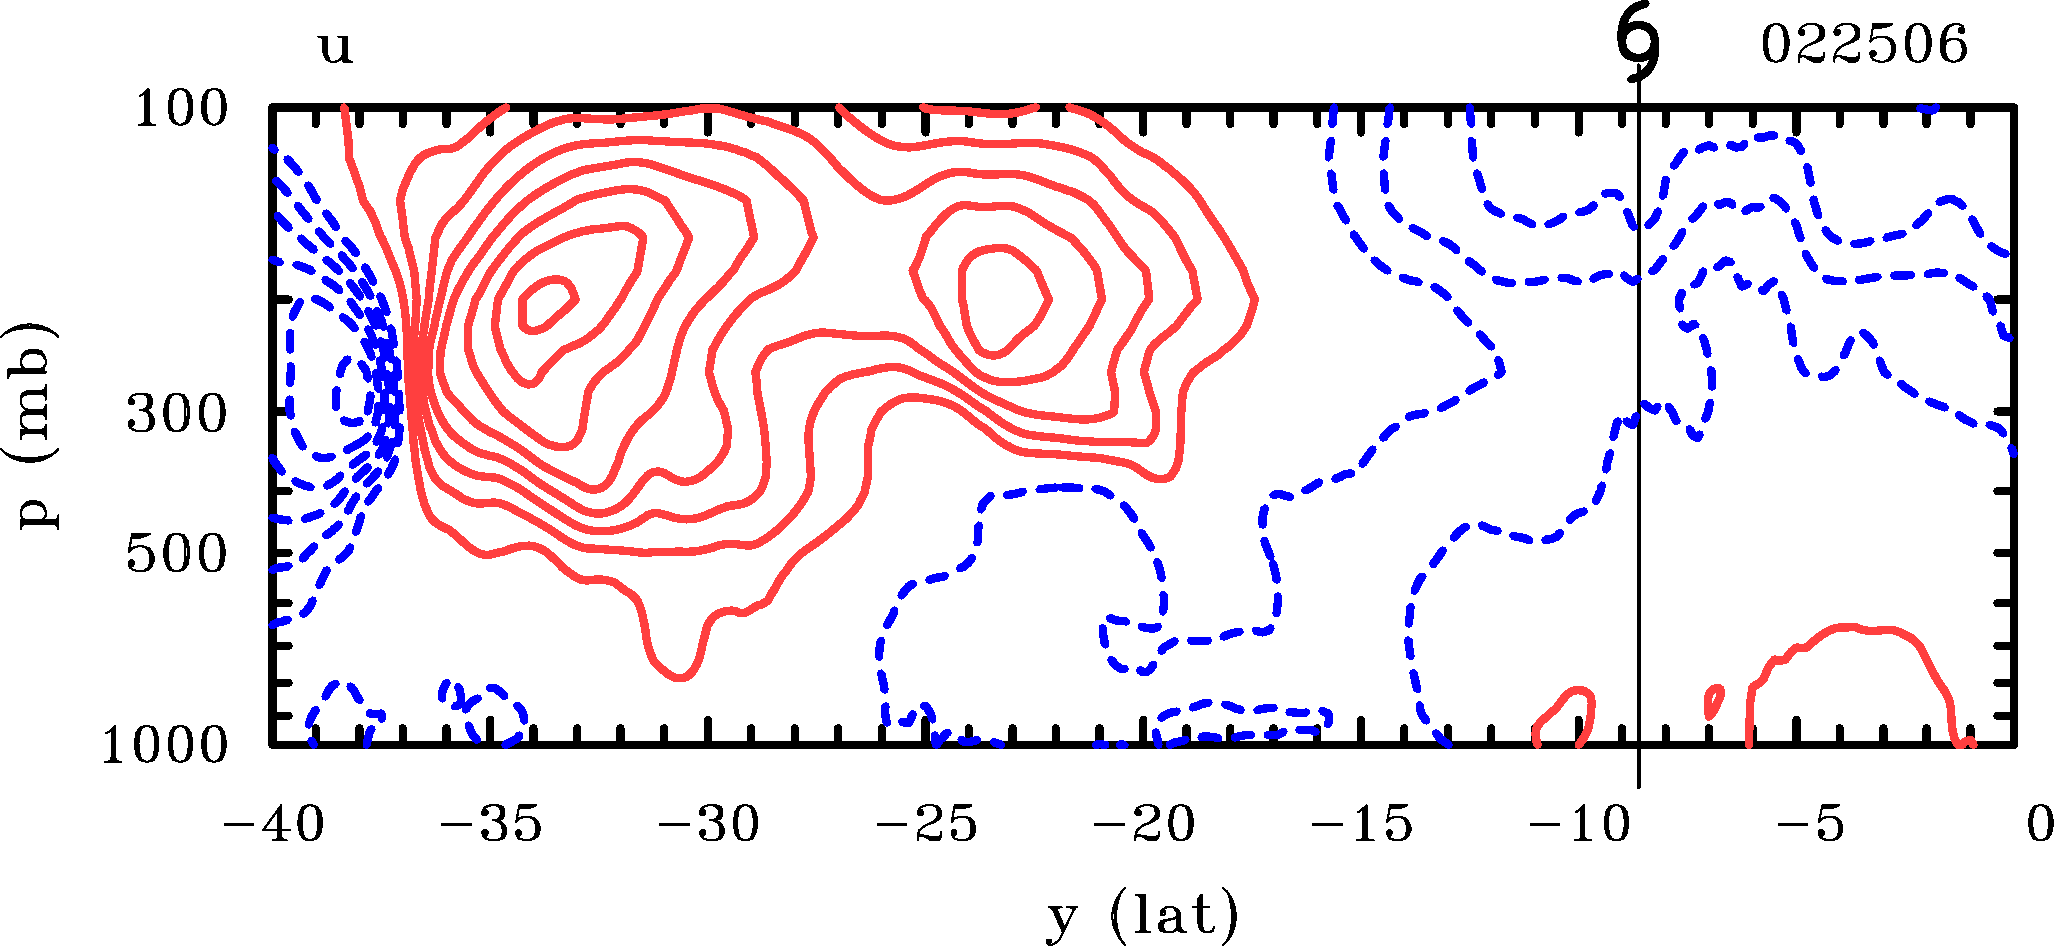
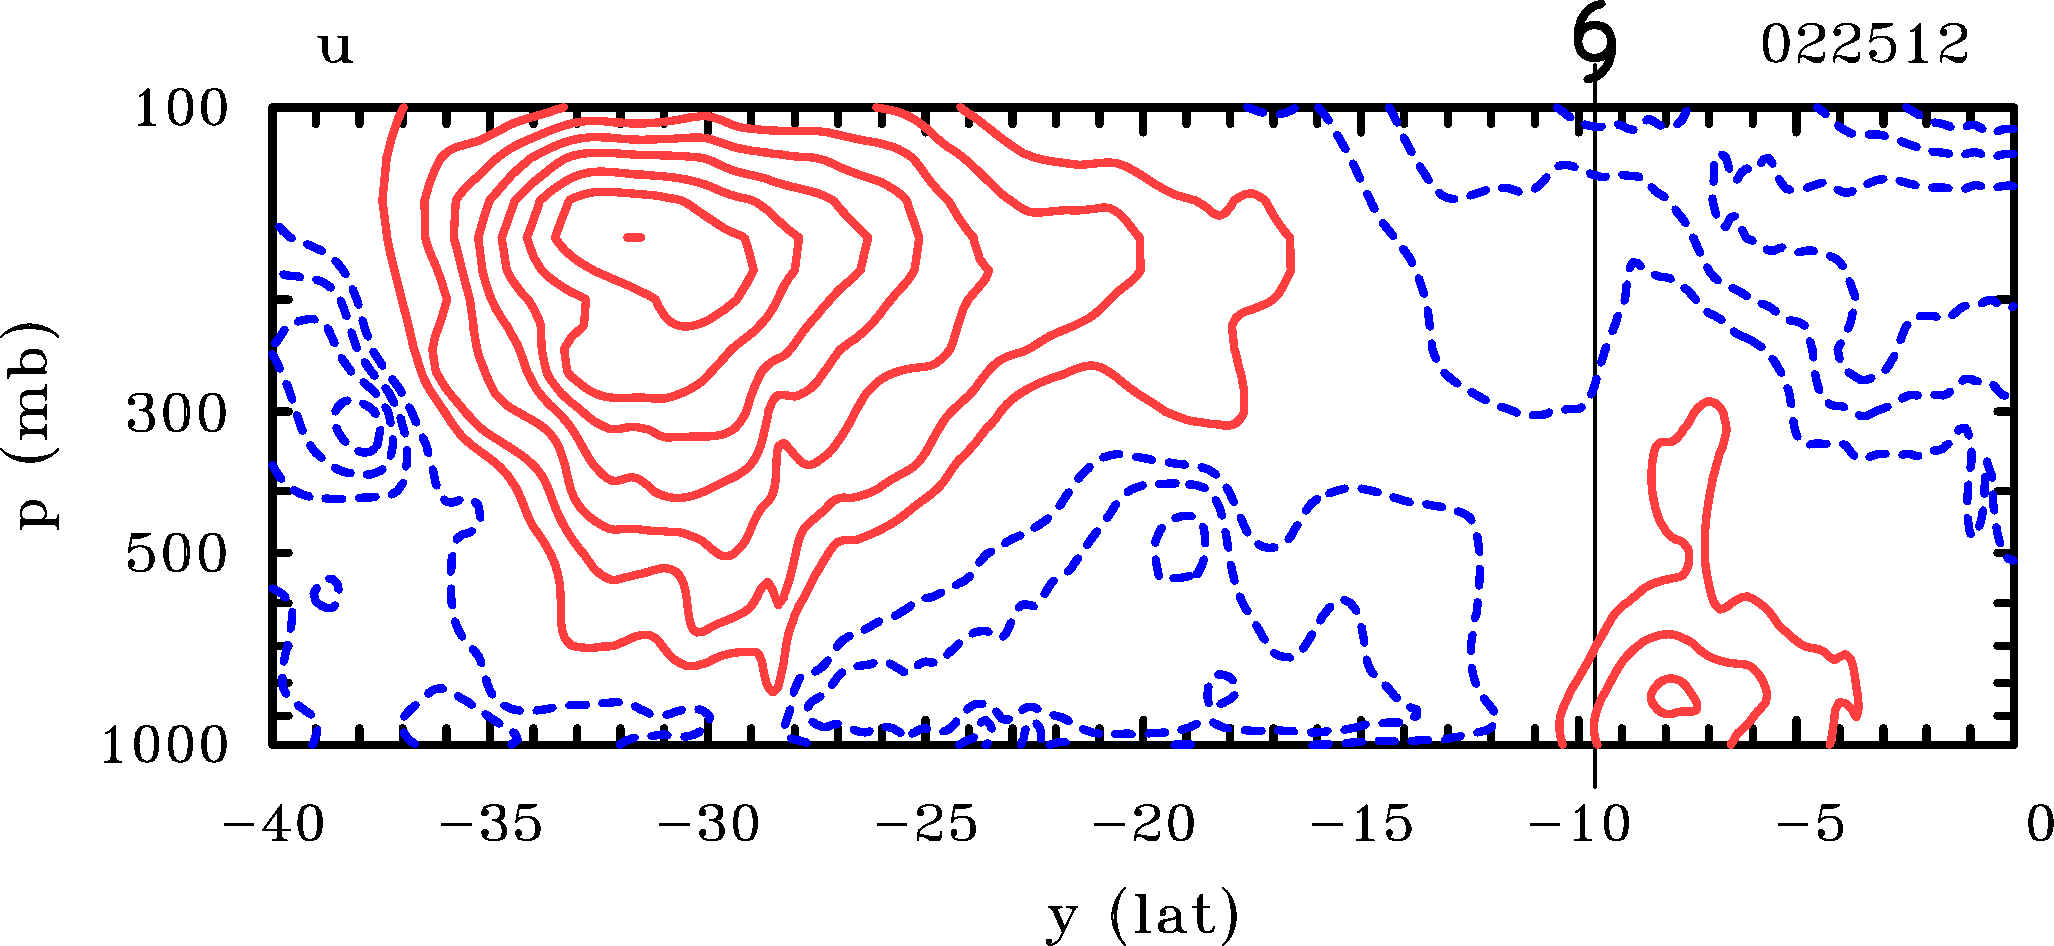
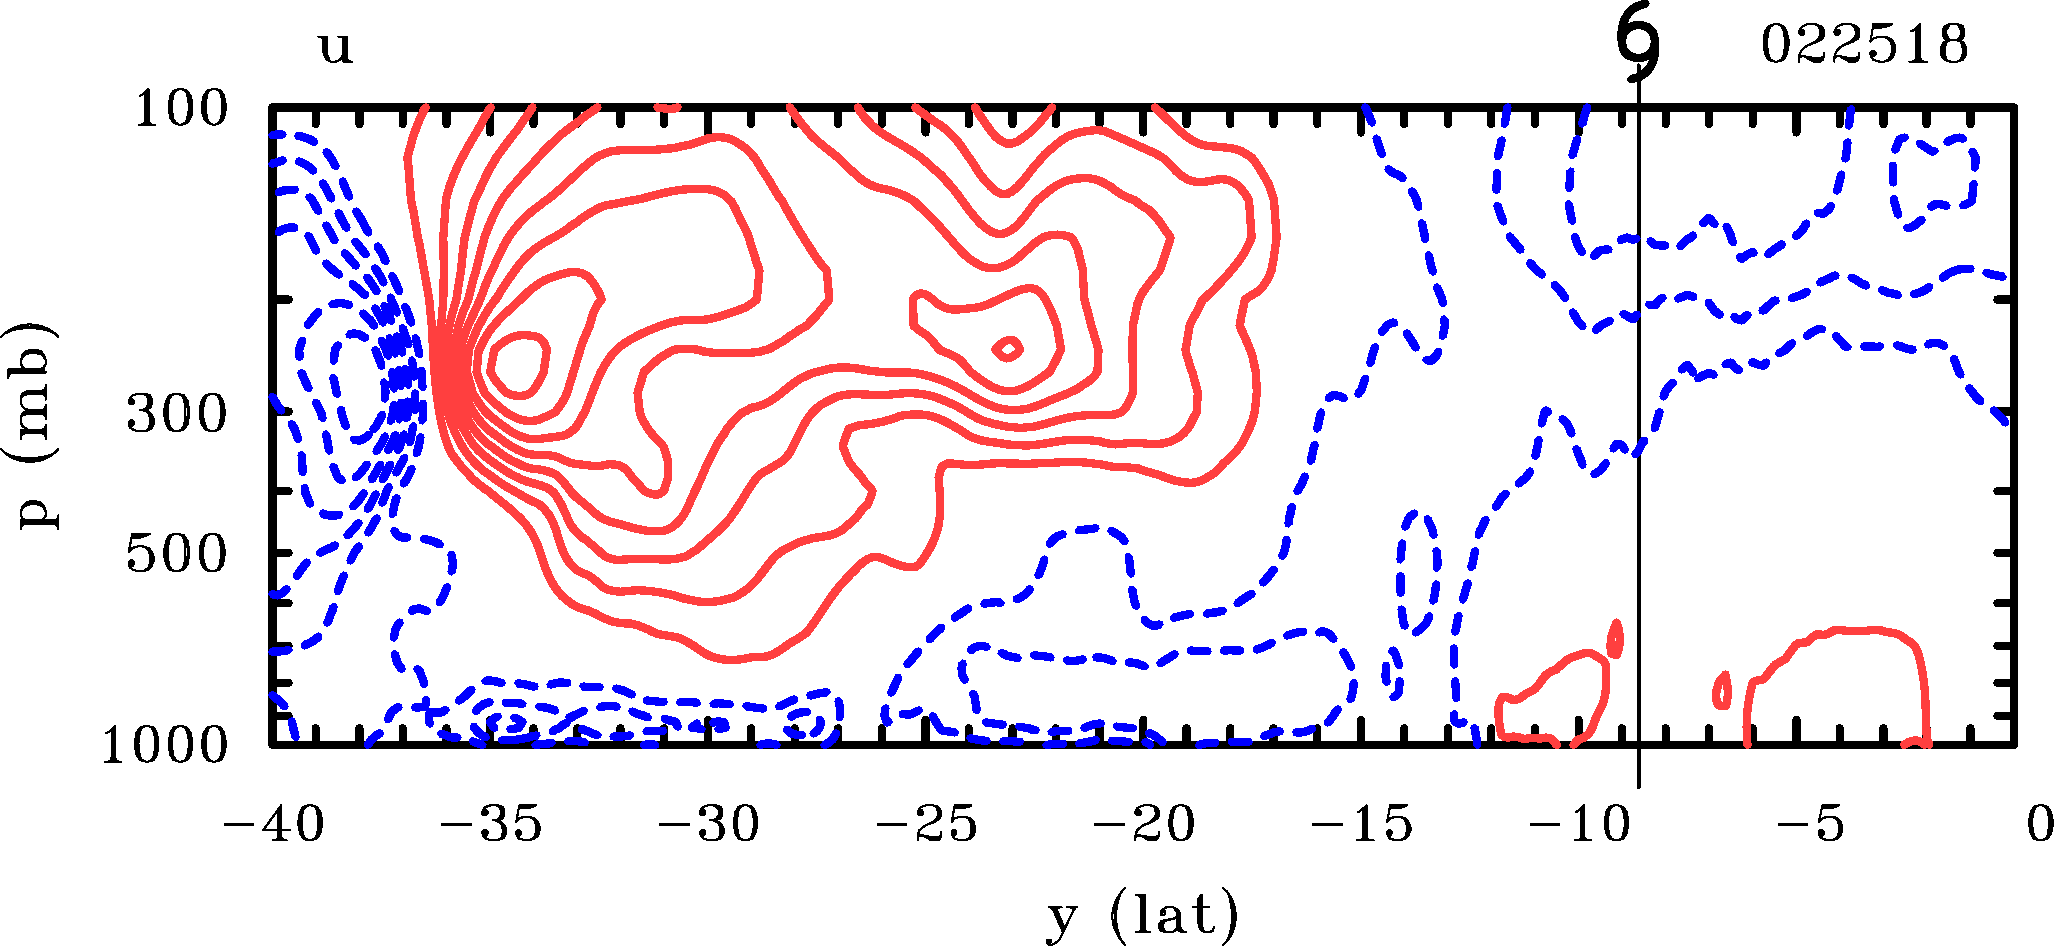
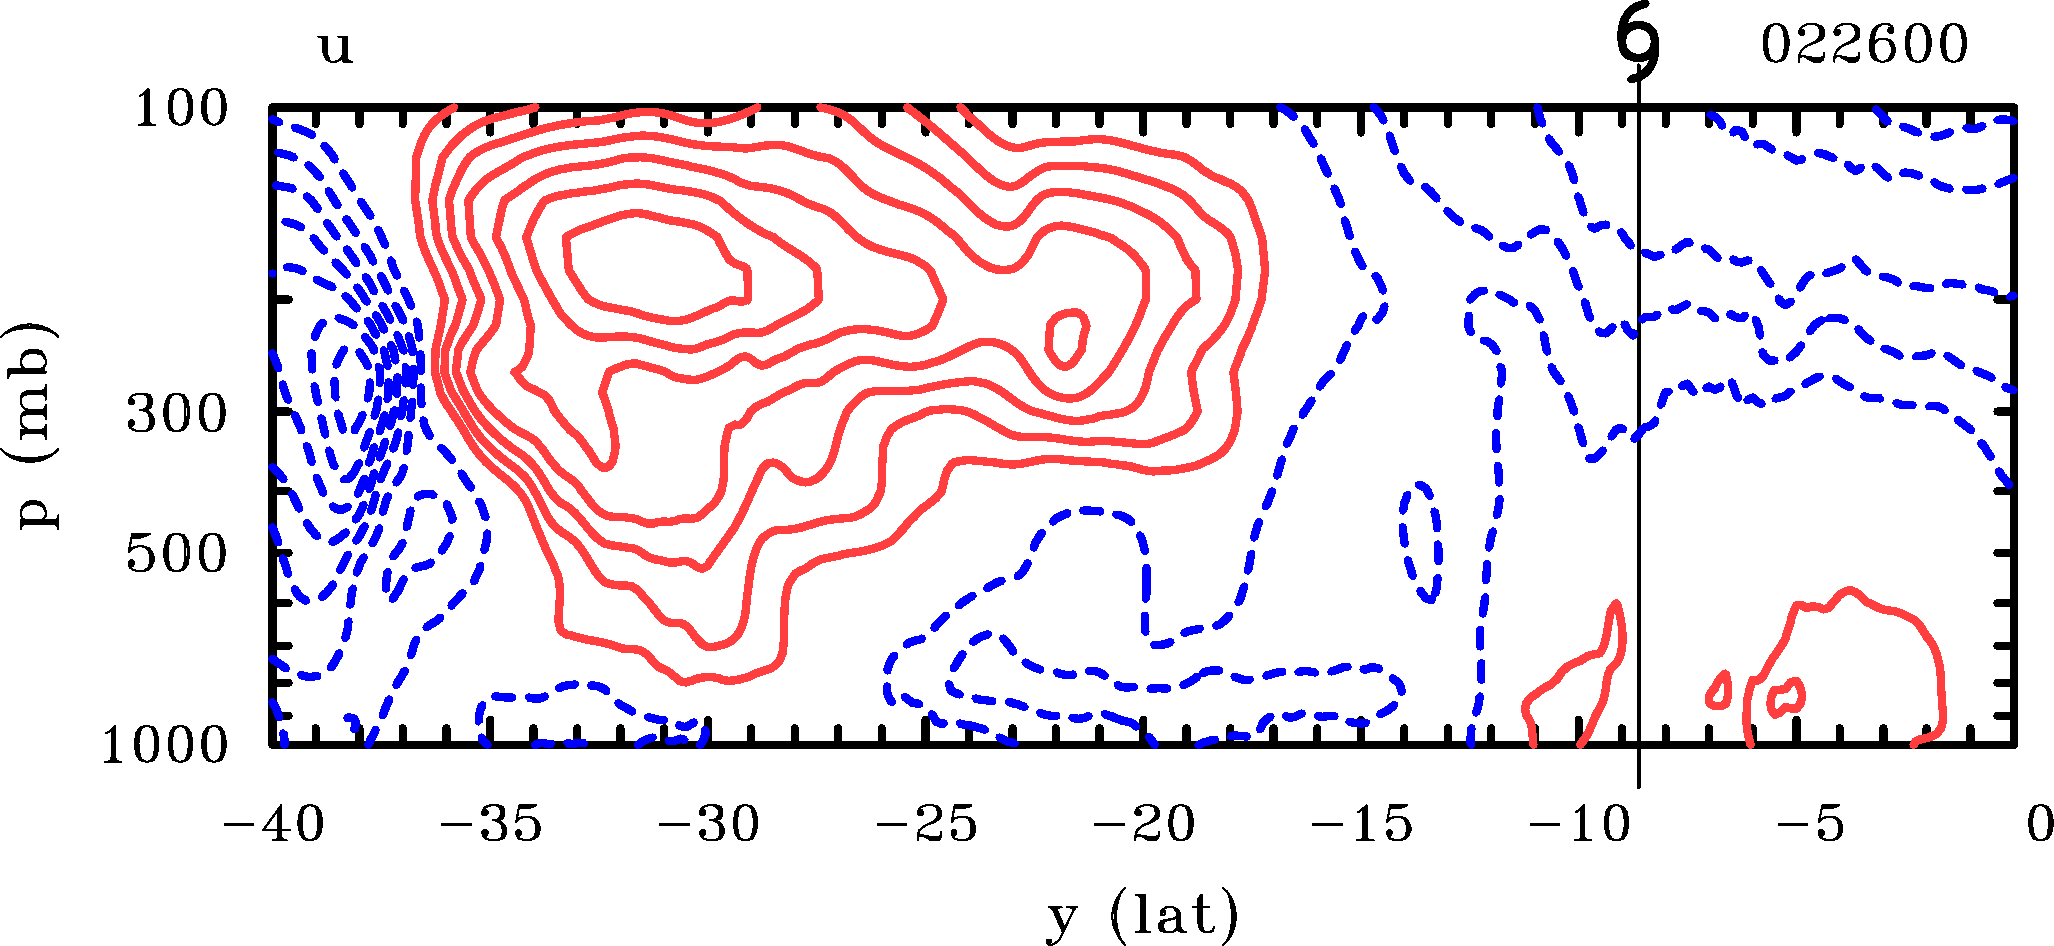
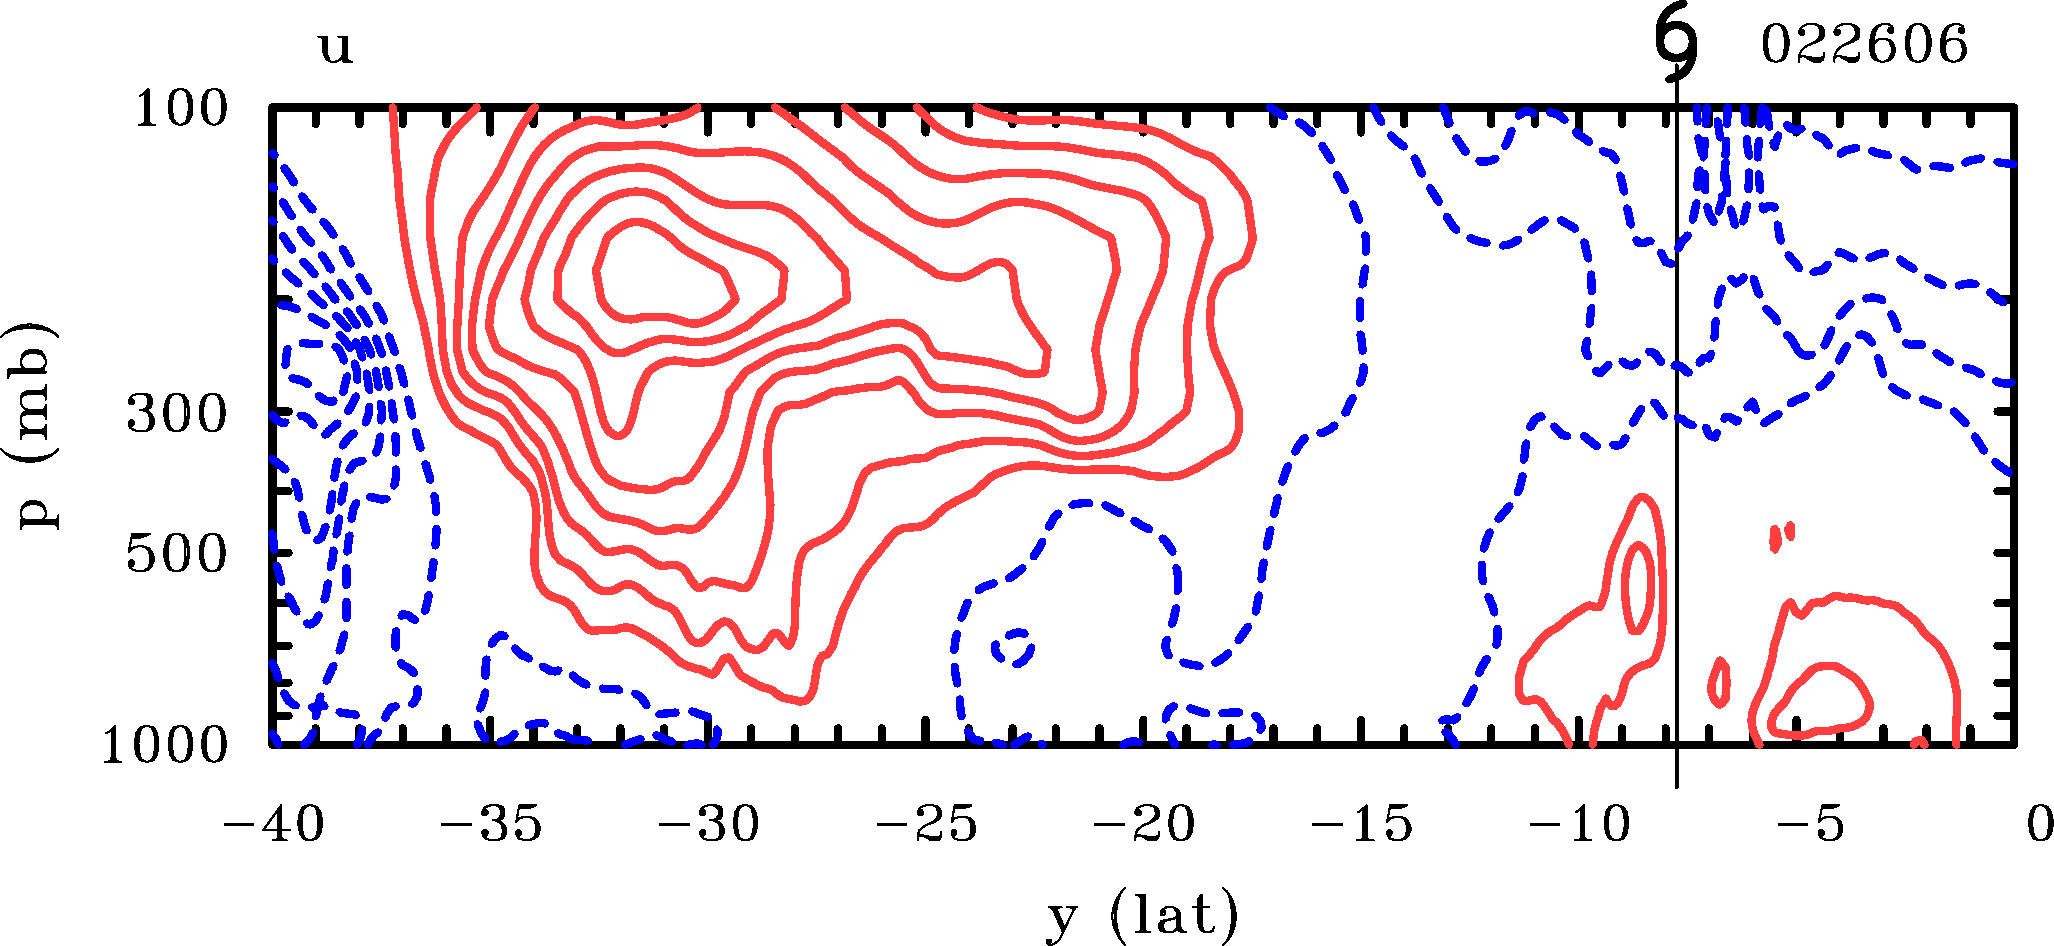
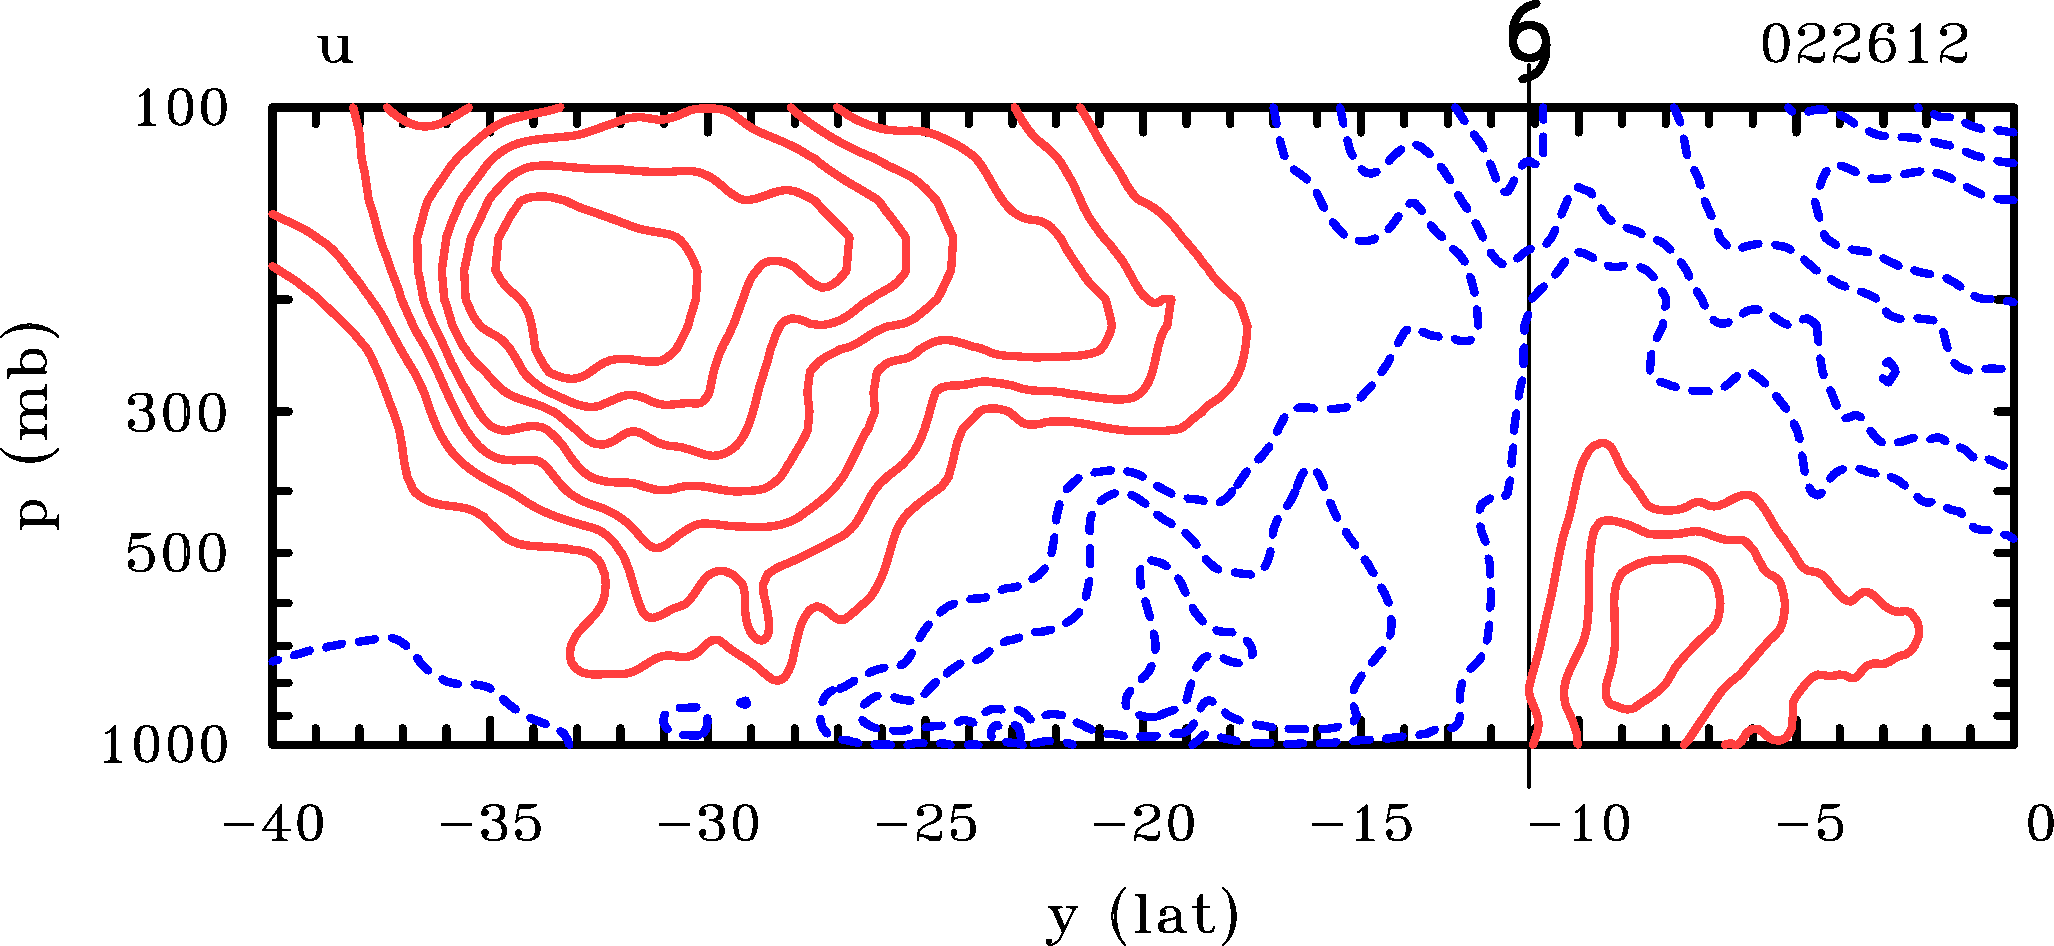
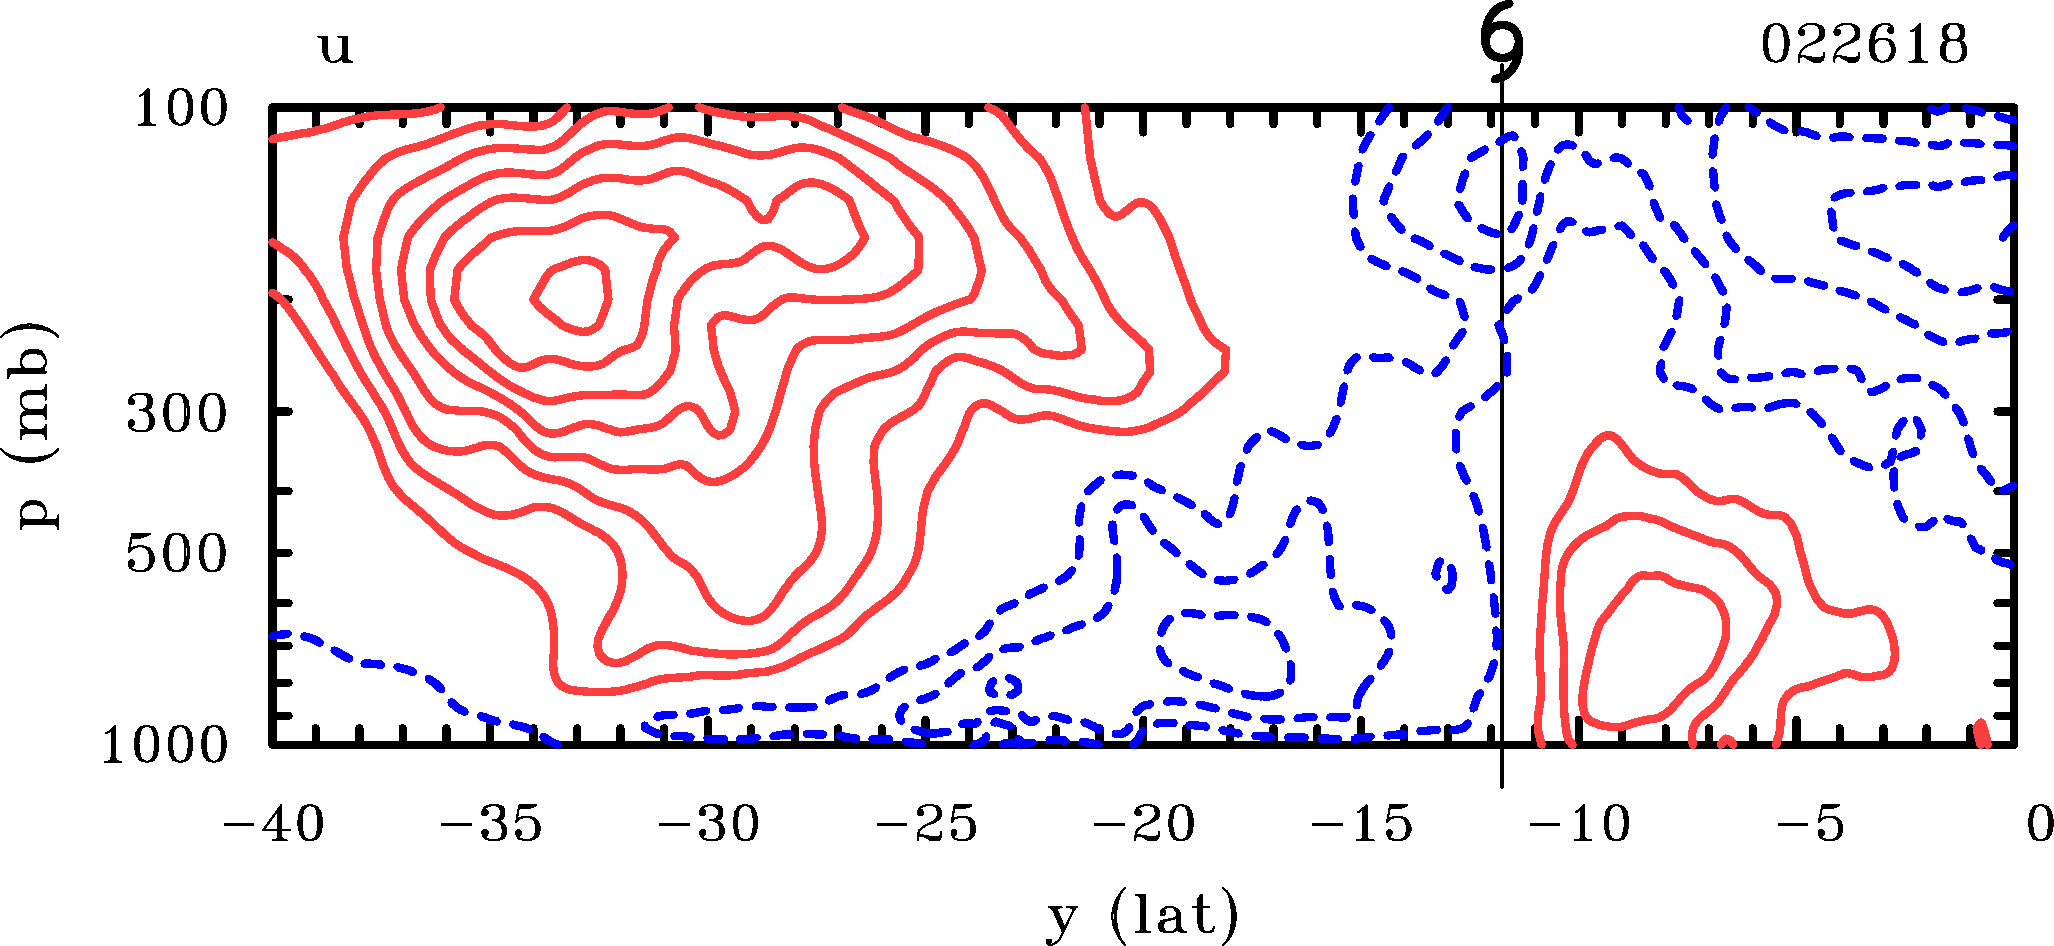
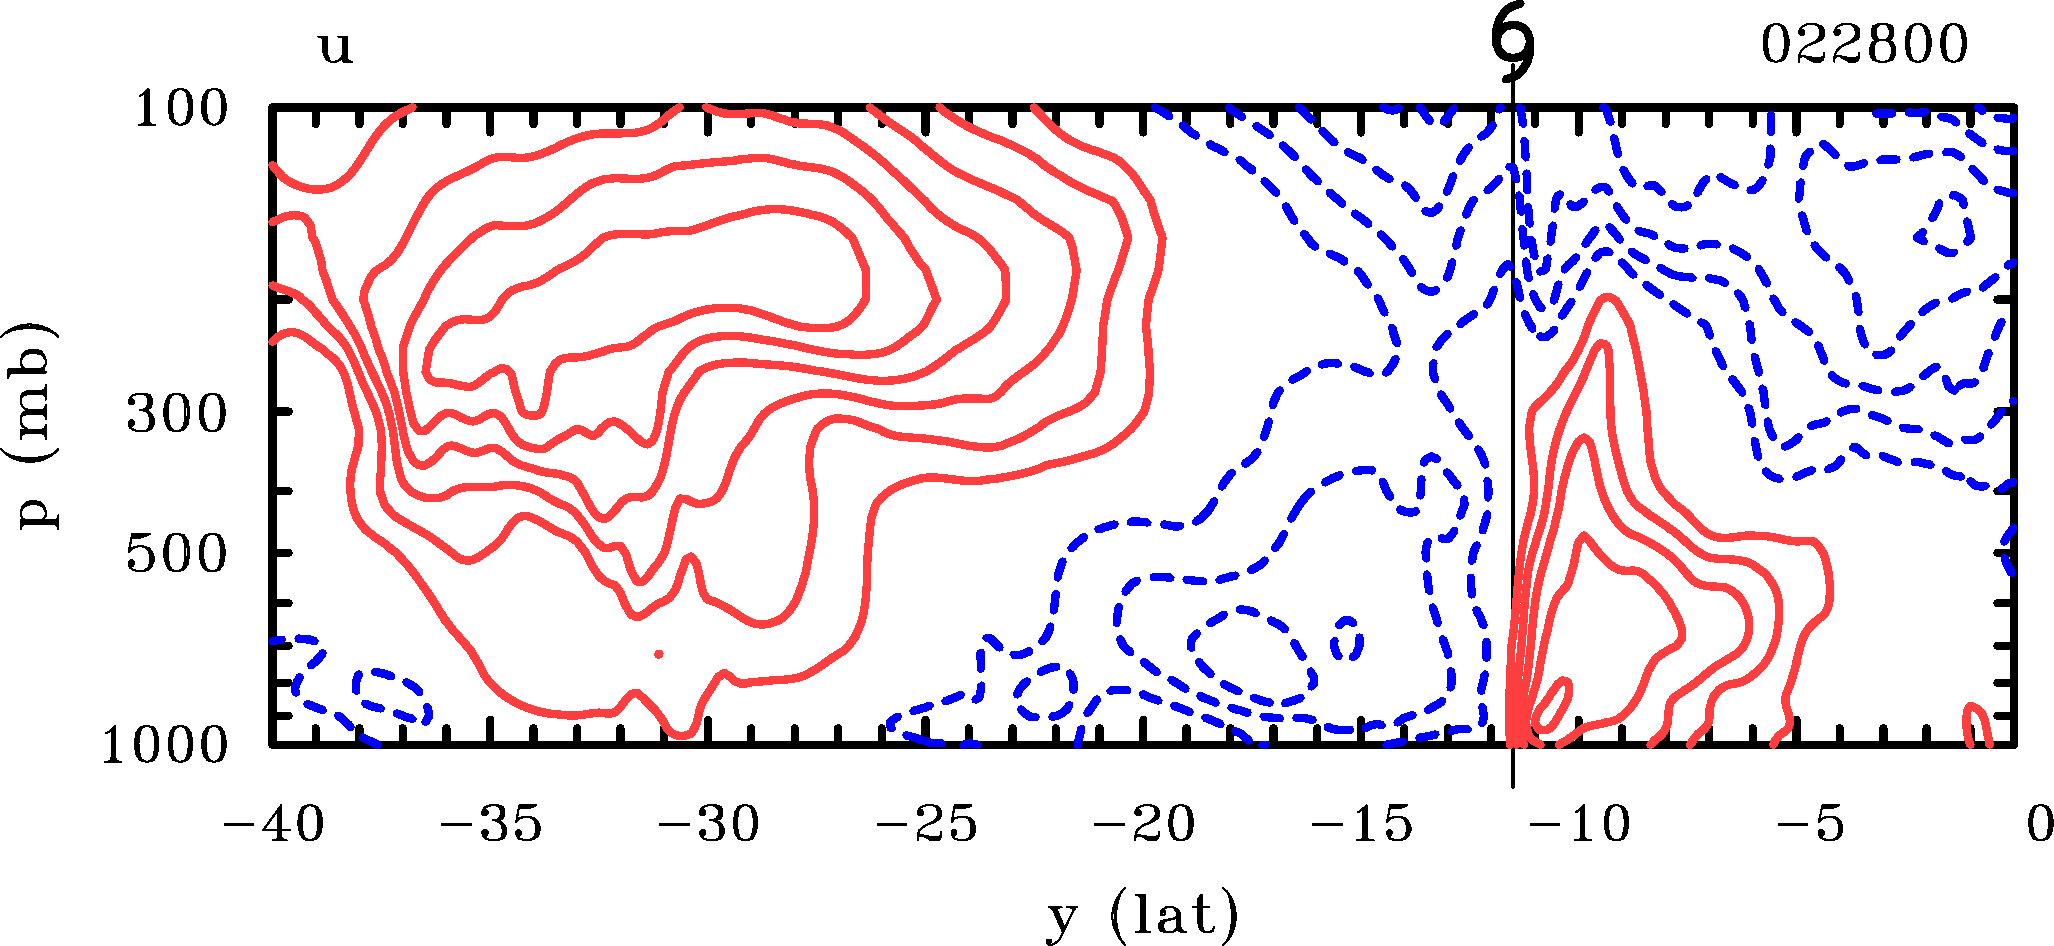
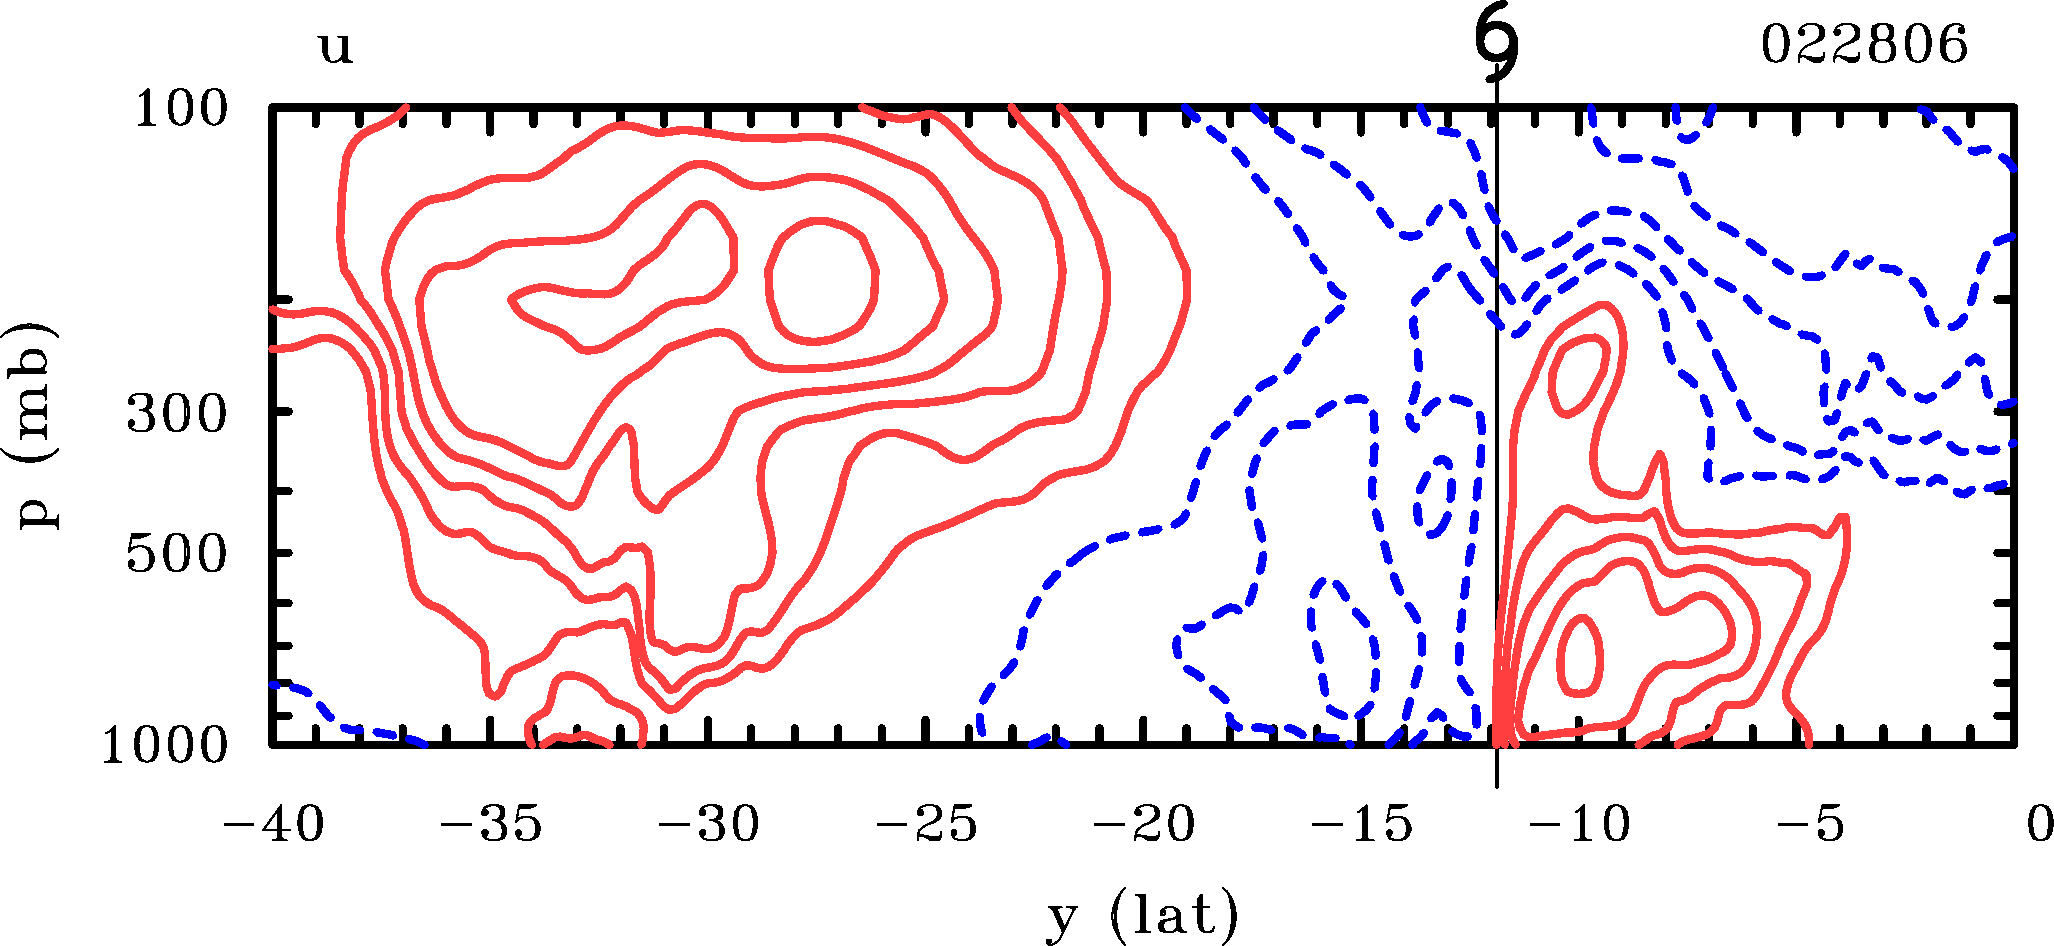
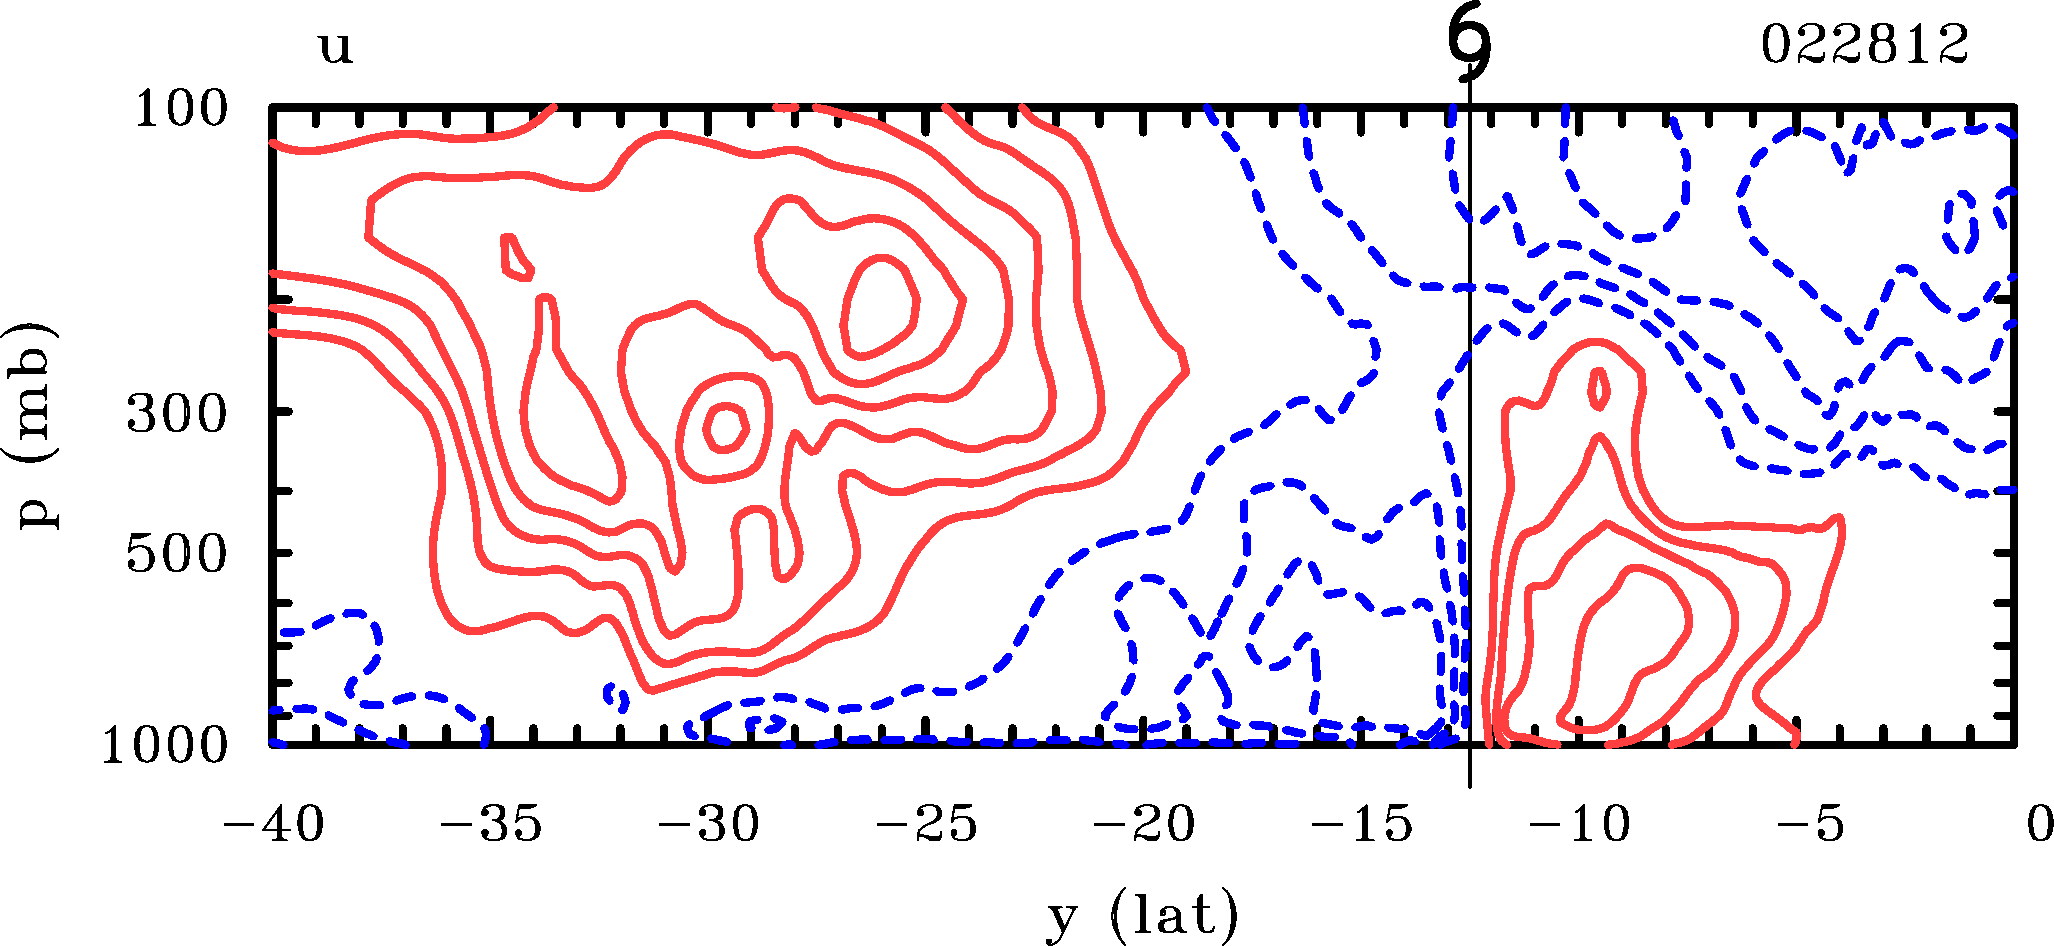
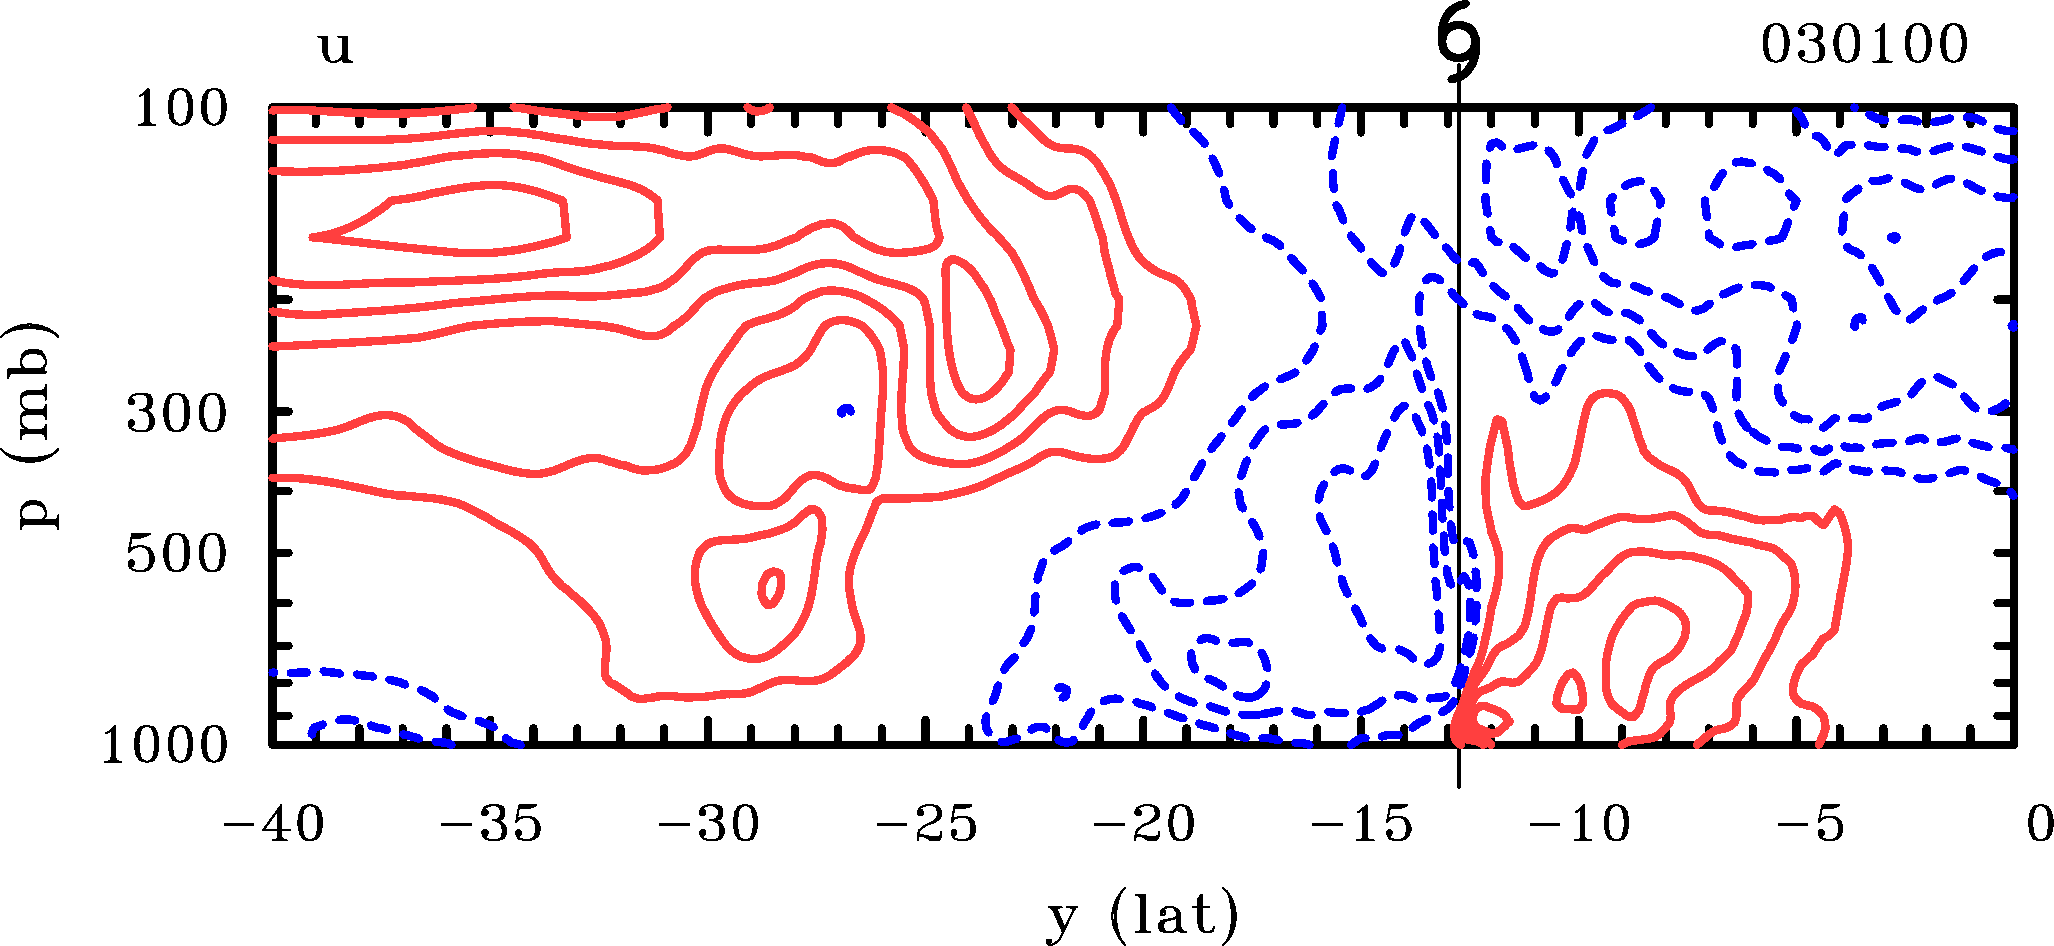
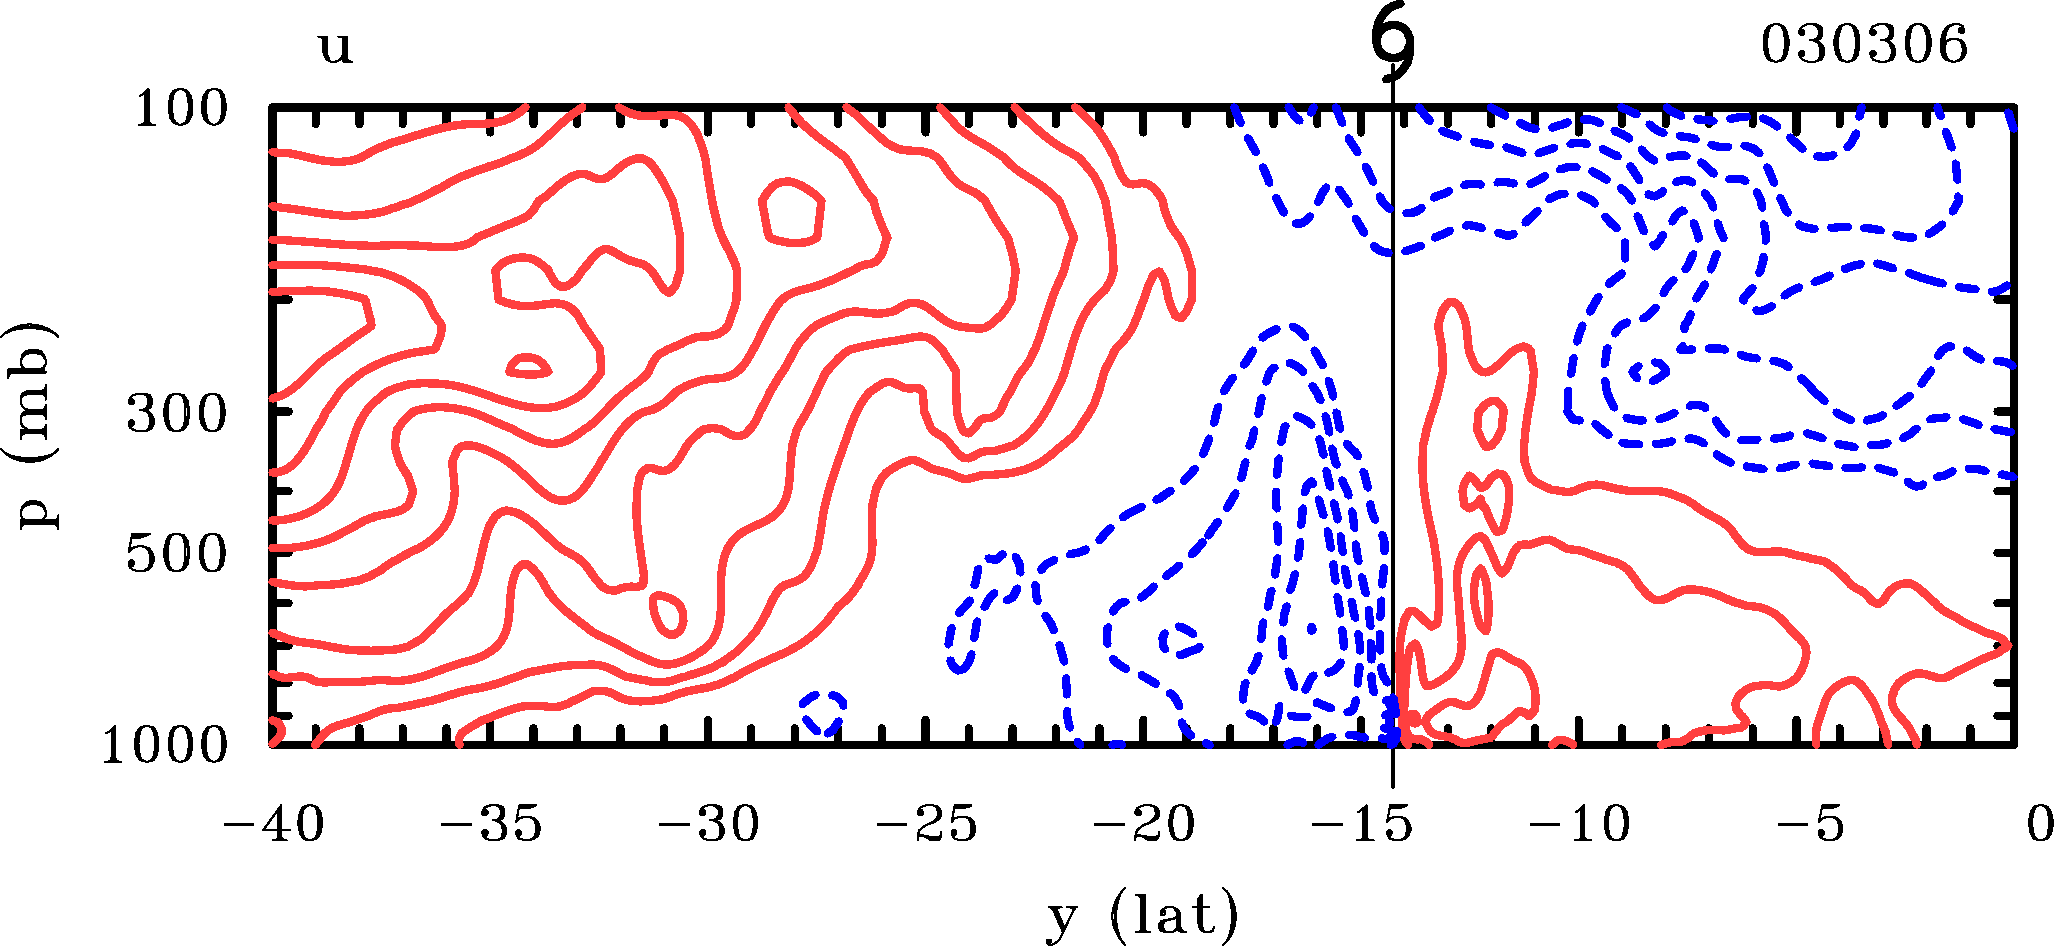
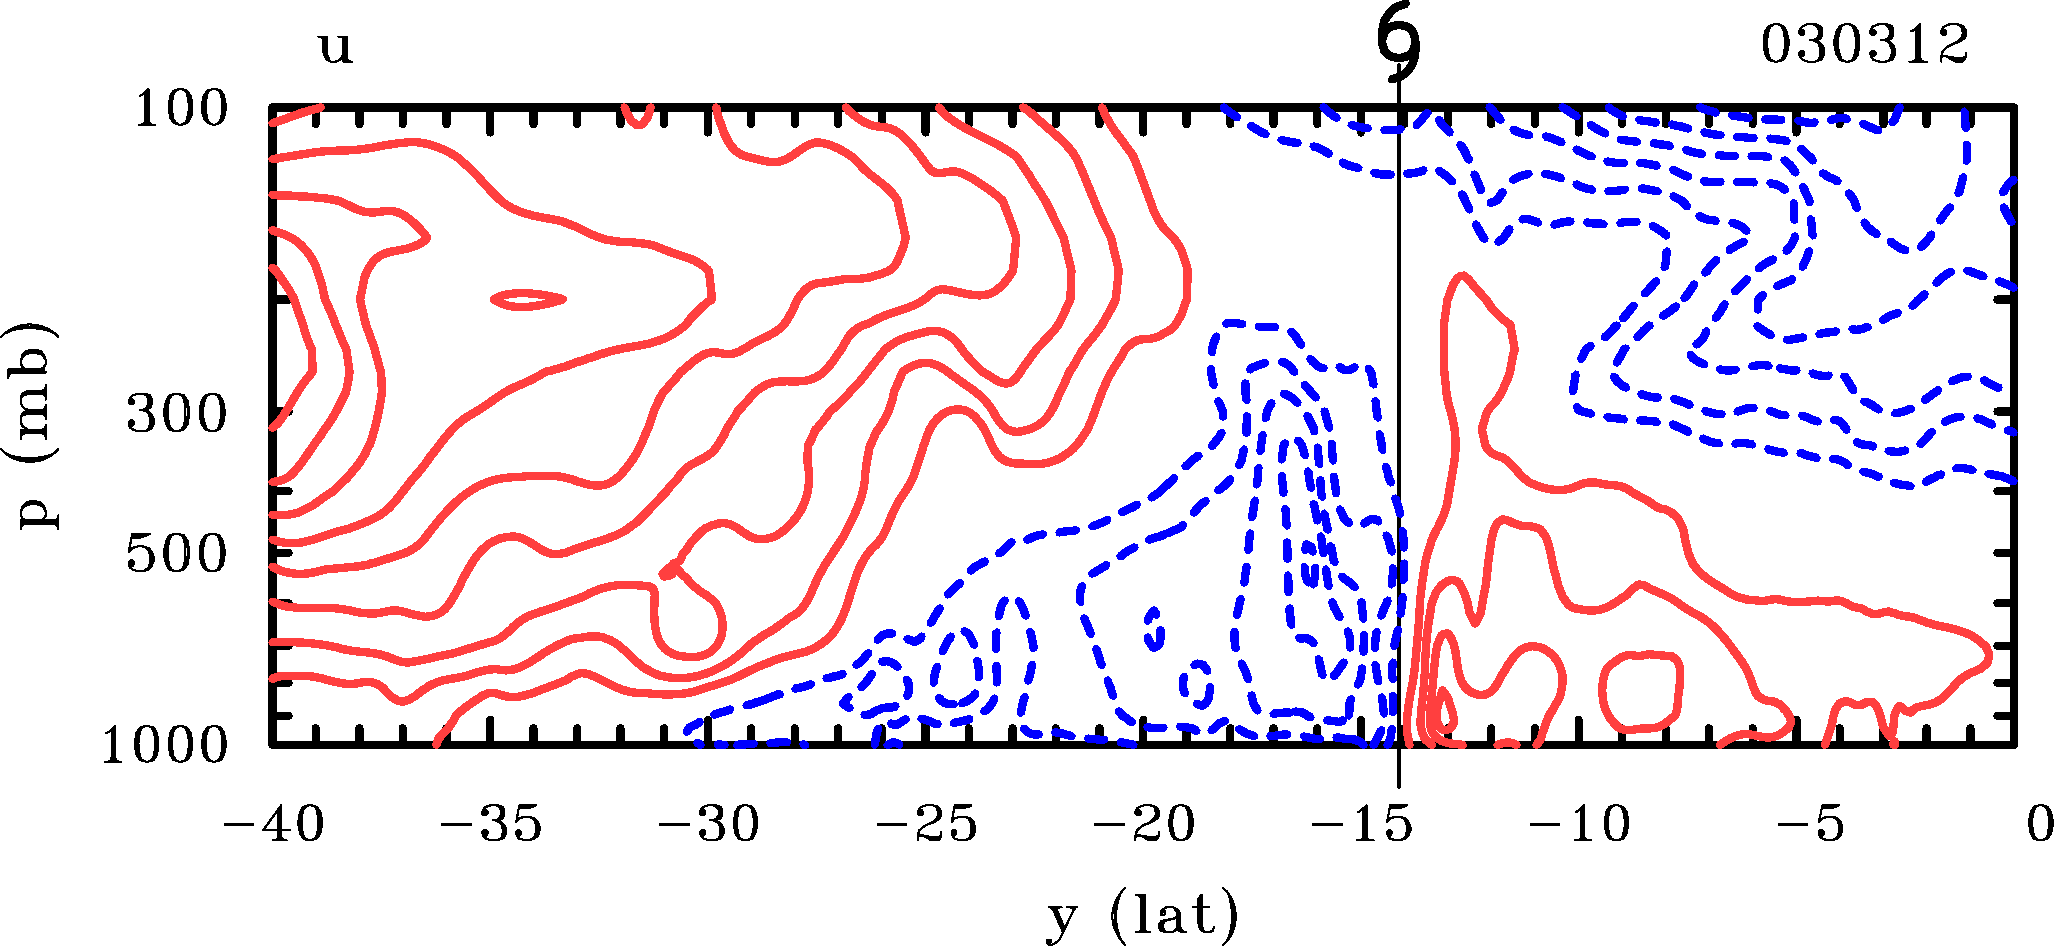
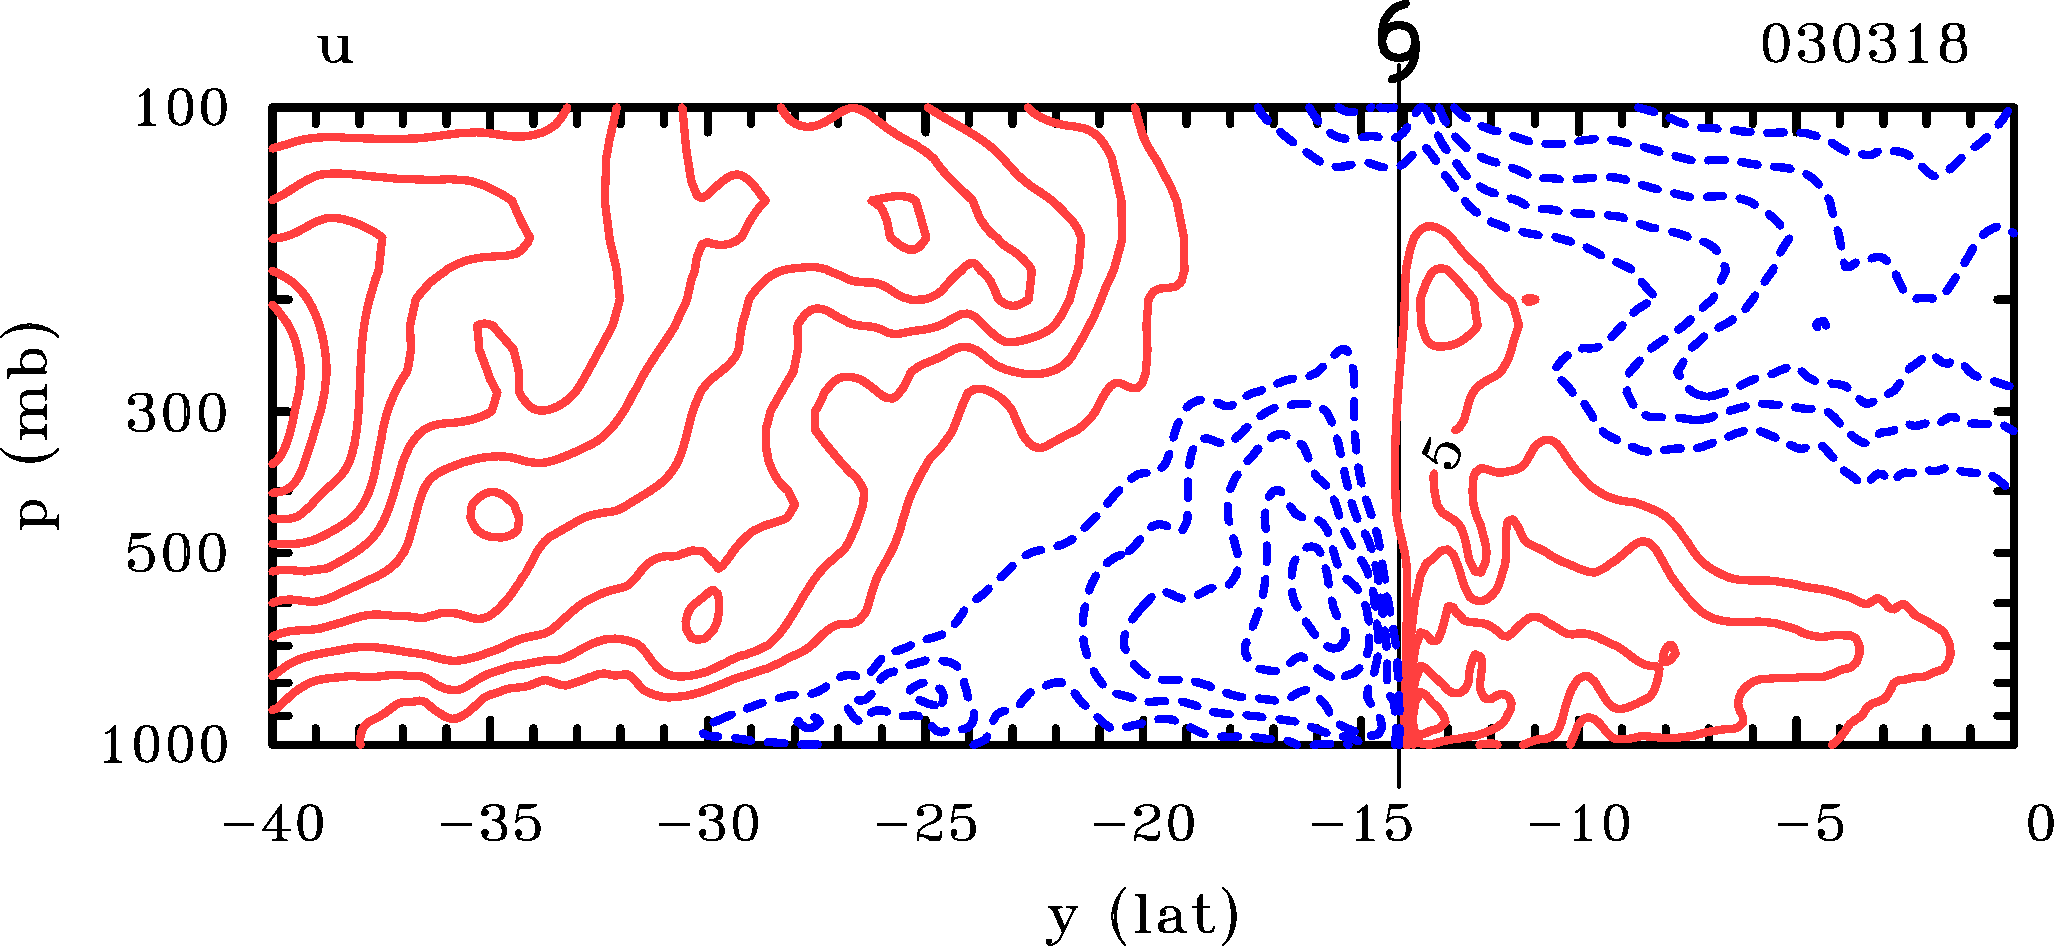
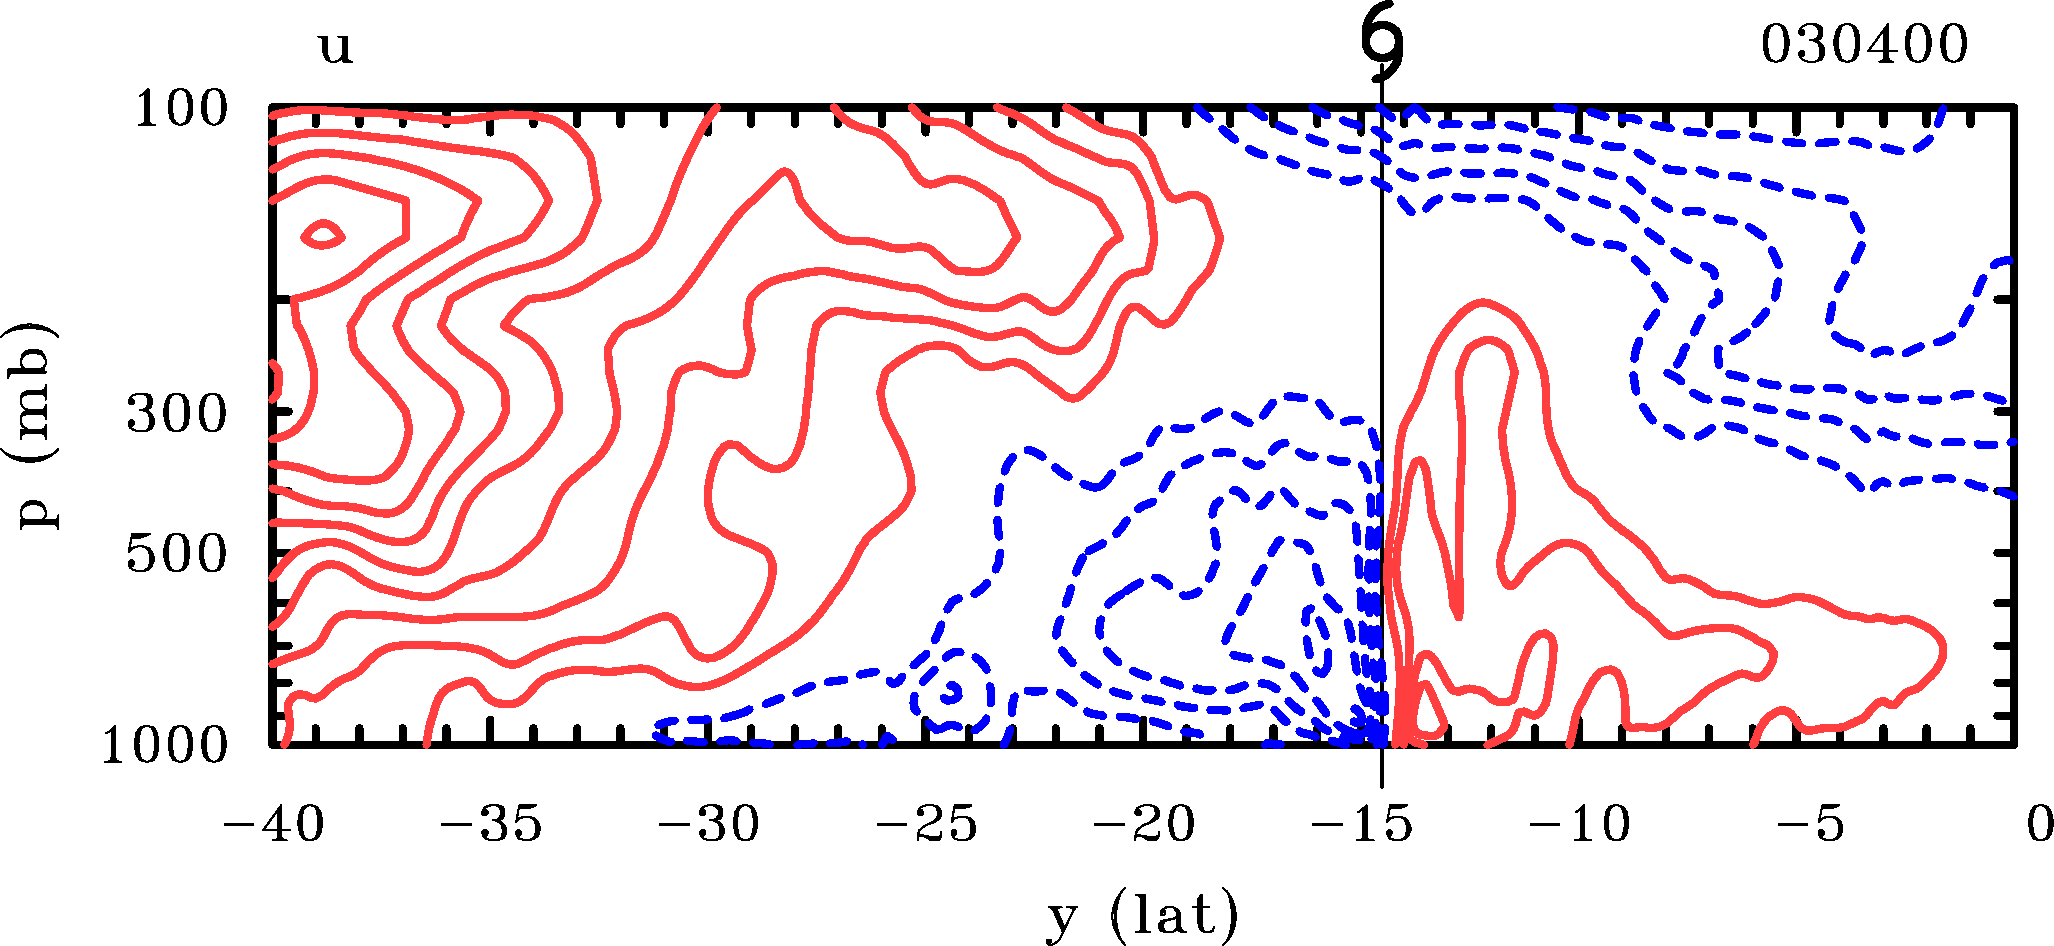
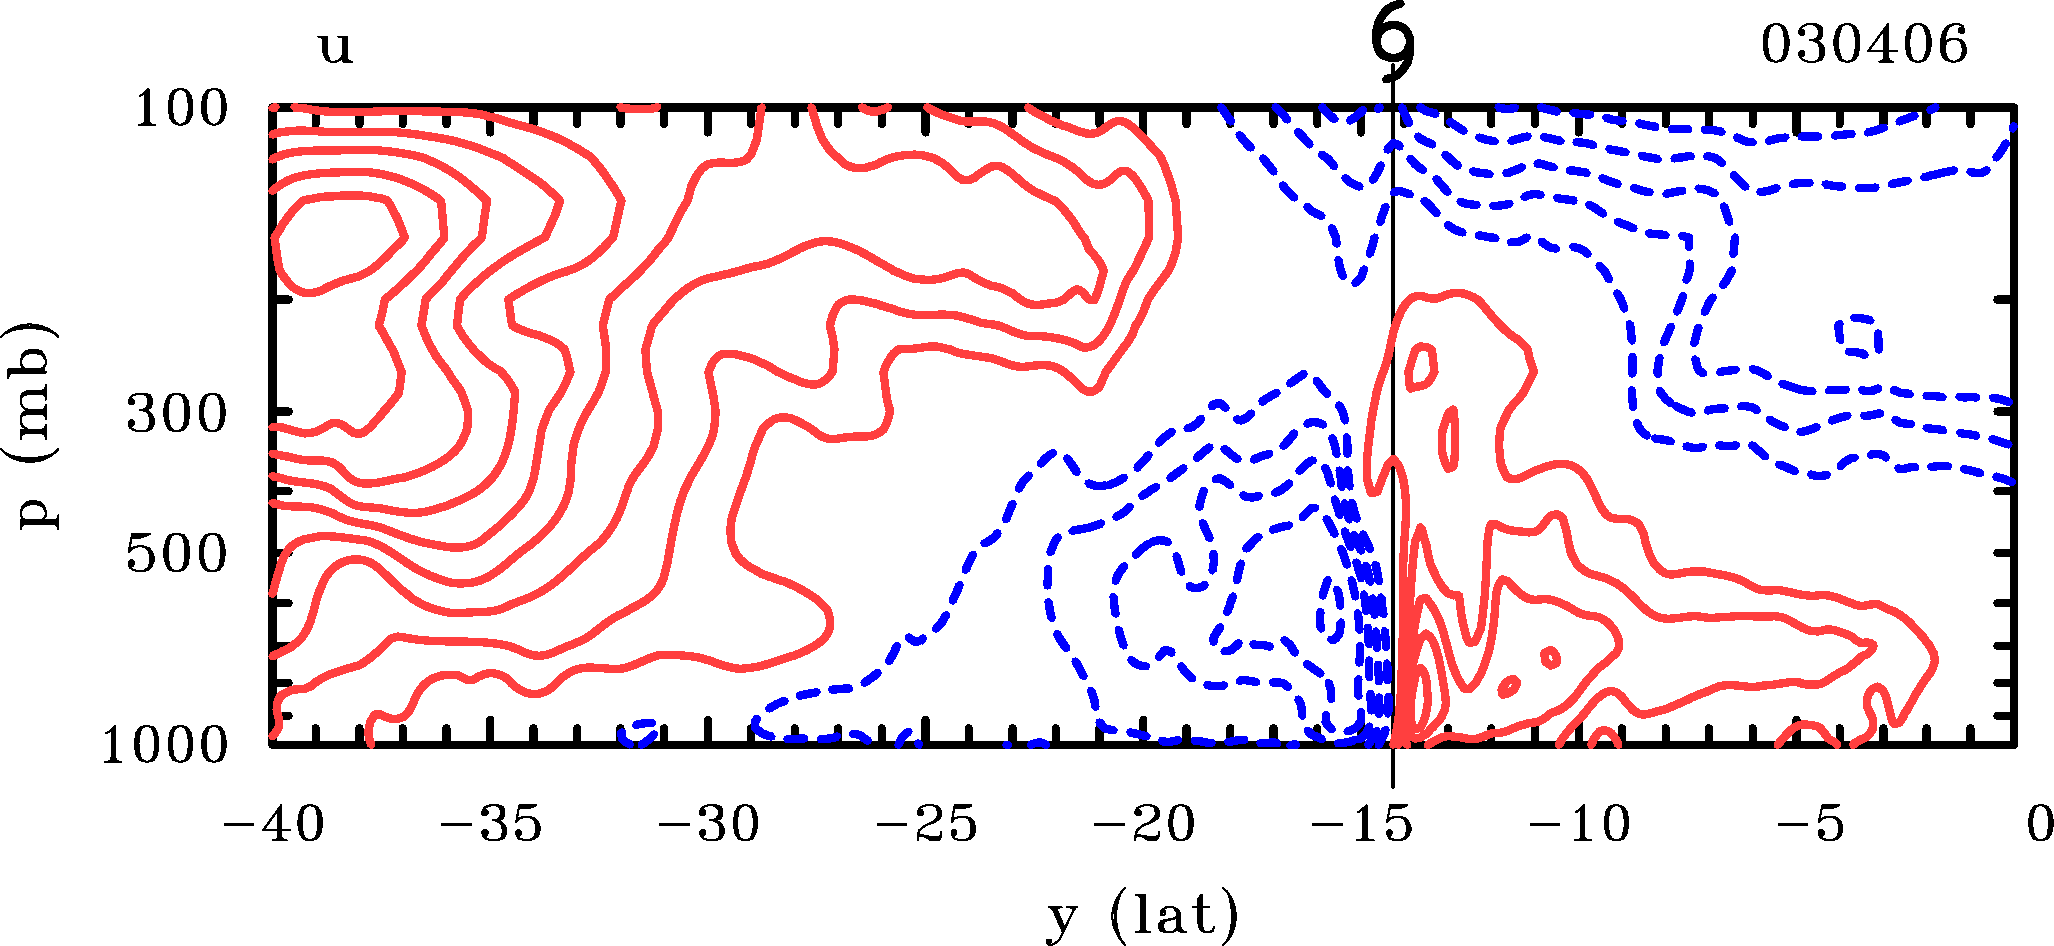
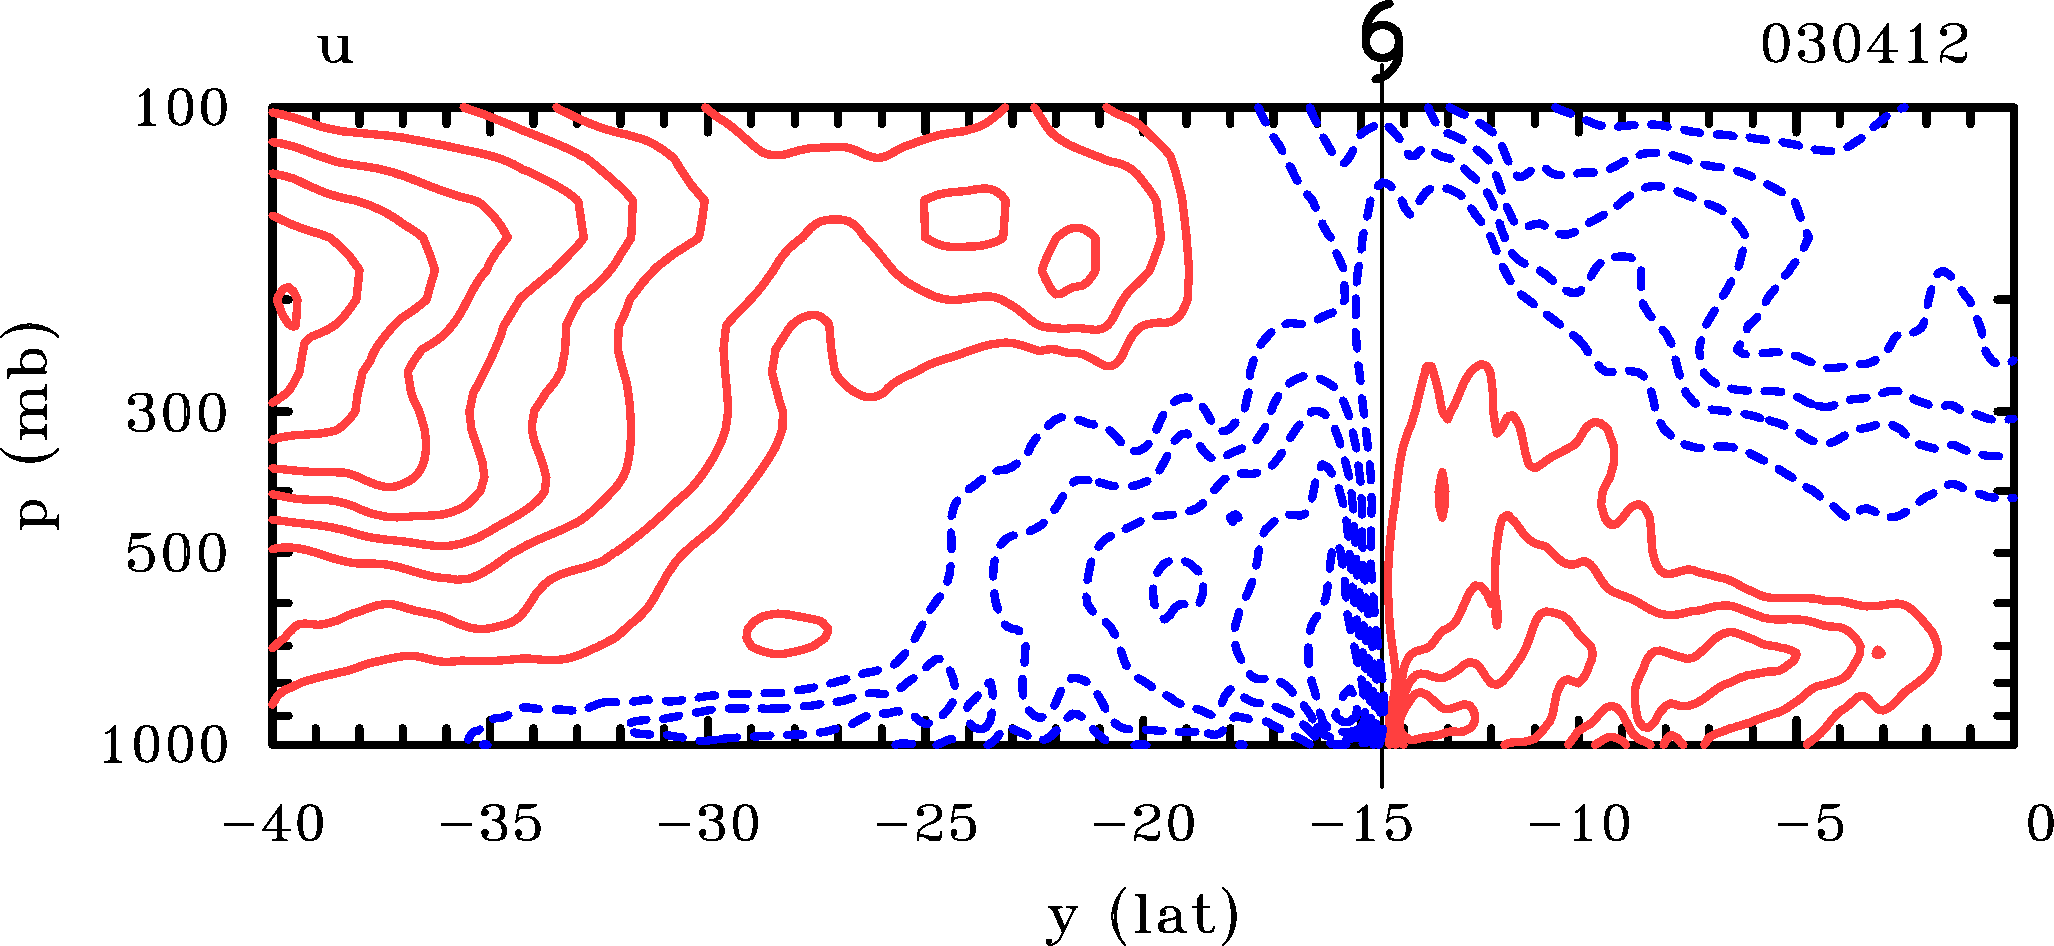
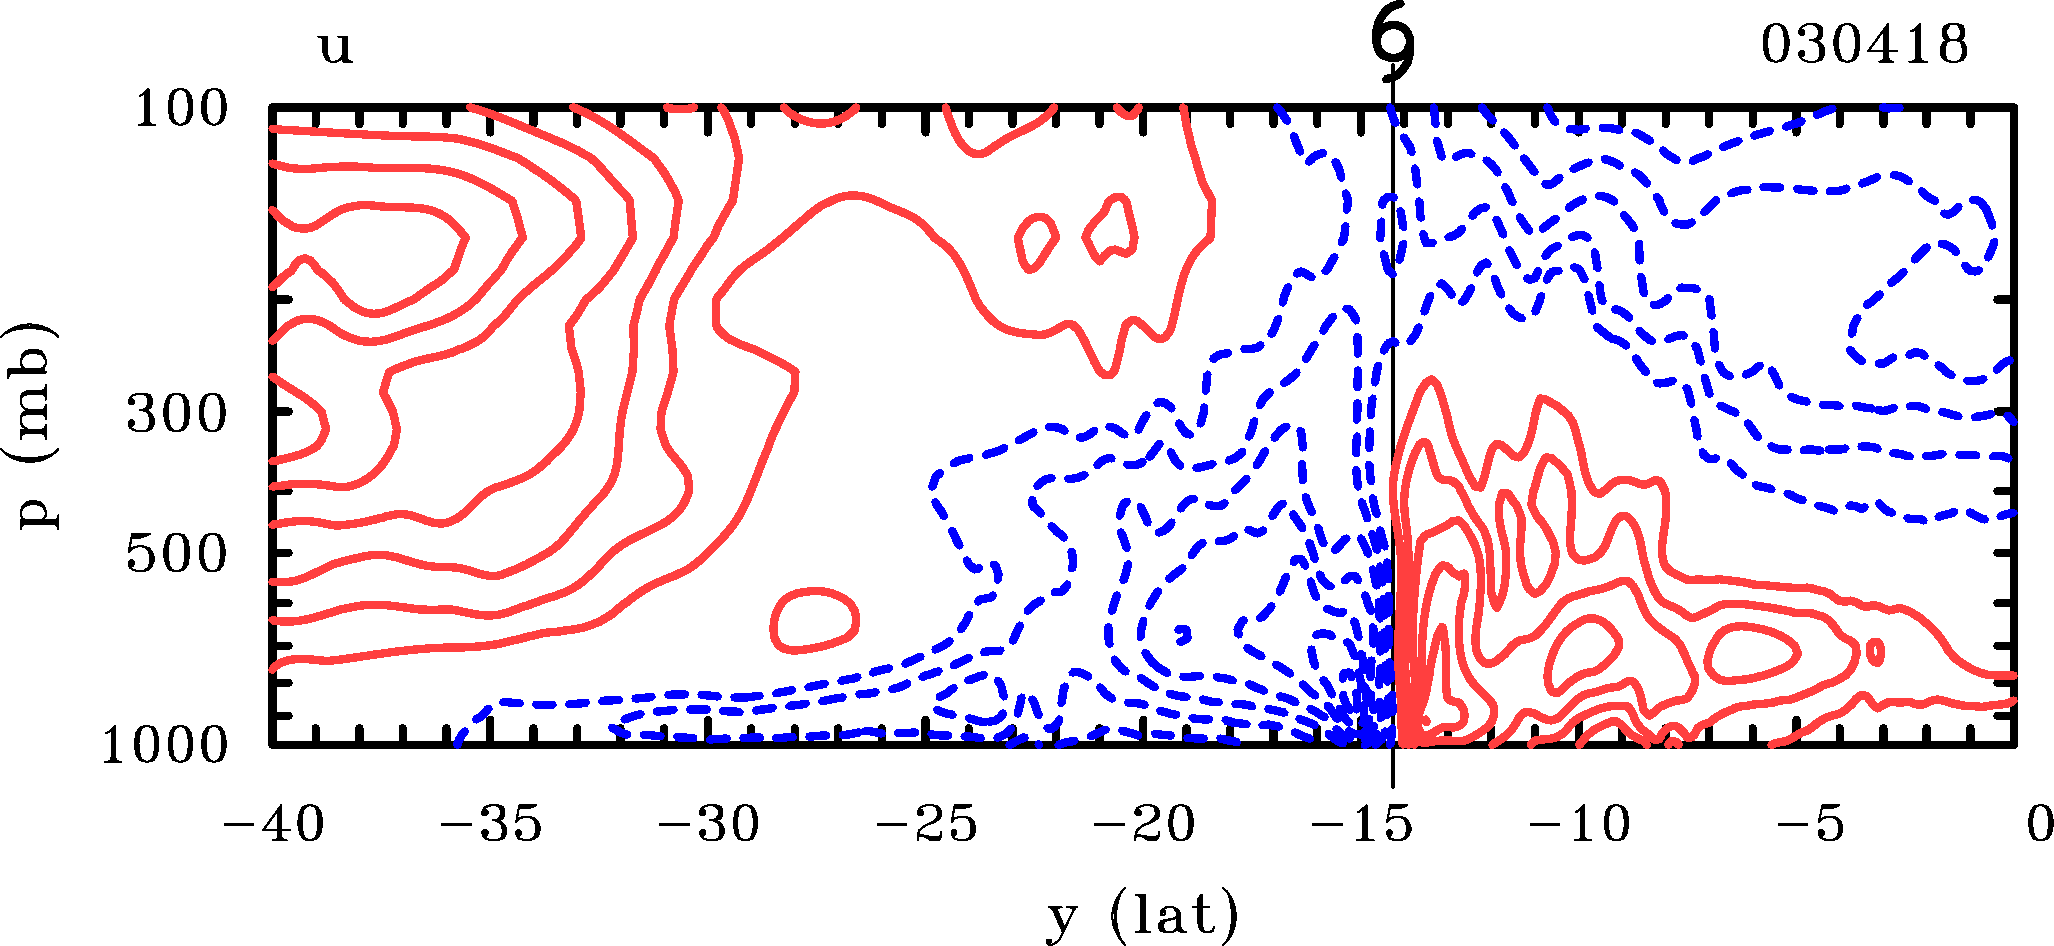
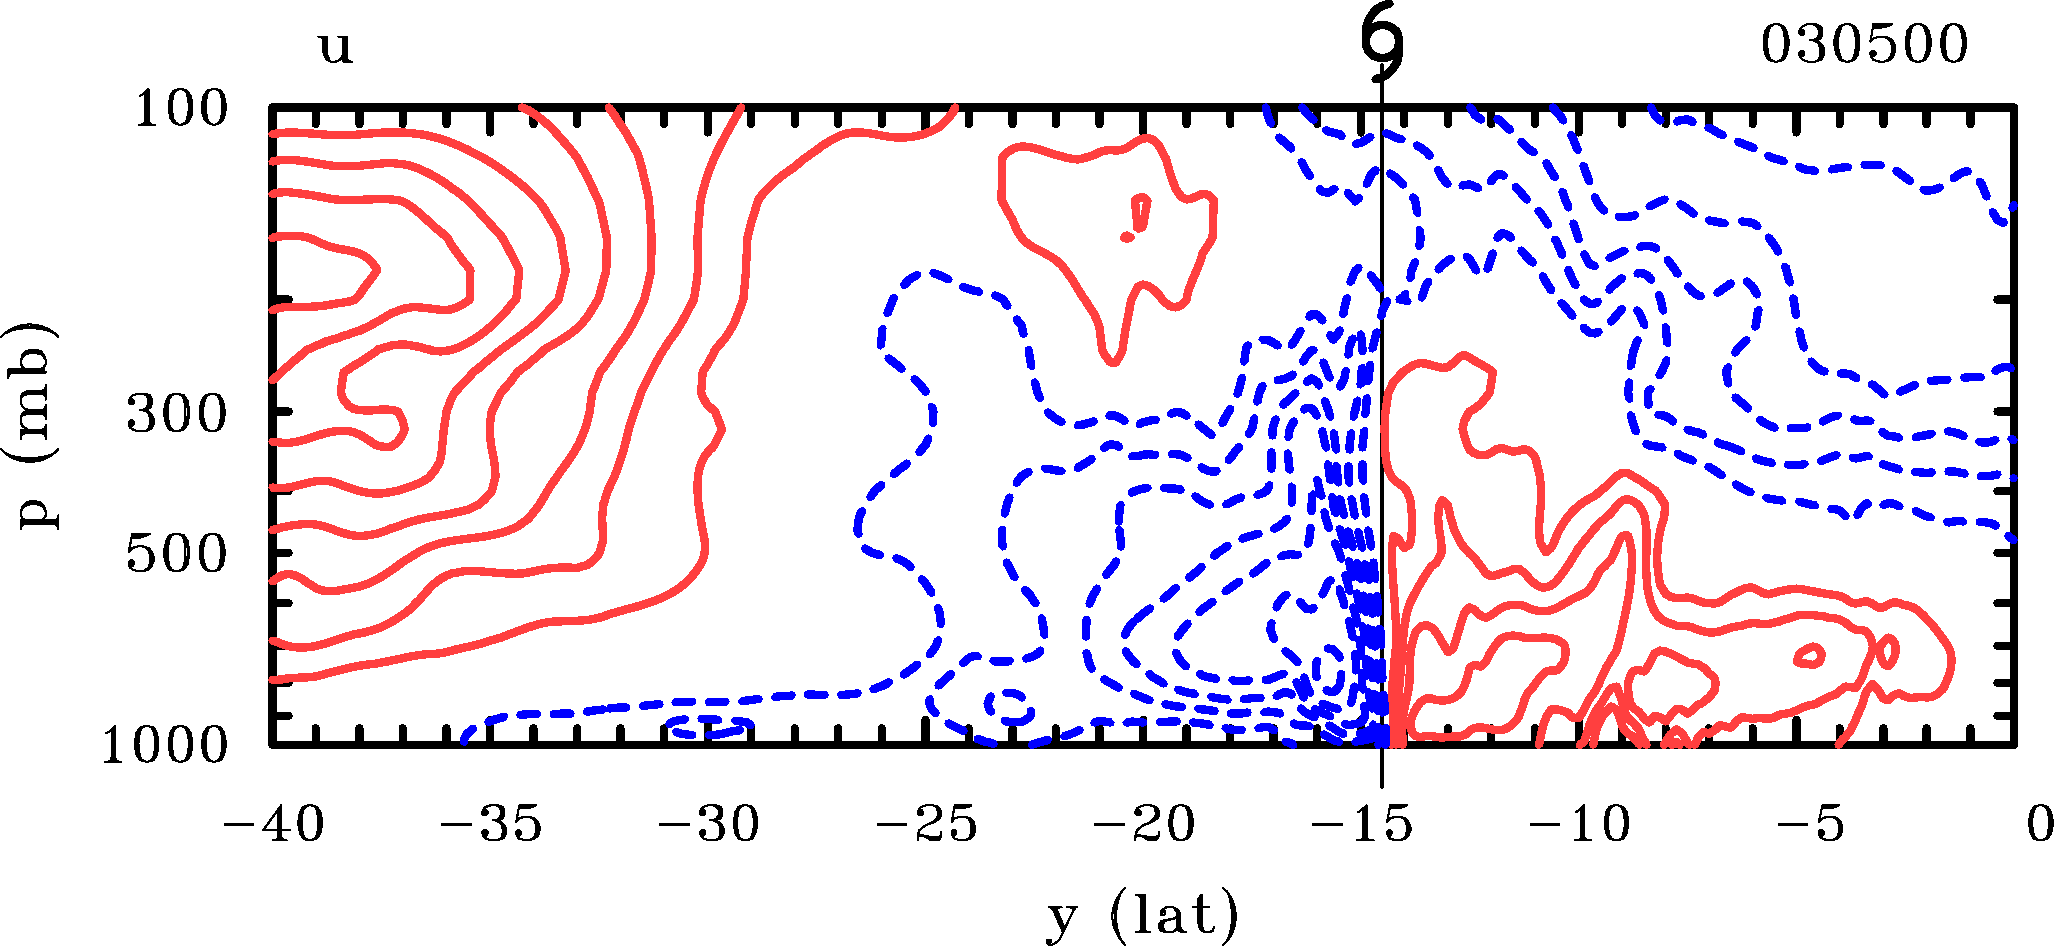
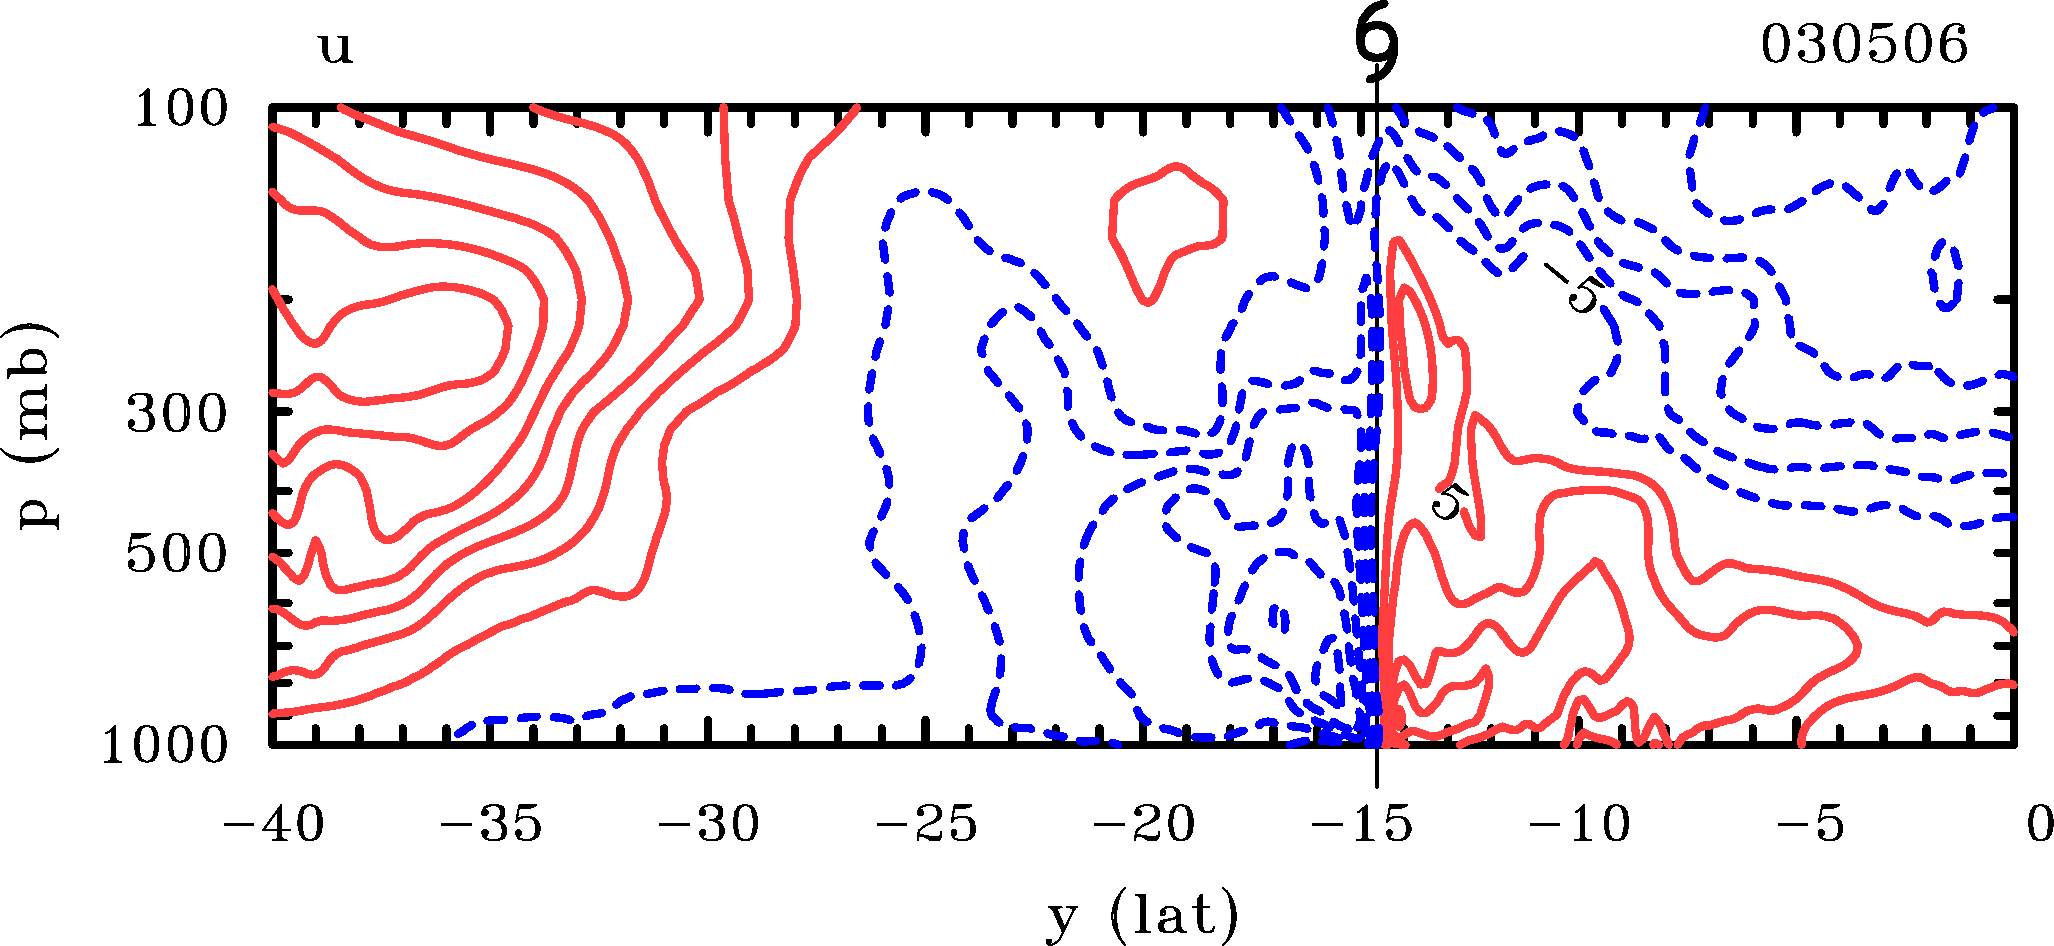
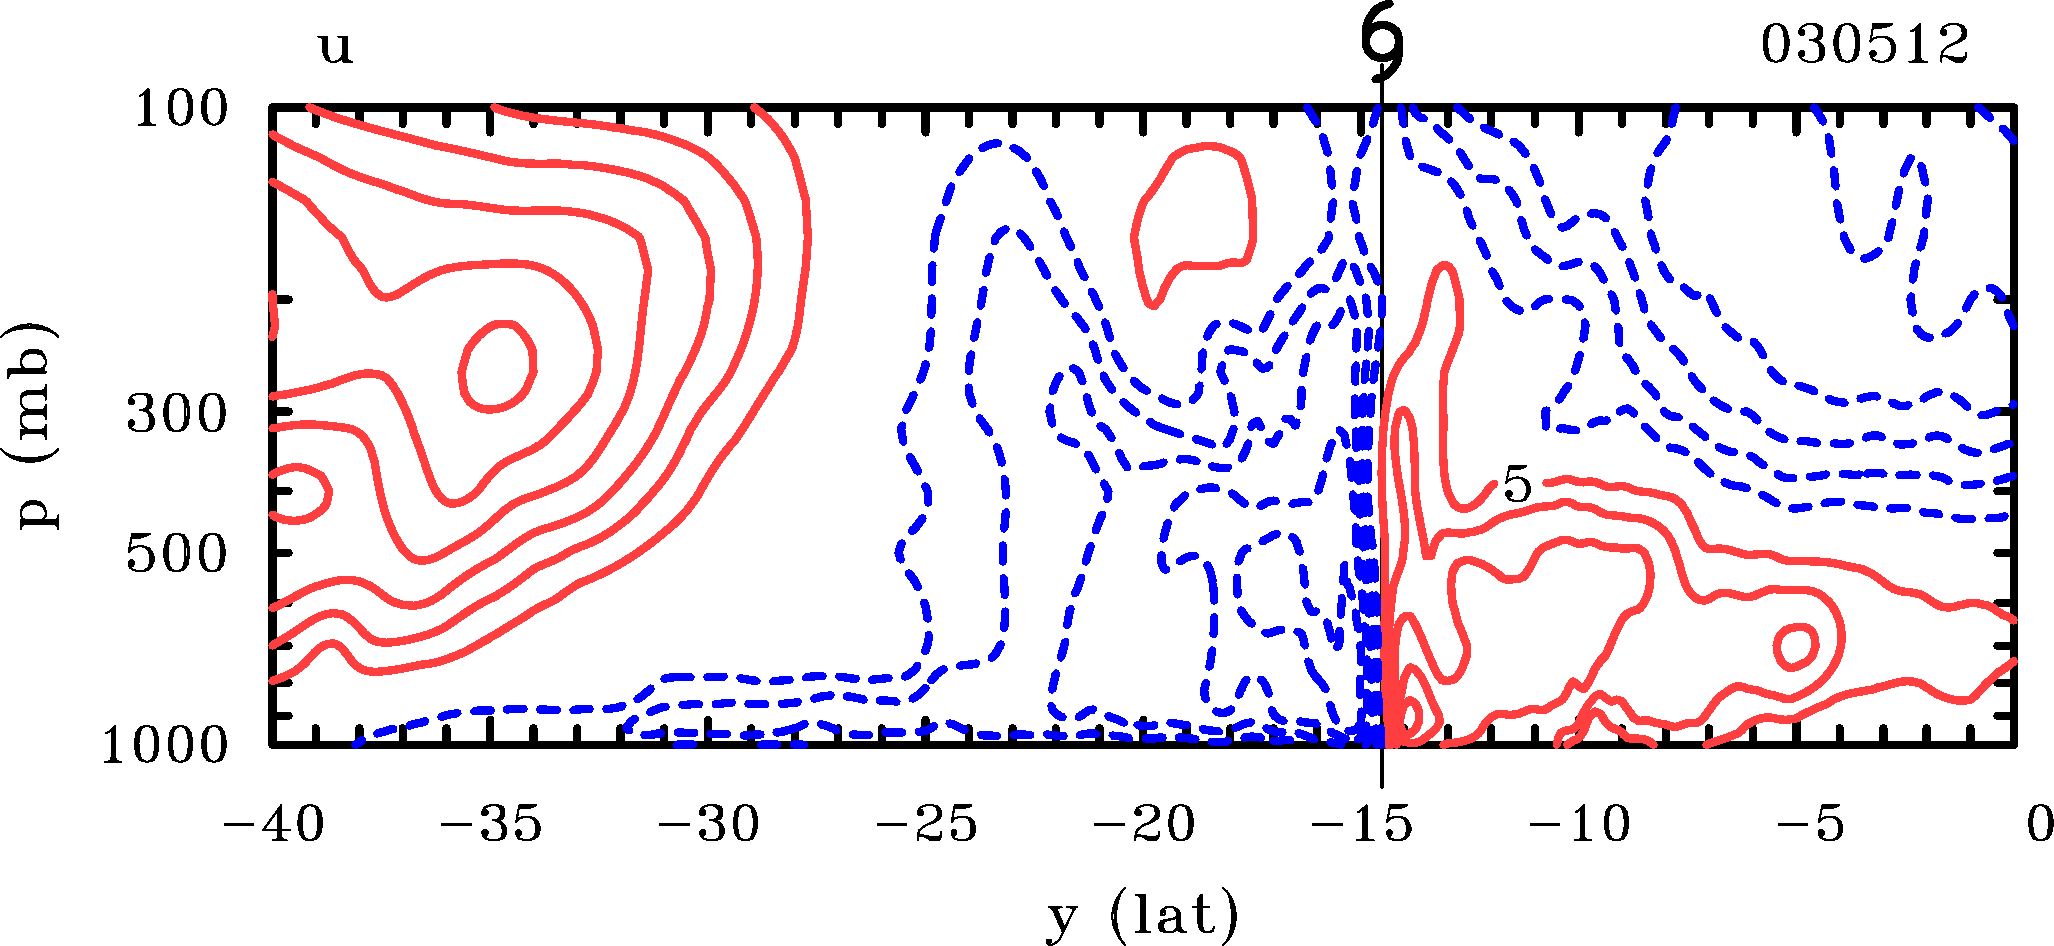
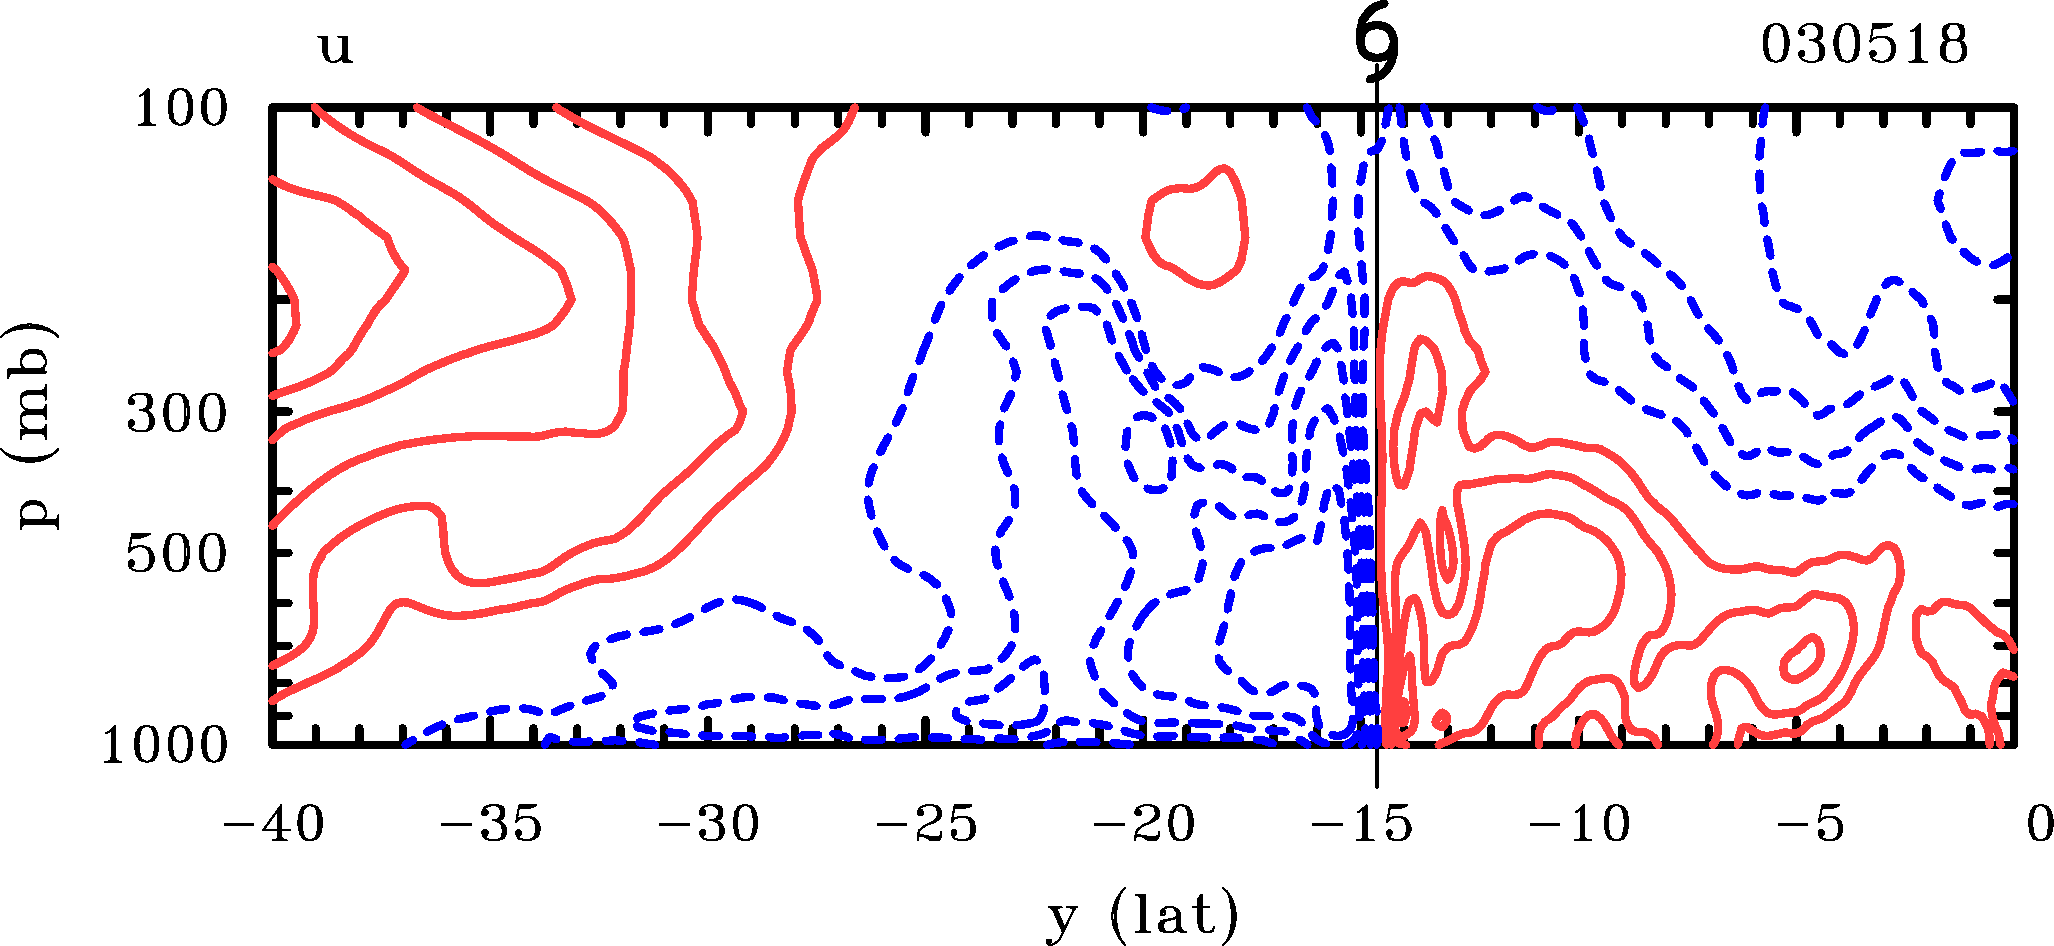
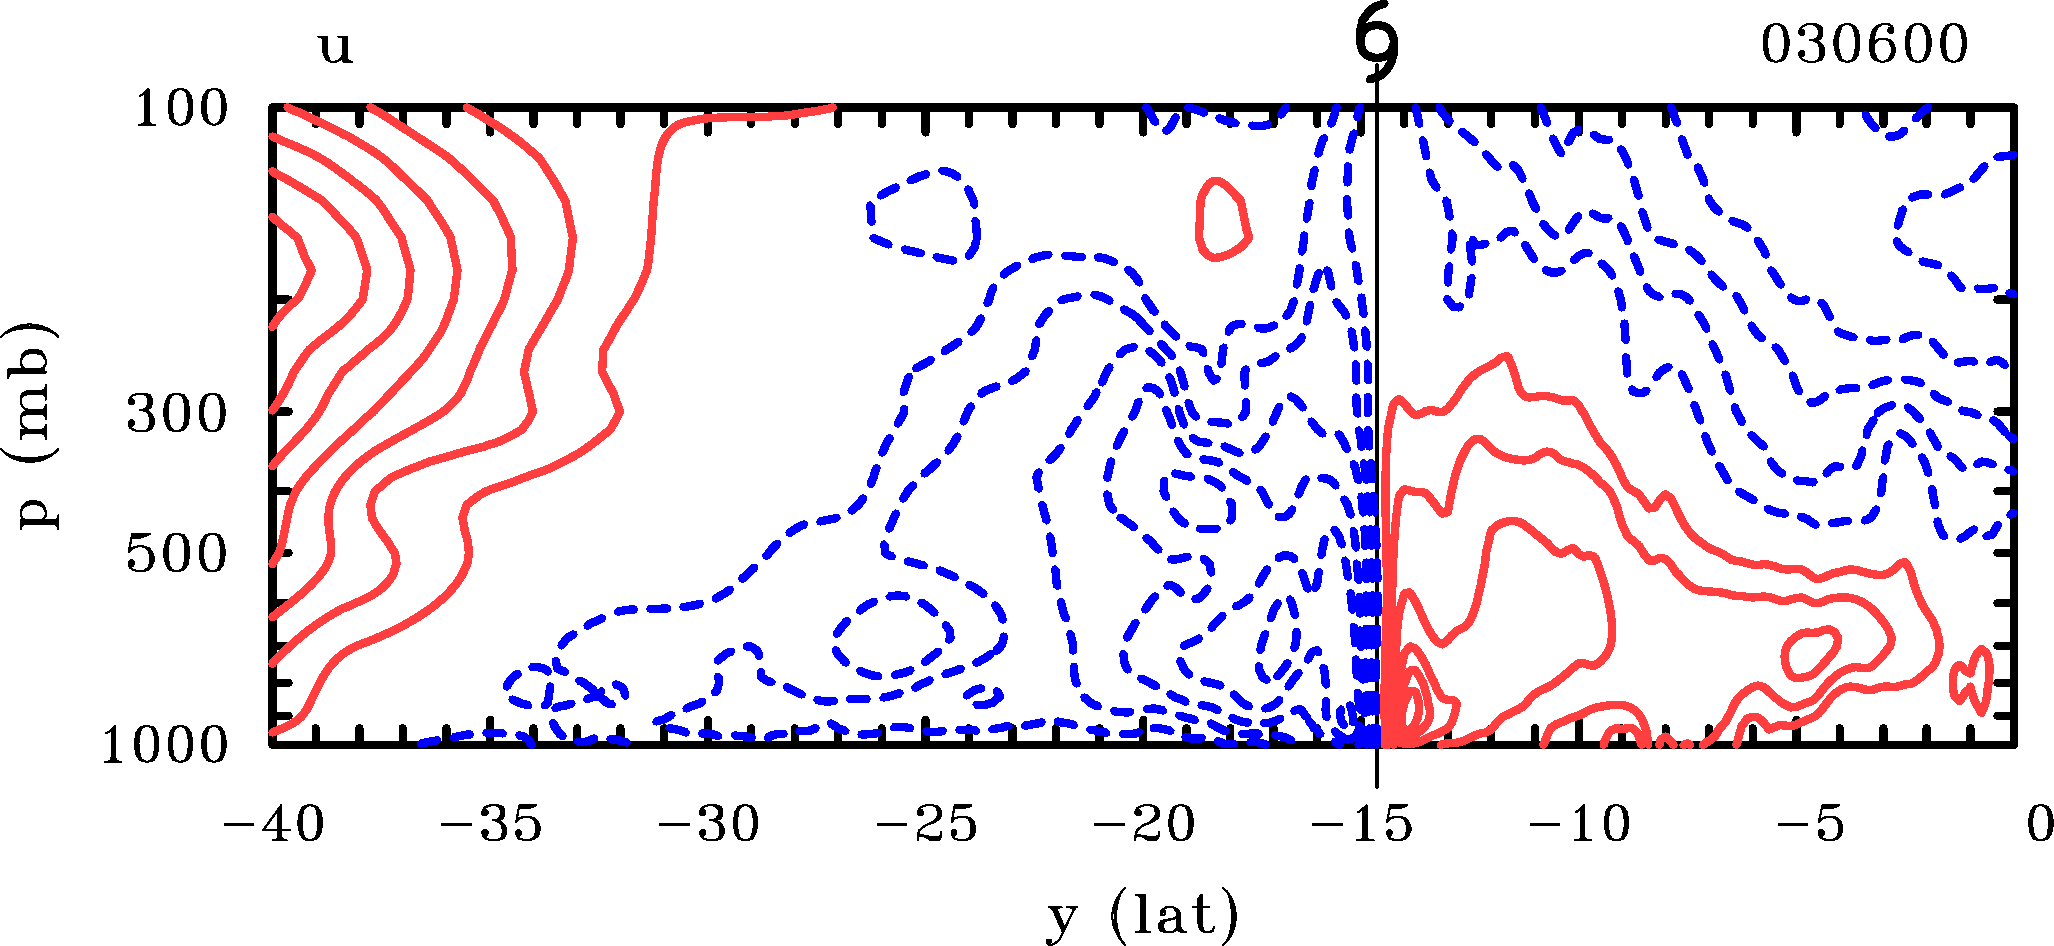
Meridional-height cross section of zonal wind contours tracking the minimum 850 mb geopotential
Contour levels are 5 m s-1. The vertical line and cyclone symbol show the storm centre location.
Click here for the plotting code.
Zonal flow 125oE |
|---|
 |
 |
 |
 |
 |
 |
 |
 |
 |
 |
 |
 |
 |
 |
 |
 |
 |
 |
 |
 |
 |
 |
 |
 |
 |
 |
 |
 |
 |
 |
 |
 |
 |
 |
 |
 |
 |
Copyright © Roger Smith: Date 7 Aug 2014