Lectures on Tropical Meteorology
Chapter 3. More on diabatic processes
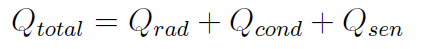
In general the total diabatic heating Q rate may be written as the sum of three components, Qrad, Qcond, Qsen, the contributions on the right-hand-side being from radiative, condensational and sensible heating, respectively.
|
While diabatic processes drive atmospheric motion, it is important to emphasize that the contributions Qrad, Qcond, Qsen are not pure external functions, but are strongly coupled to the flow configuration they produce. This interdependence reflects a redistribution of the only pure external heating function, the solar energy, which impinges on the atmosphere from space (S0). In order to understand the full relevance of diabatic process and how the drive atmospheric motions, it is necessary to understand the manner in which S0 is redistributed.
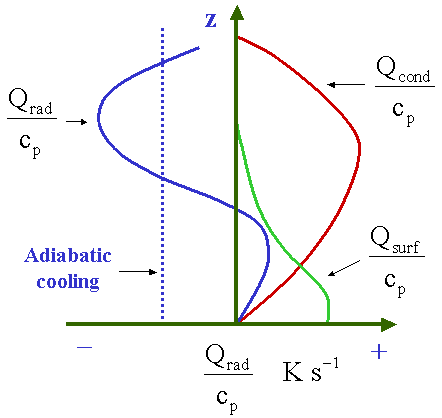
If we assume that the atmosphere is in radiative equilibrium with outer space and note that the earth is a sphere, it is clear that considerably more energy will reach the surface near the equator than near the poles. Consequently, heat energy must be transferred poleward if there is to be an approximate steady state. The question arises, how is the energy S0 redistributed in the vertical? We consider first the effects of radiation alone.
Figure 2 shows a highly simplified radiation model in which we have neglected the absorption of short wave radiation,
since it is at the earth's surface that the major effect of S0 occurs.
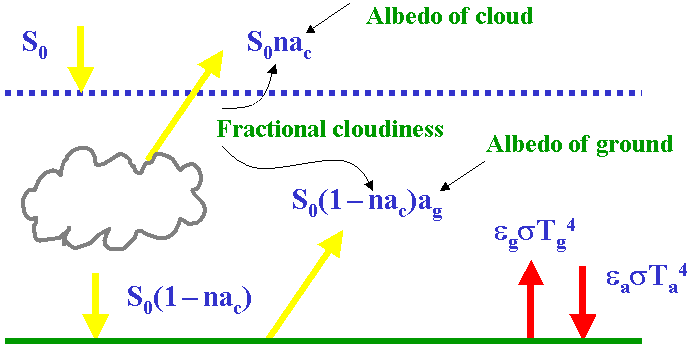
Pure radiative balance at the surface would require that

where n denotes the fractional area of cloud, Ts and Ta are the temperatures of the surface and the atmosphere (For simplicity it is assumed here that the atmosphere is isothermal.), respectively, ac and aa are the albedos of clouds and the ground surface, εc and εa, are the corresponding emissivities, and σ is the Stefan-Boltzmann constant. Equation (3.1) says that the net short wave flux into the atmosphere is balanced by the net outward long wave flux.
Now εaσT4 represents the re-radiation of the atmosphere back to the surface. As εa ≈ 0.7, we cannot neglect this term. In fact such long wave absorption has a major impact on the distributions shown in Fig. 1. However, the solar radiation (the left hand side of Eq. (3.1) may be disposed of in other ways besides being merely radiated upwards (i.e. εaσT4) as long wave radiation.
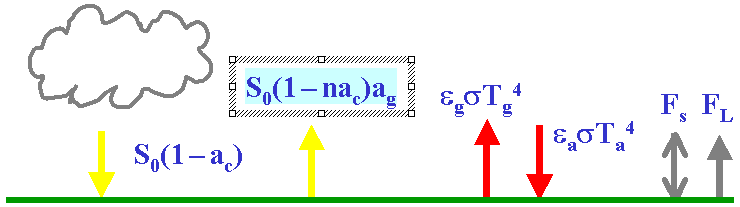
Adjacent to the surface there will be diffusion of heat to or from the atmosphere and possibly convective mixing upwards to the
atmosphere. Over moist ground or over the ocean, evaporation may occur and there will be an evaporative flux of heat away from the surface
(Fig. 3). In this case the total energy balance at the surface is

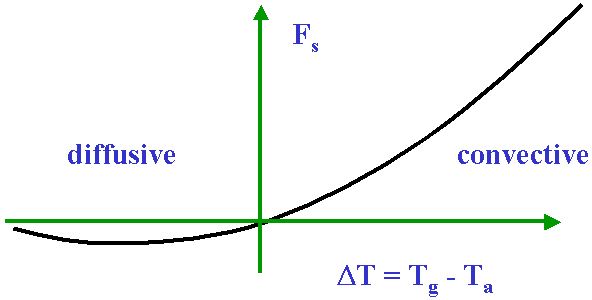
where Fs, and FL are the sensible and latent heat fluxes, respectively. The quantity, Fs, depends
on the magnitude and sign of temperature difference ΔT = Tg - Ta. The behaviour is roughly as sketched in
Fig. 3.4. If ΔT > 0, Fs > 0 and there is convective heat transfer to the air, If ΔT < 0, Fs < 0, but
the heat transfer is then diffusive and relatively small.
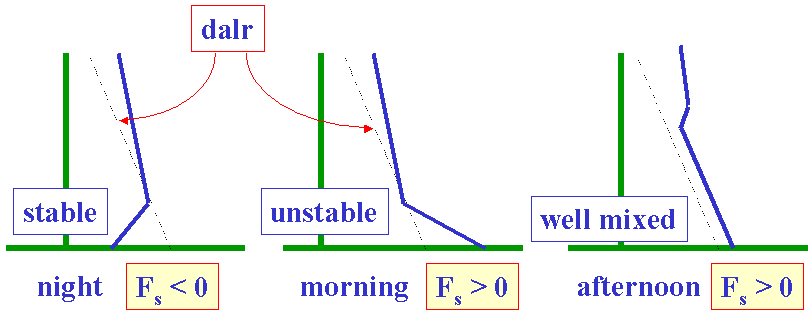
Generally, Fs >= Fs. Thus Fs, and FL are usually net fluxes of heat away from the surface. Note that they effectively change radiative diabatic heating into other types of heat transfer, which then contribute to redistributing the heat. Both Fs and FL have important effects on the total columnar heating rates, Qg and QL, and both are functions of atmospheric motion and structure. The dependence of Fs on ΔT and on the temperature structure is depicted in Fig. 3.5. Note that the greater ΔT, the greater is the degree of convective instability within the boundary layer, a feature seen also in Fig. 5.
|
The functions Fs and FL can be parameterized as
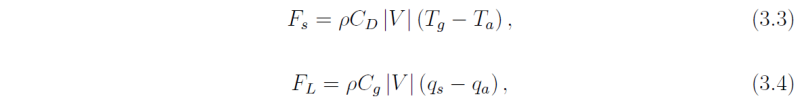
where V is the wind speed near the surface, Ta, and qa are the temperature and specific
humidity of the air near the surface, Tg, and qg, are the sea surface temperature and saturation specific
humidity at the sea surface temperature, respectively, and CD, CE are empirical coefficients that depend on
the surface characteristics (and over the sea on wind speed). The coefficient CD is called the
(a) the degree of surface roughness,
(b) the wind speed,
(c) and in the case of moisture there is a dependency on the degree of saturation in the vertical.
The sensible heating, Qsen, tends to be confined to the lowest 1-2 km, except over dry continental surfaces where it may be as high as 4 km. Further it represents an immediate acquisition of heat by the column.
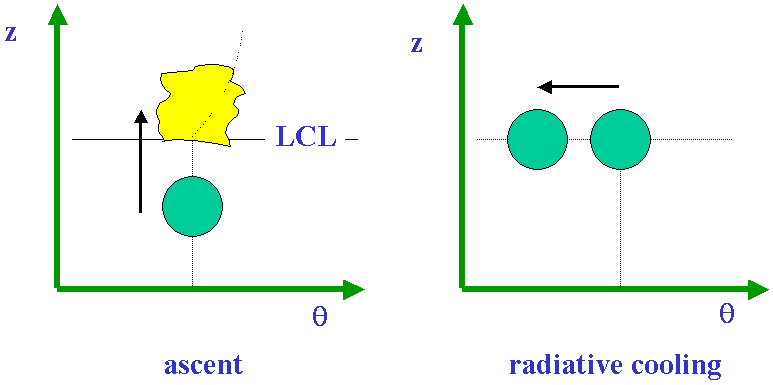
The latent heating, Qcond, is not immediate, but requires saturation in order to accomplish the heat release. This is a process that is highly dependent on the dynamics. There are three main ways of producing condensation: two are associated with advection, the other (non-dynamic) by radiative cooling (Fig. 6).
|
Most of the latent heat release in the tropical atmosphere is associated with moist convection, vertical advective process. We will restrict our attention to this form of QL. The actual region of moist ascent is rather small and rather vigorous. Most of the tropics is involved in the flux of latent heat (FL), but only a small part is involved in its release. The situation is depicted in the moisture cycle, shown schematically in Fig. 7.
|
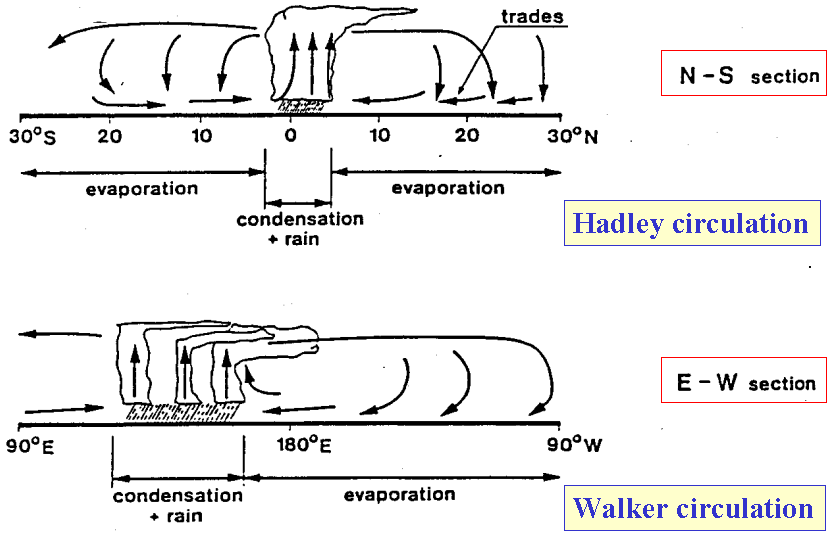
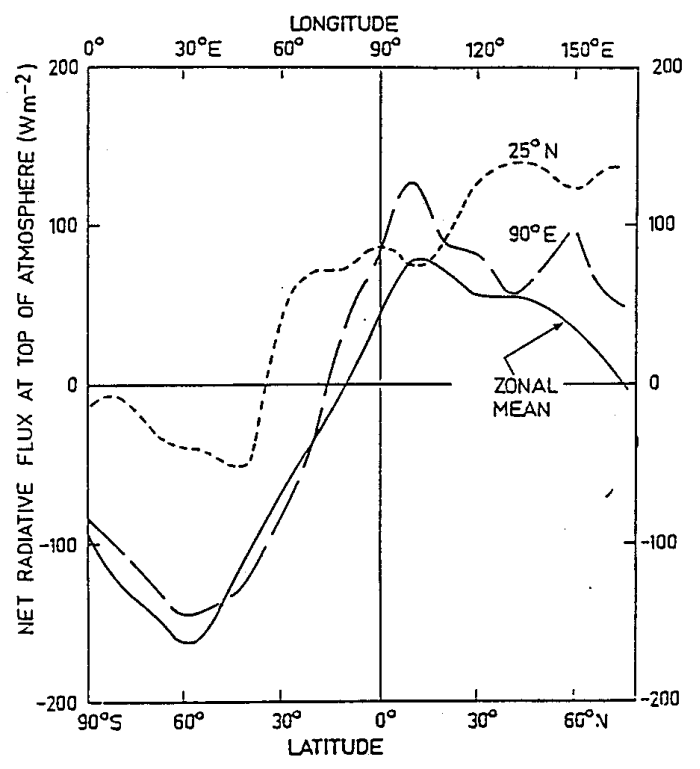
In summary, there are two major forms of Q. These are Qrad, principally the longwave component thereof, and QL, which is an indirect manifestation of S0 via FL. Figures 8 and 9 indicate something of their disposition in the east-west and north-south cross-sections. Of particular importance in Fig. 8 is that the longitudinal gradient of net flux is of the same magnitude as the latitudinal gradient.
Most of the variation in the latitudinal profile may be accounted for in the latitudinal gradient of the solar input.
|
|
As the solar input is constant along 25oN, the longitudinal variation in net flux must be due to other effects such as ground albedo and cloud cover; the latter being closely associated with the dynamical system. Note that the desert regions (10oE to 50oE) appear as net radiative sinks with the outgoing longwave radiation (OLR) greater than the net incoming solar flux. On the other hand, the convective monsoon regions (80oE to 18oE) act as net radiative heat sources. In the case shown the radiative heating distribution is probably indicative of the total heating field. The condensational heating will be a maximum in the monsoon regions as Qcond will be strongly tied to the precipitation patterns.
In the desert regions the sensible heating will act in a sense opposite to that of radiative cooling, but this component will be smaller and restricted to at most the lowest few kilometres of the atmosphere. Thus atmospheric columns above the deserts should be continually cooling and the columns in the monsoon regions continually heating. A dynamic response is necessary to rectify the imbalance. Recall that from the scaling of Chapter 2, [see Eq. (2.29)], N2w ≈ Q/(cpT), which states that the diabatic heating (Qrad+Qcond) is nearly exactly balanced by w. As a consequence, dynamical processes are involved and, consistent with mass continuity, a circulation develops.
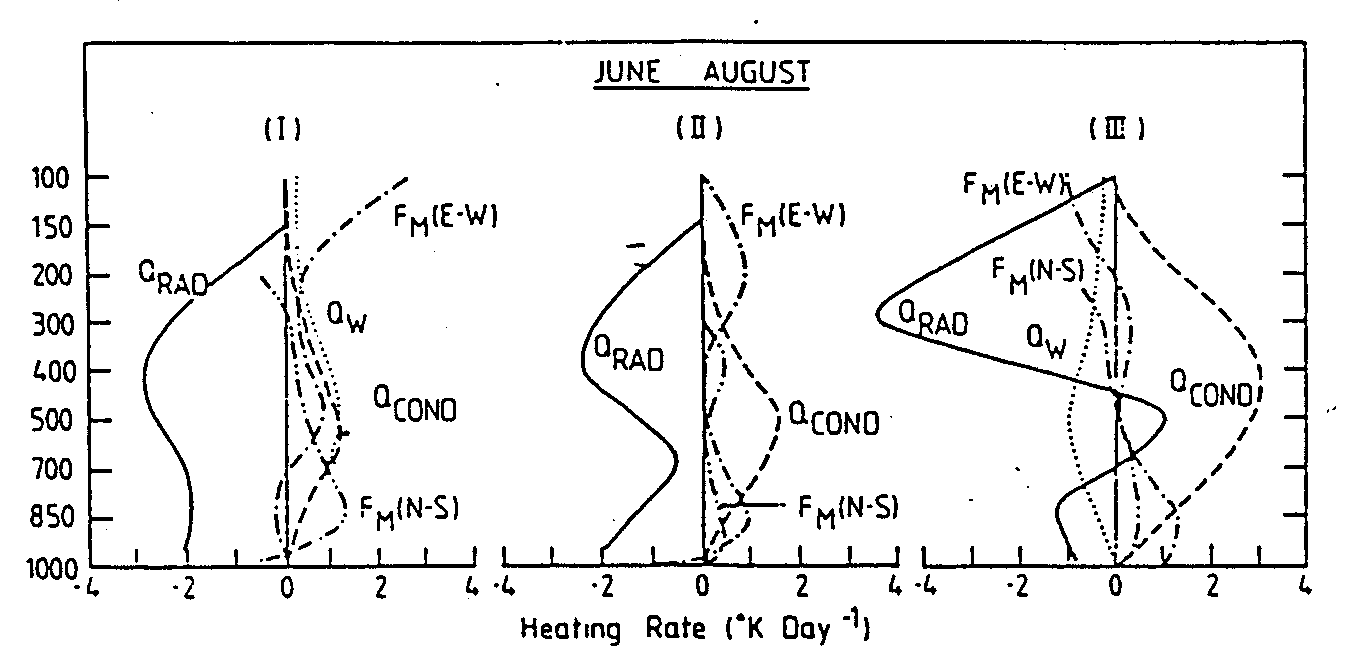
Note, however, that Qcond will depend on w so that feedback loops are extremely important. To determine the form of the dynamic response, Webster and Stephens (1979) used data from Newell et al. (1972) to calculate the heat convergence into the longitudinal section between the arid regions of Saudi Arabia (I), the Arabian Sea (II) and the Bay of Bengal (III). The resultant fluxes, together with the estimates of the vertical profiles of the components of the total heating are shown in Fig. 9. The dynamic response to the heating imbalance is such as to converge heat into the upper troposphere of the desert regions and out of the convective regions. The net radiative cooling is compensated by adiabatic warming over the deserts and an adiabatic cooling over the Bay of Bengal. In other words, the dynamic response to the longitudinal imbalance of total heating is the generation of a rather vigorous thermally-forced circulation.
More details about the role and representation of moist processes and, in particular, moist convection are given in a later chapter.
Copyright © Roger Smith, Date 12 Apr 2015