Tropical storm Sandy Sep 2010
Track of Sandy
 |
Notation is: L = low, D = depression, S = tropical storm, E = extra-tropical. |
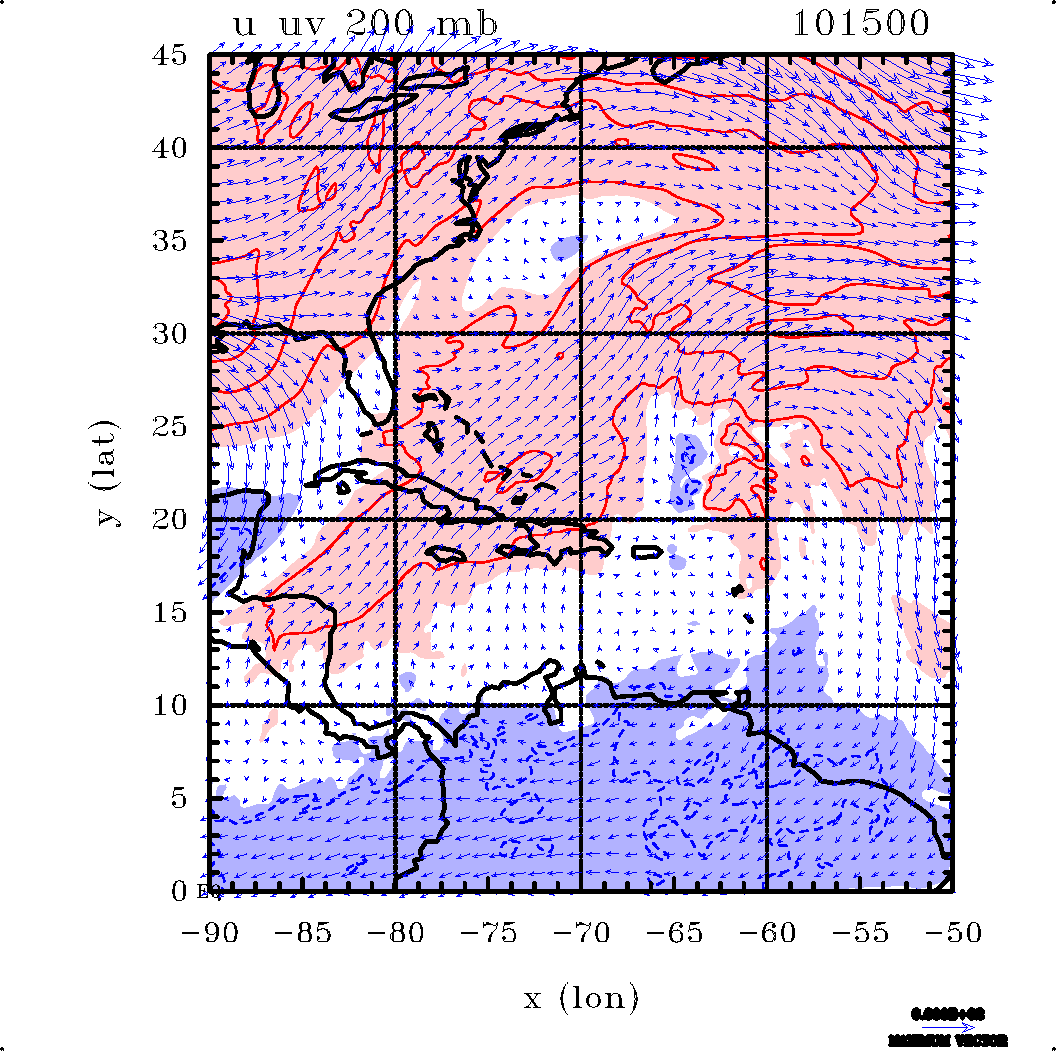
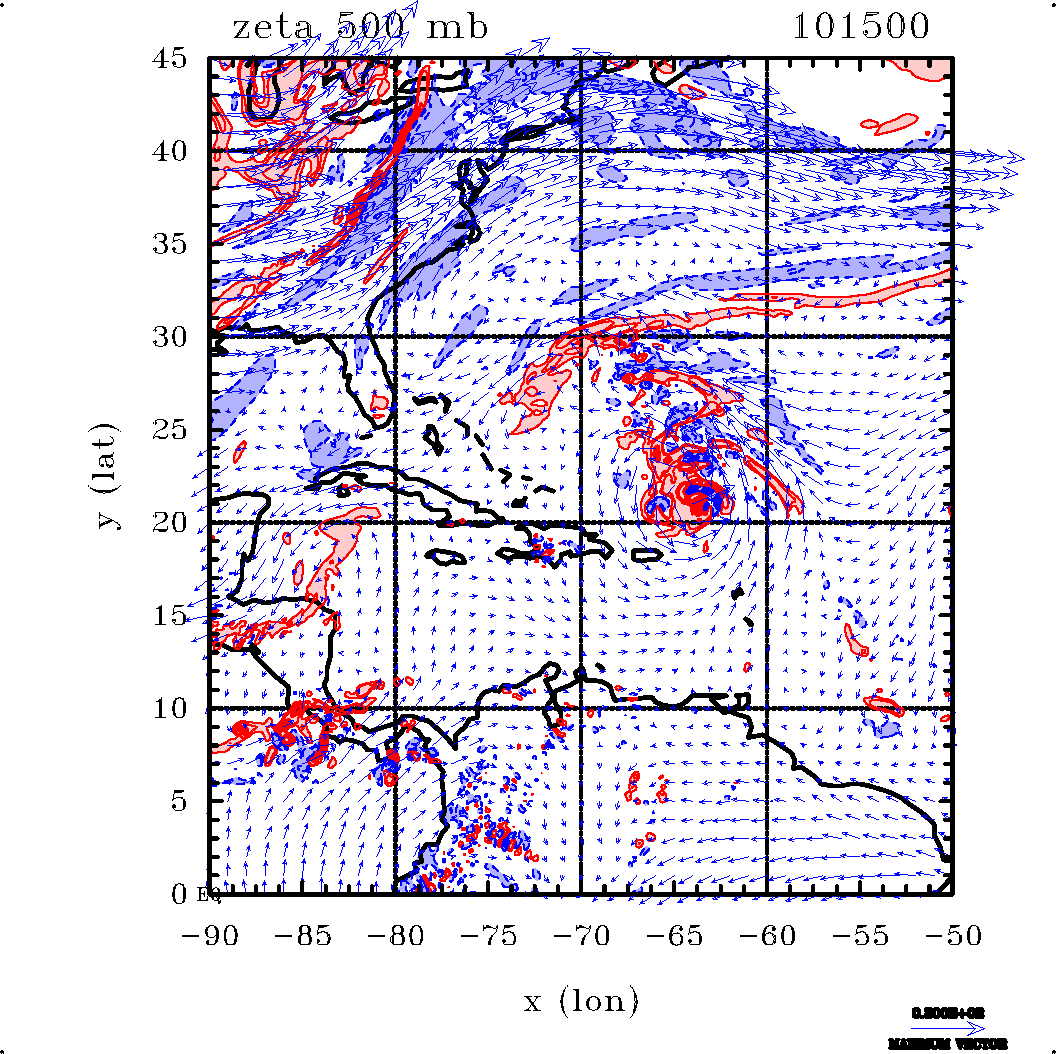
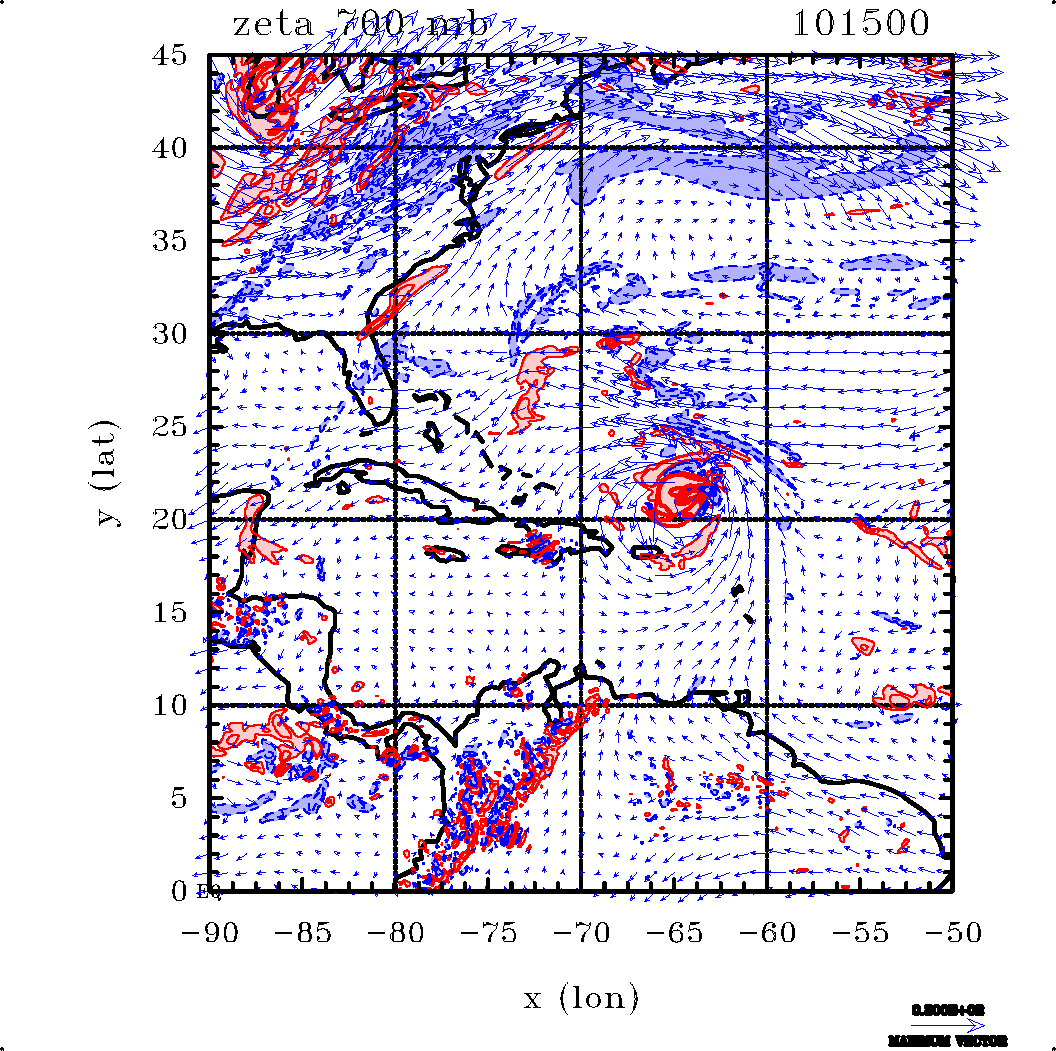
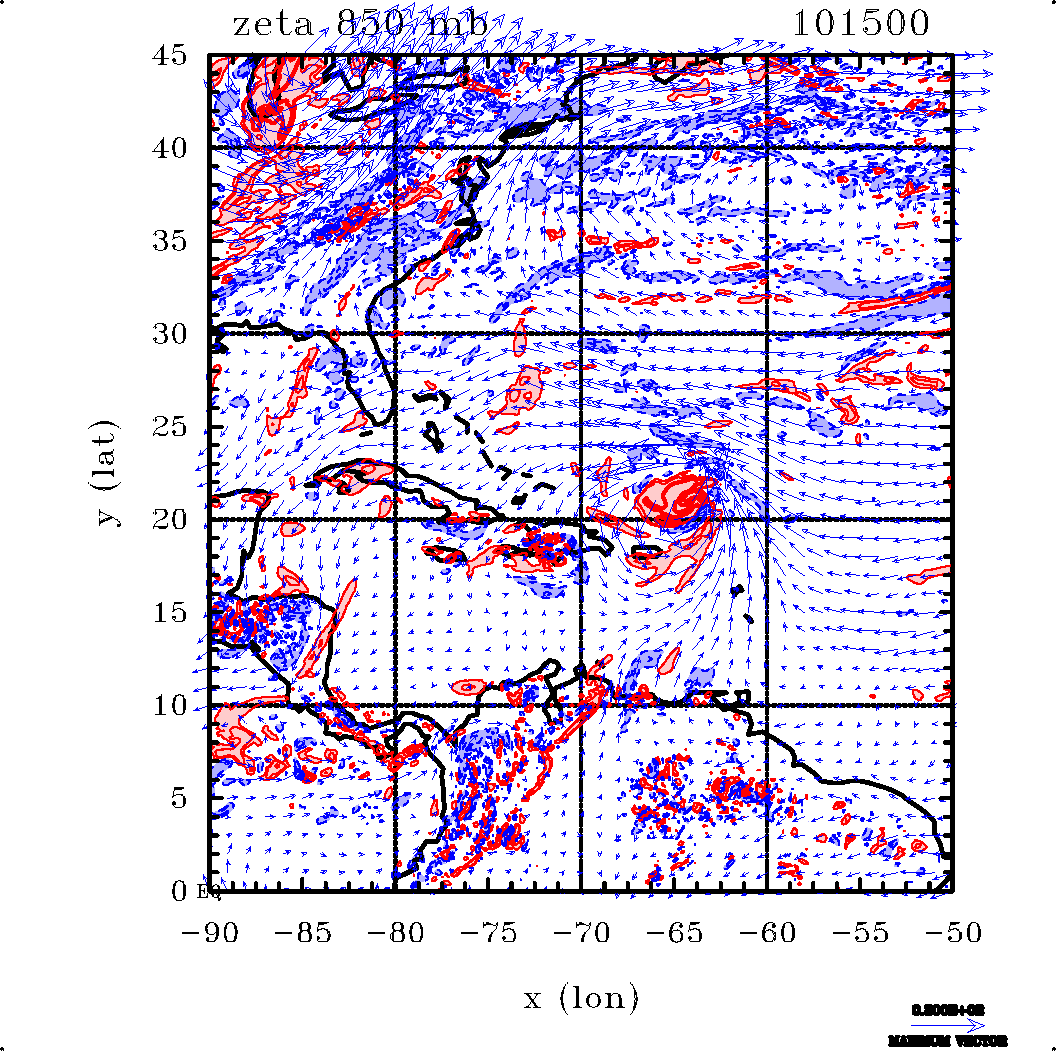
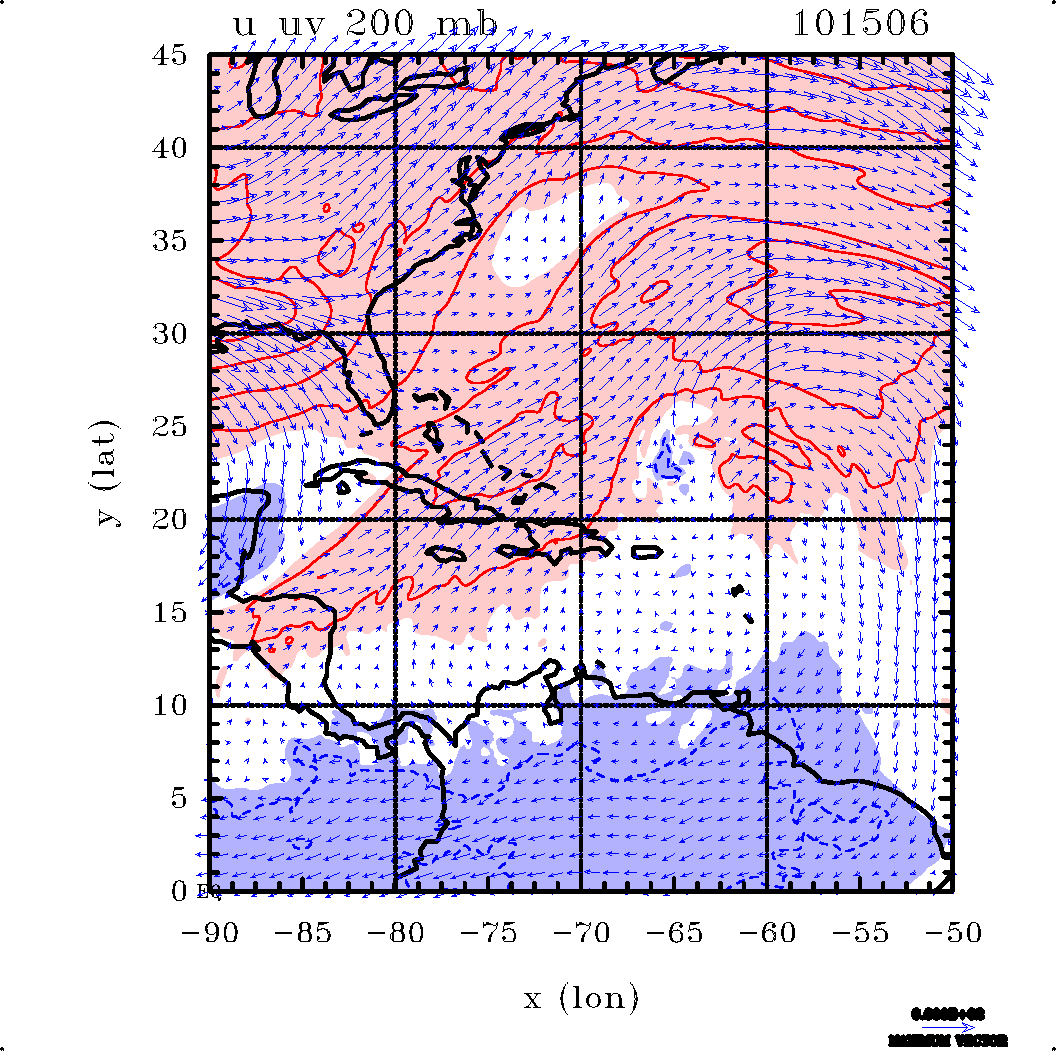
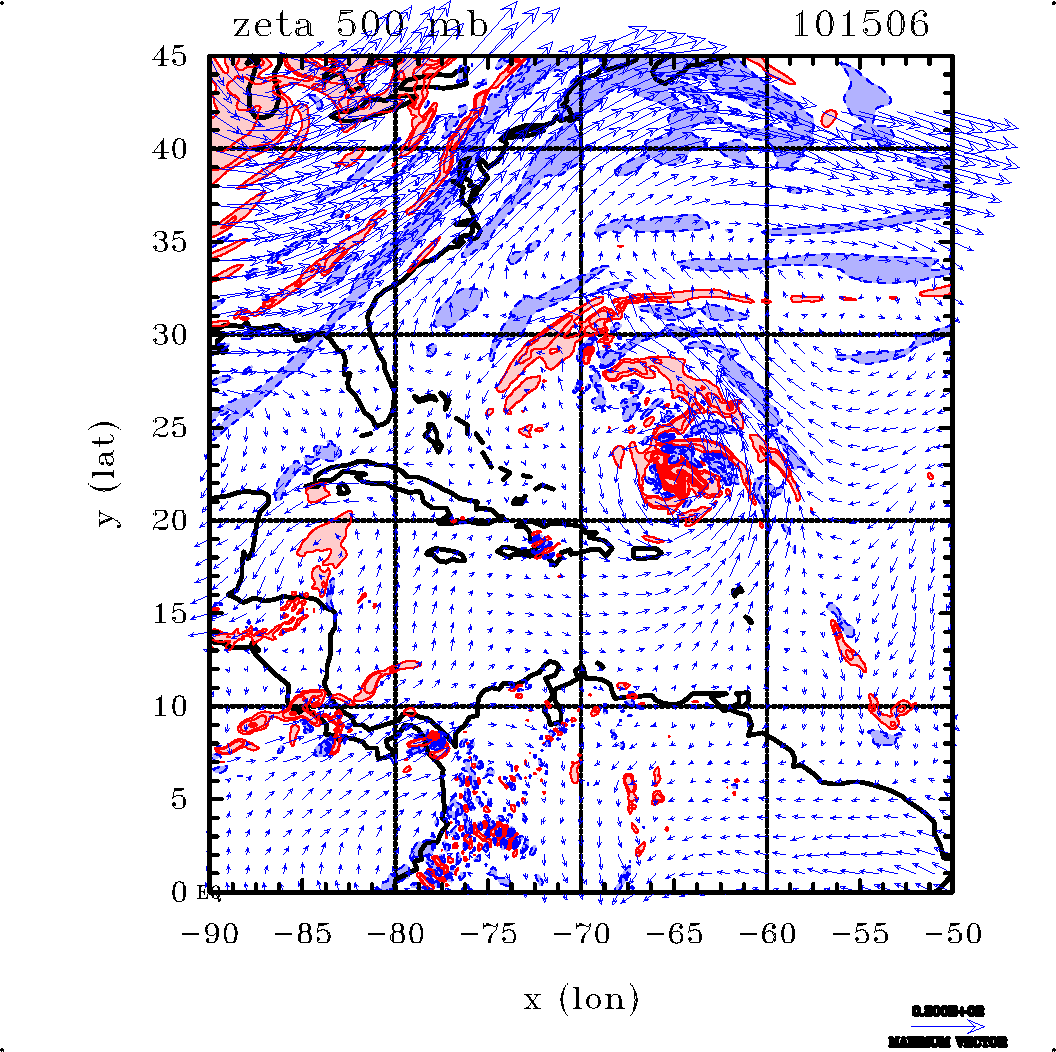
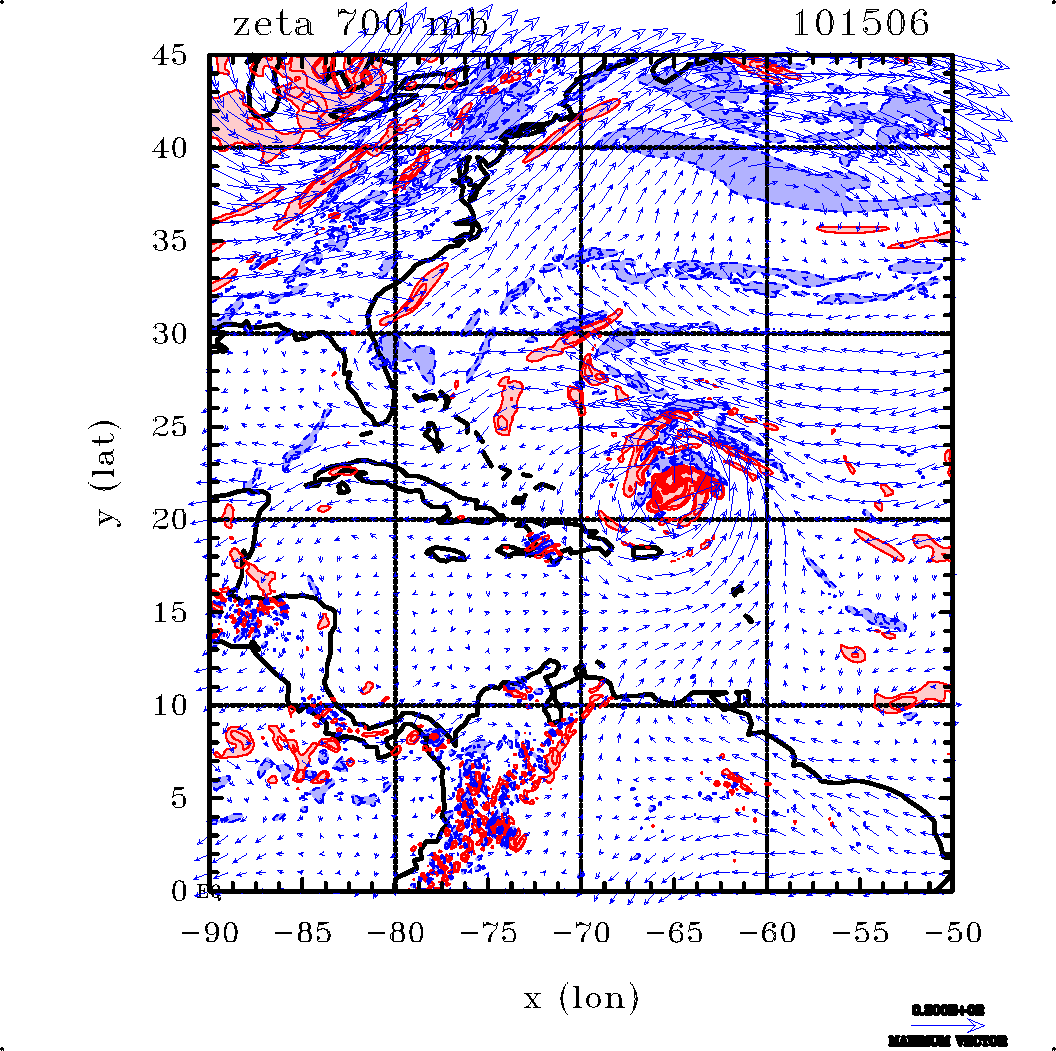
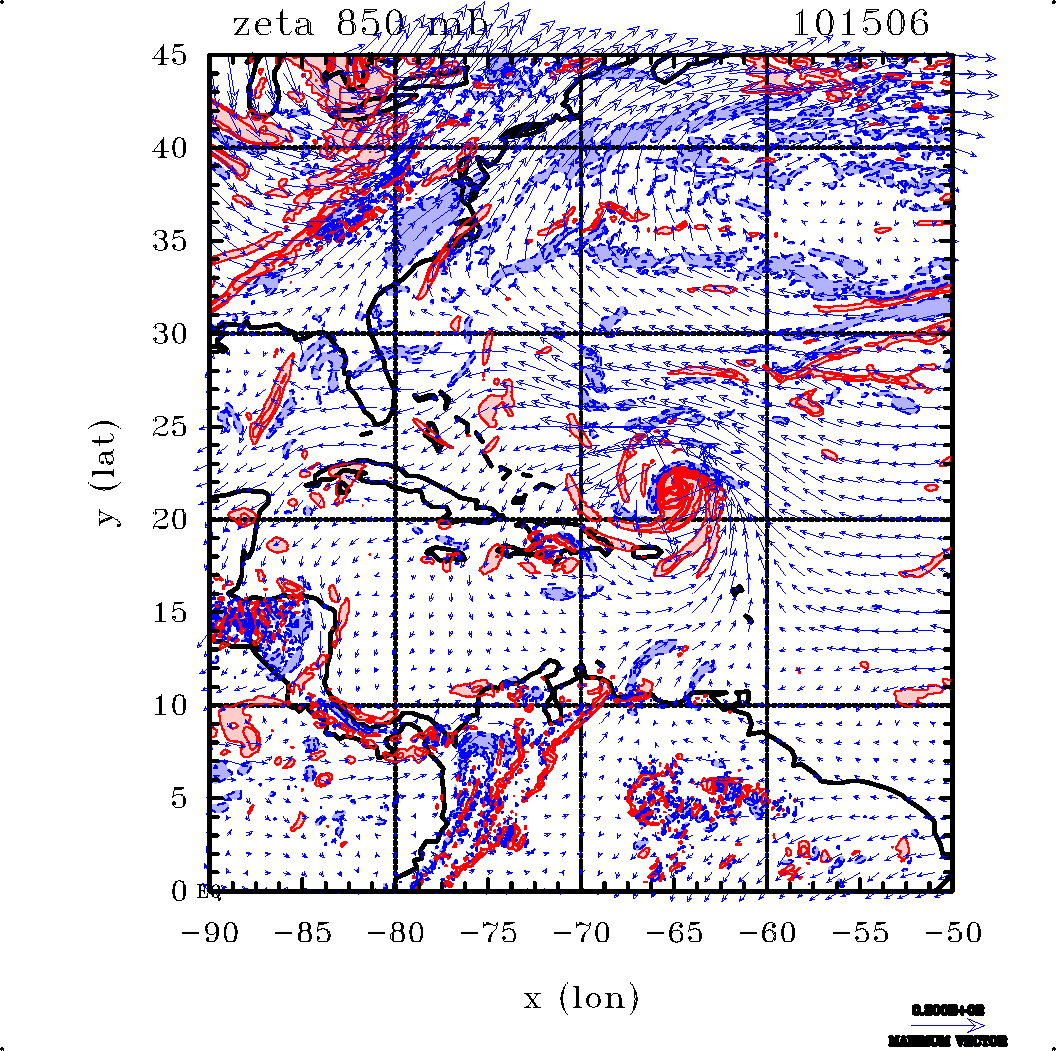
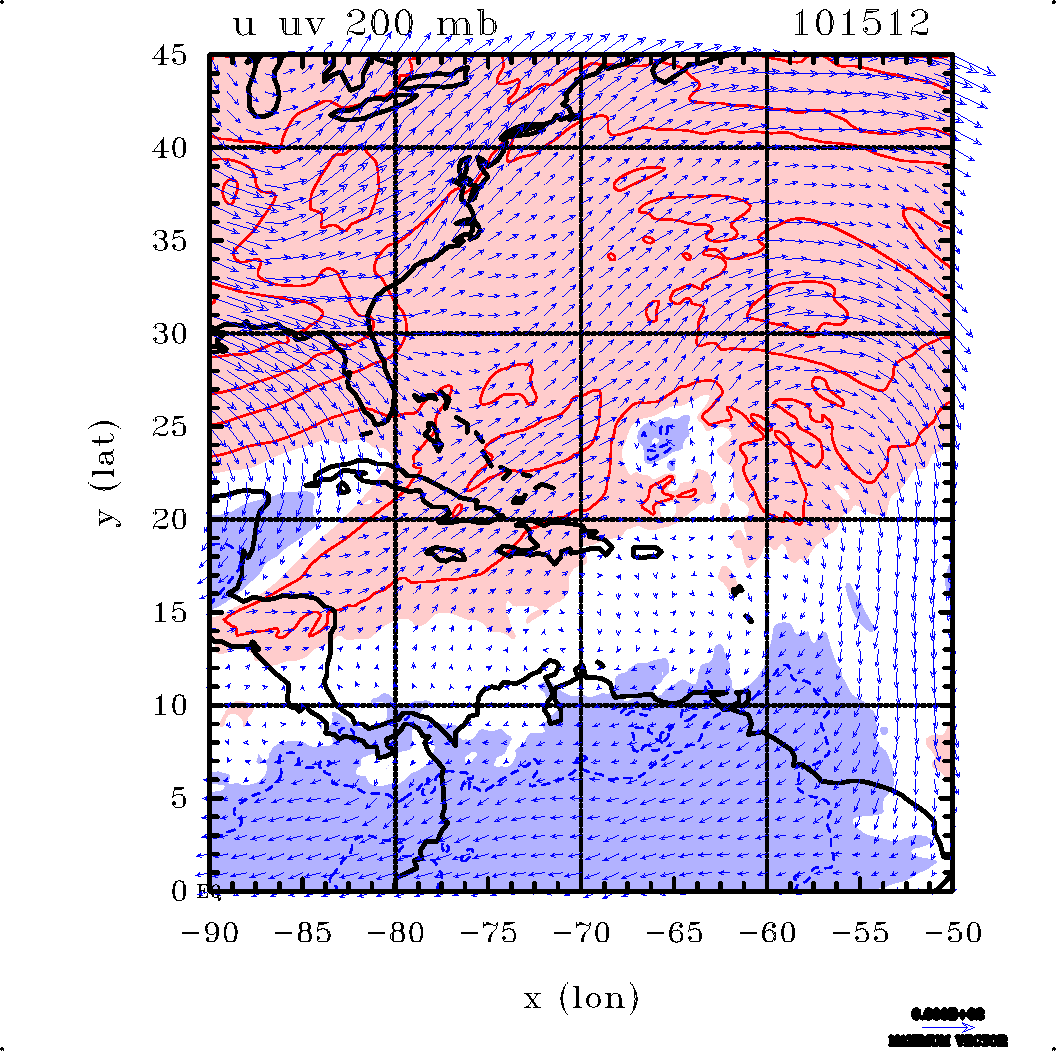
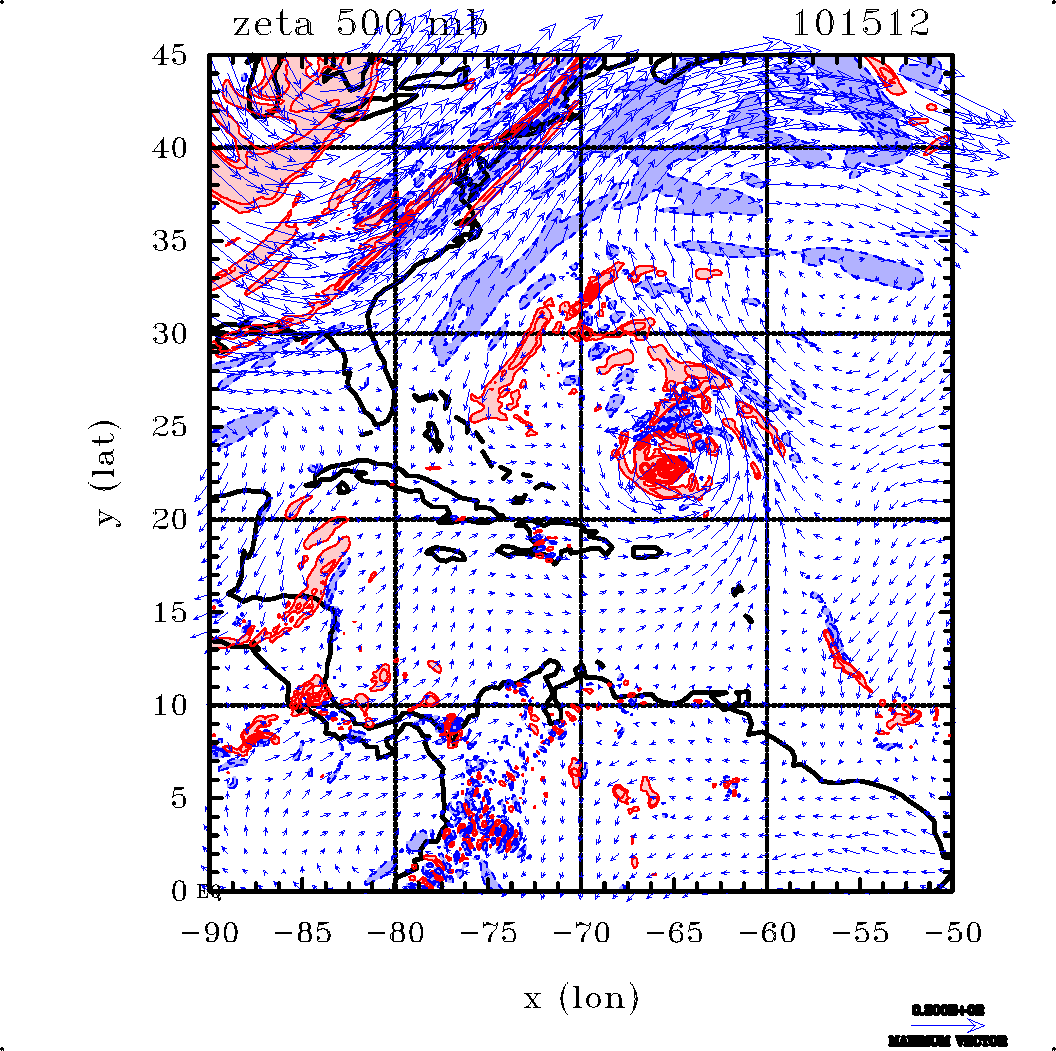
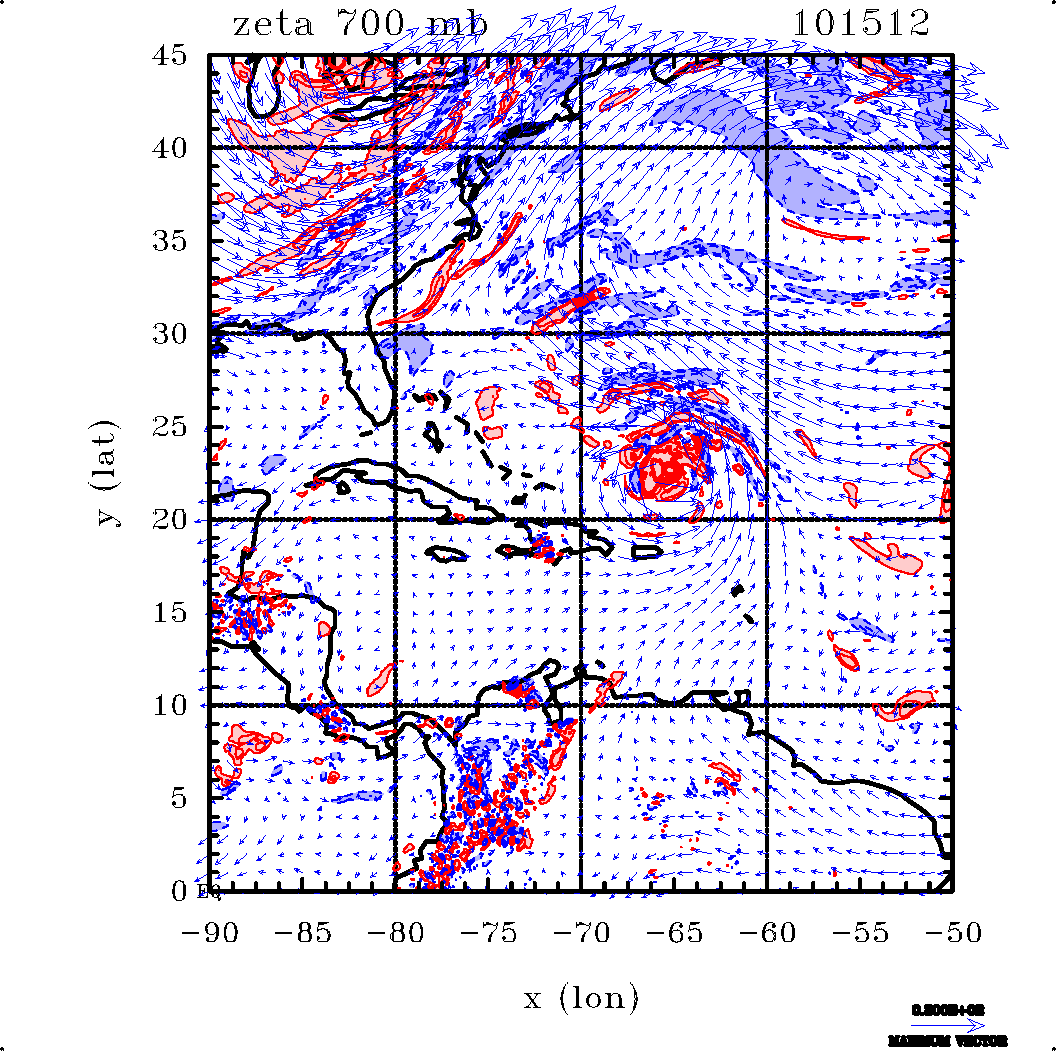
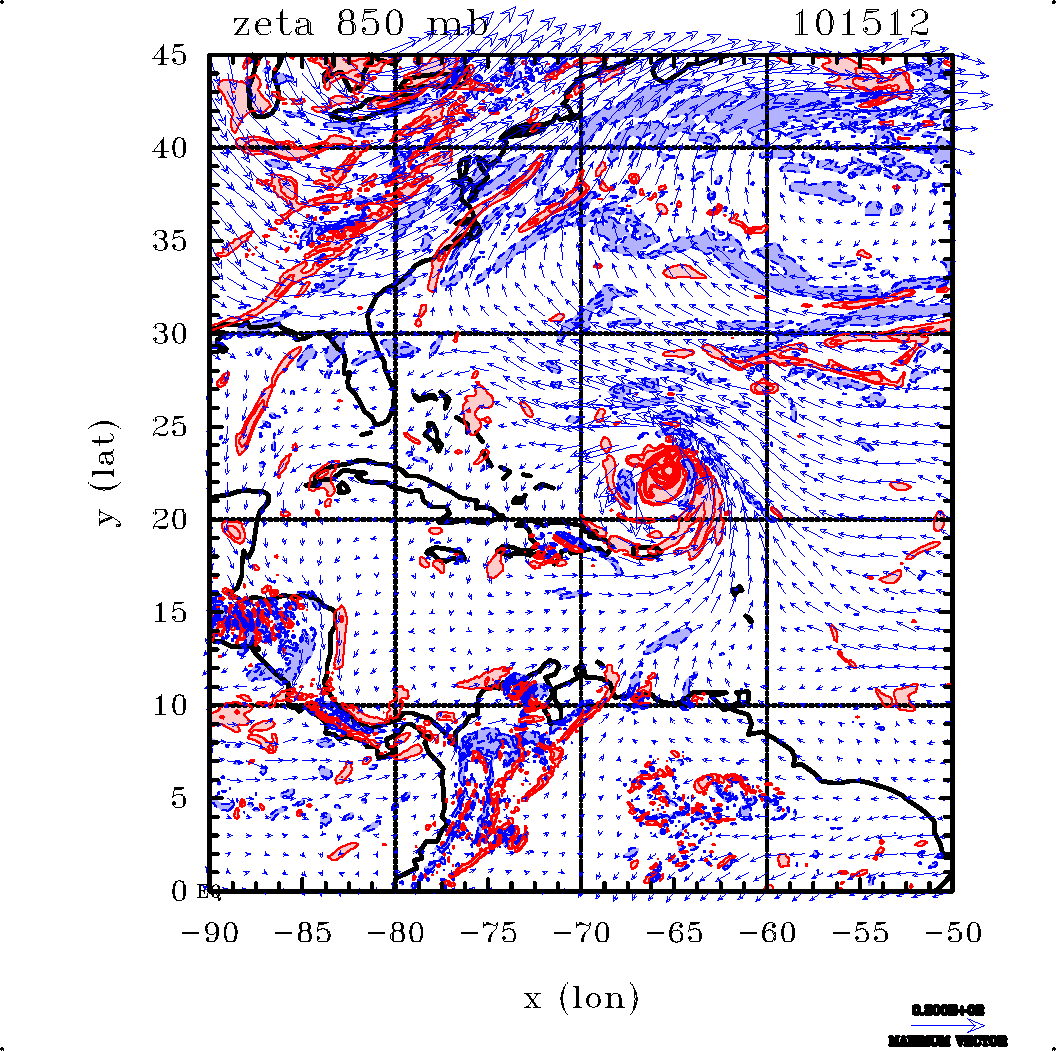
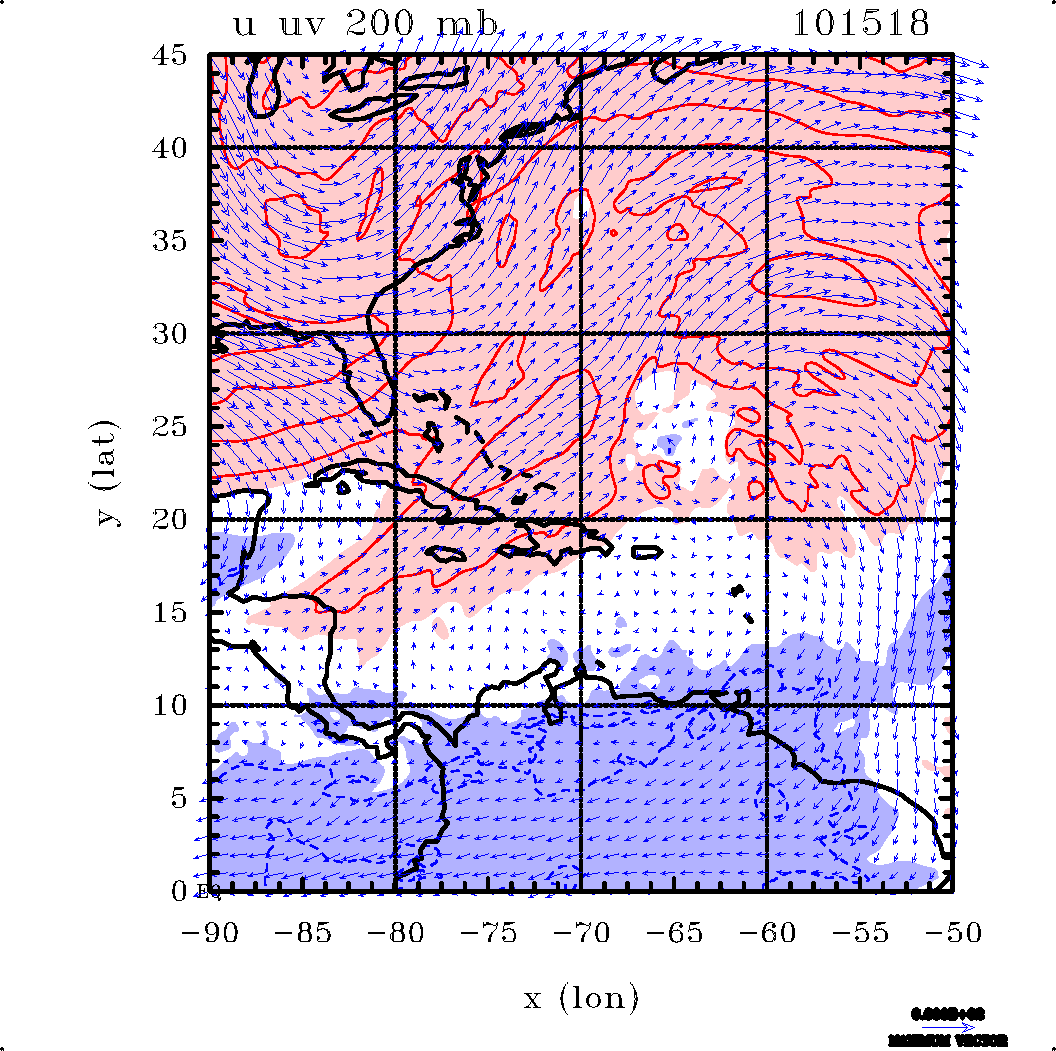
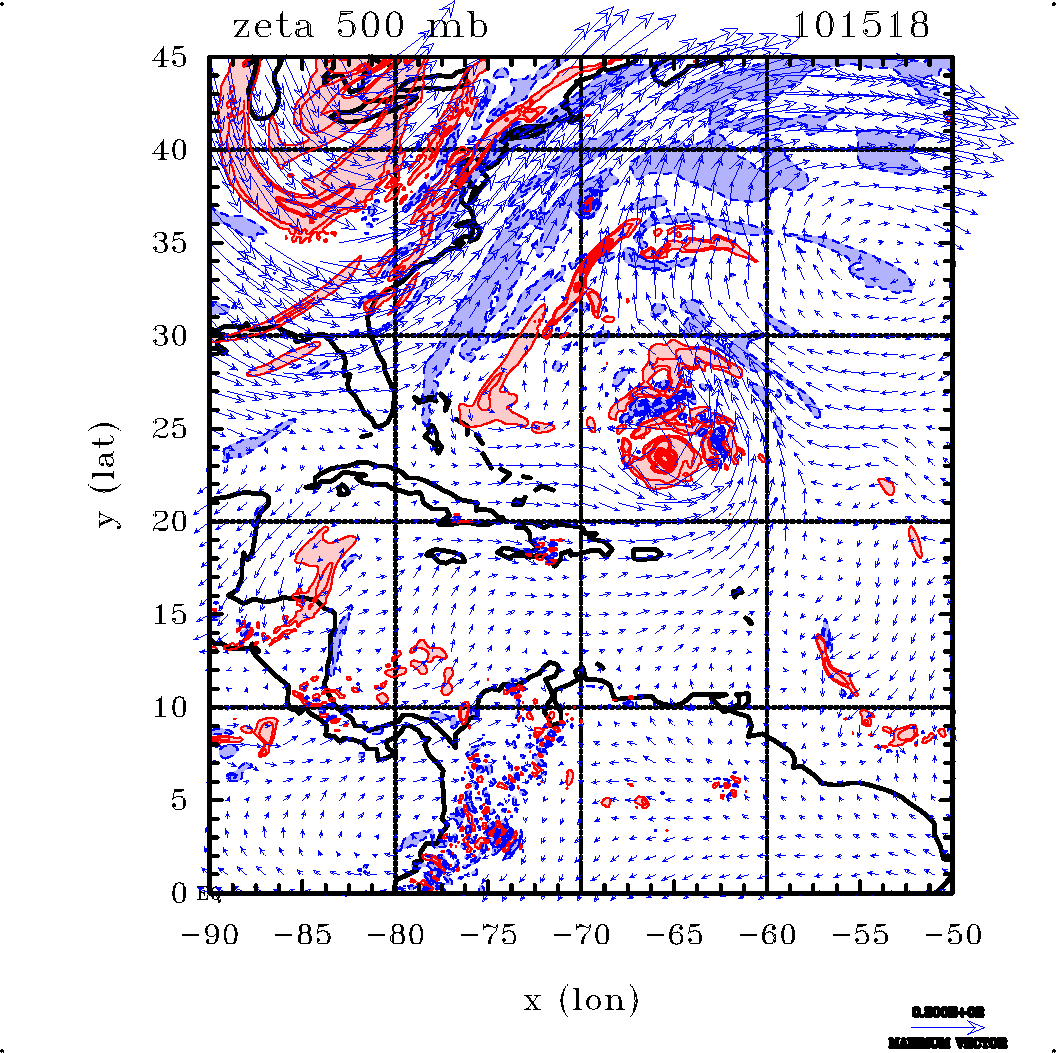
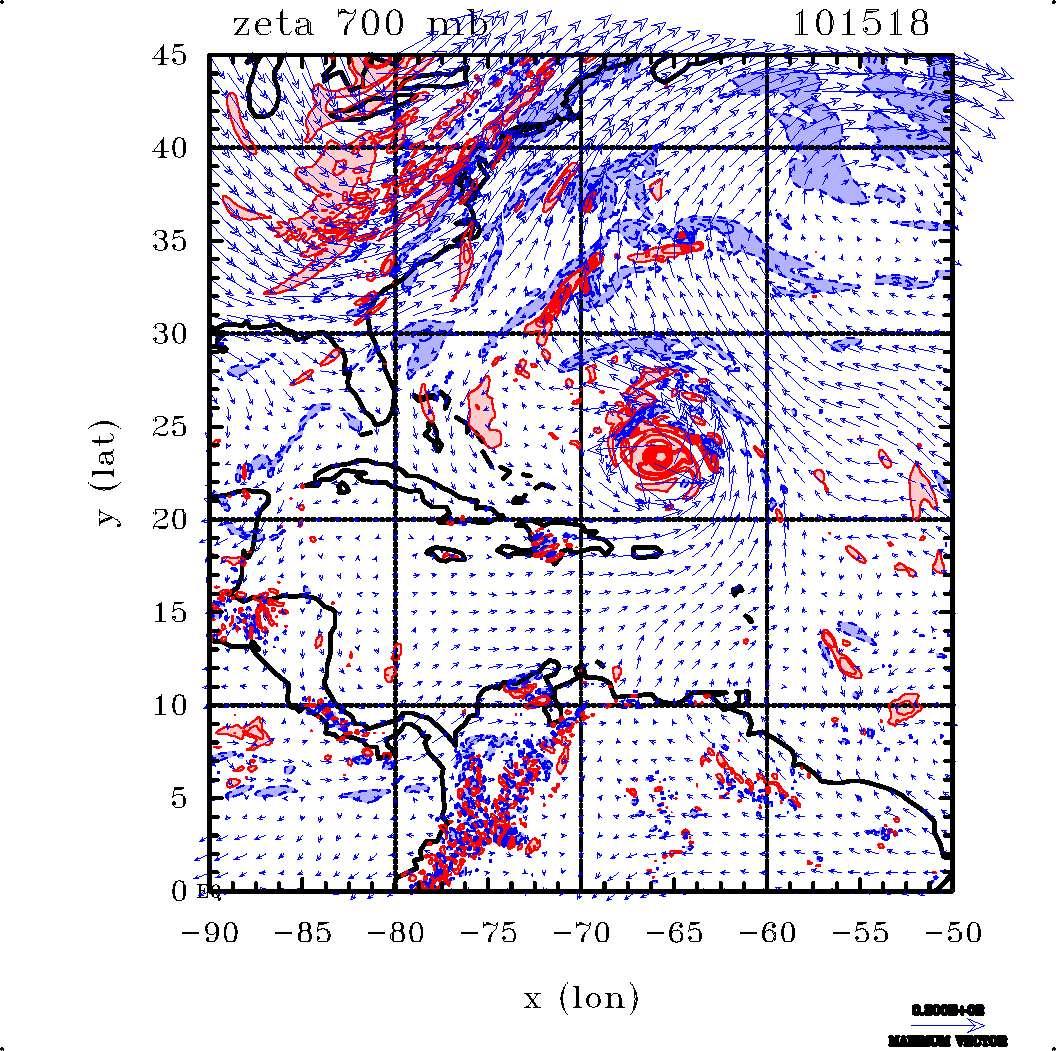
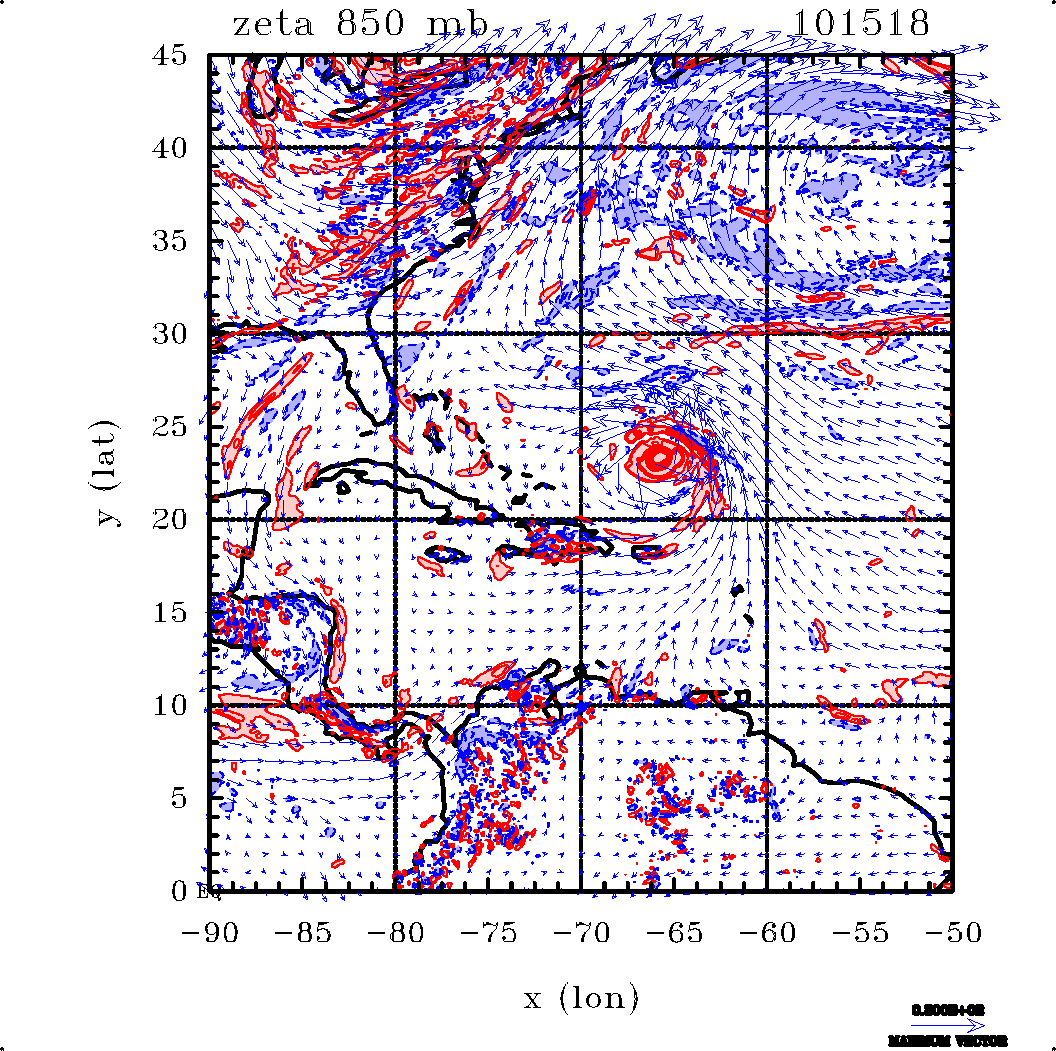
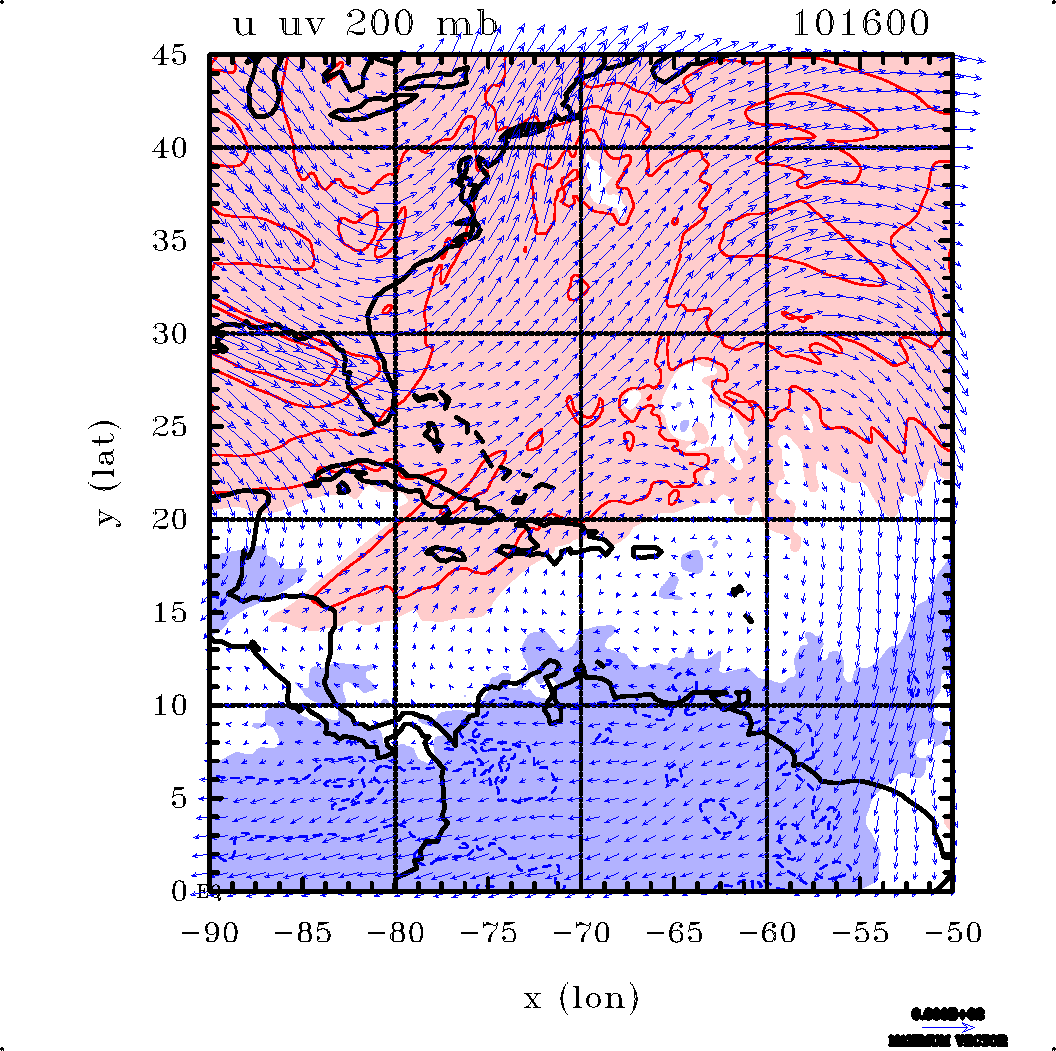
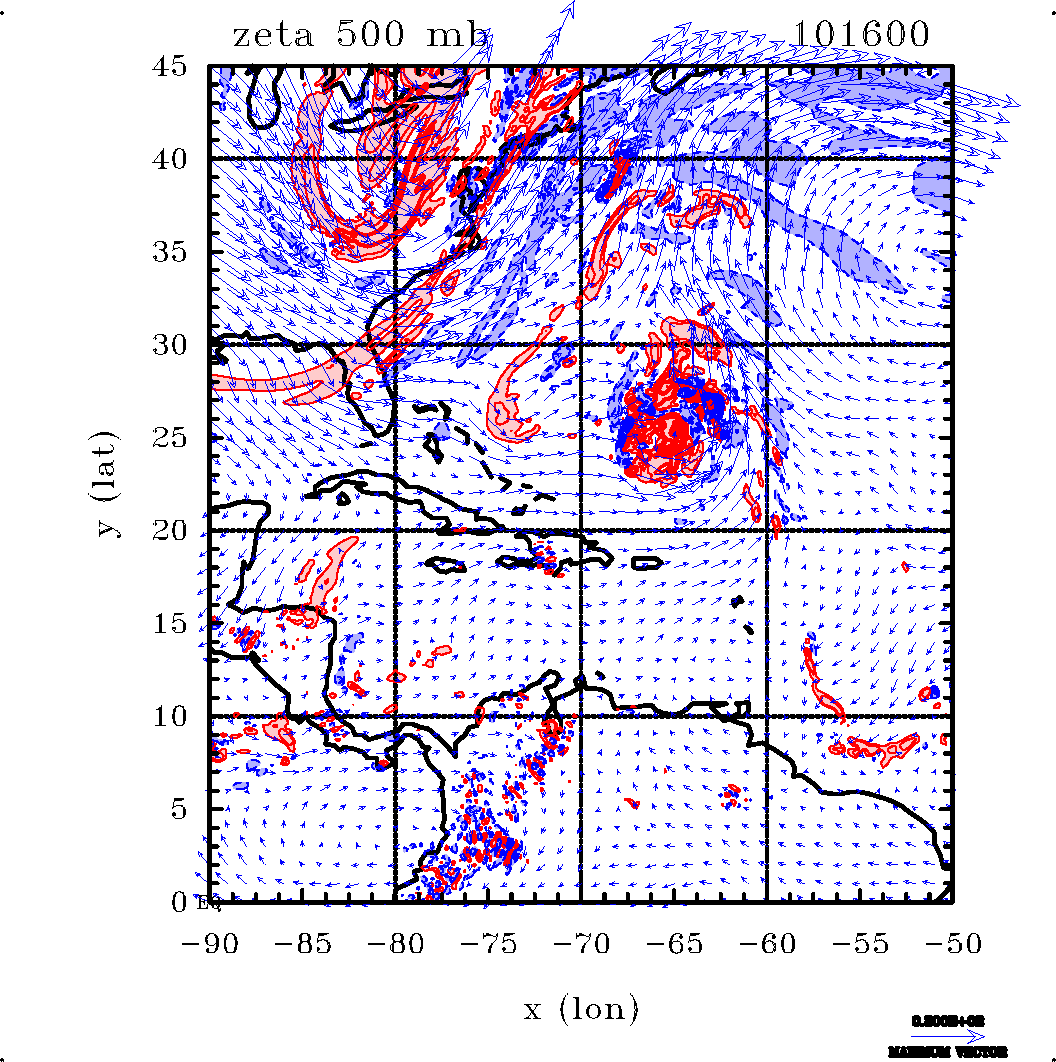
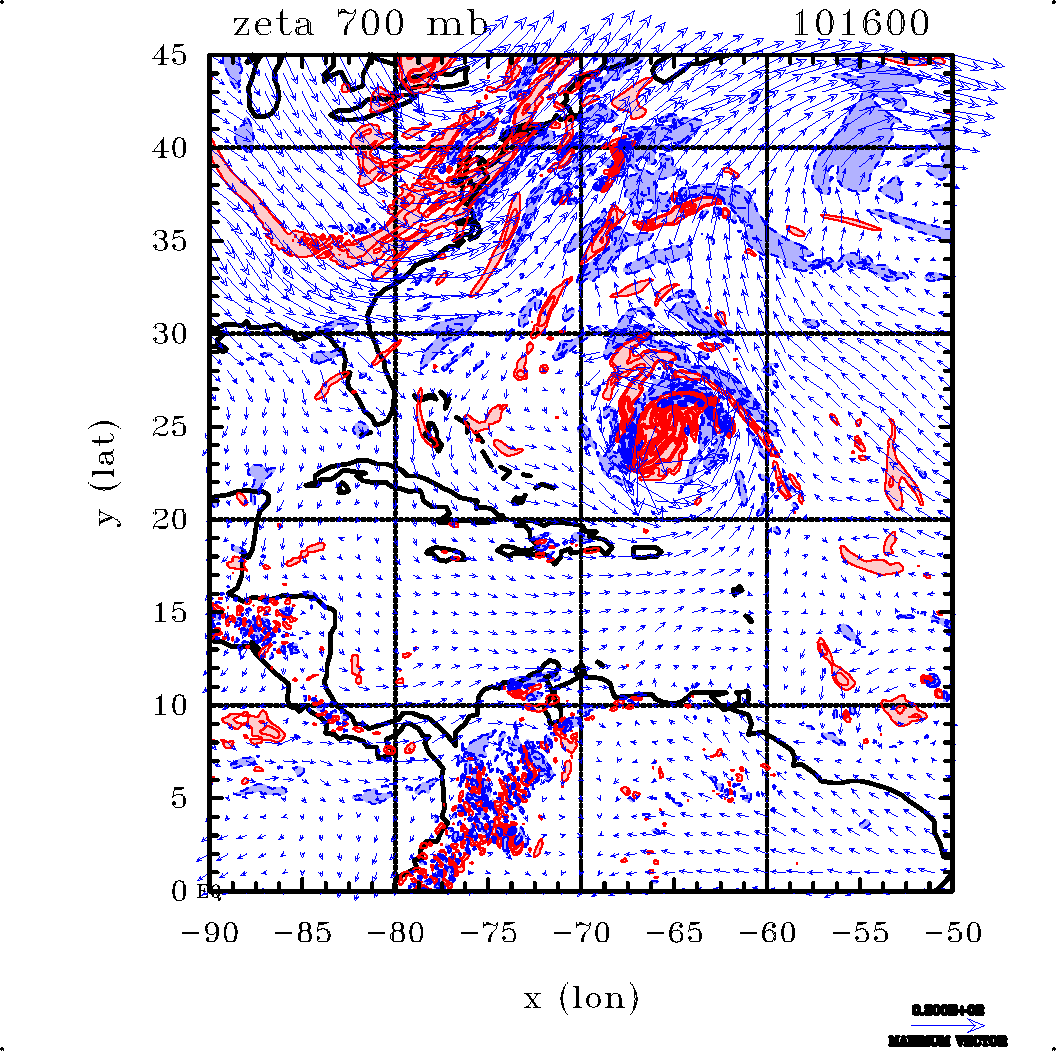
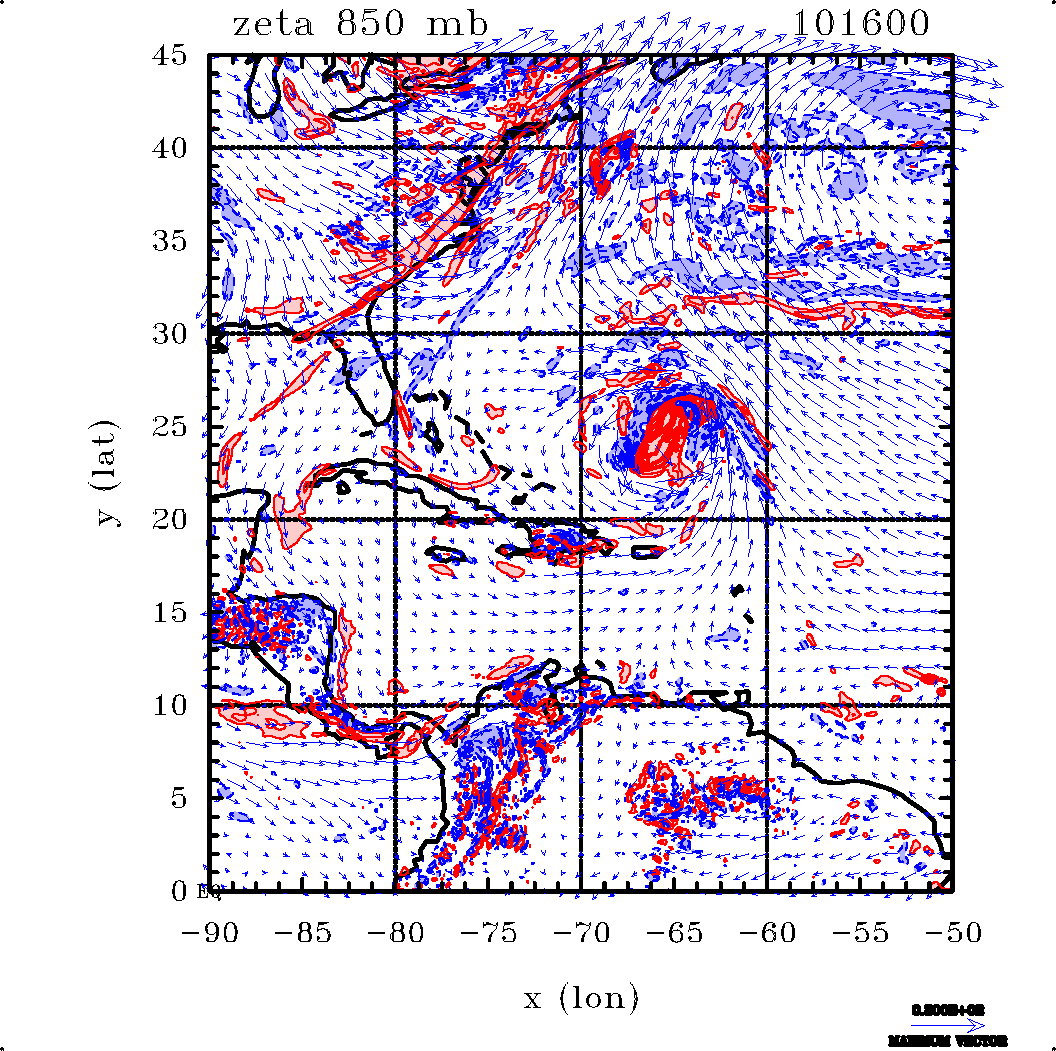
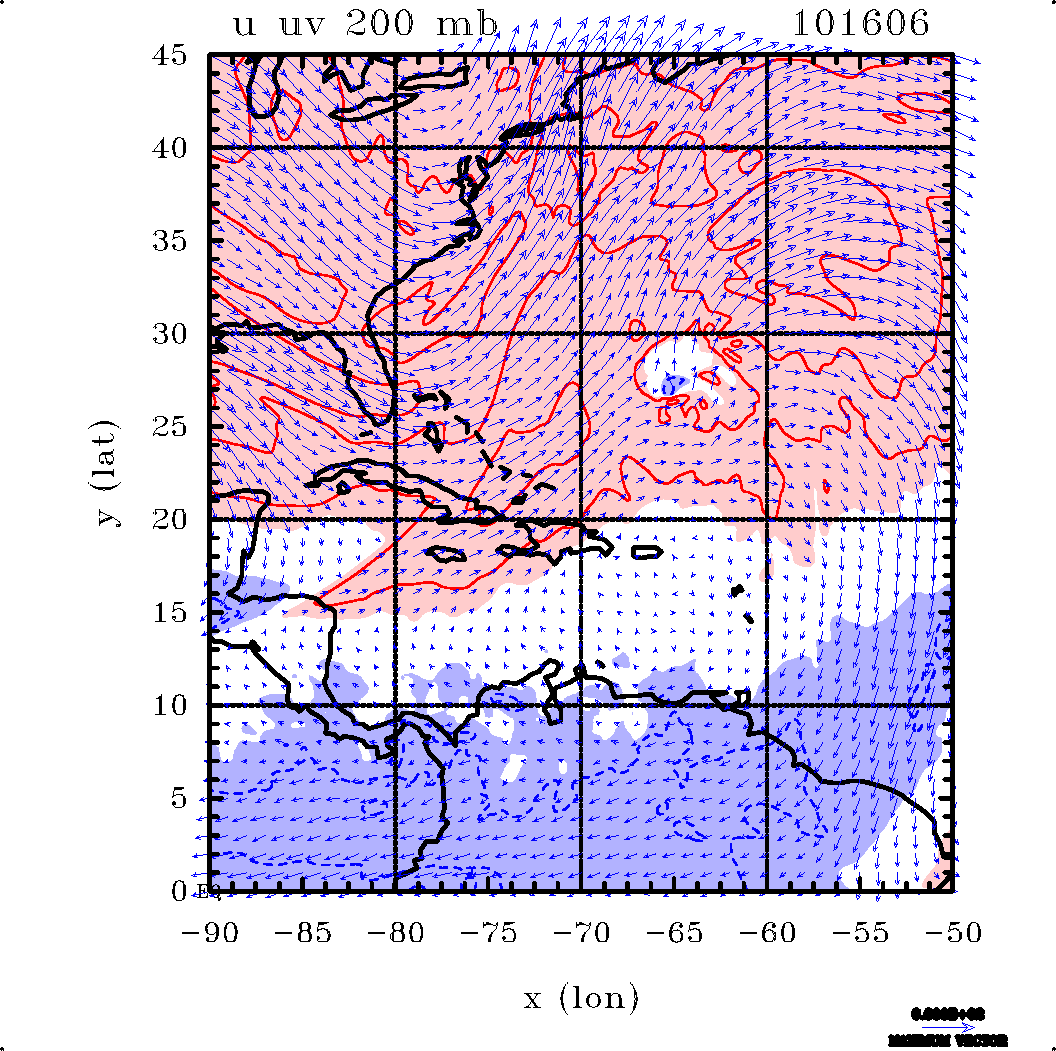
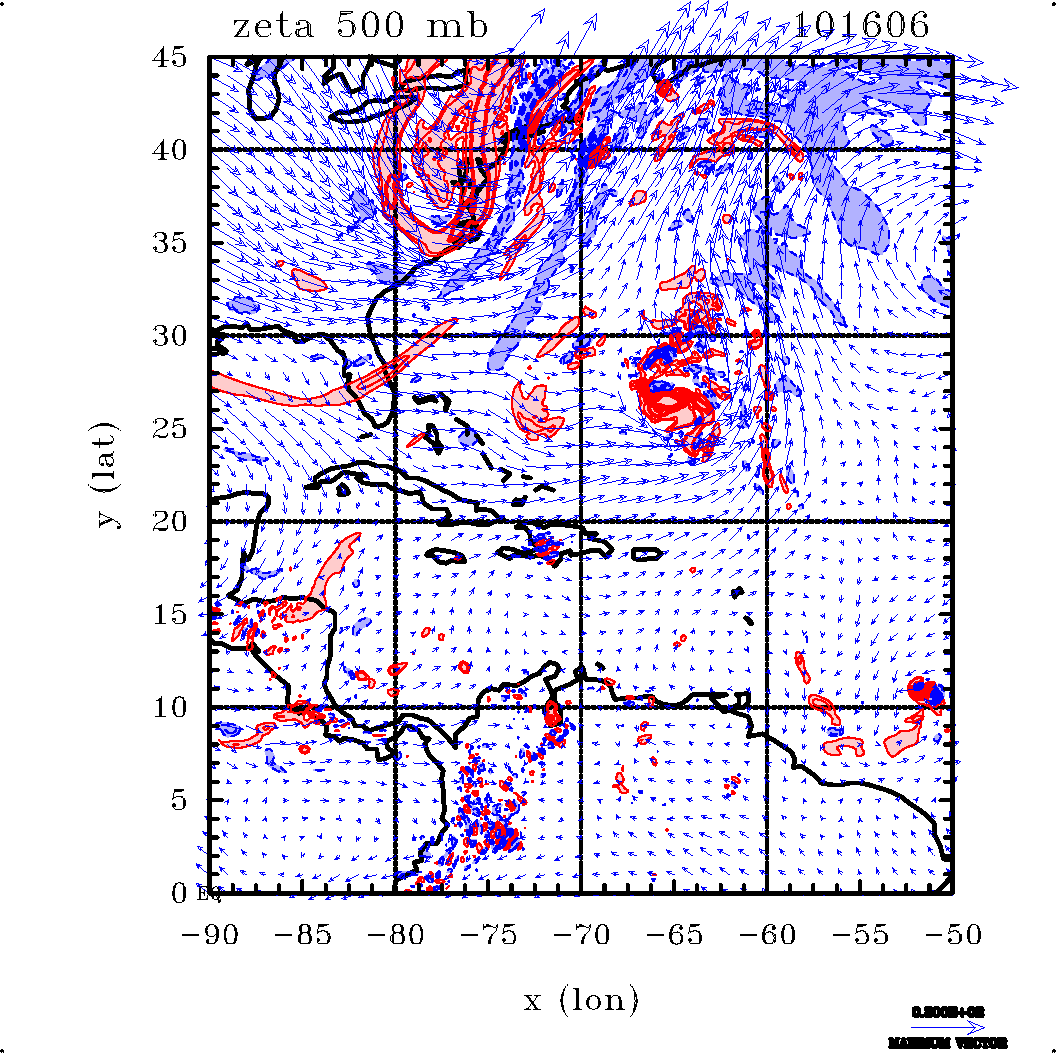
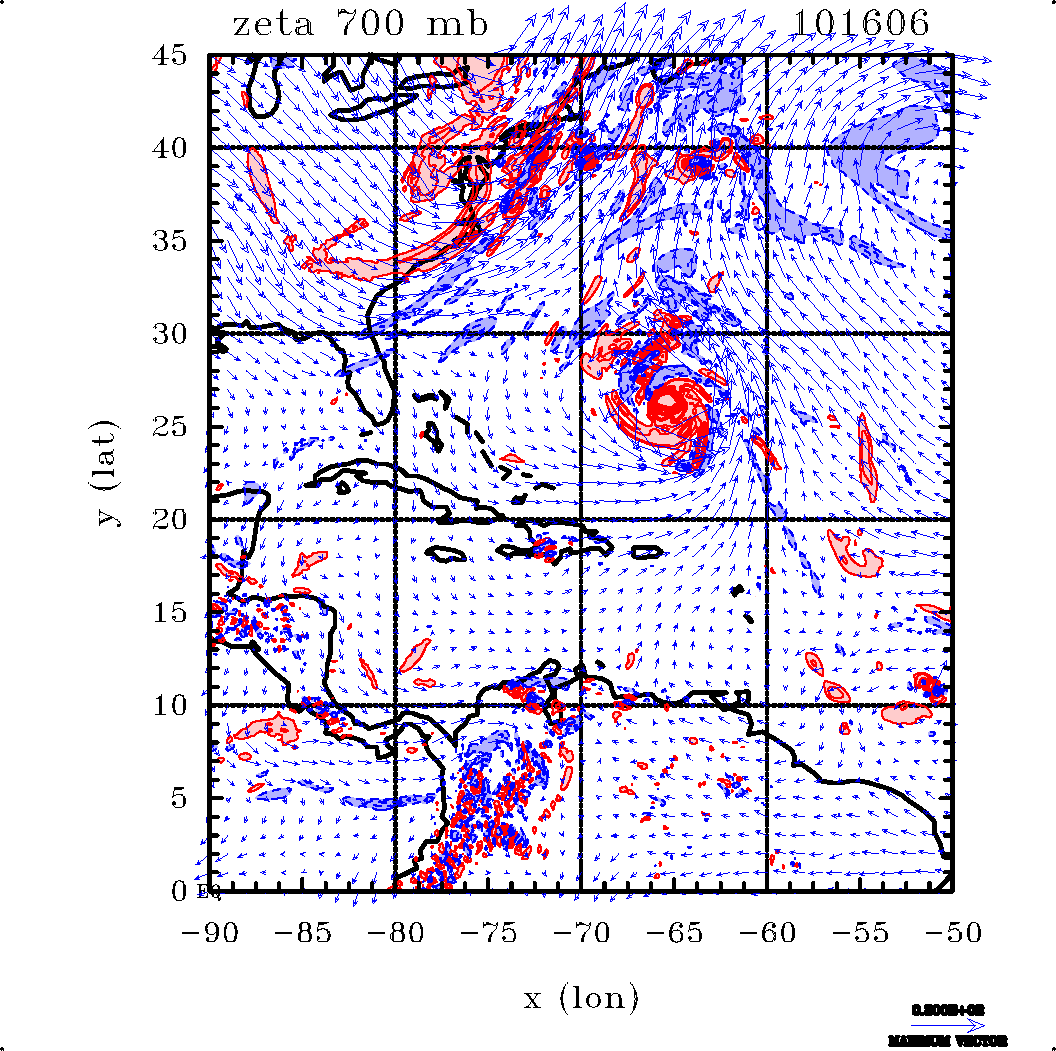
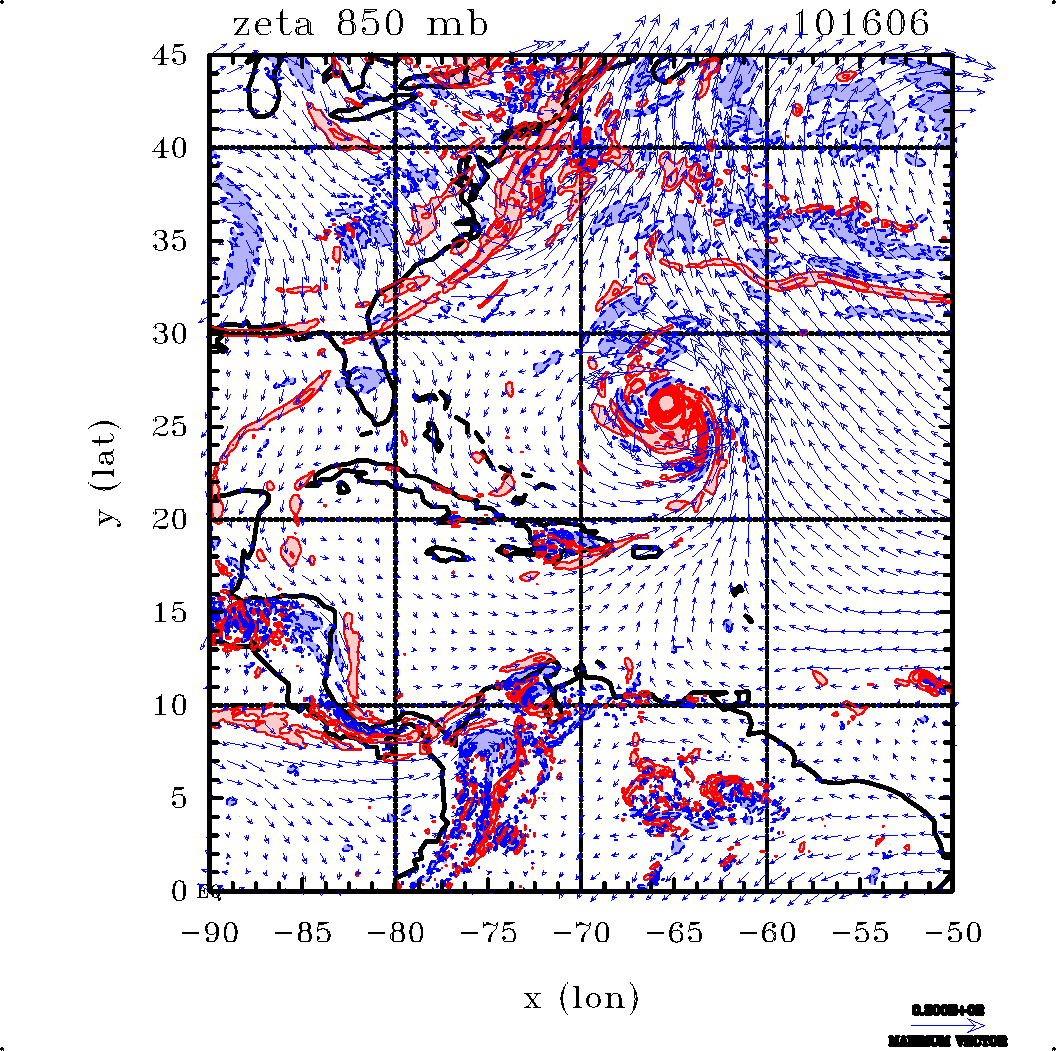
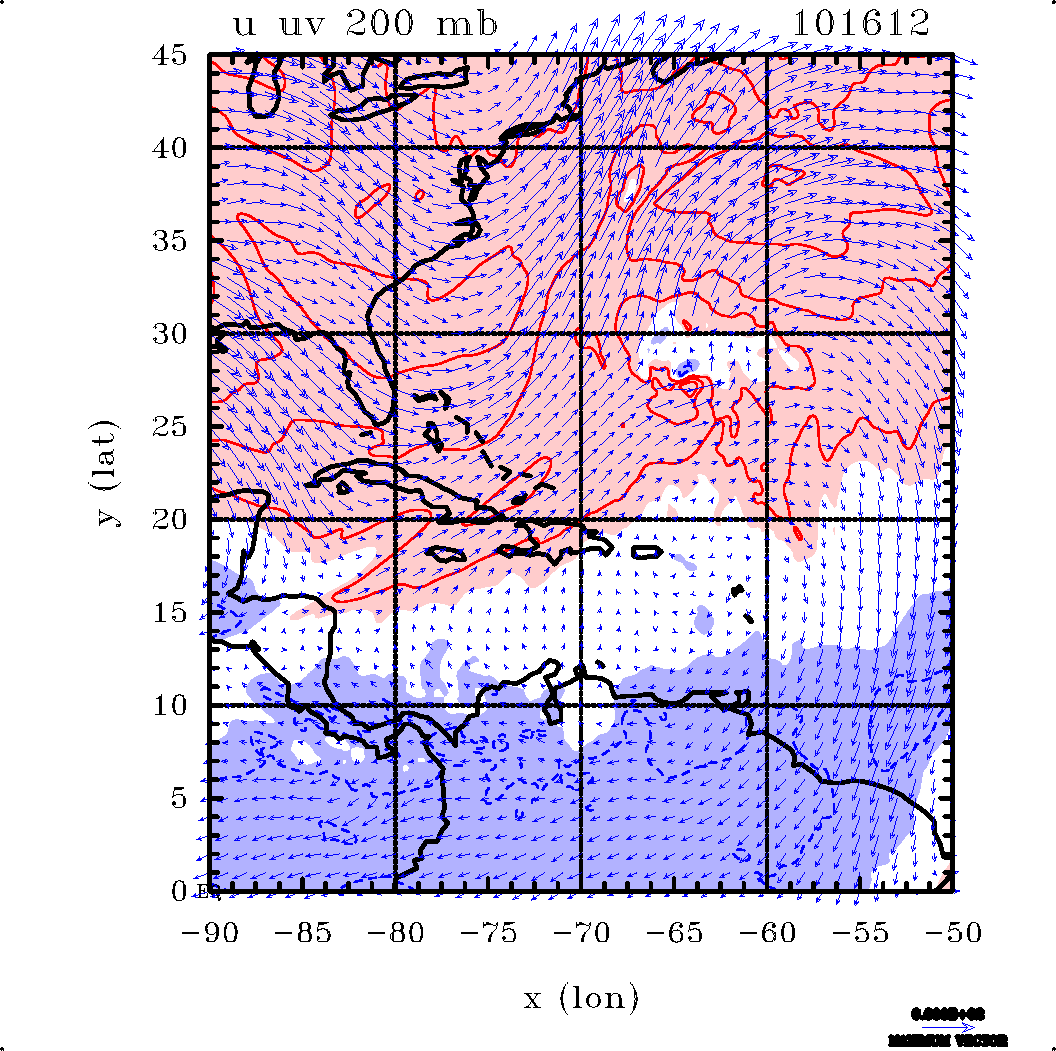
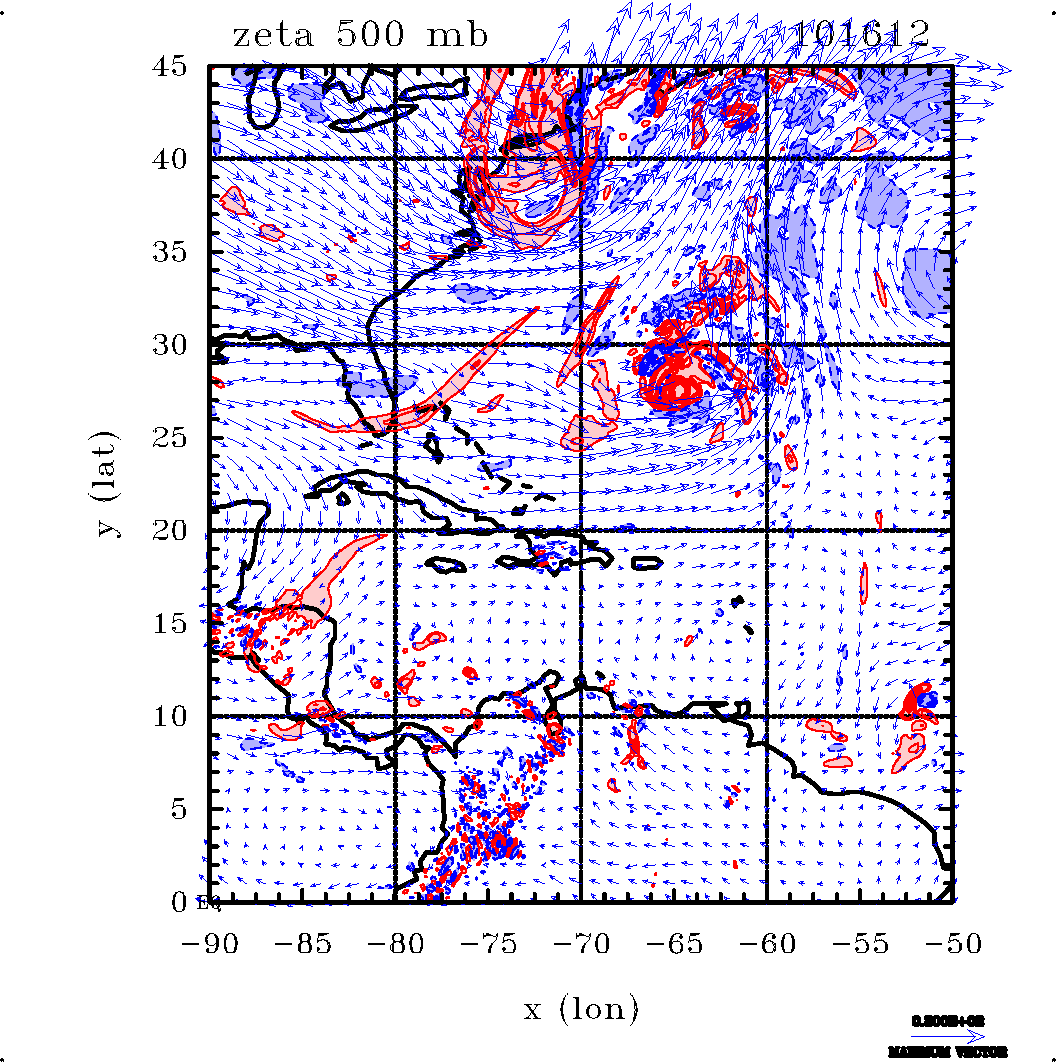
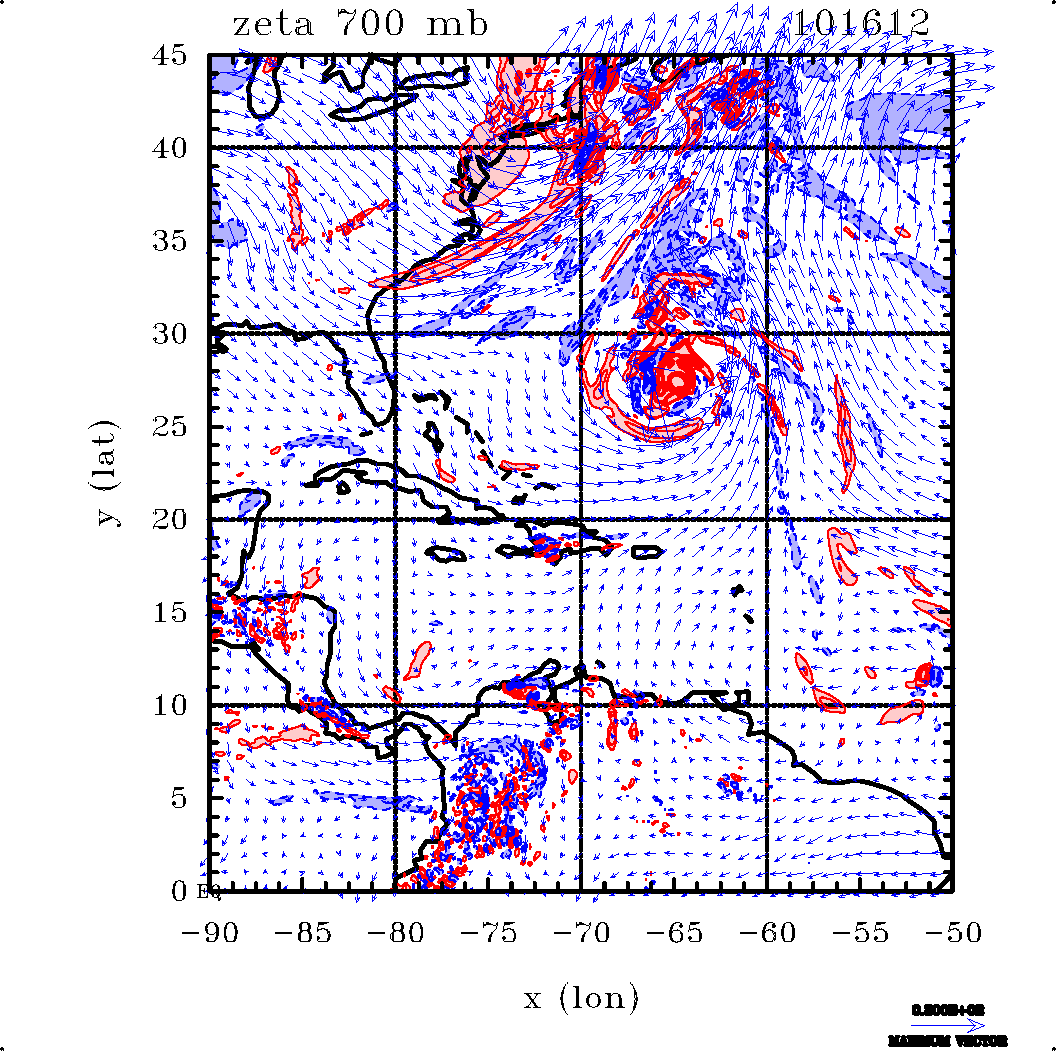
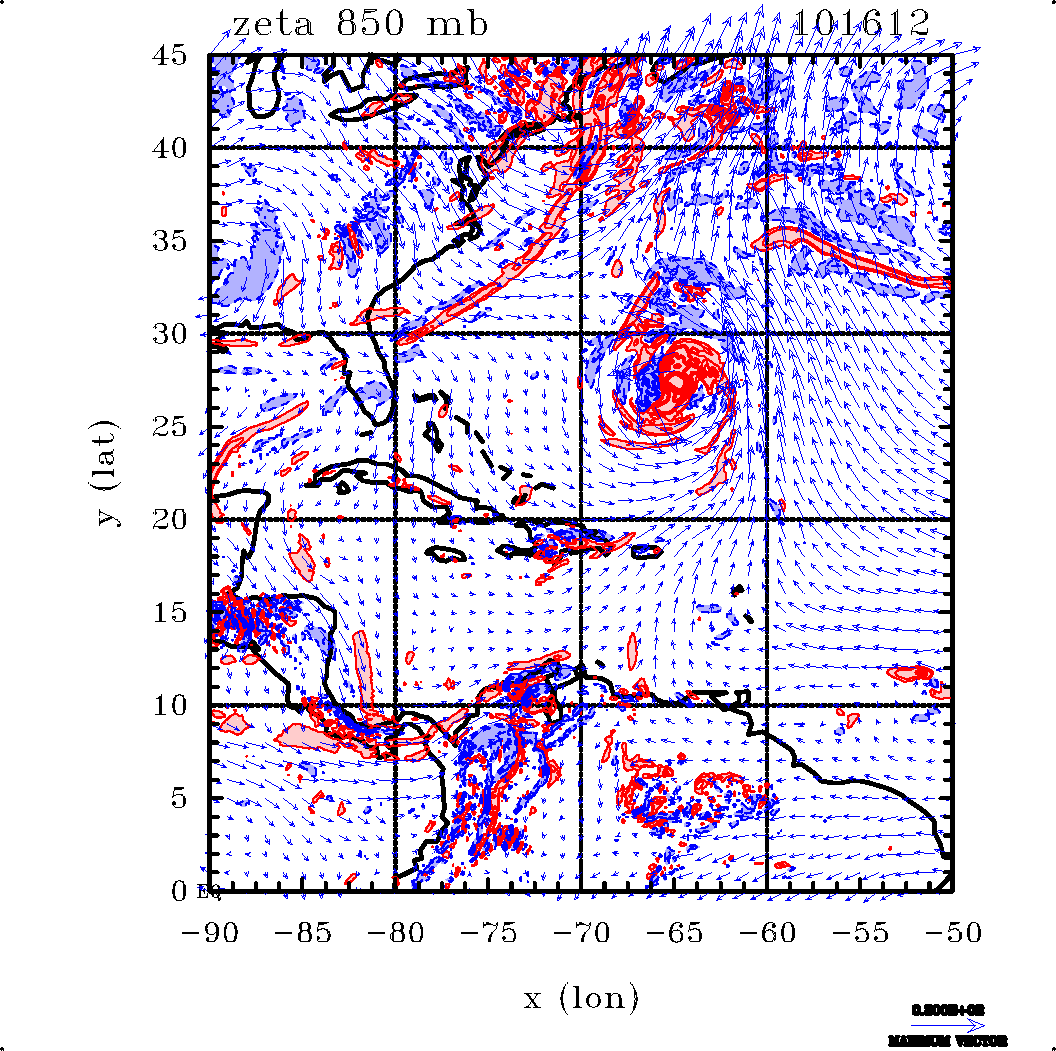
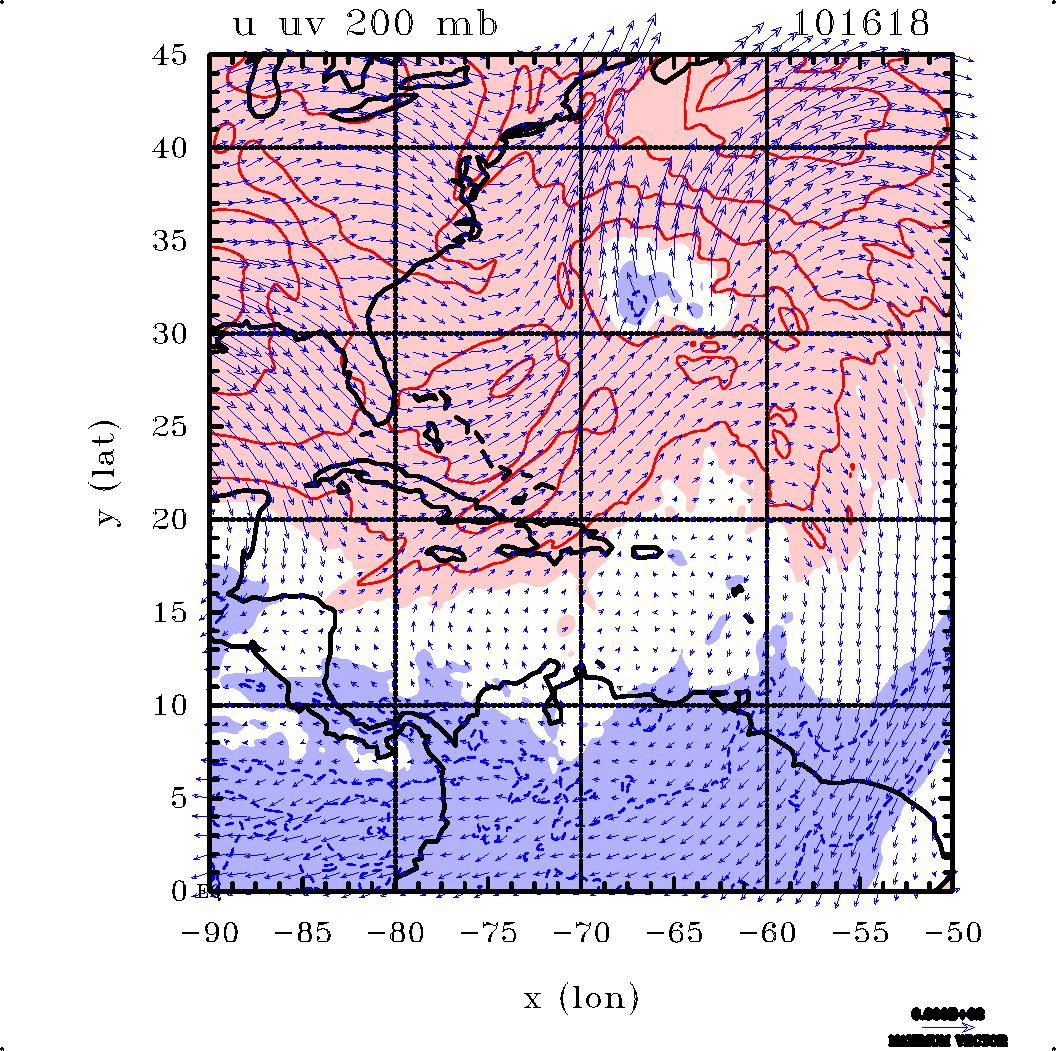
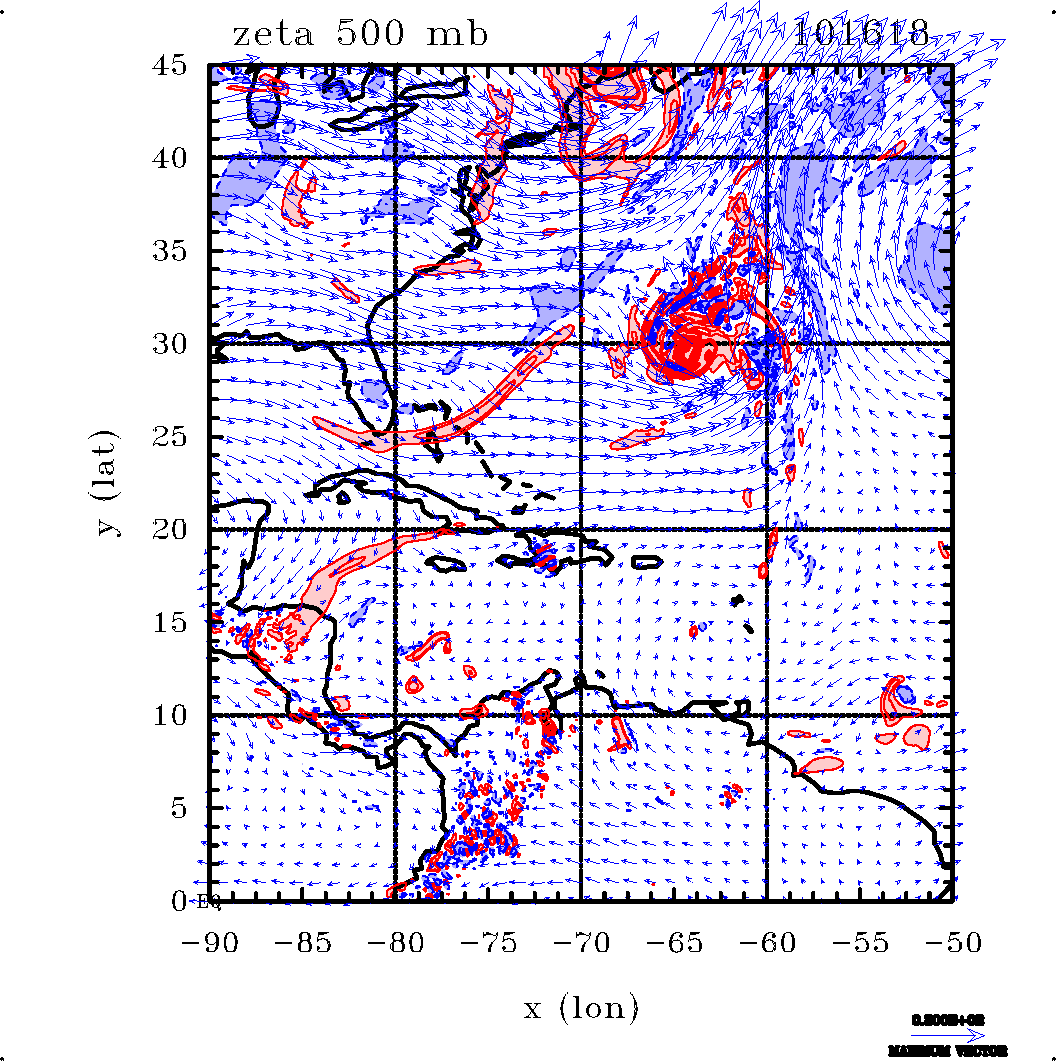
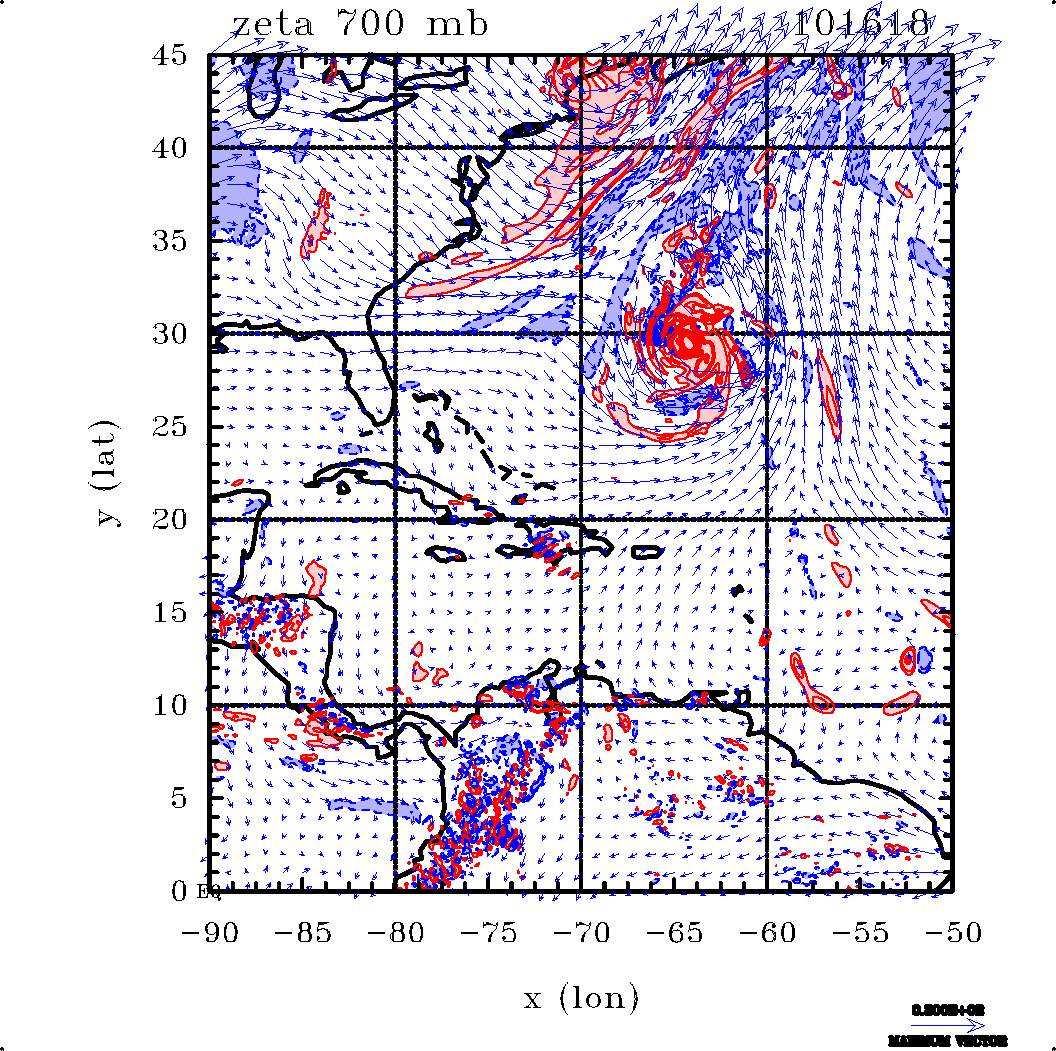
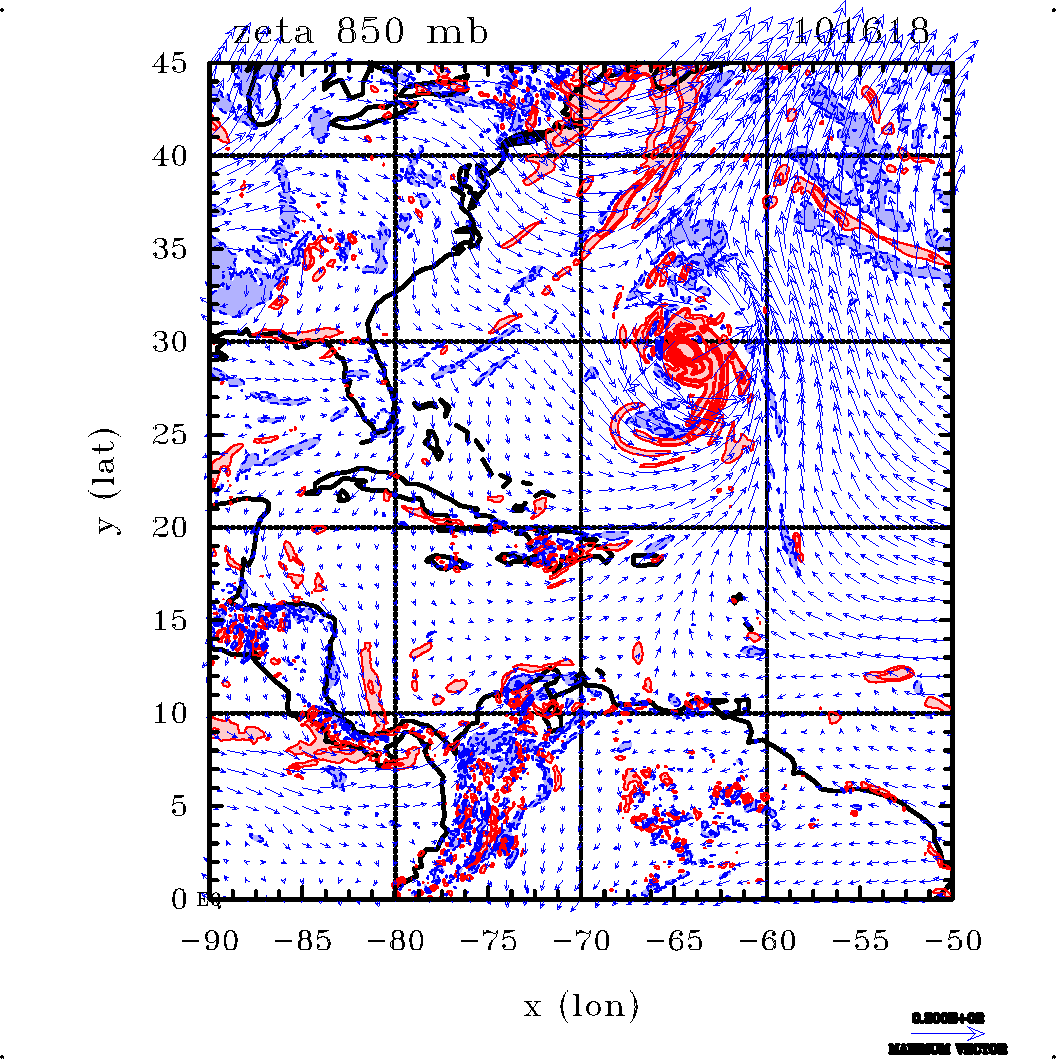
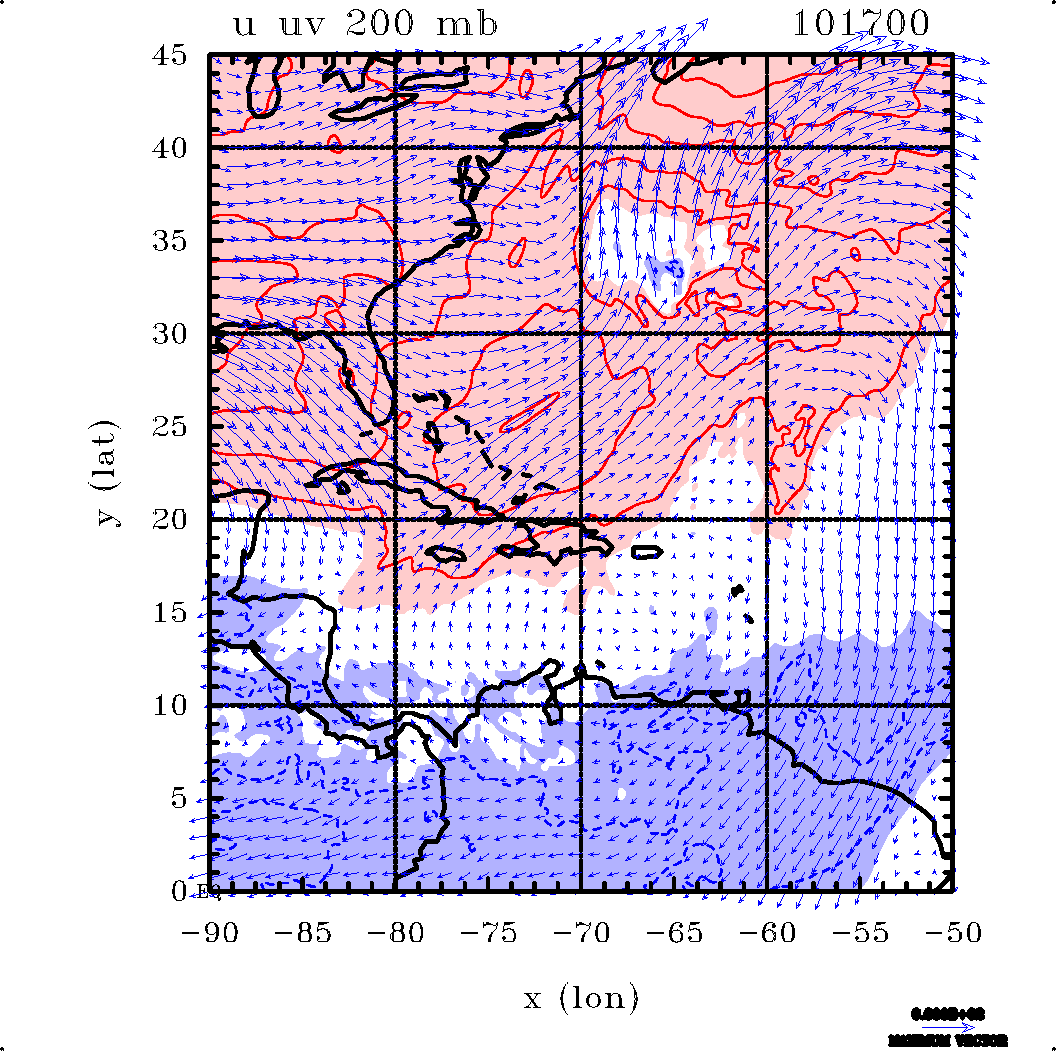
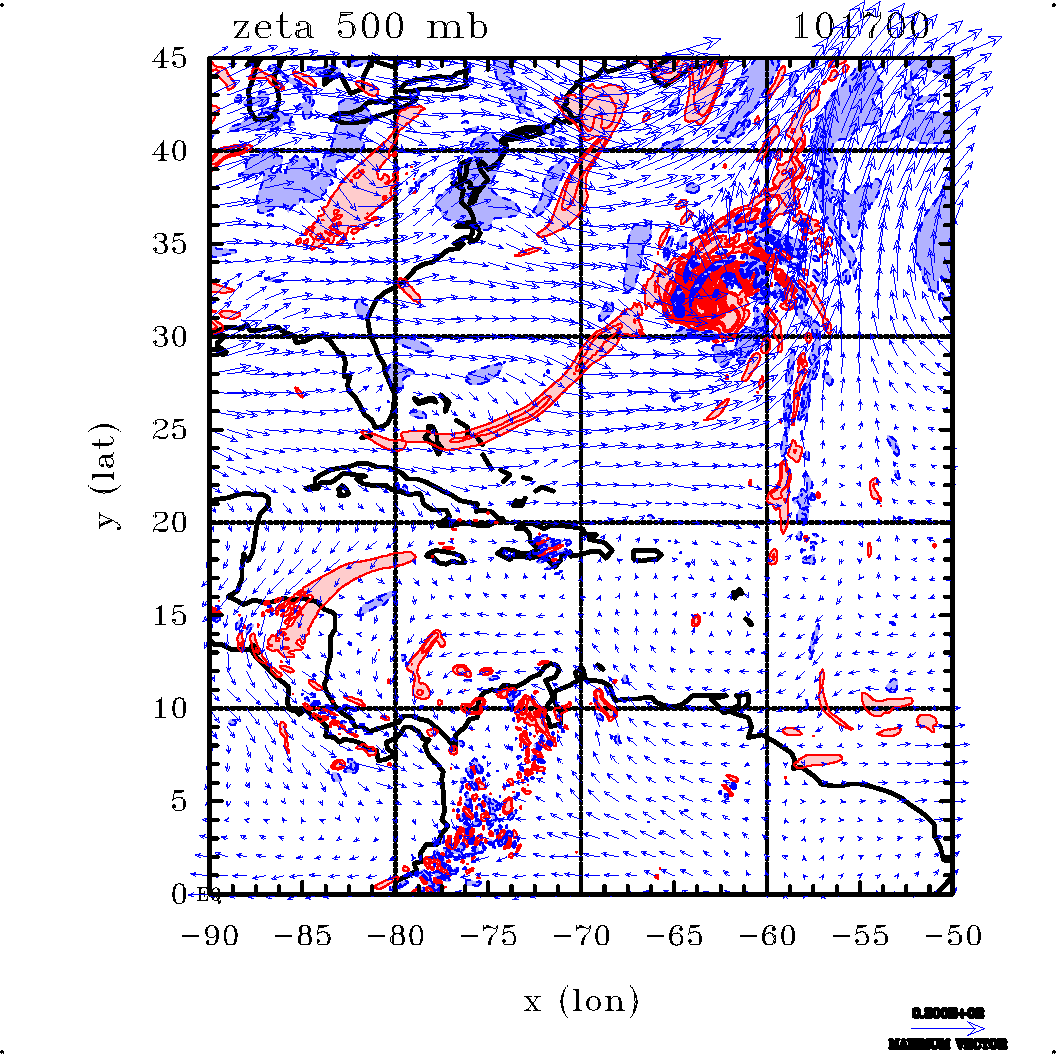
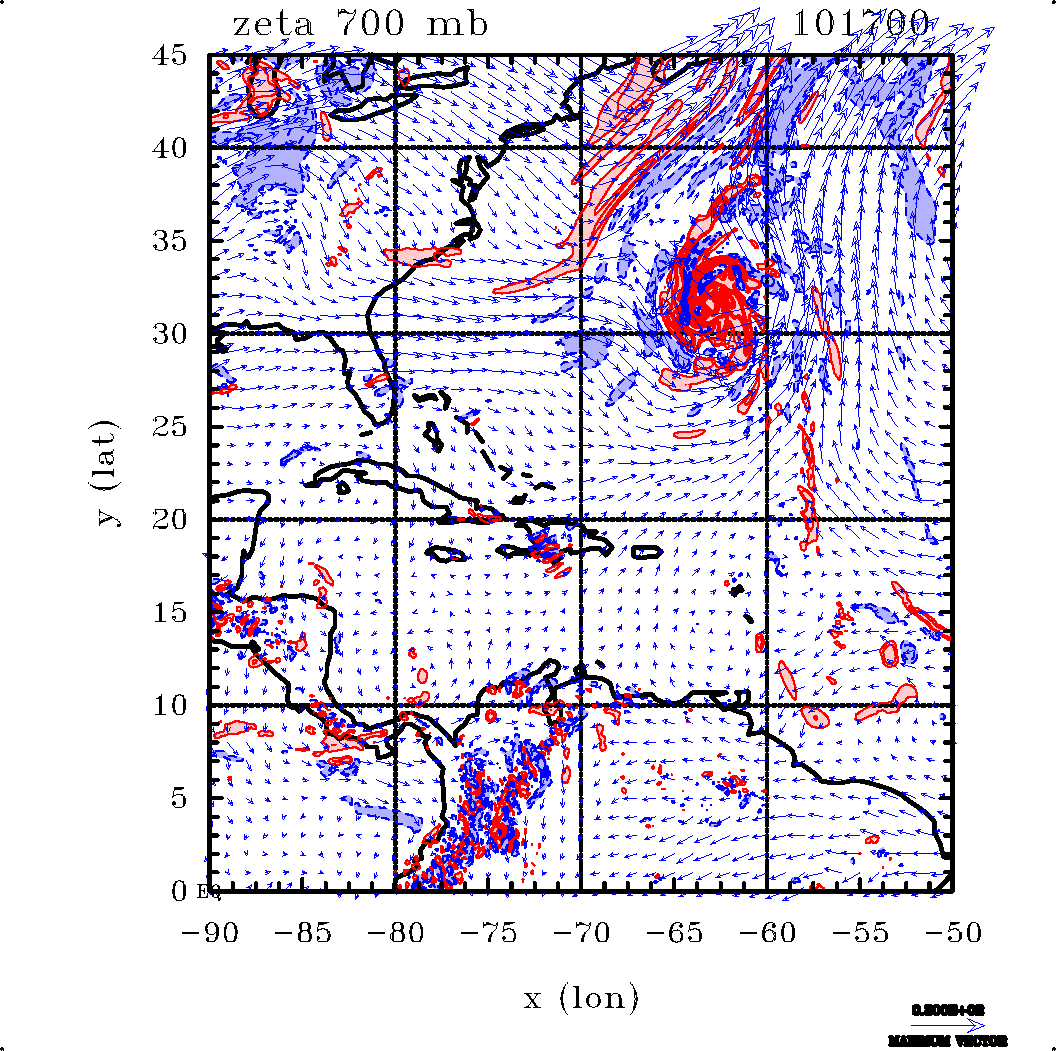
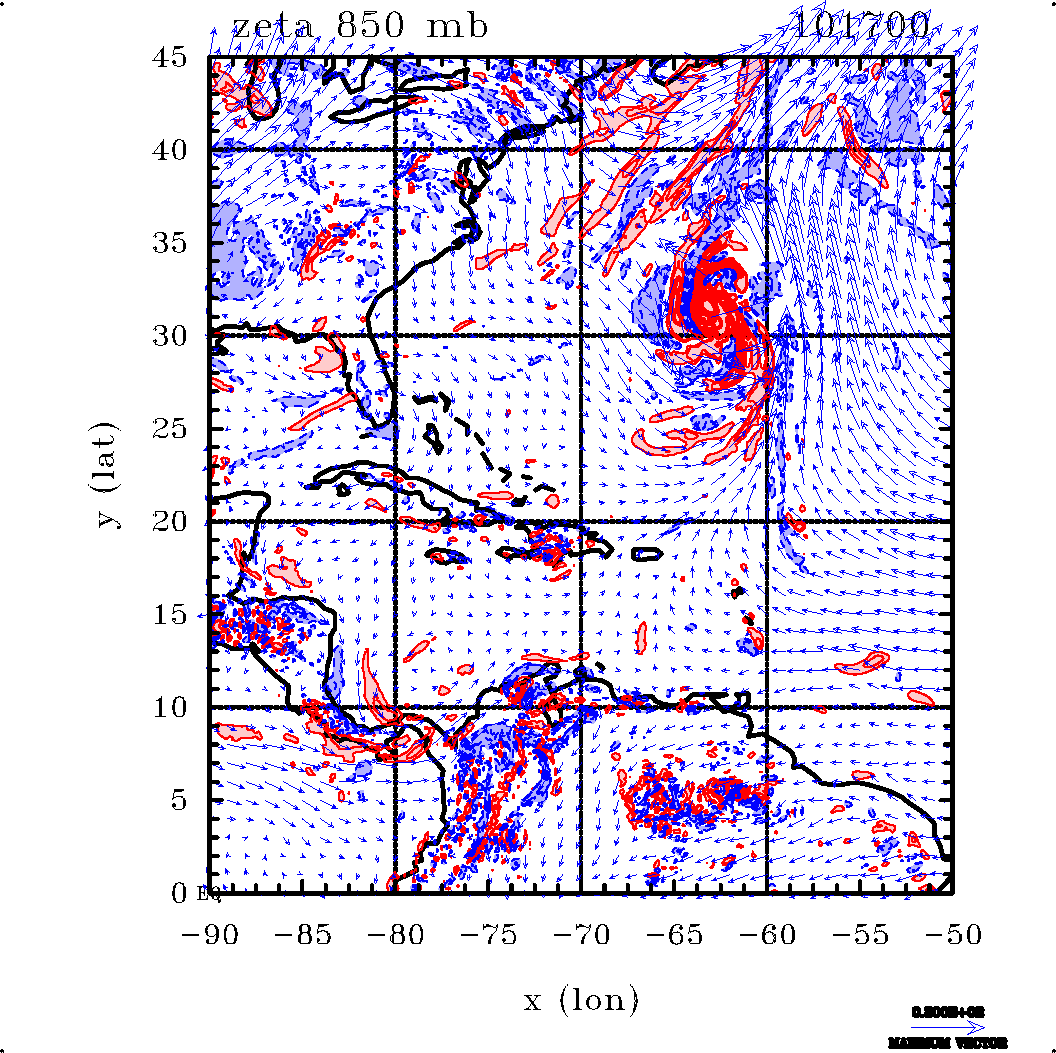
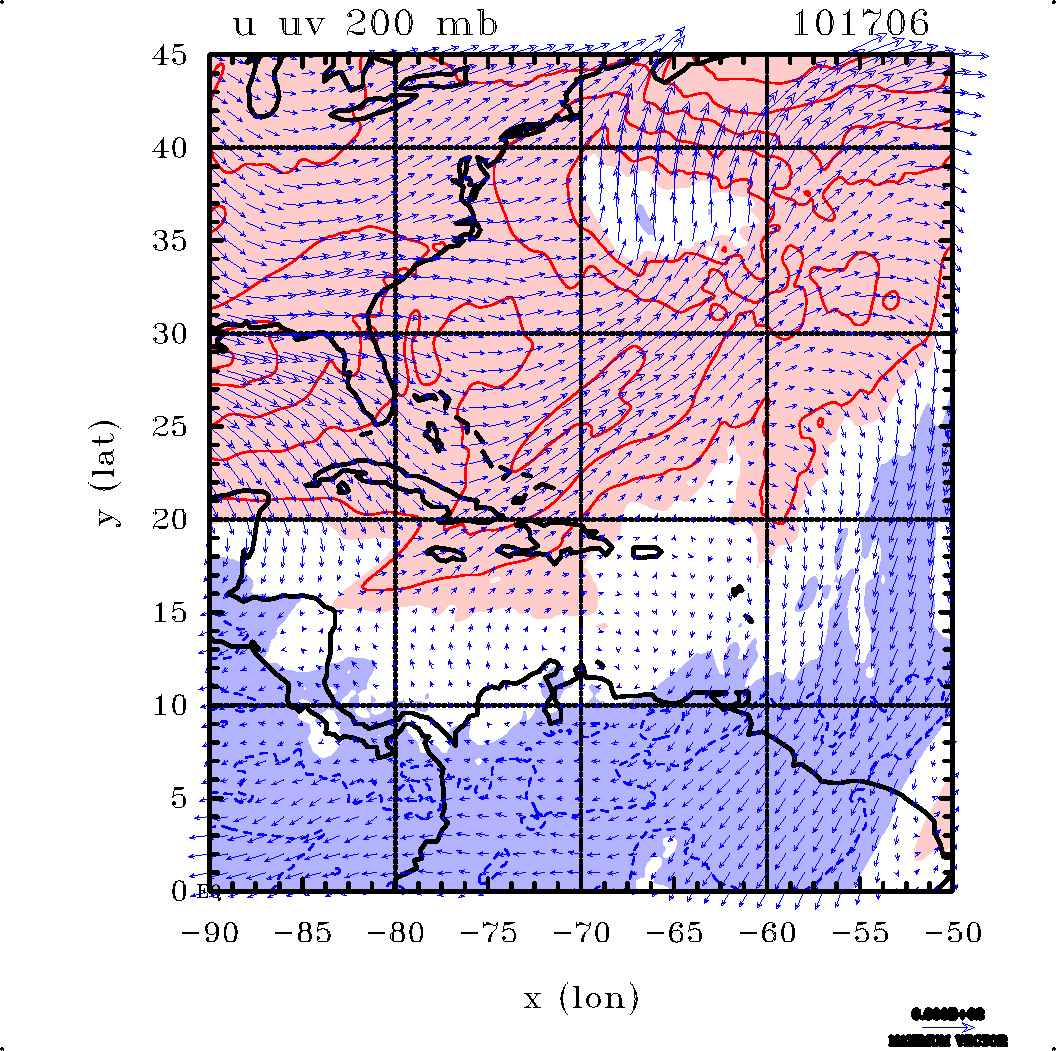
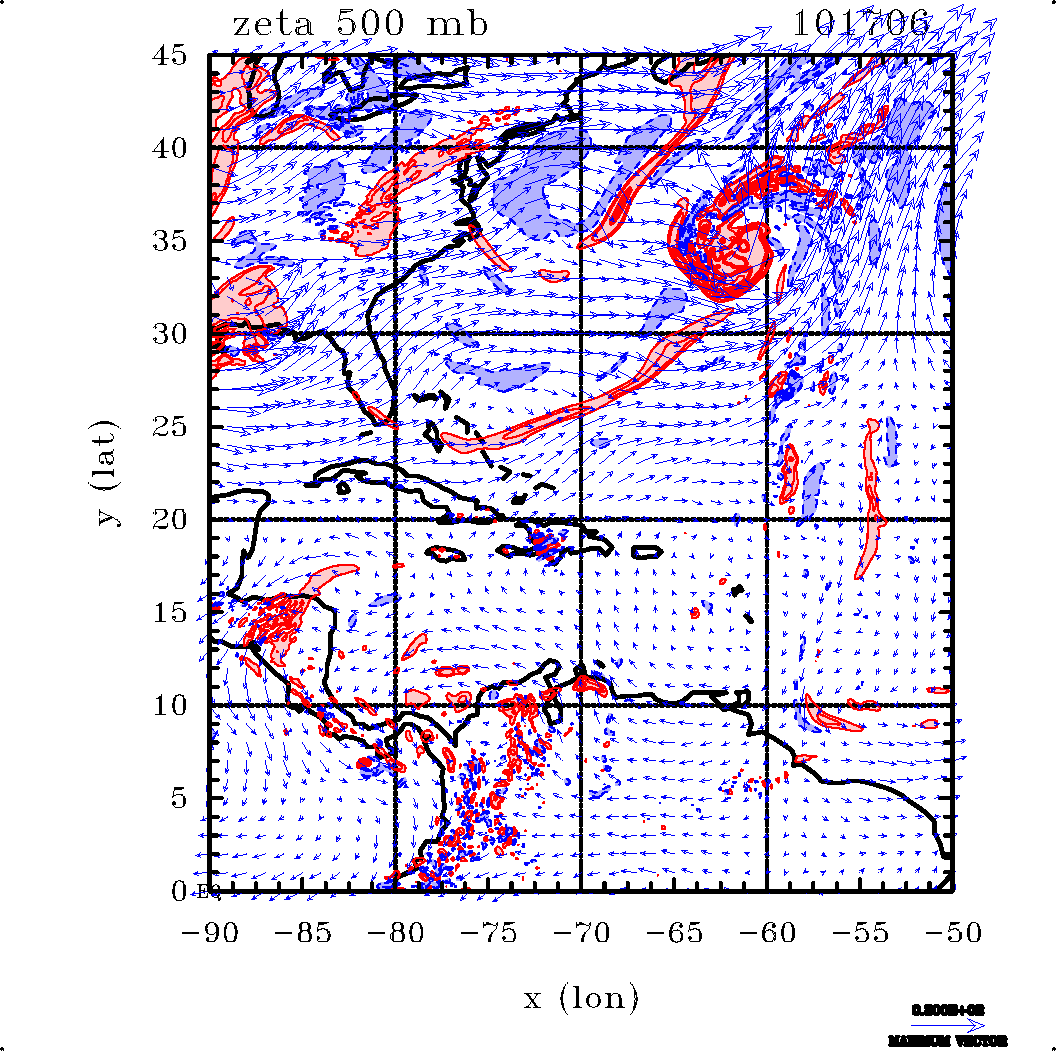
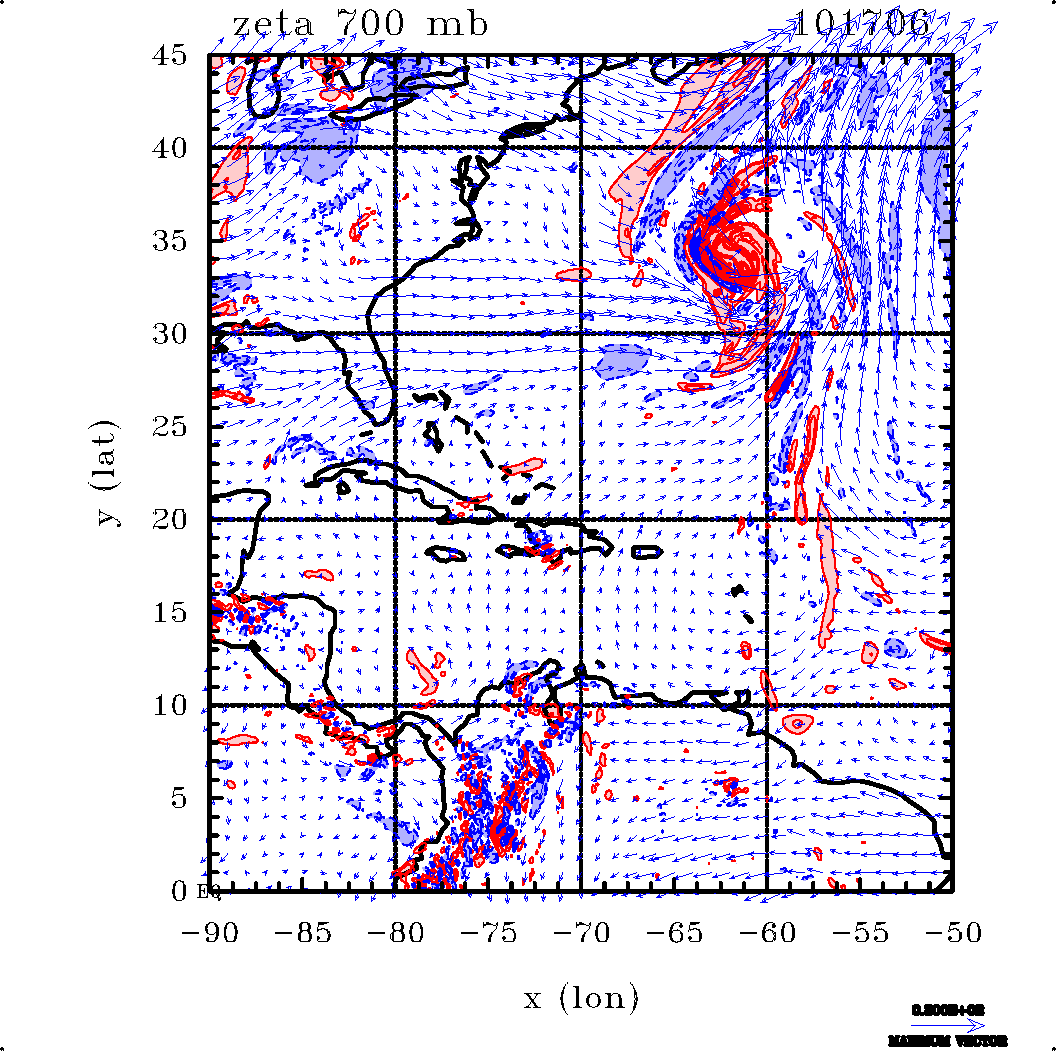
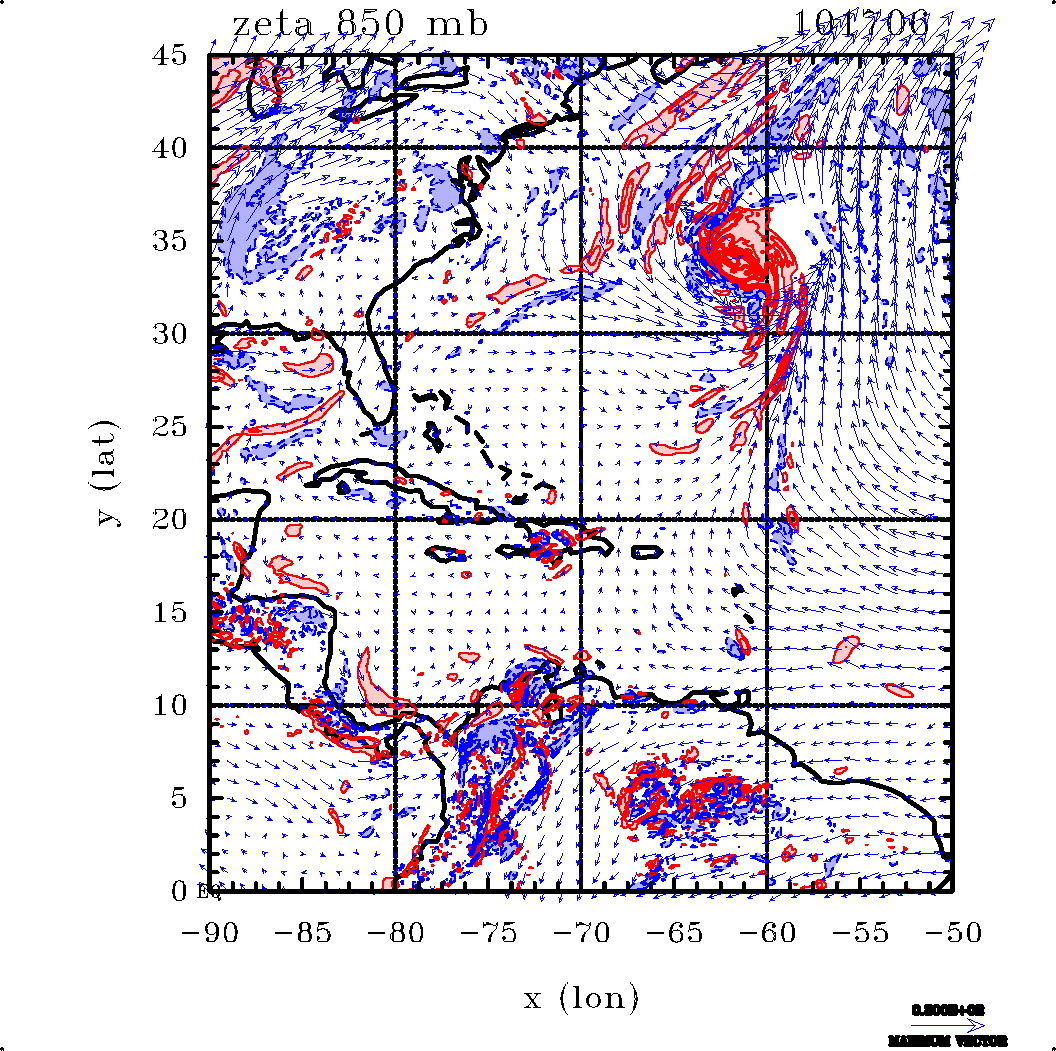
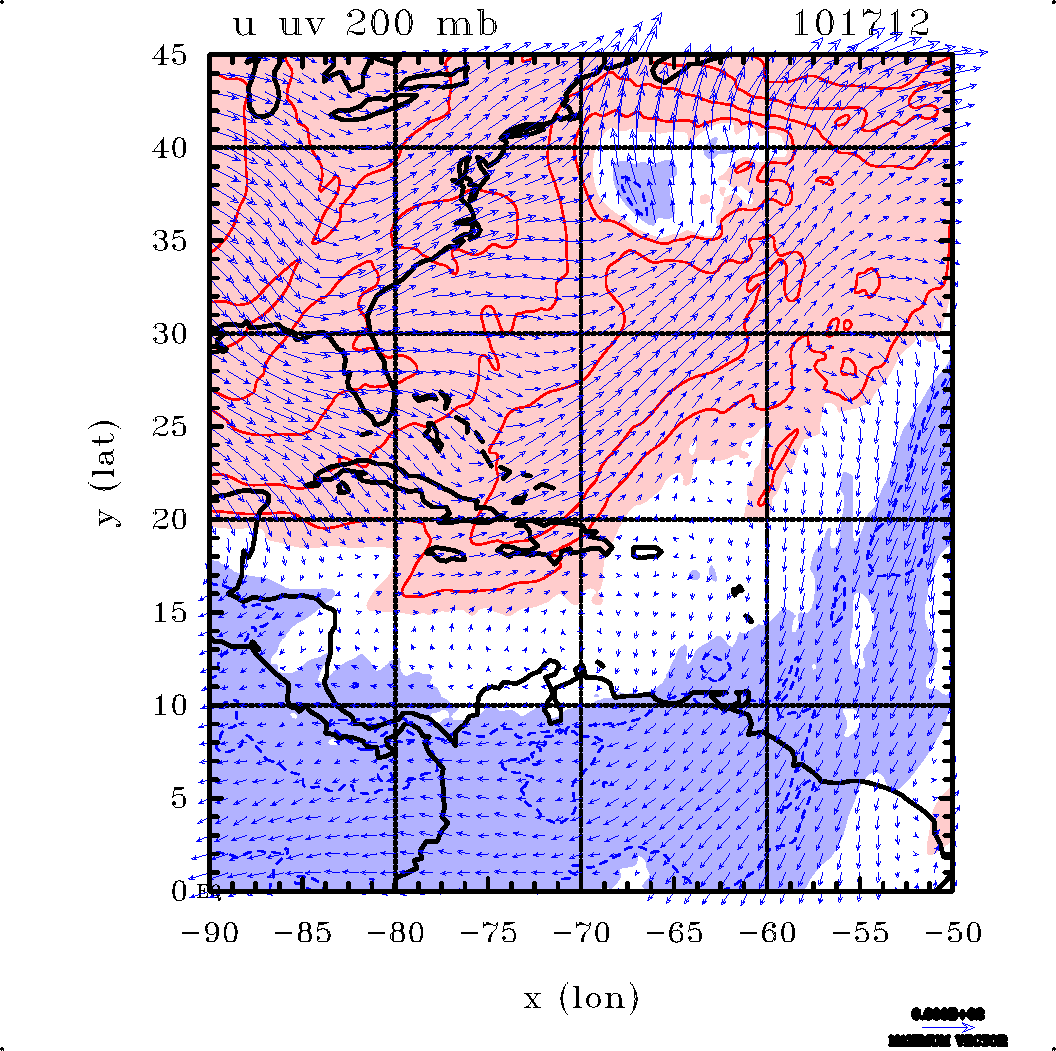
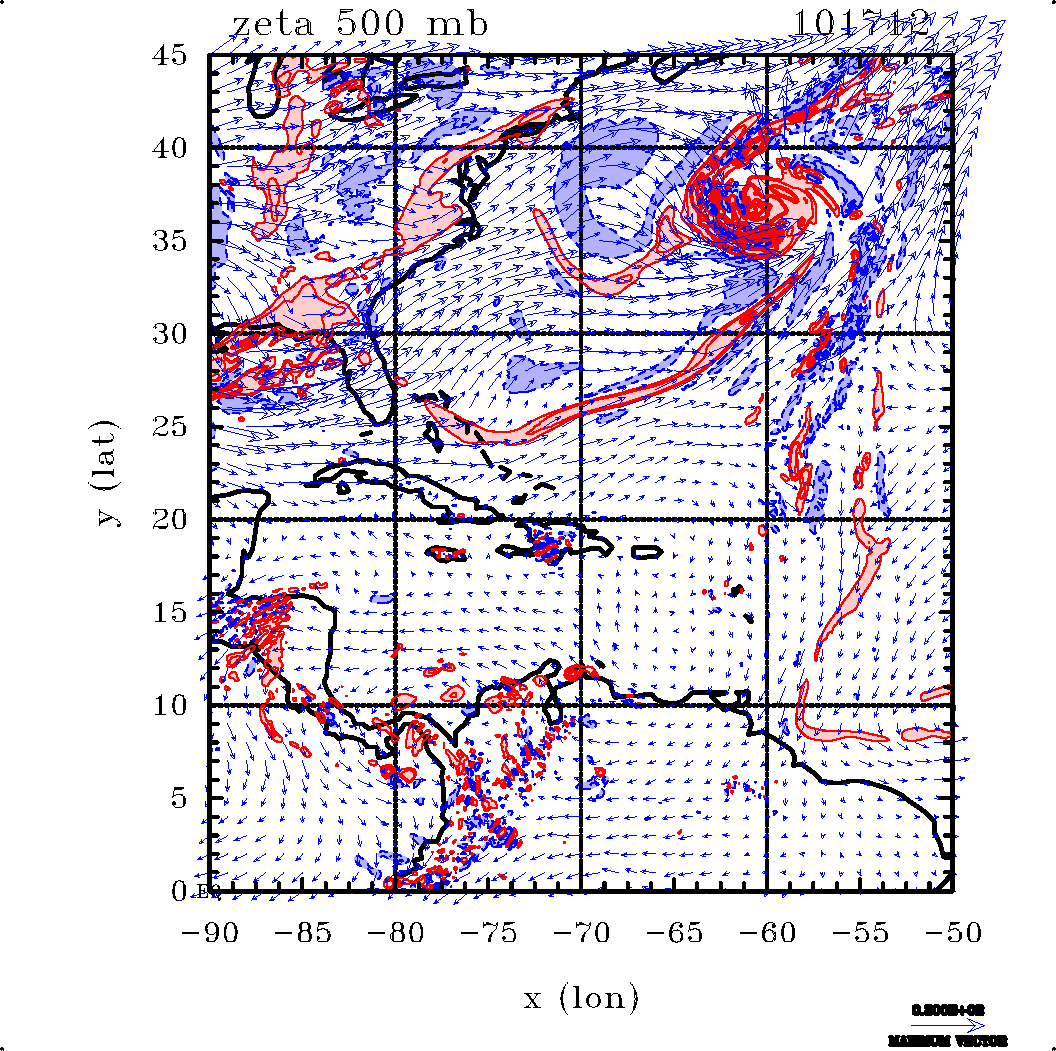
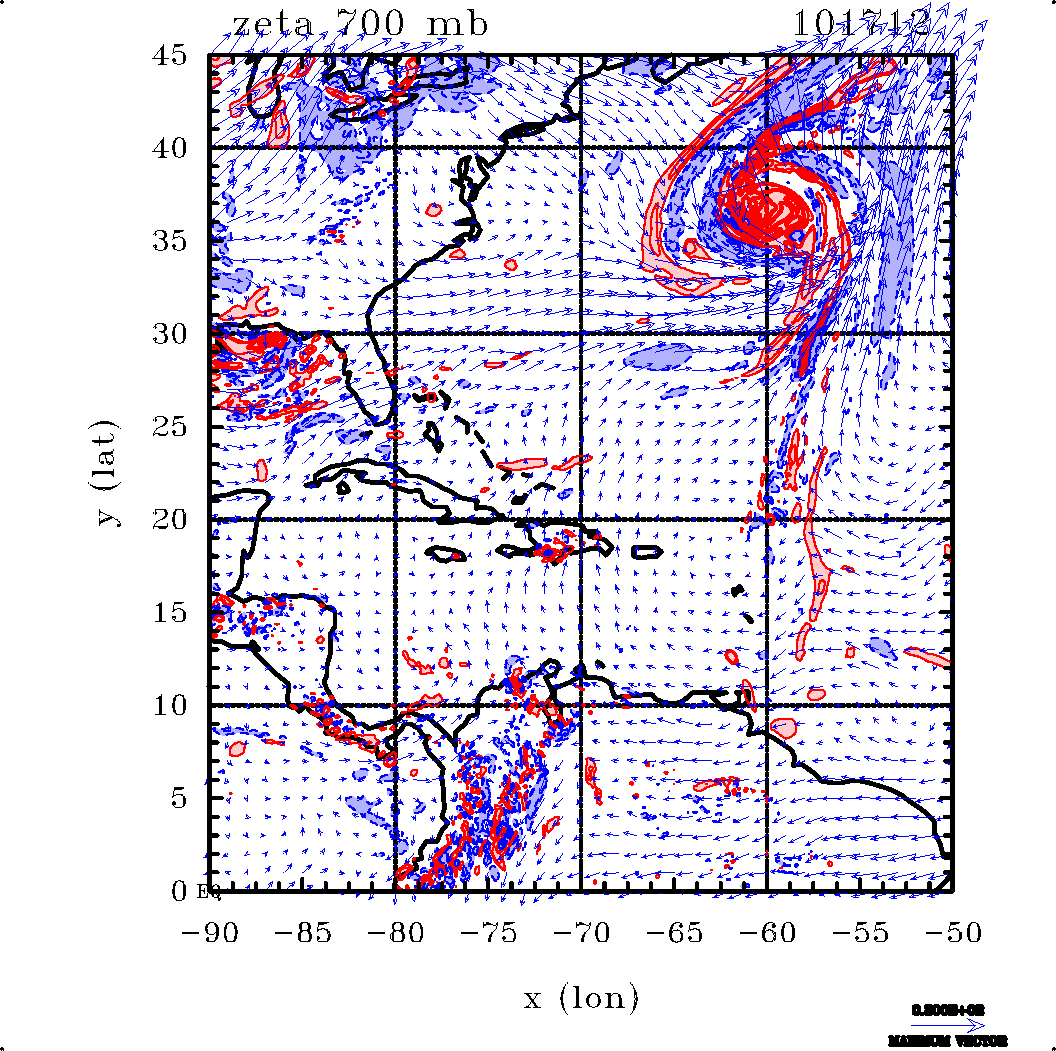
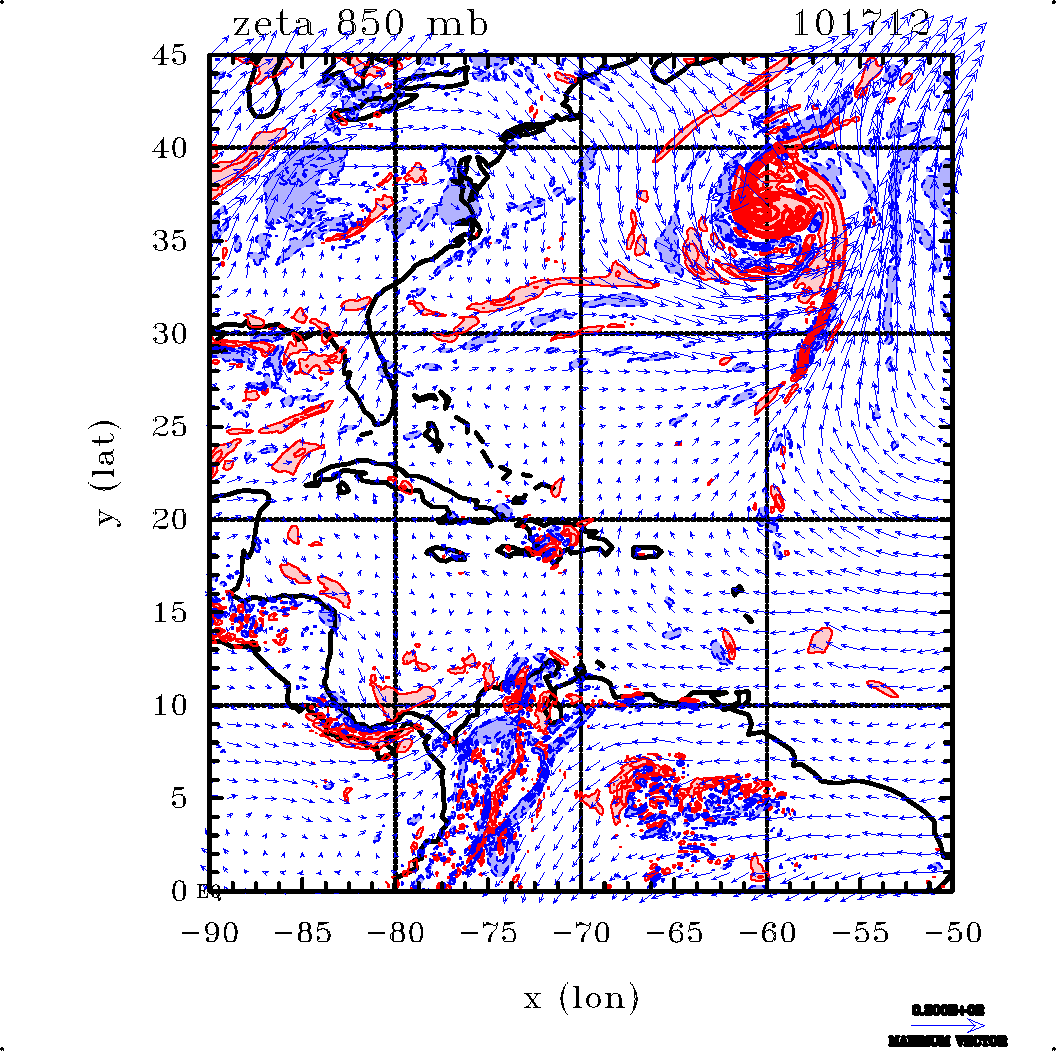
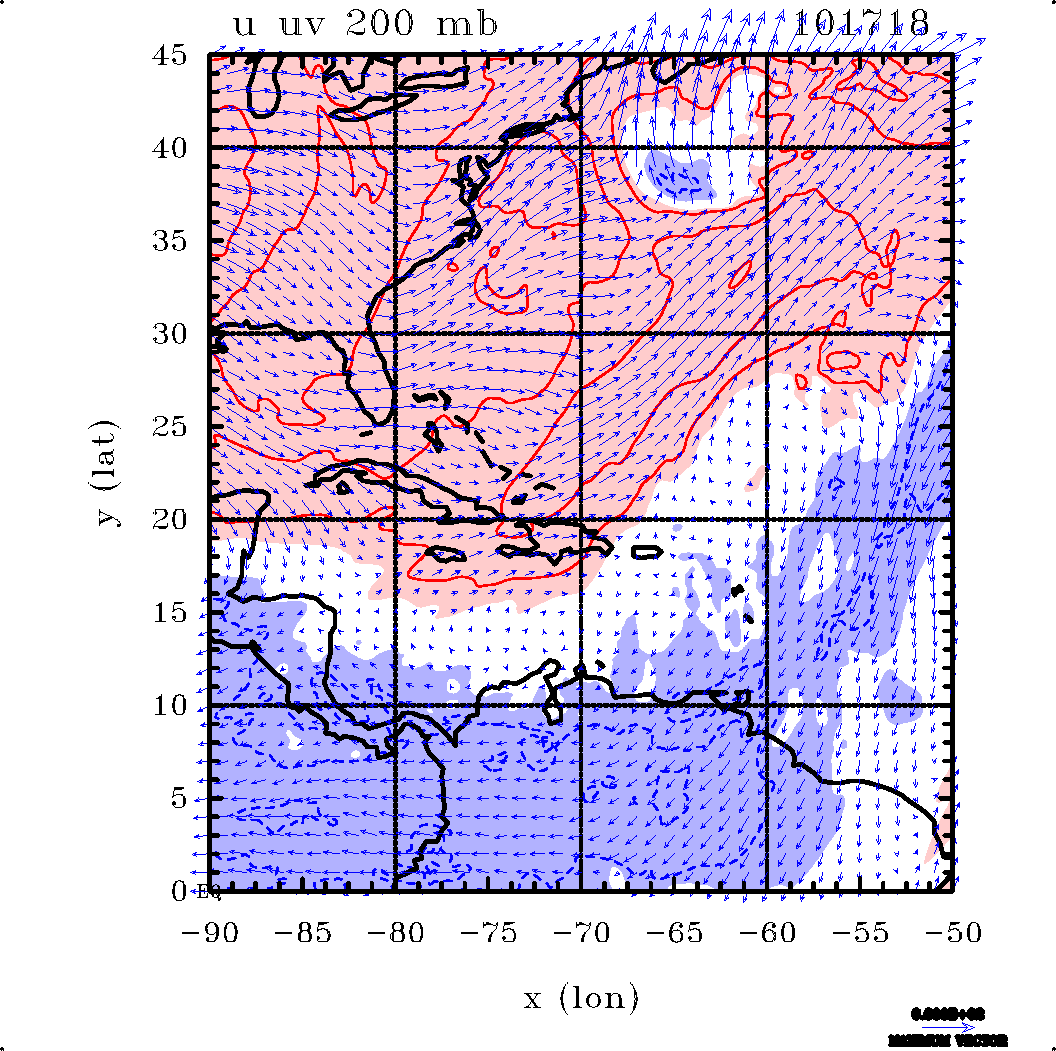
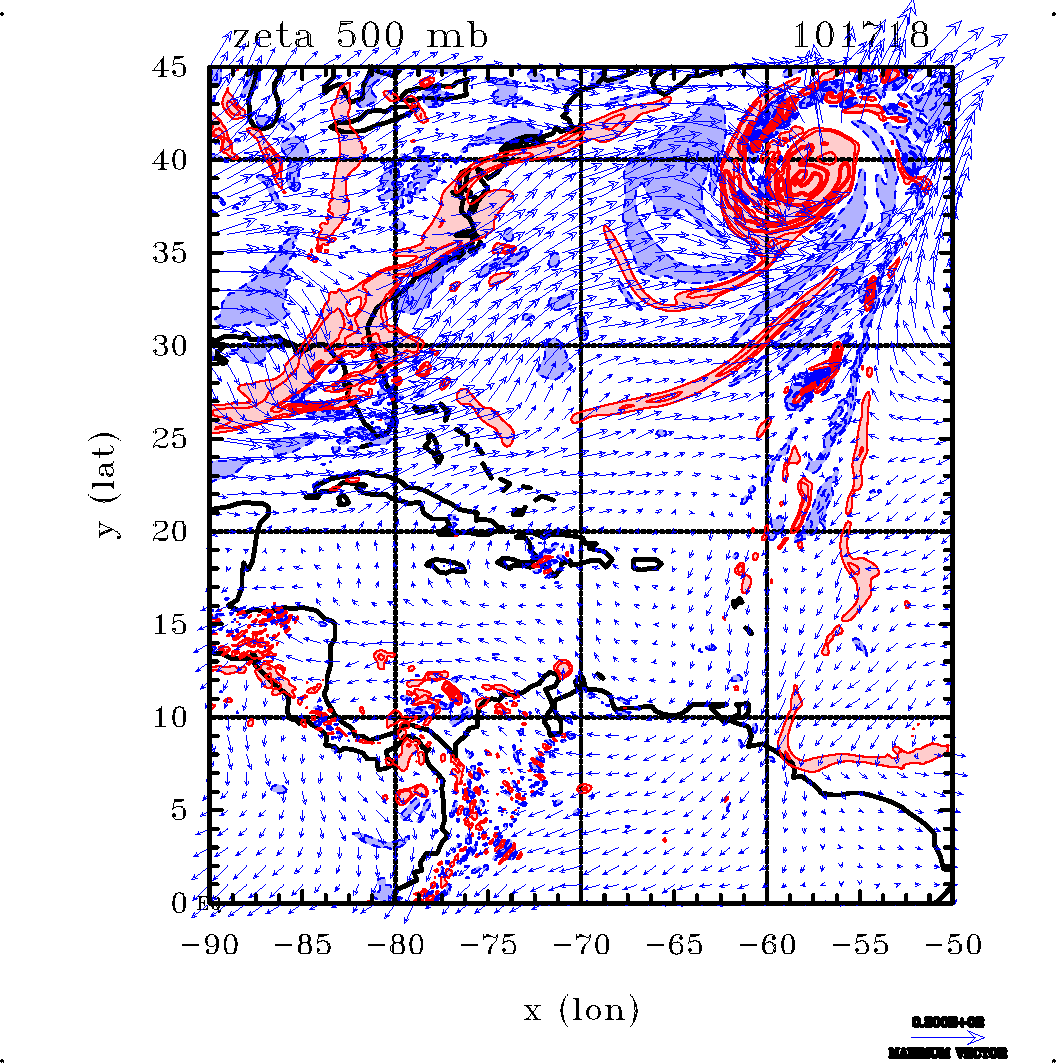
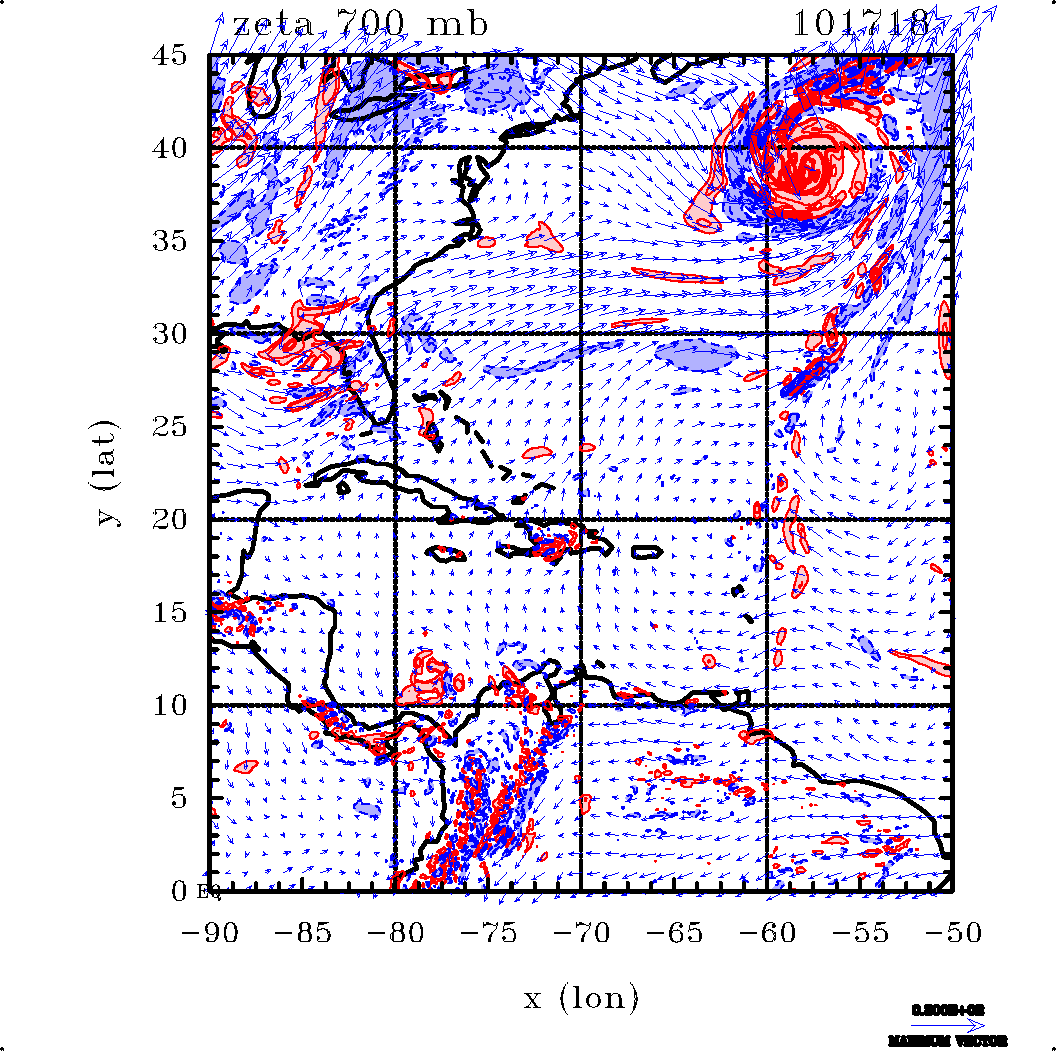
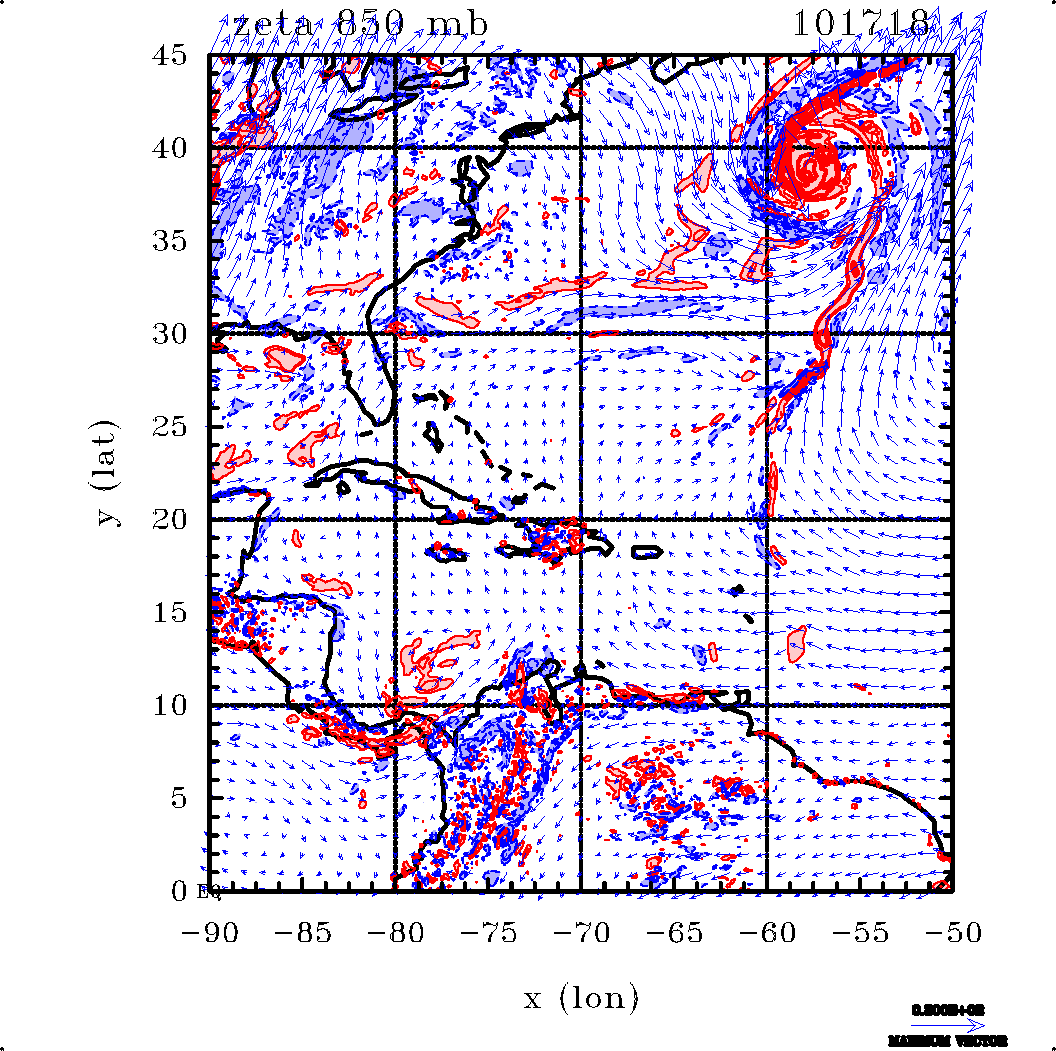
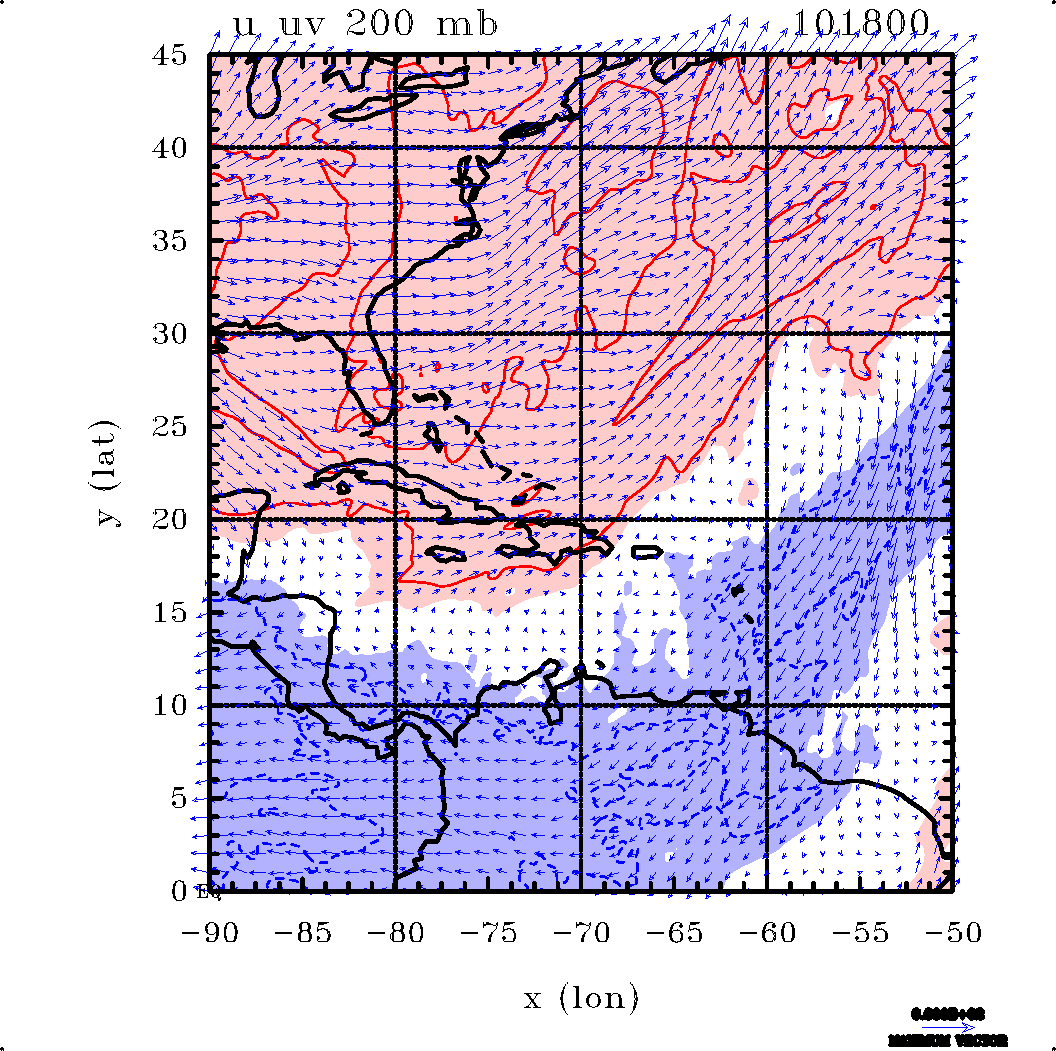
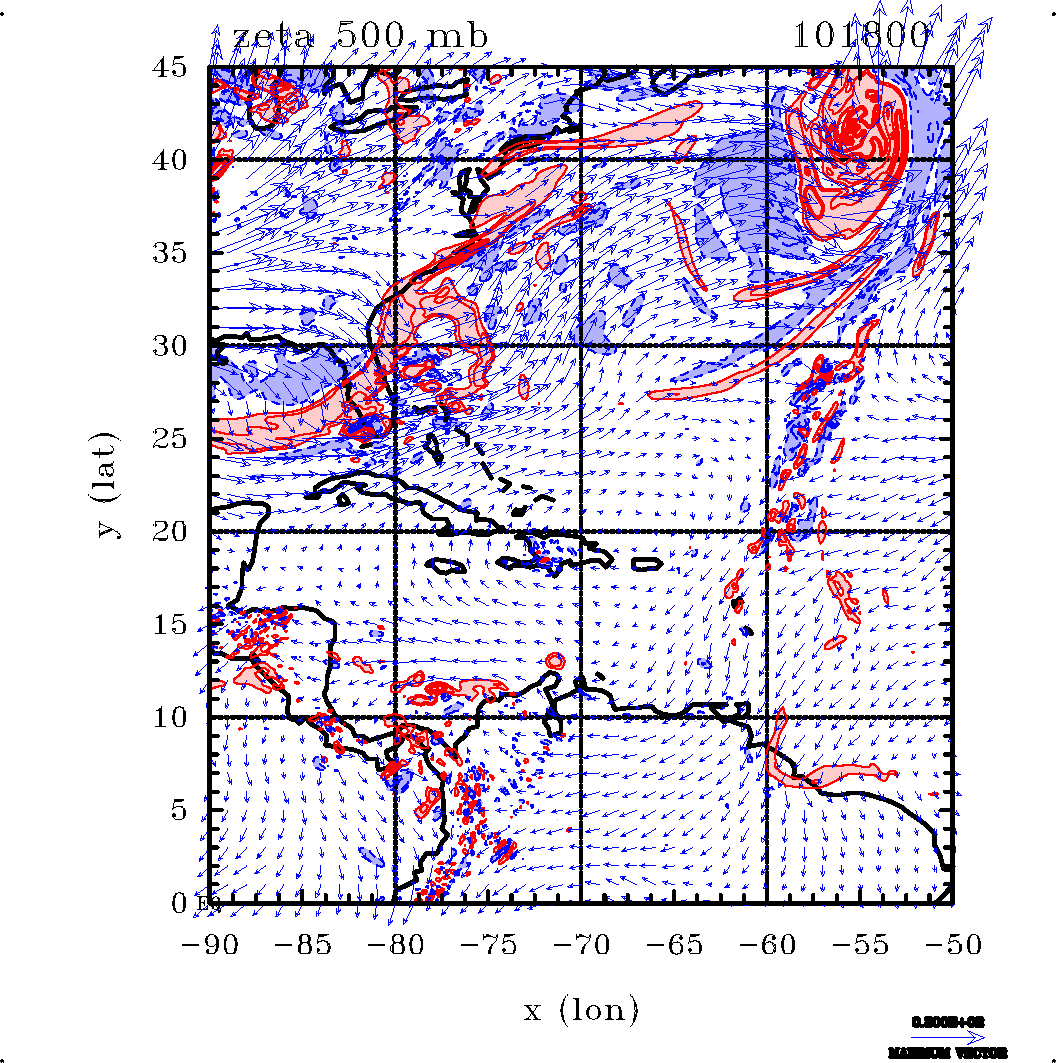
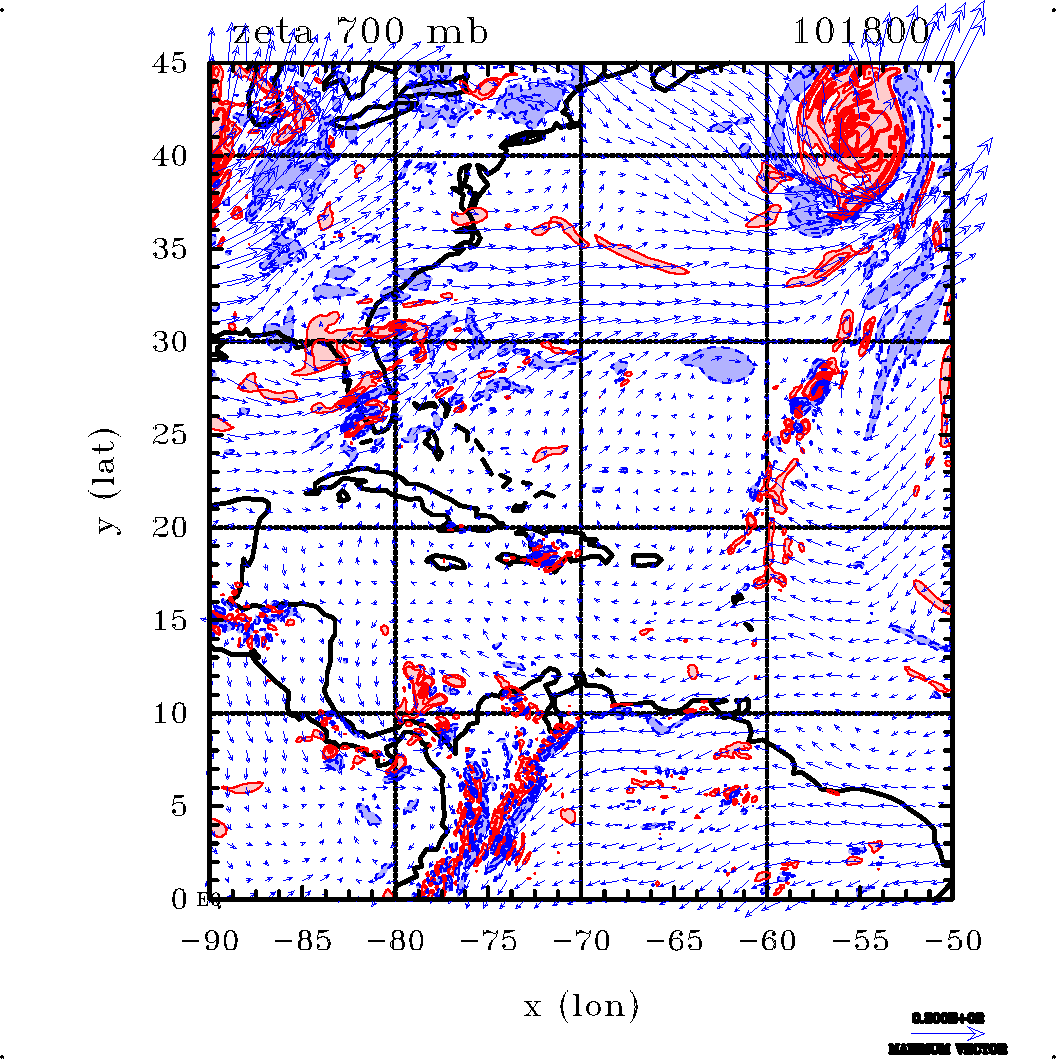
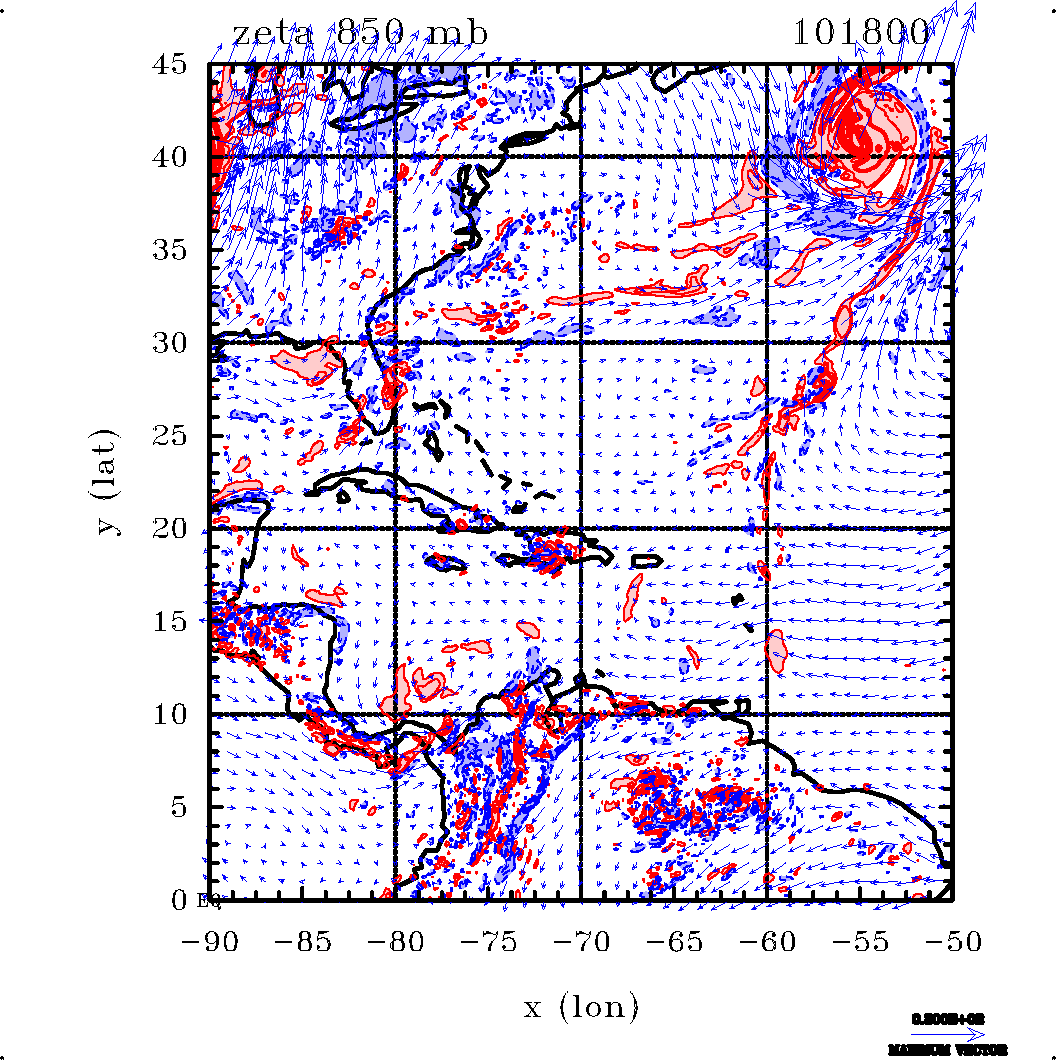
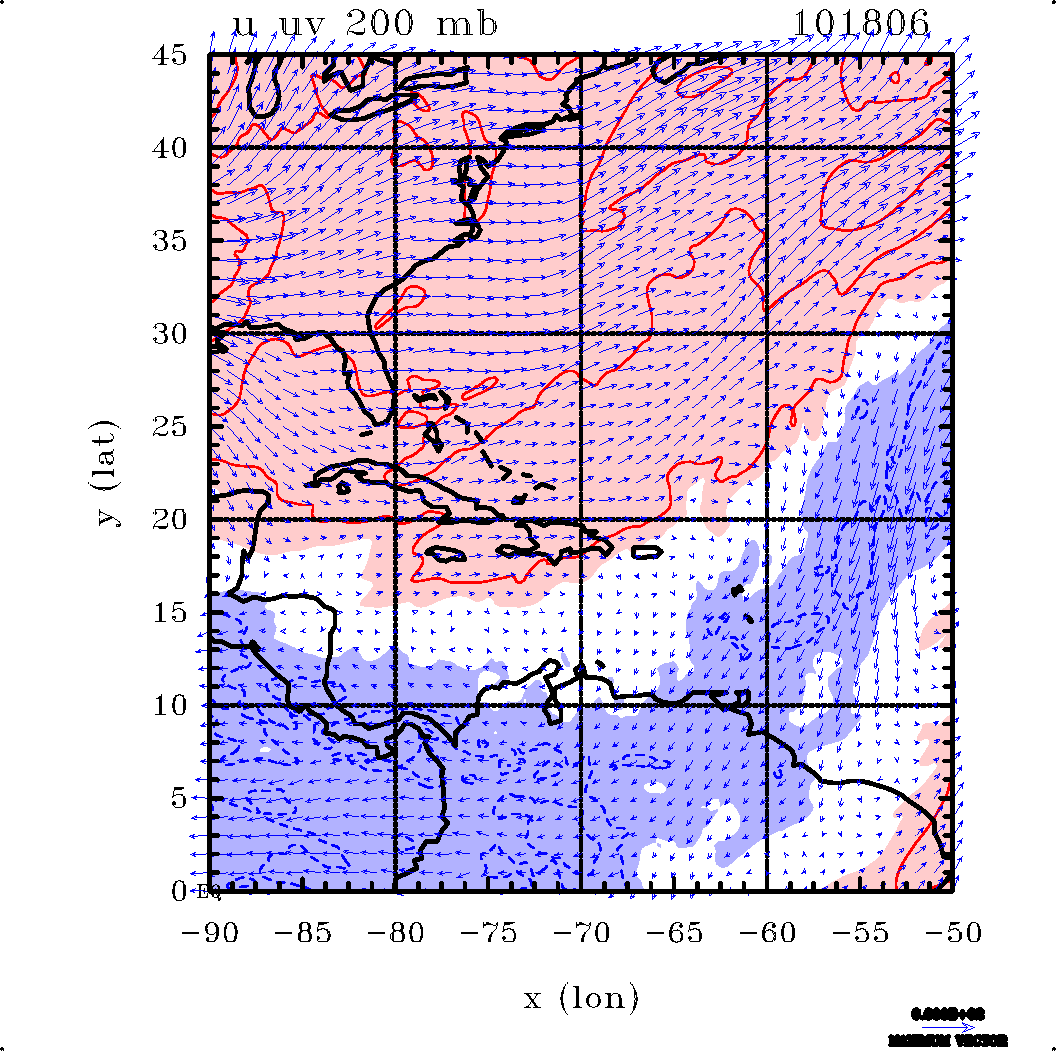
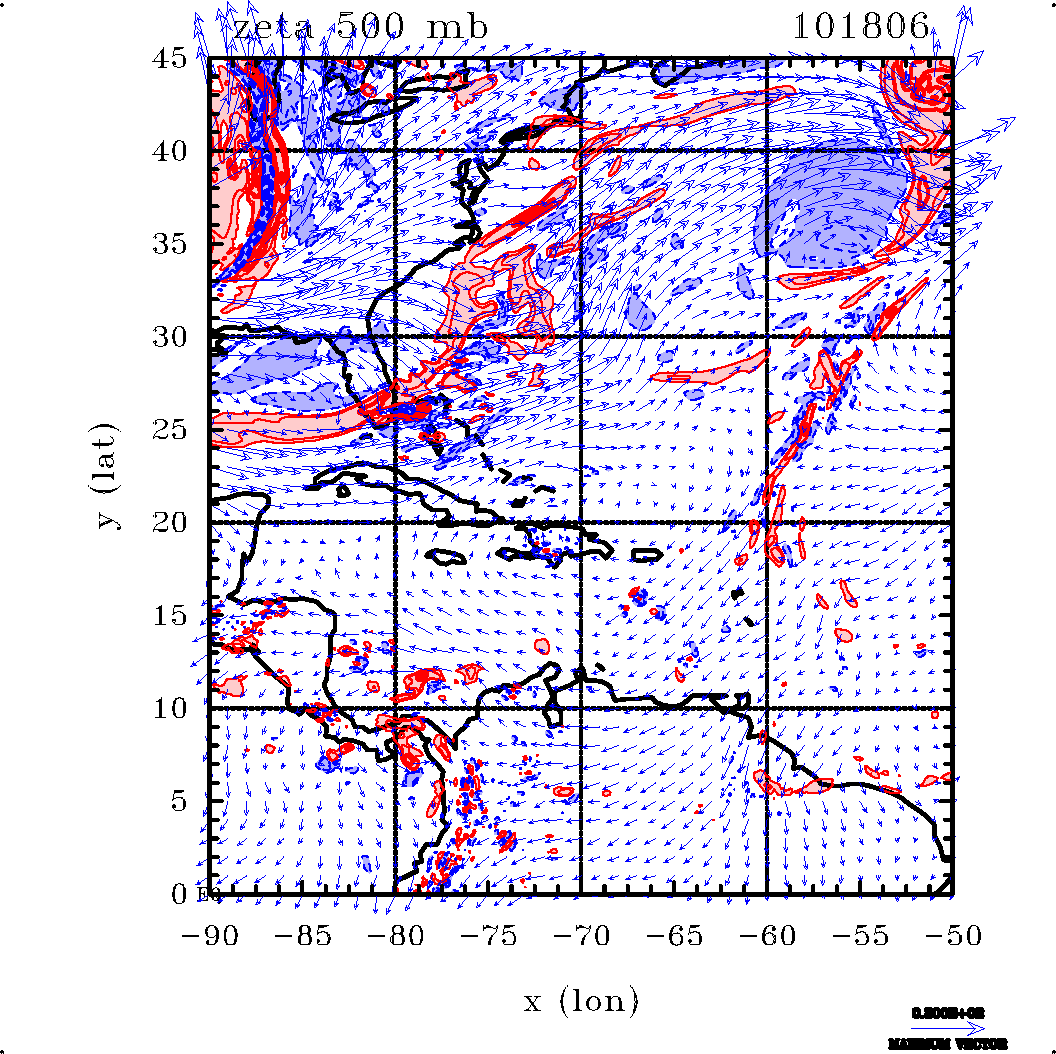
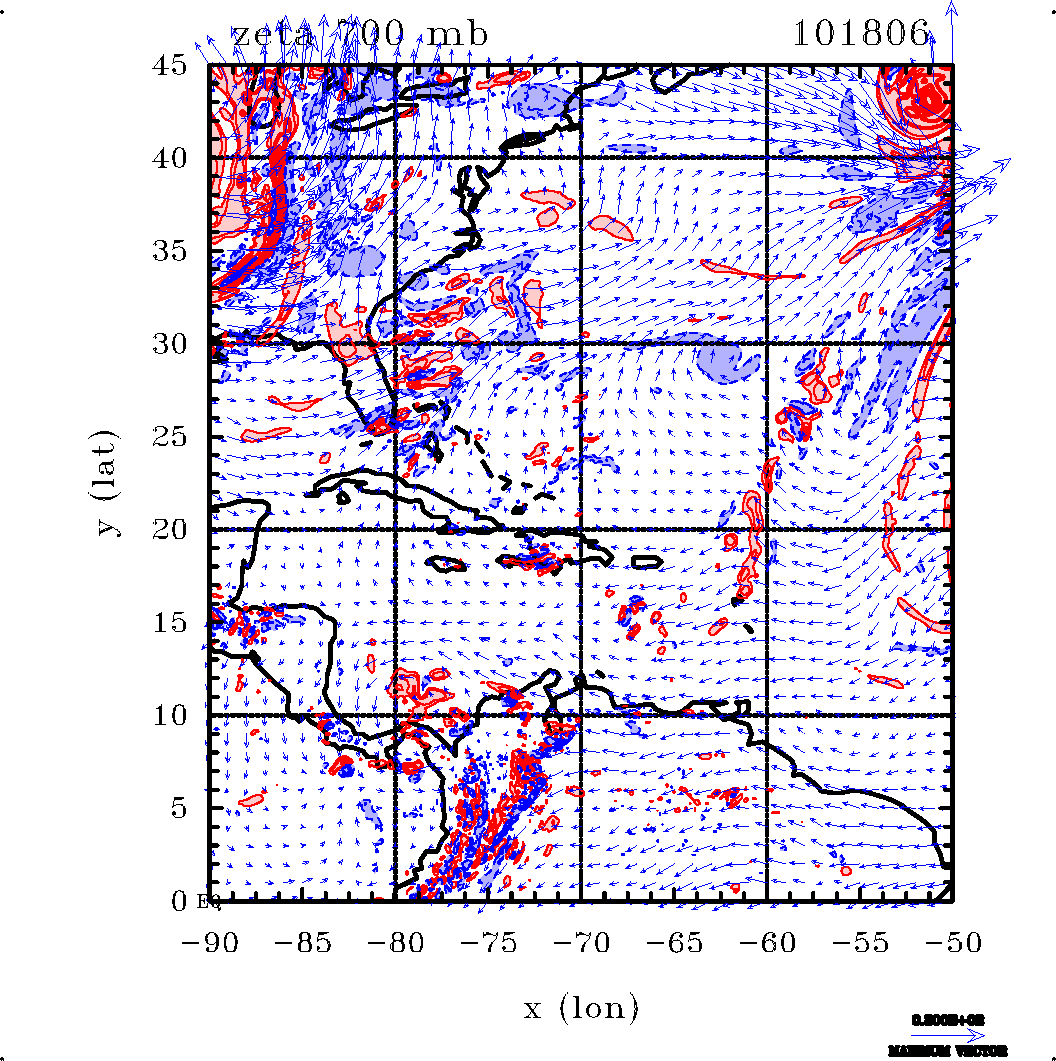
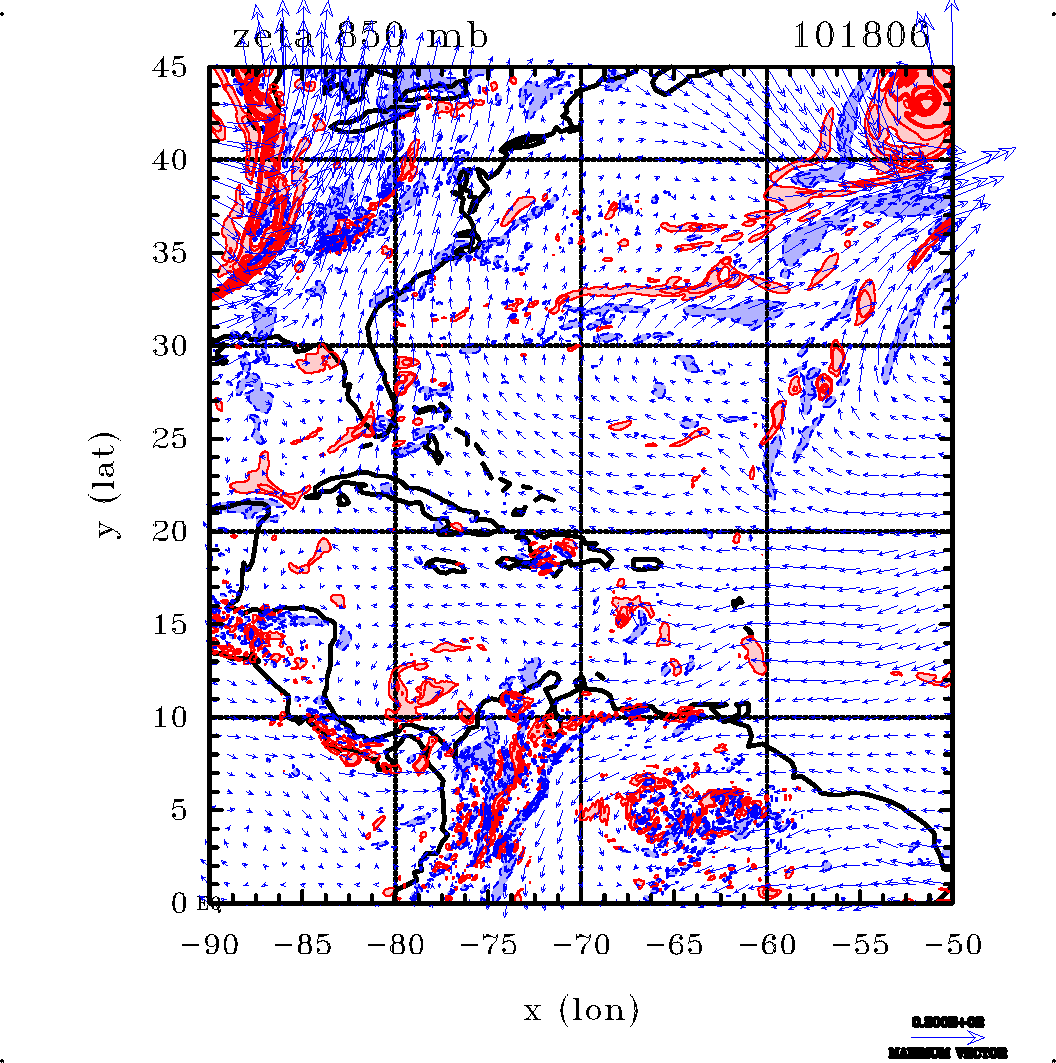
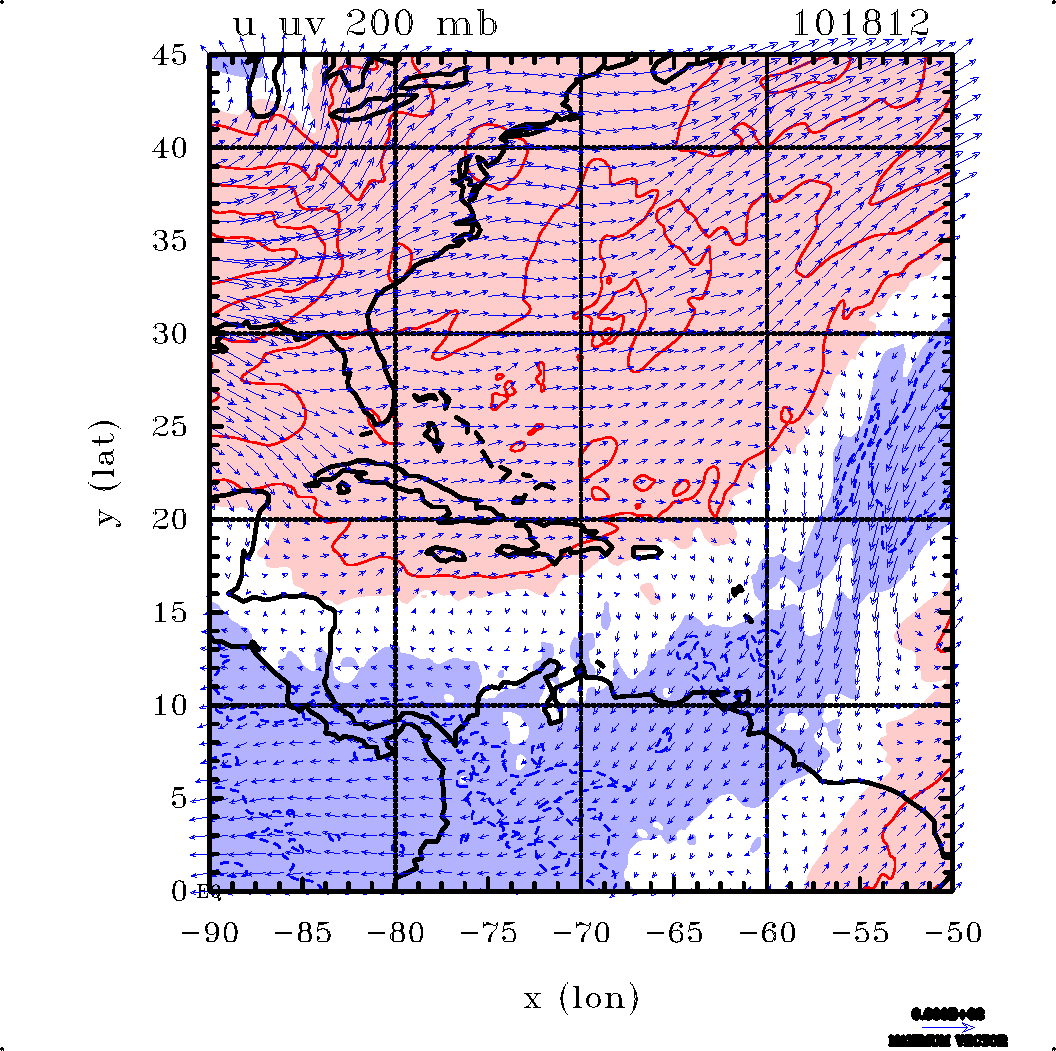
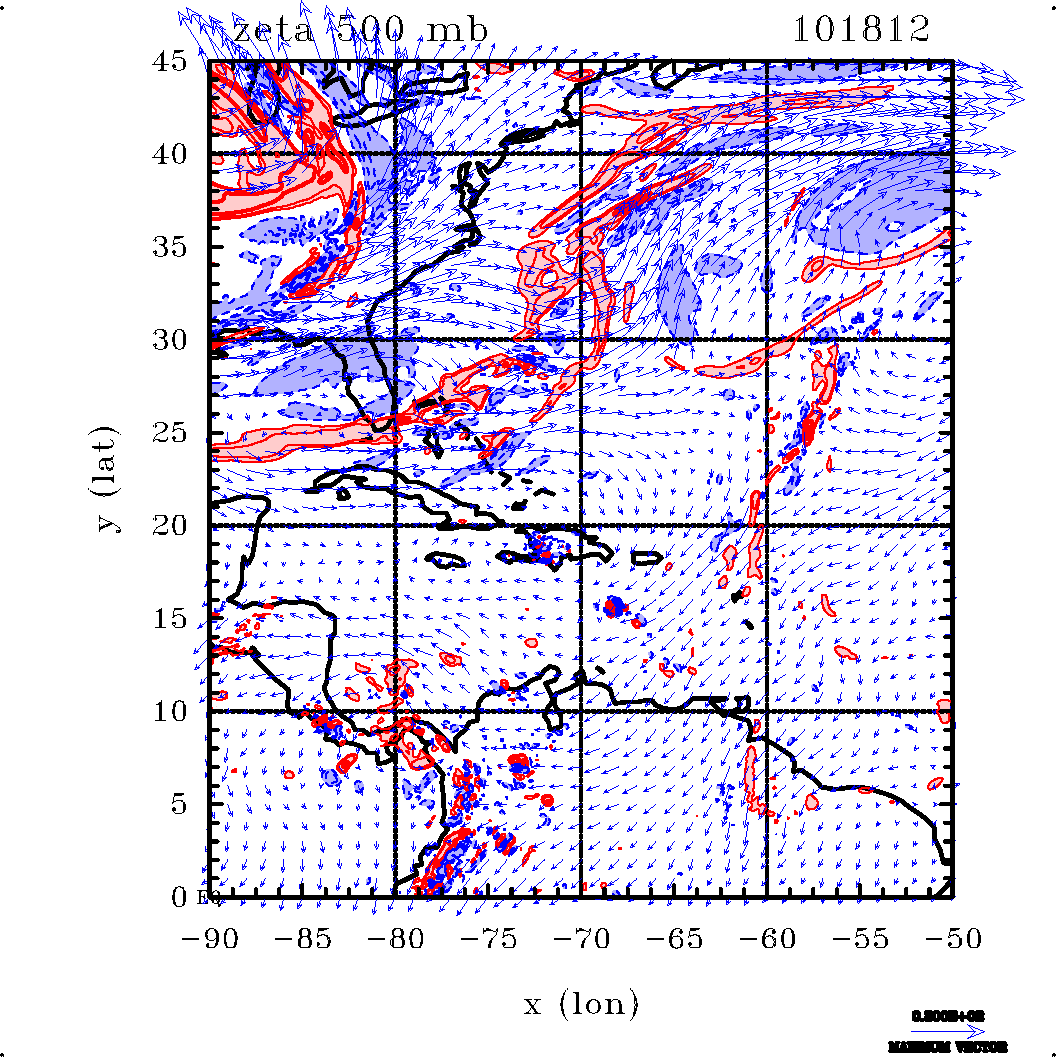
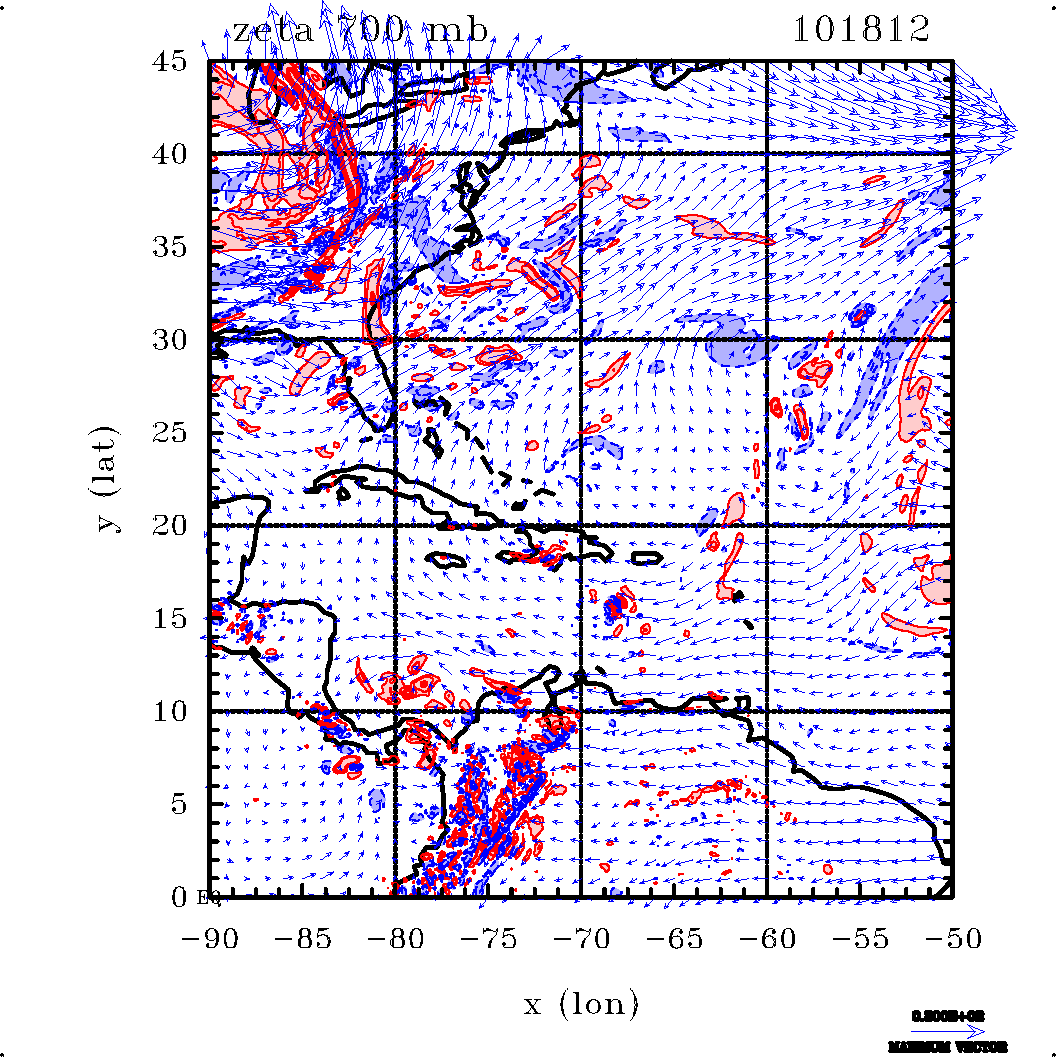
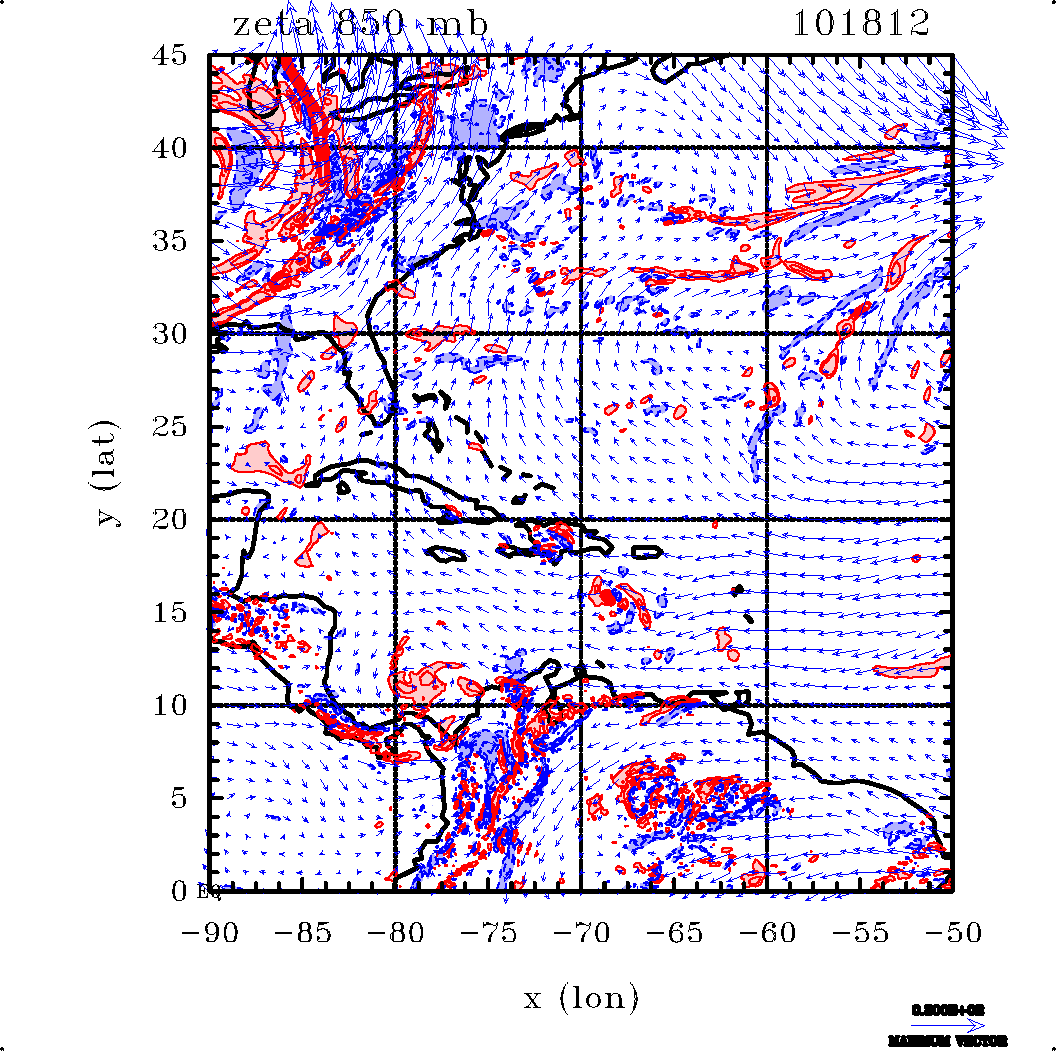
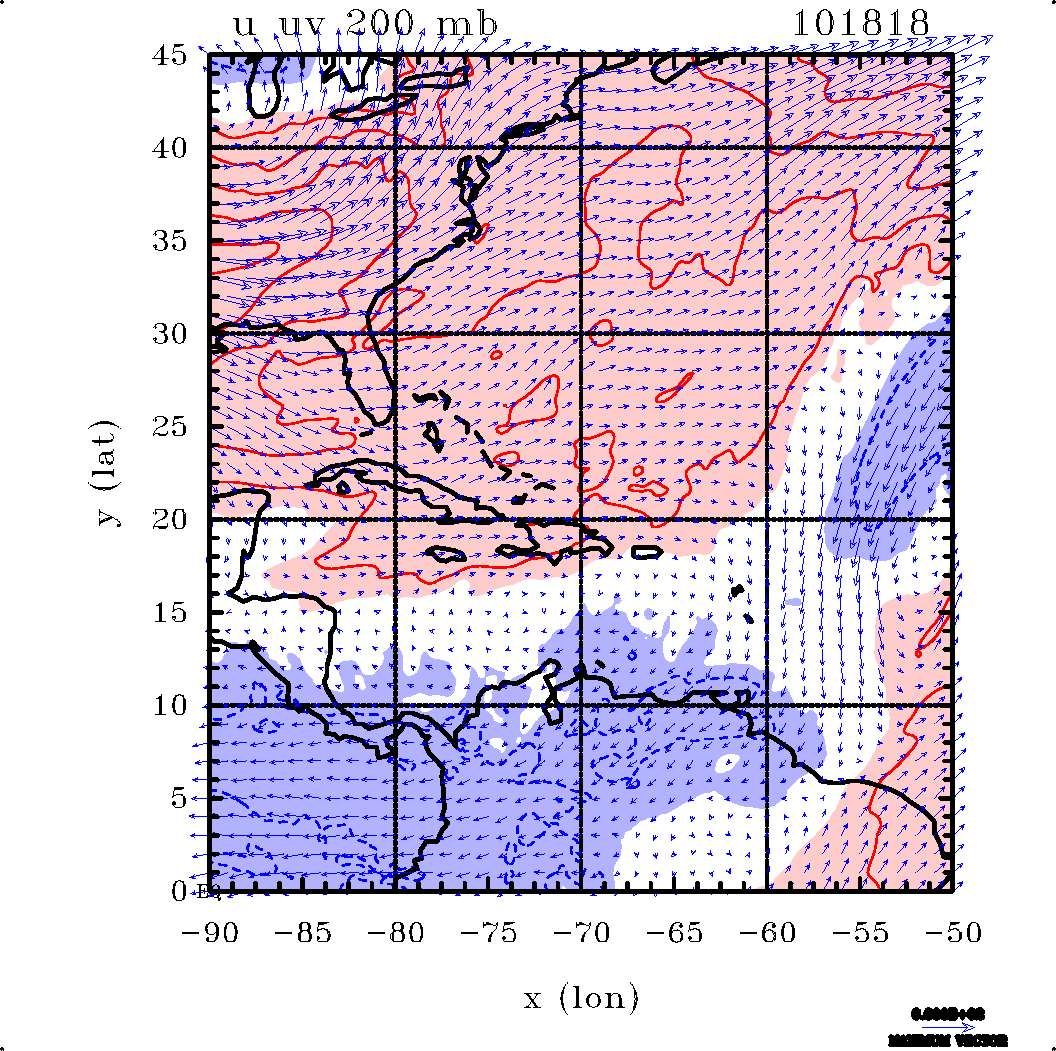
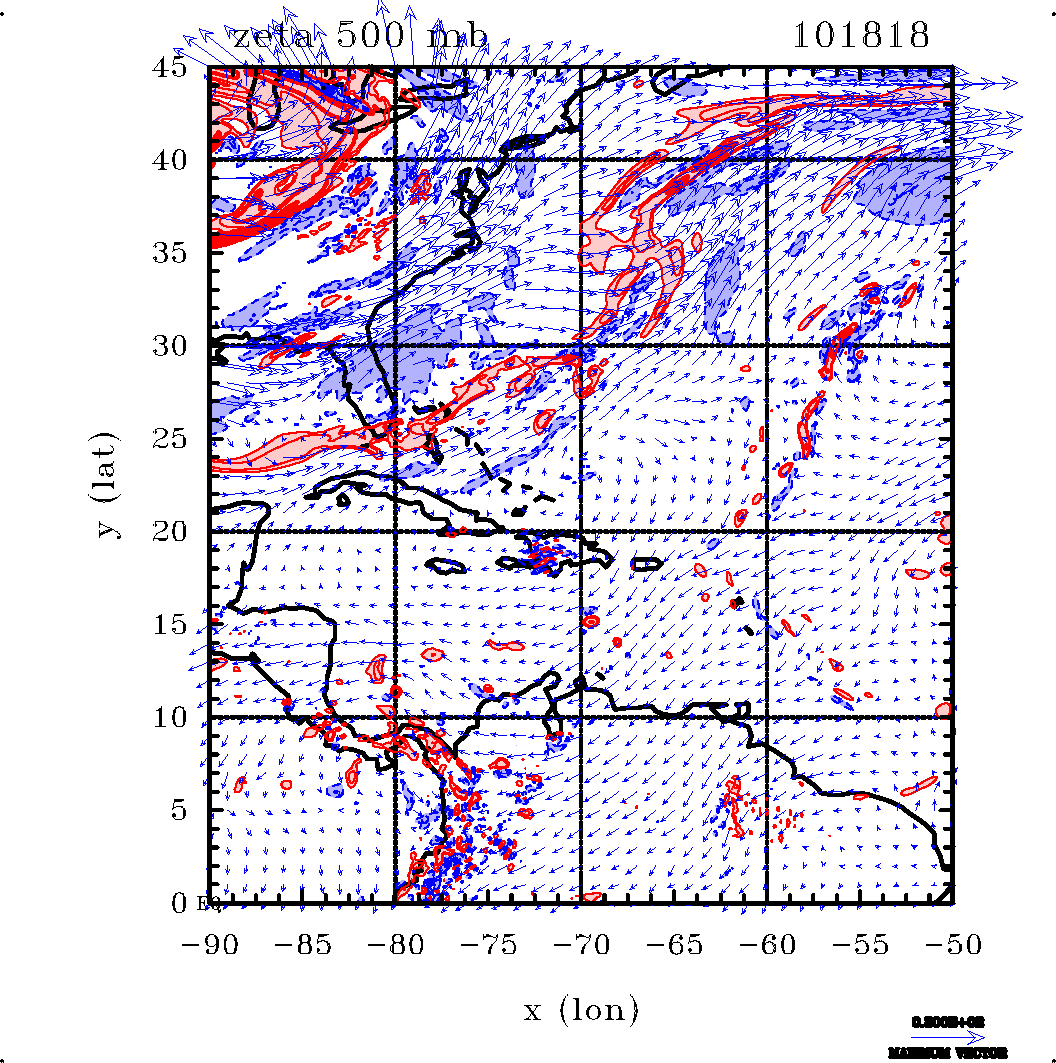
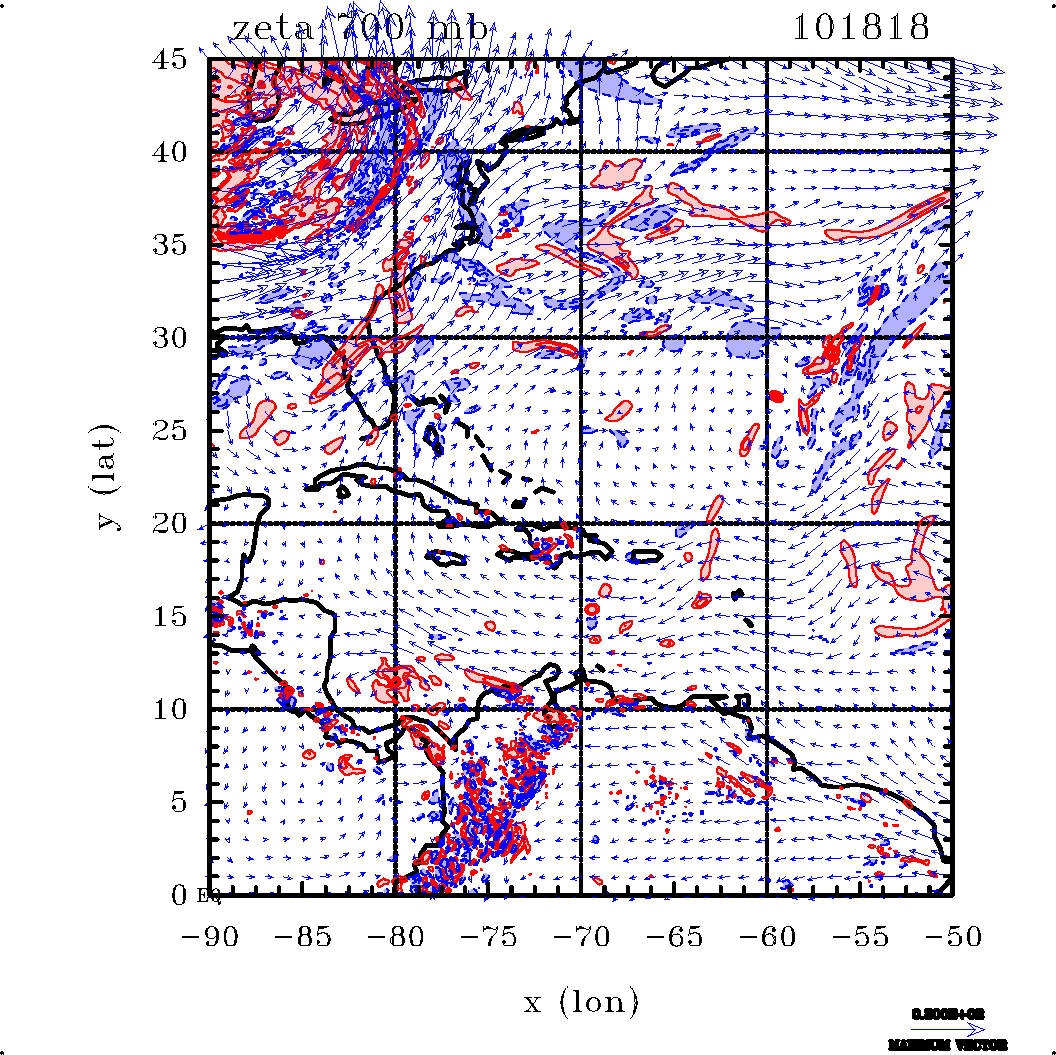
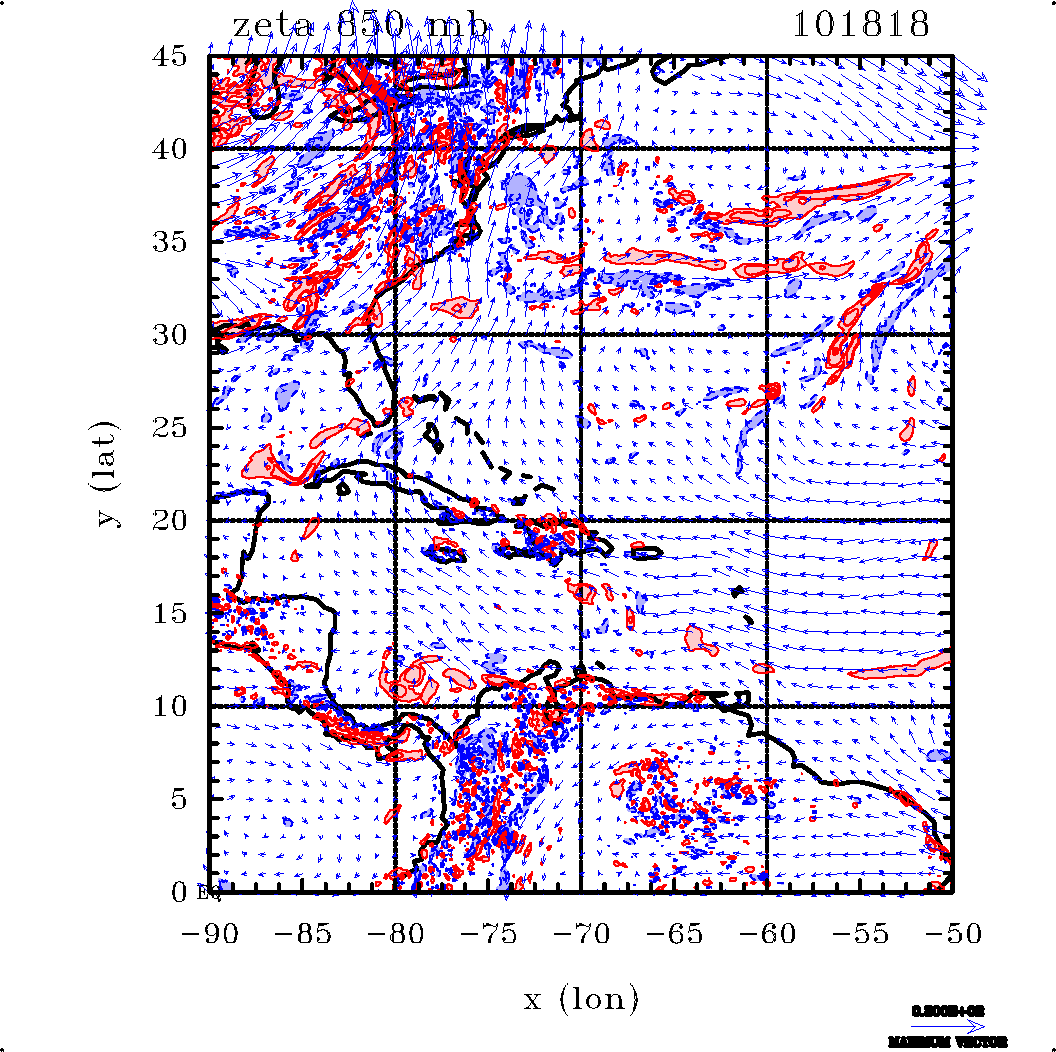
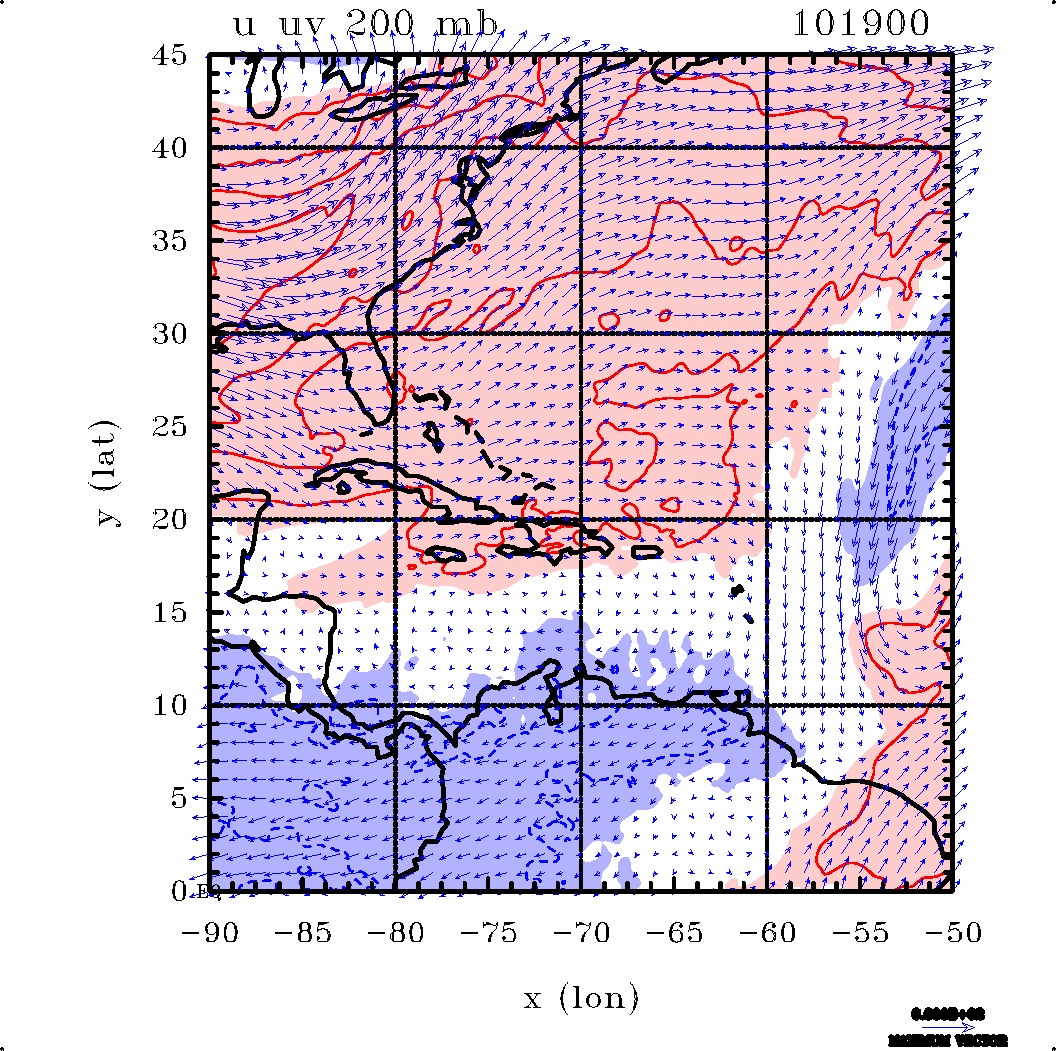
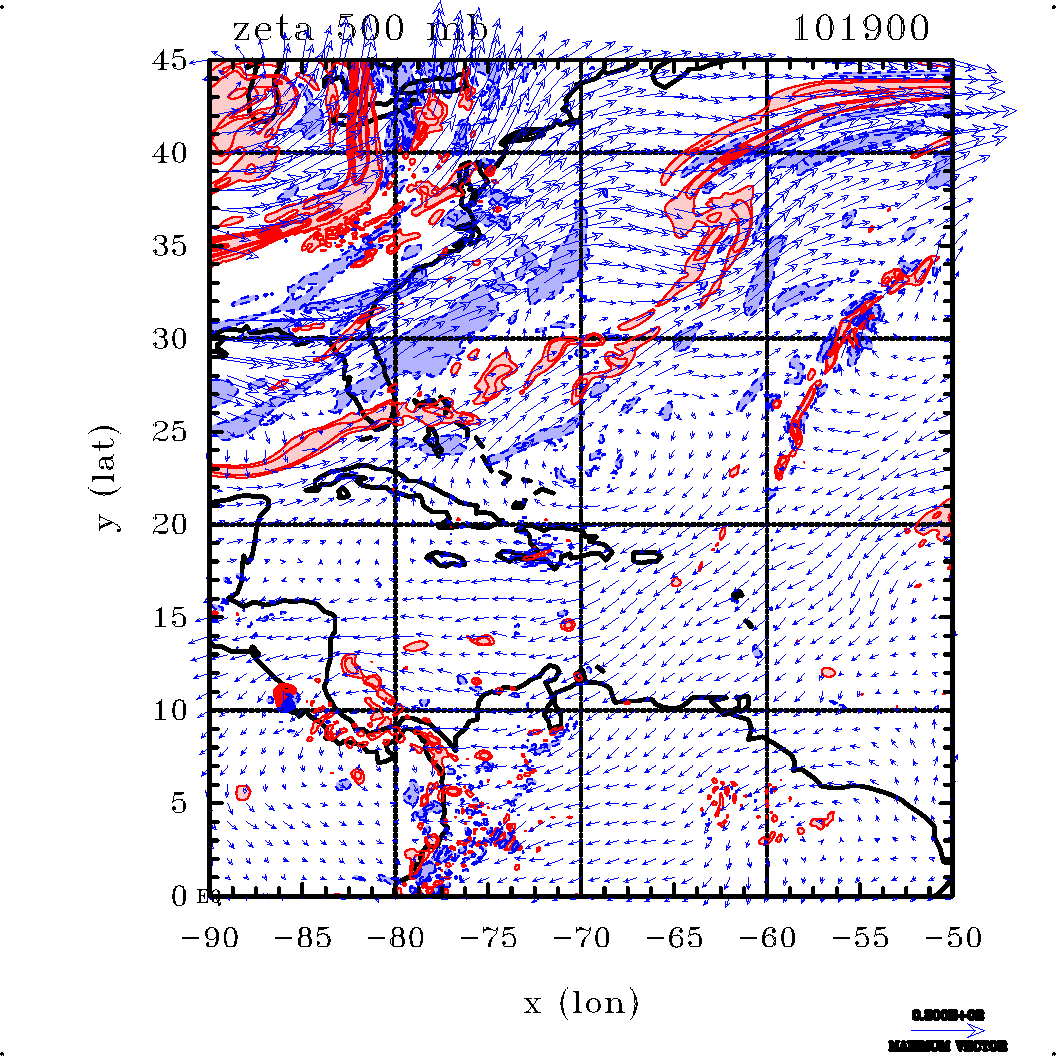
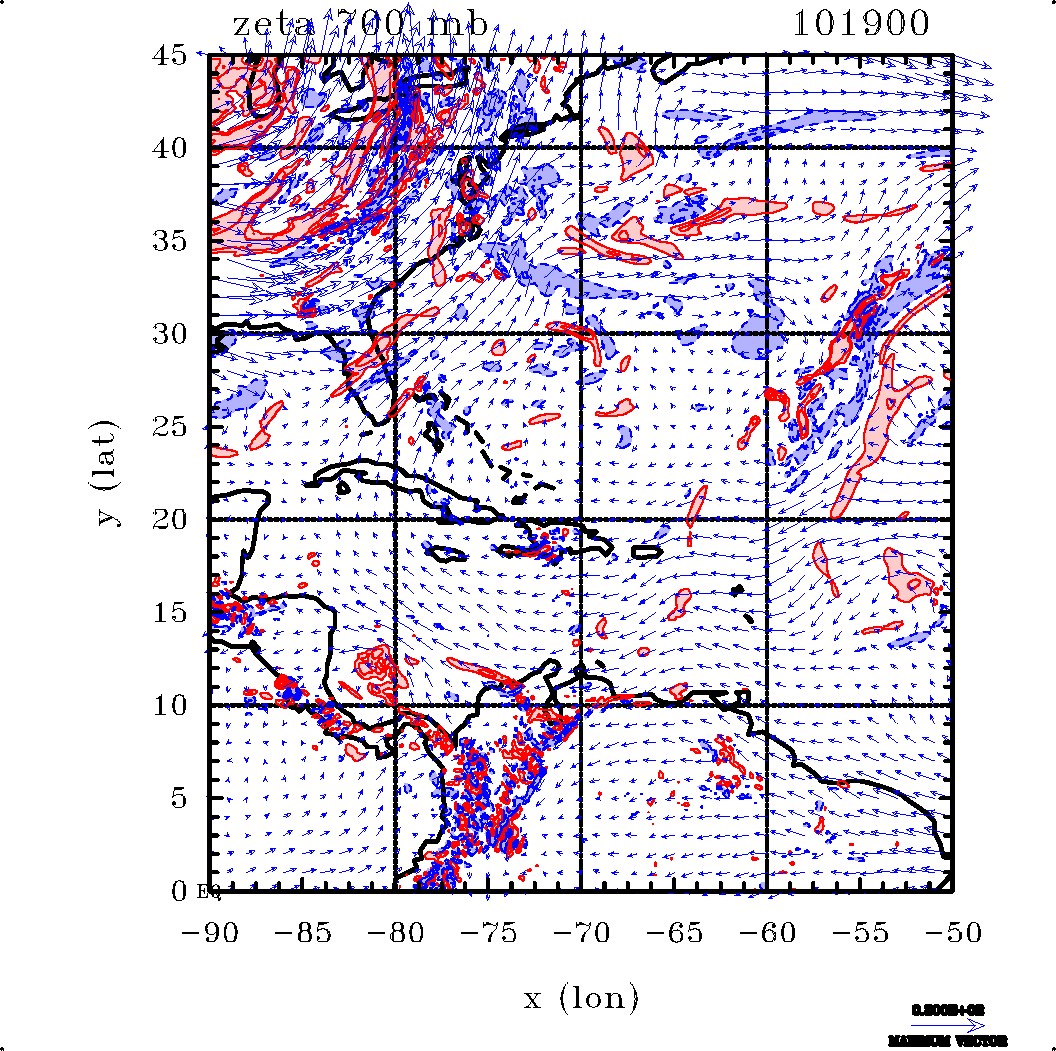
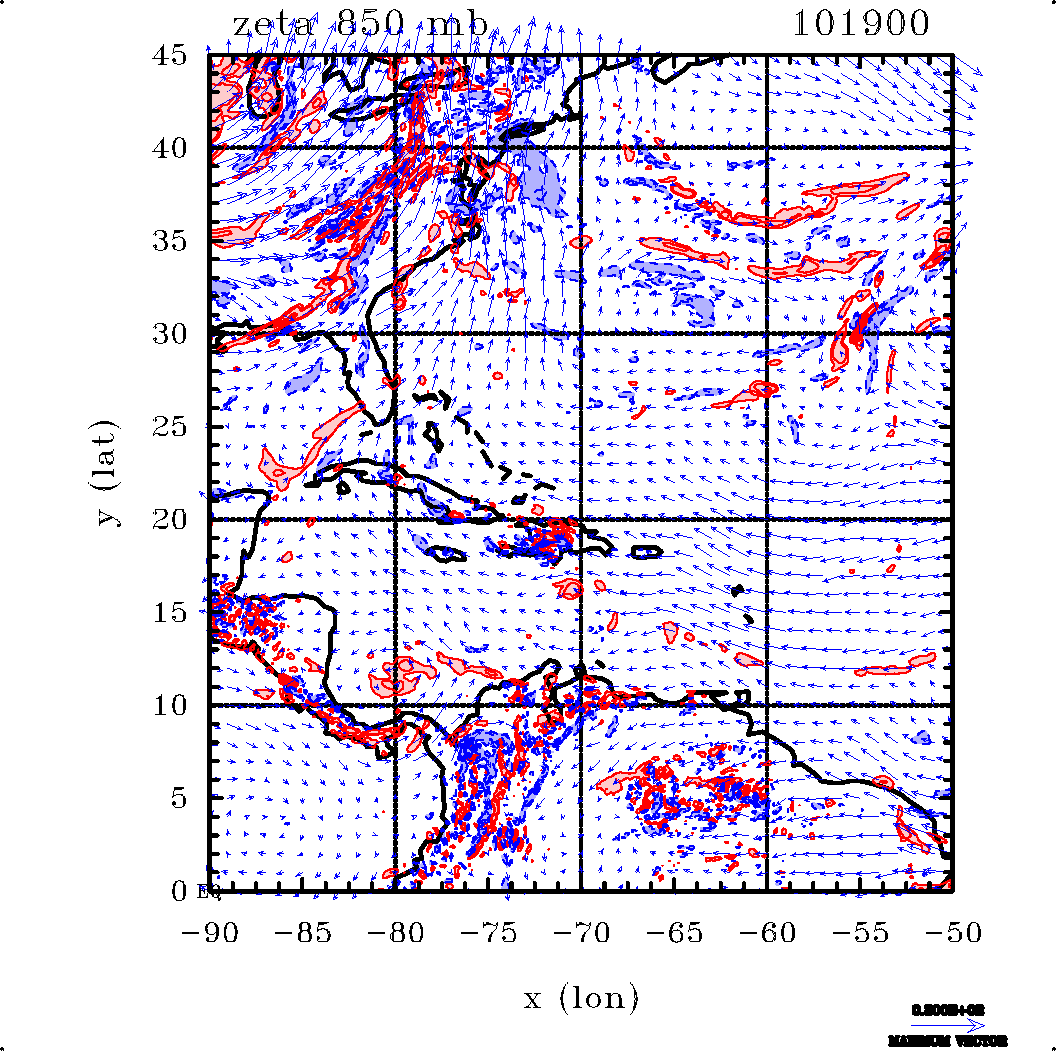
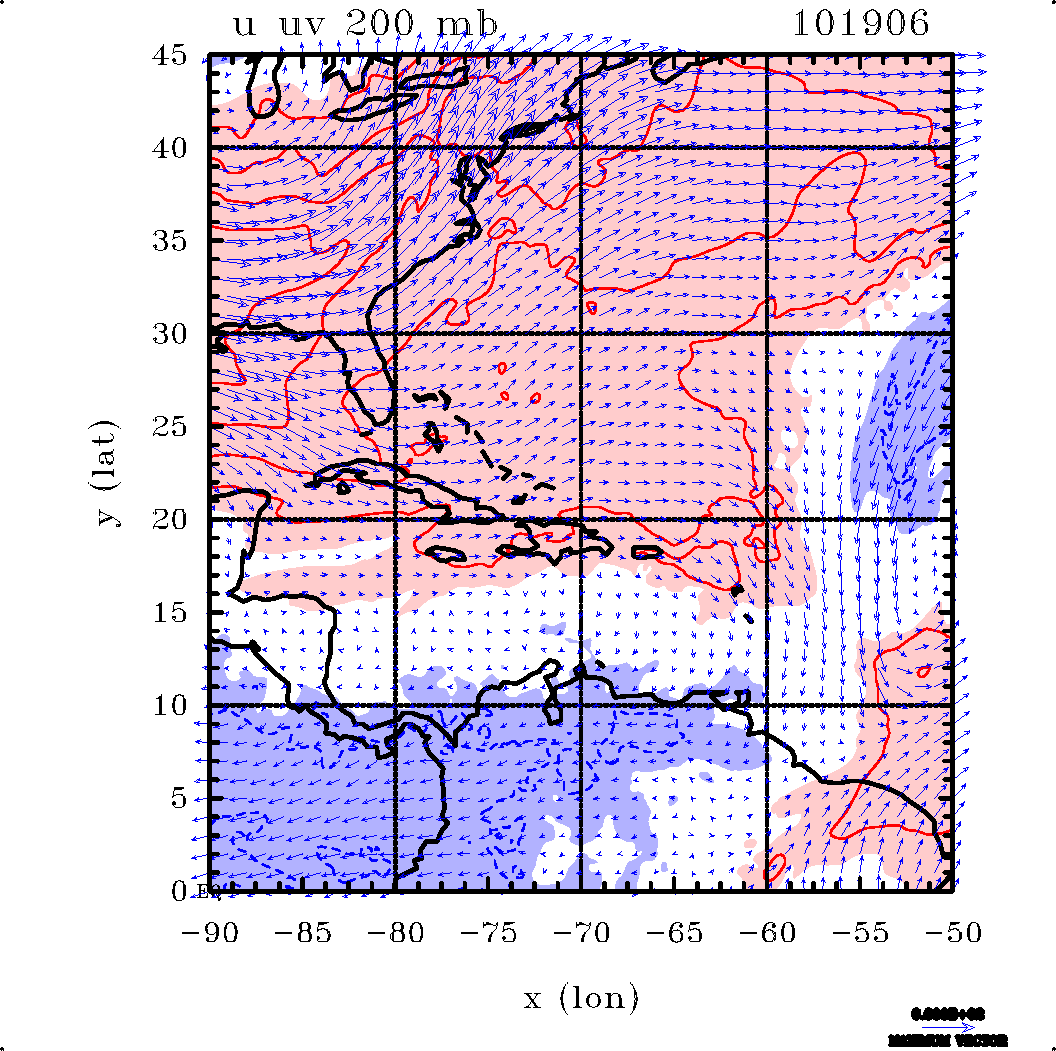
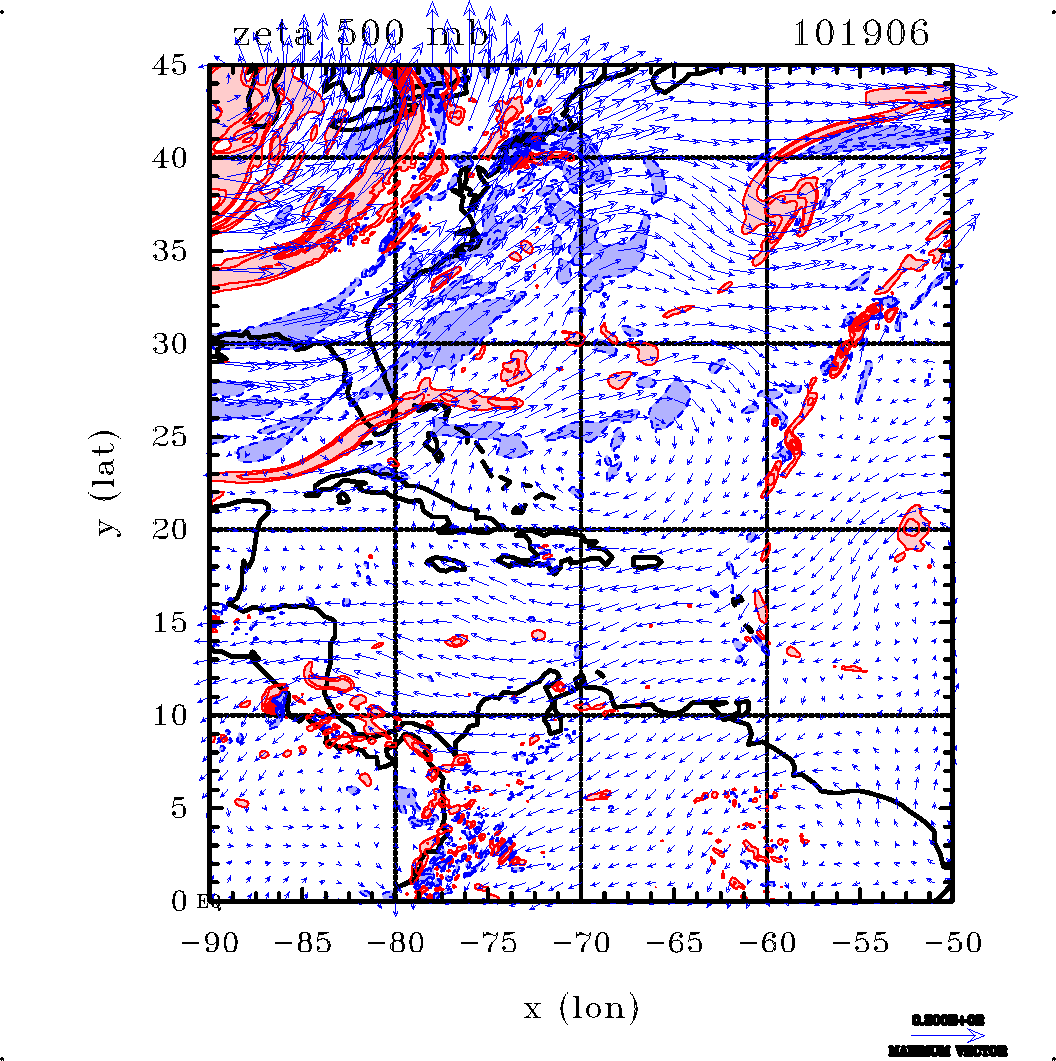
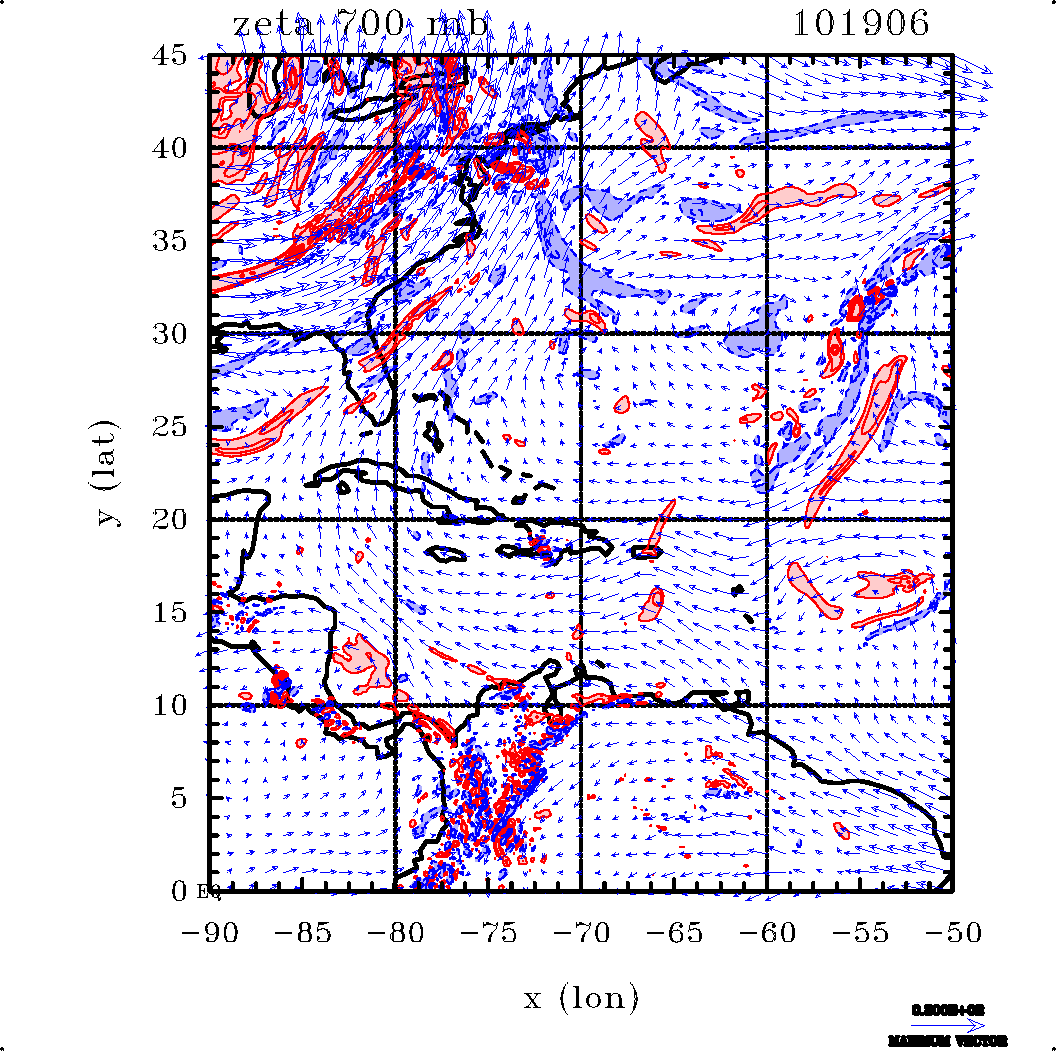
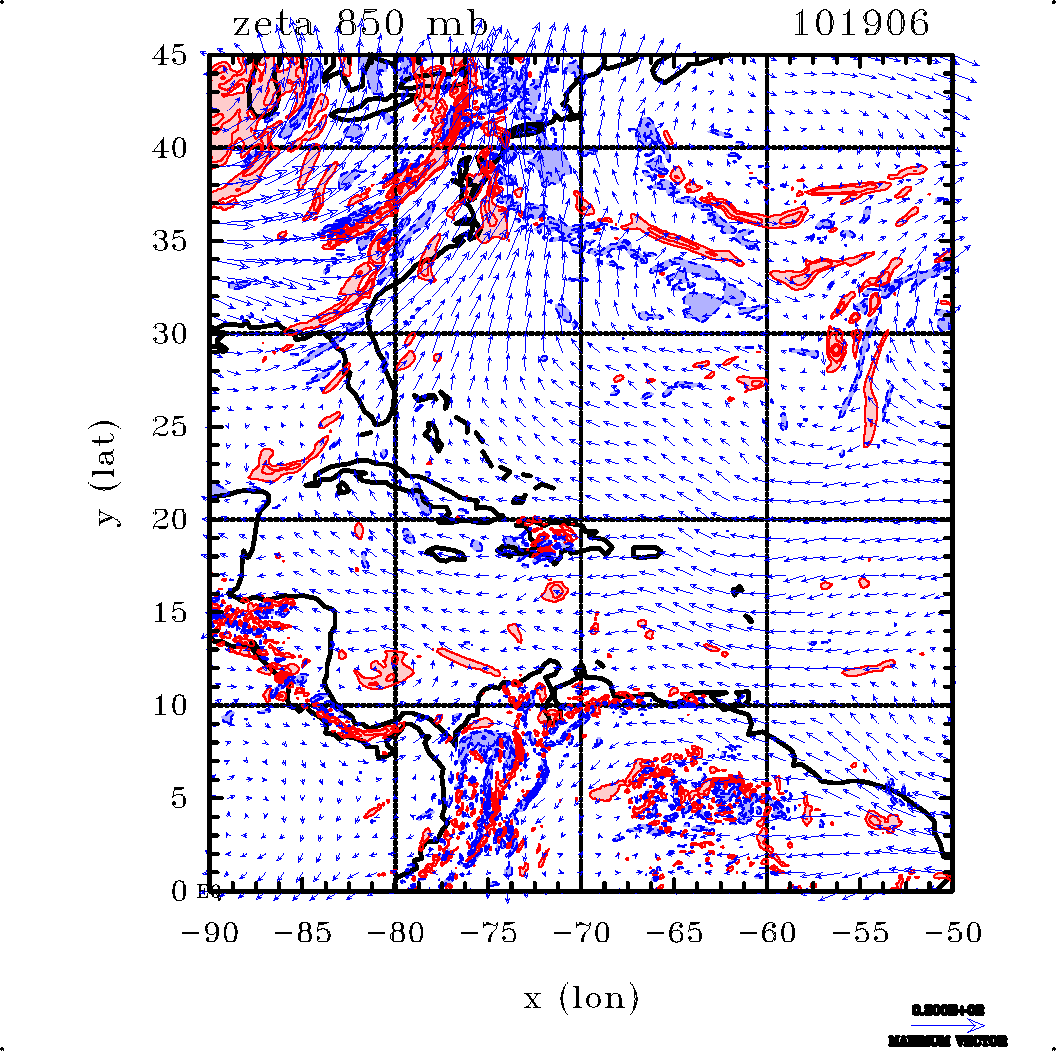
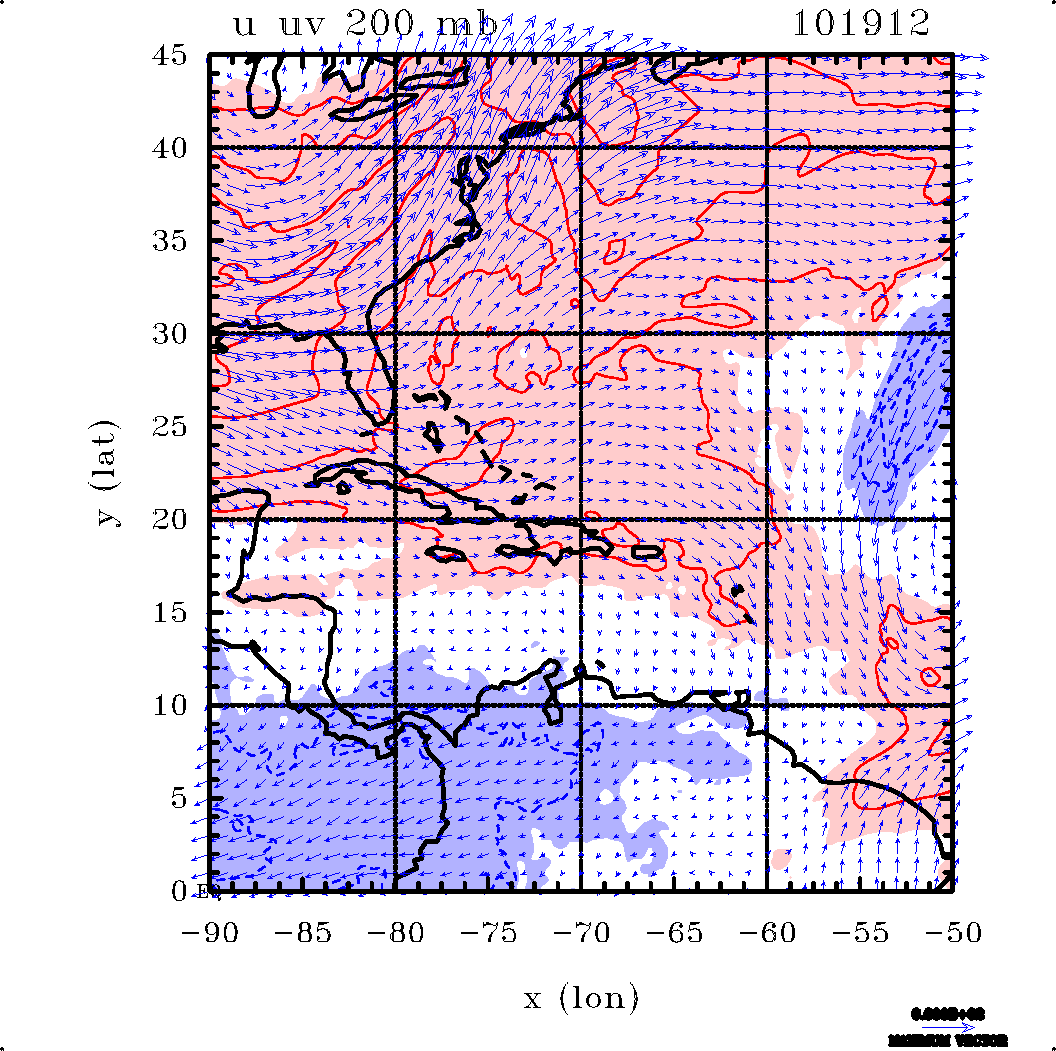
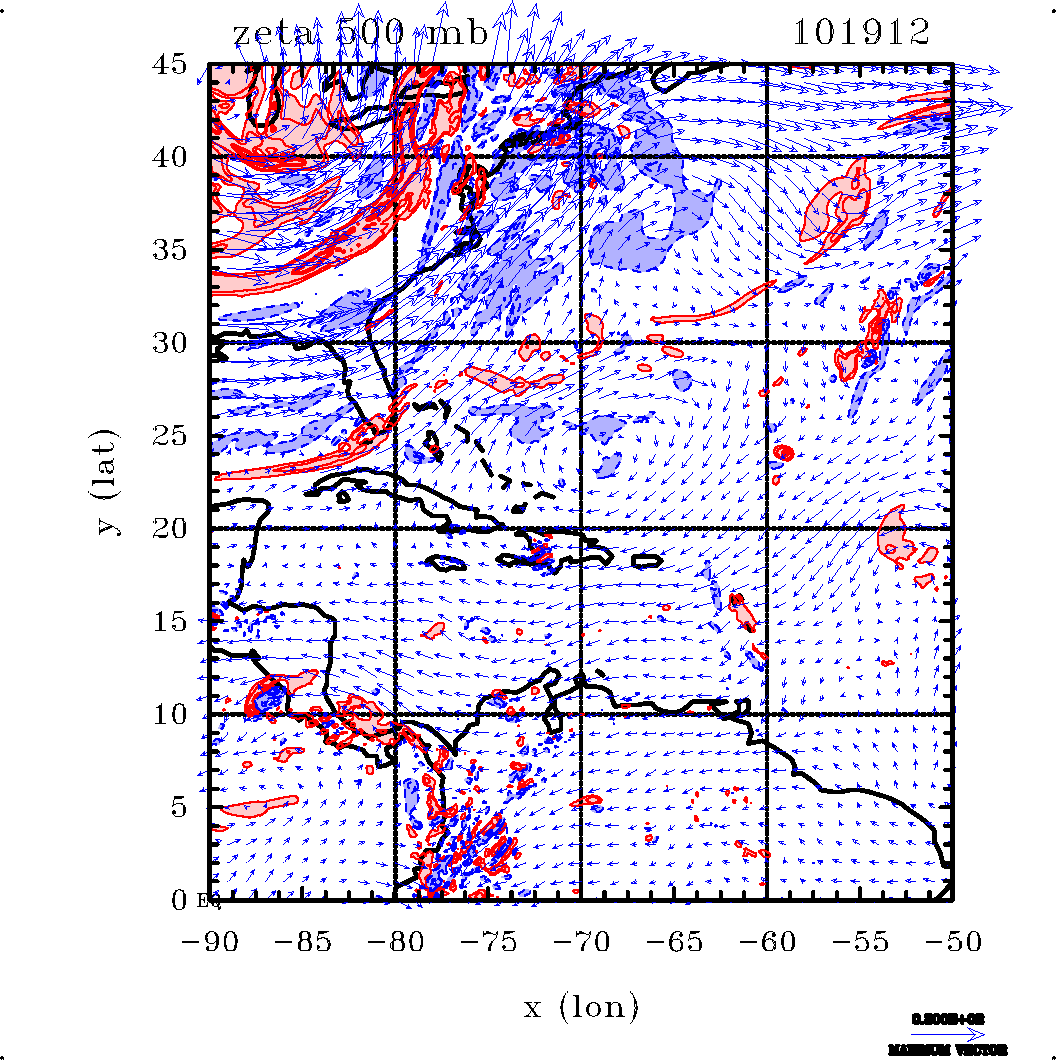
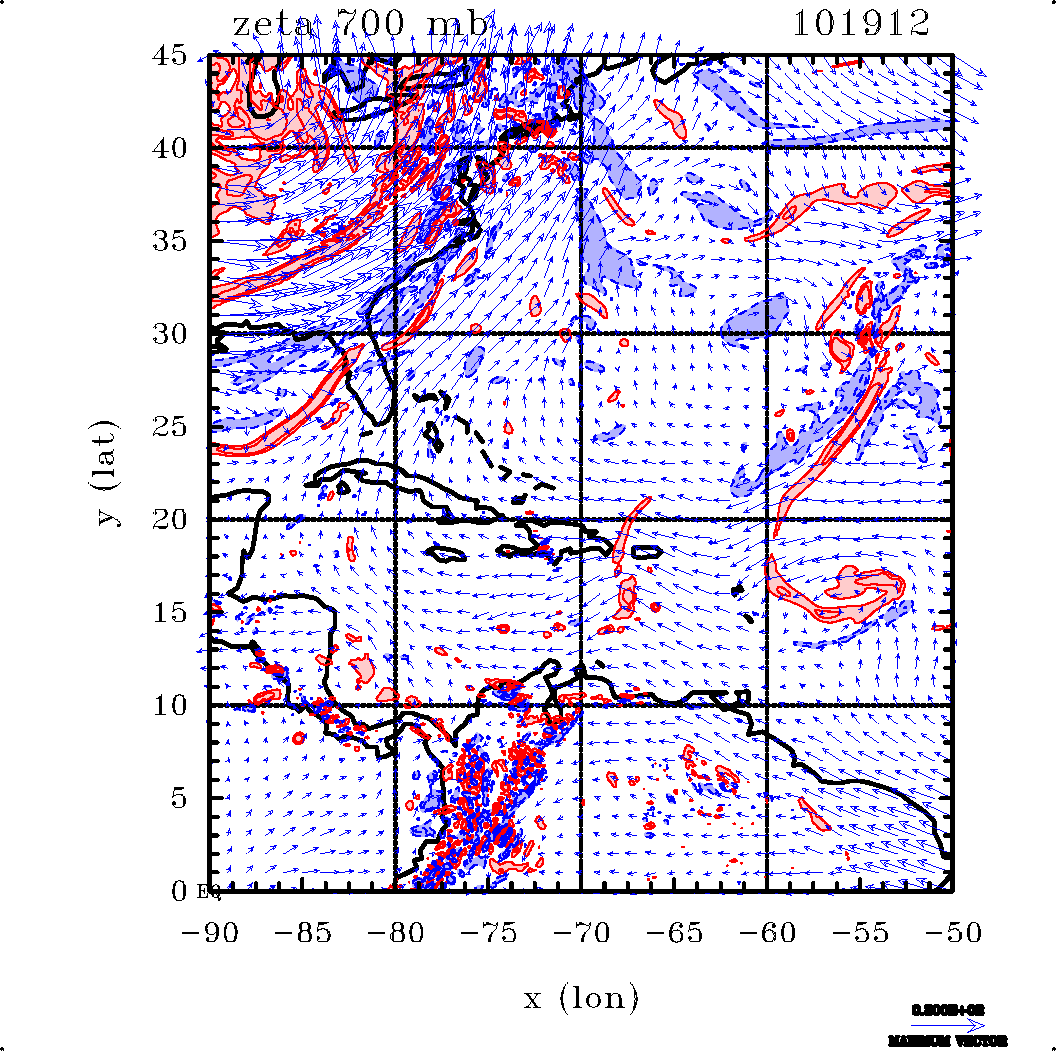
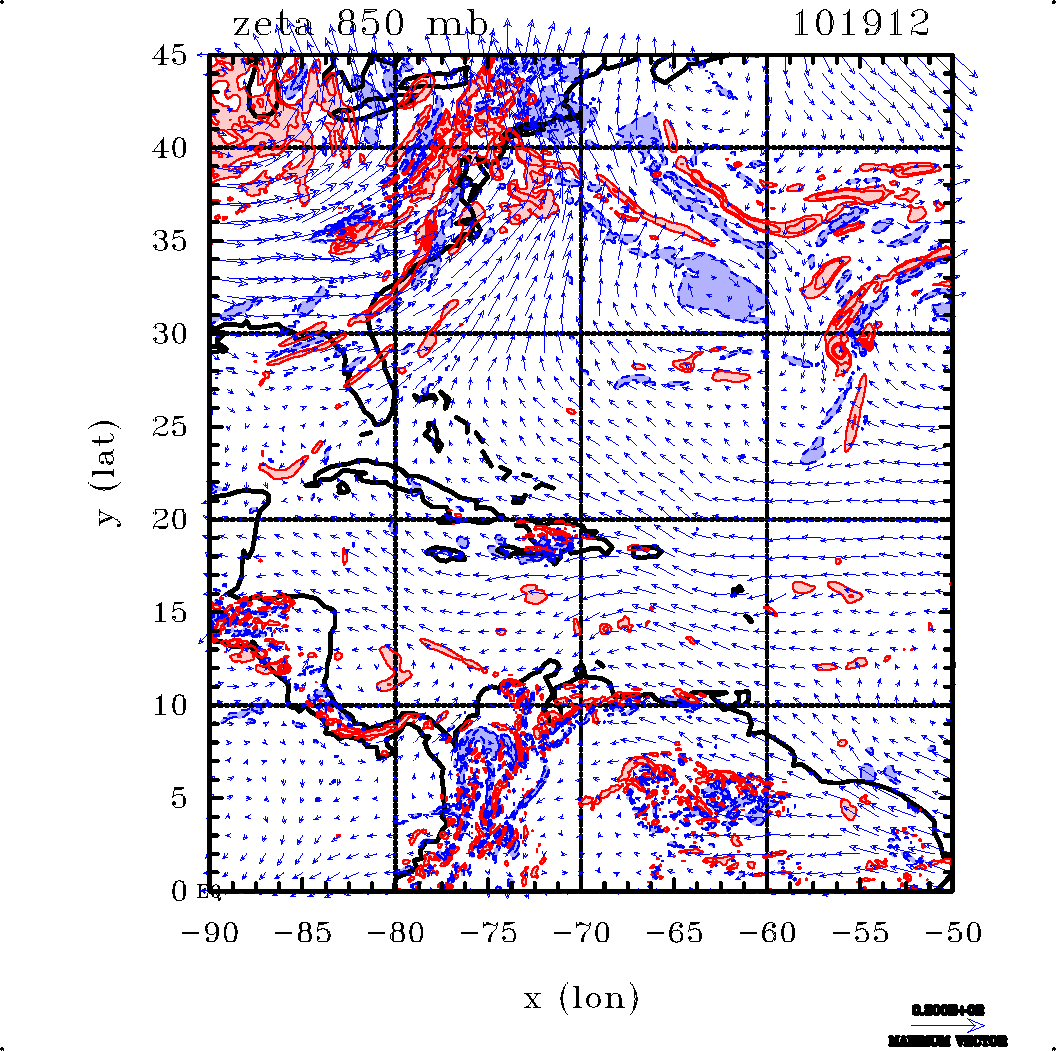
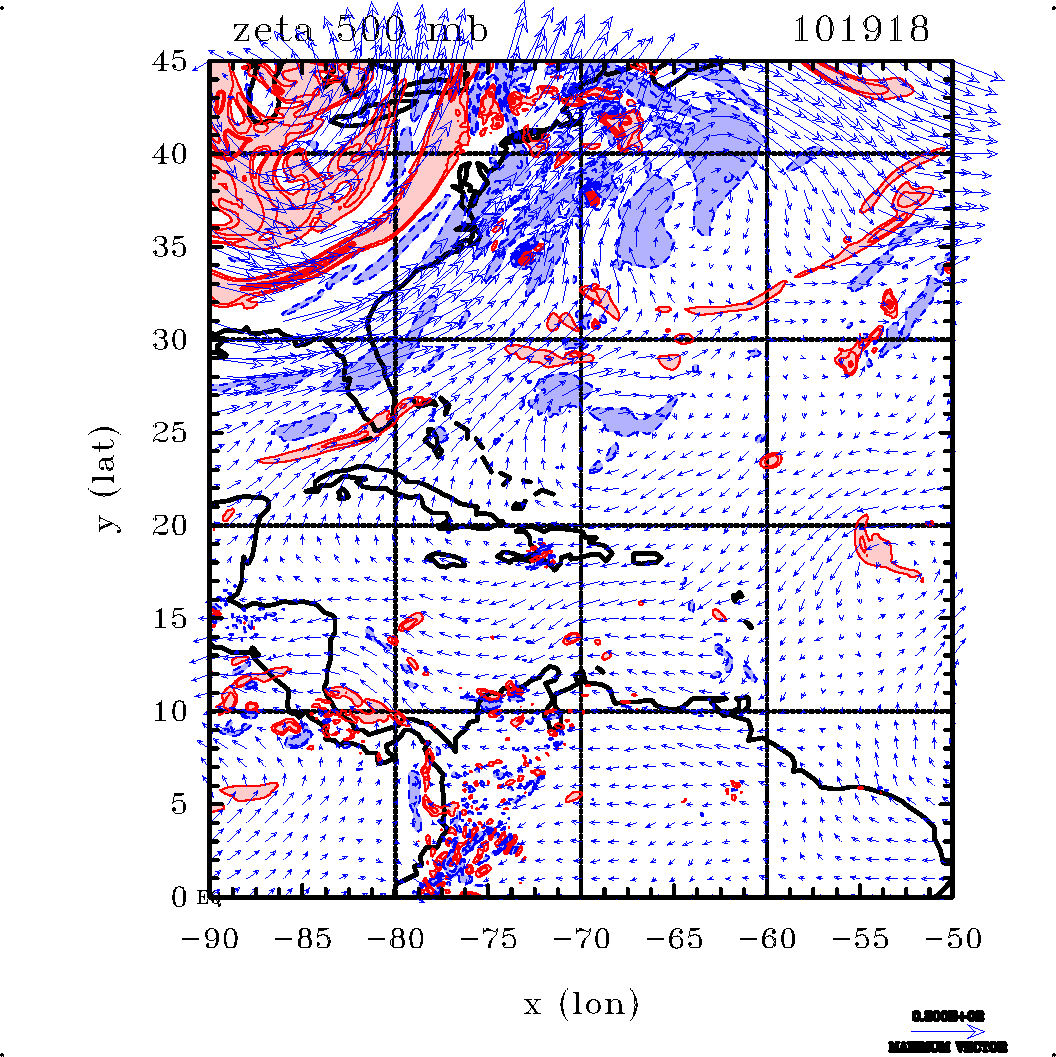
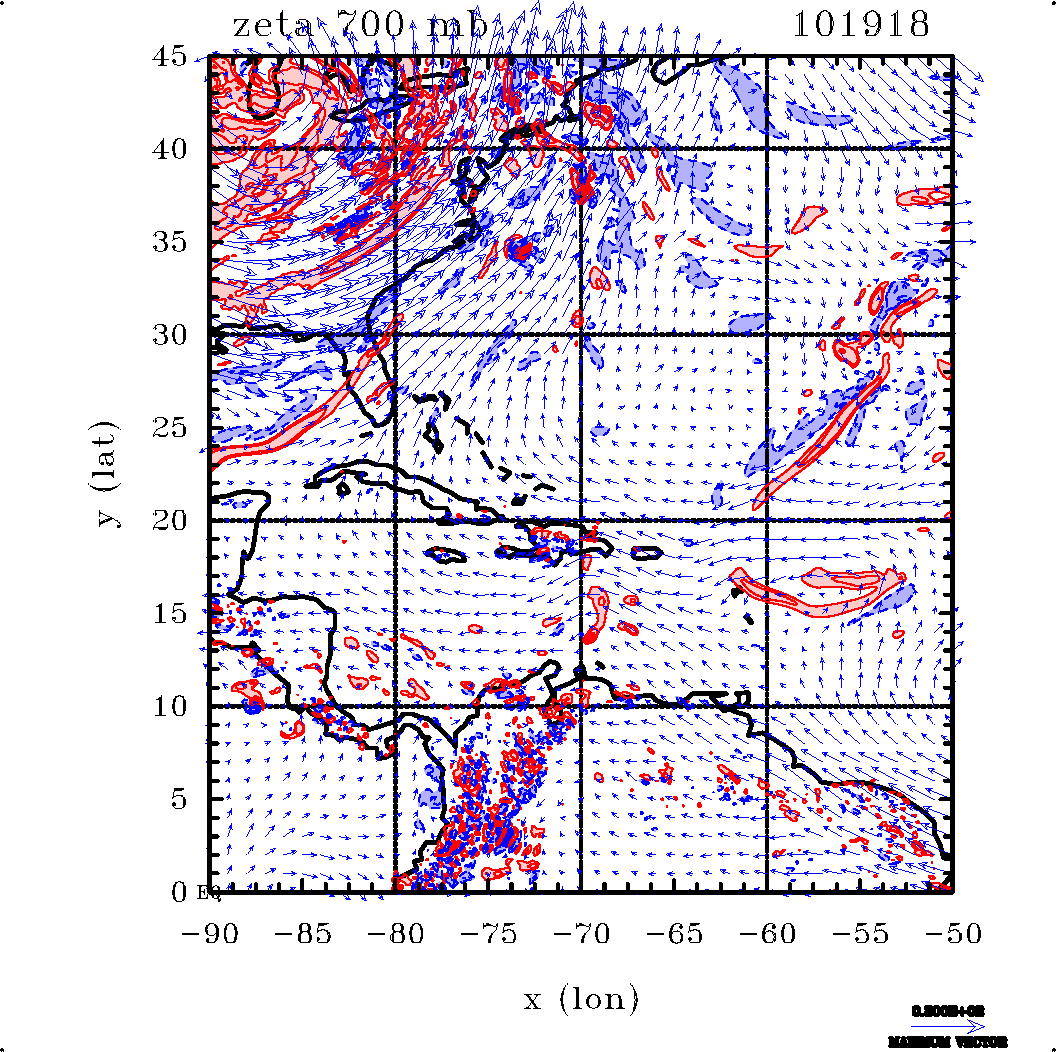
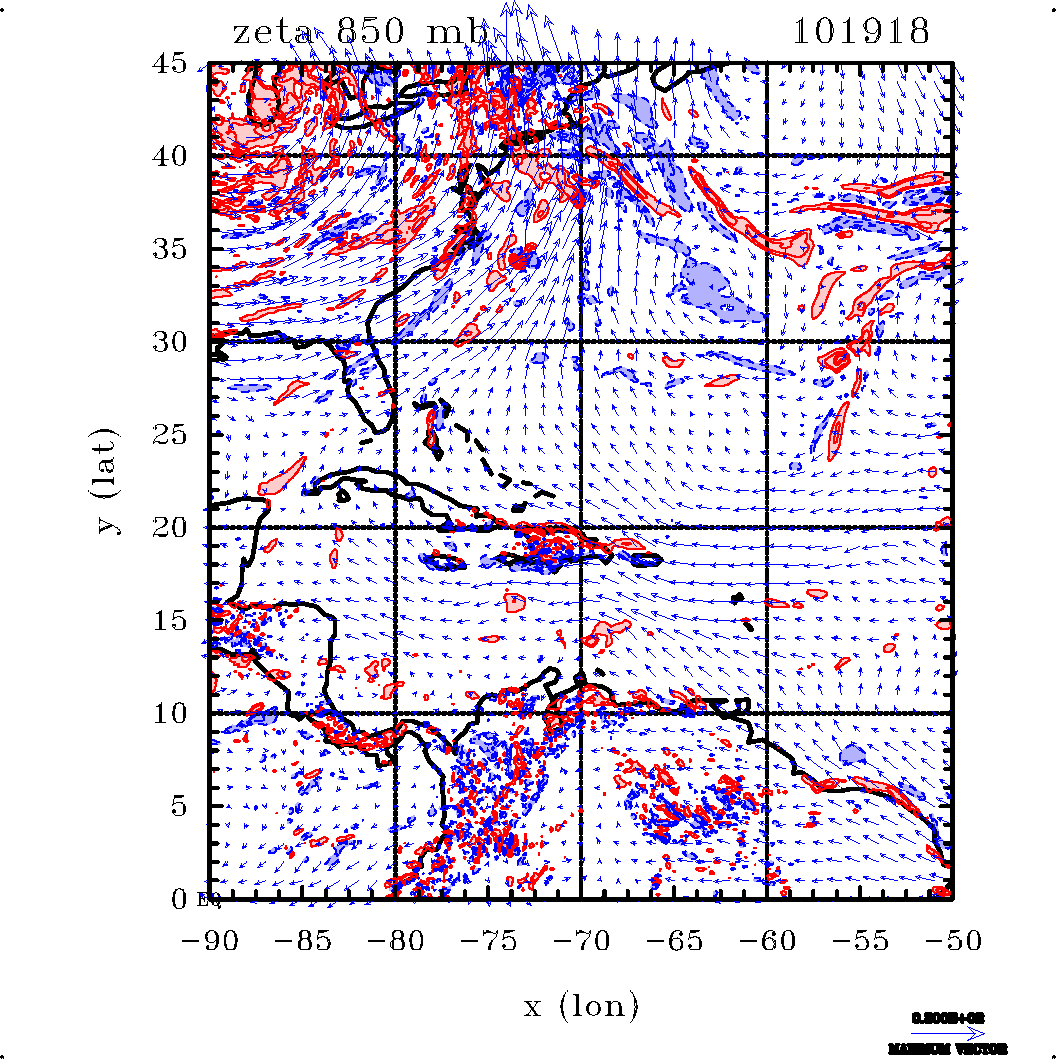
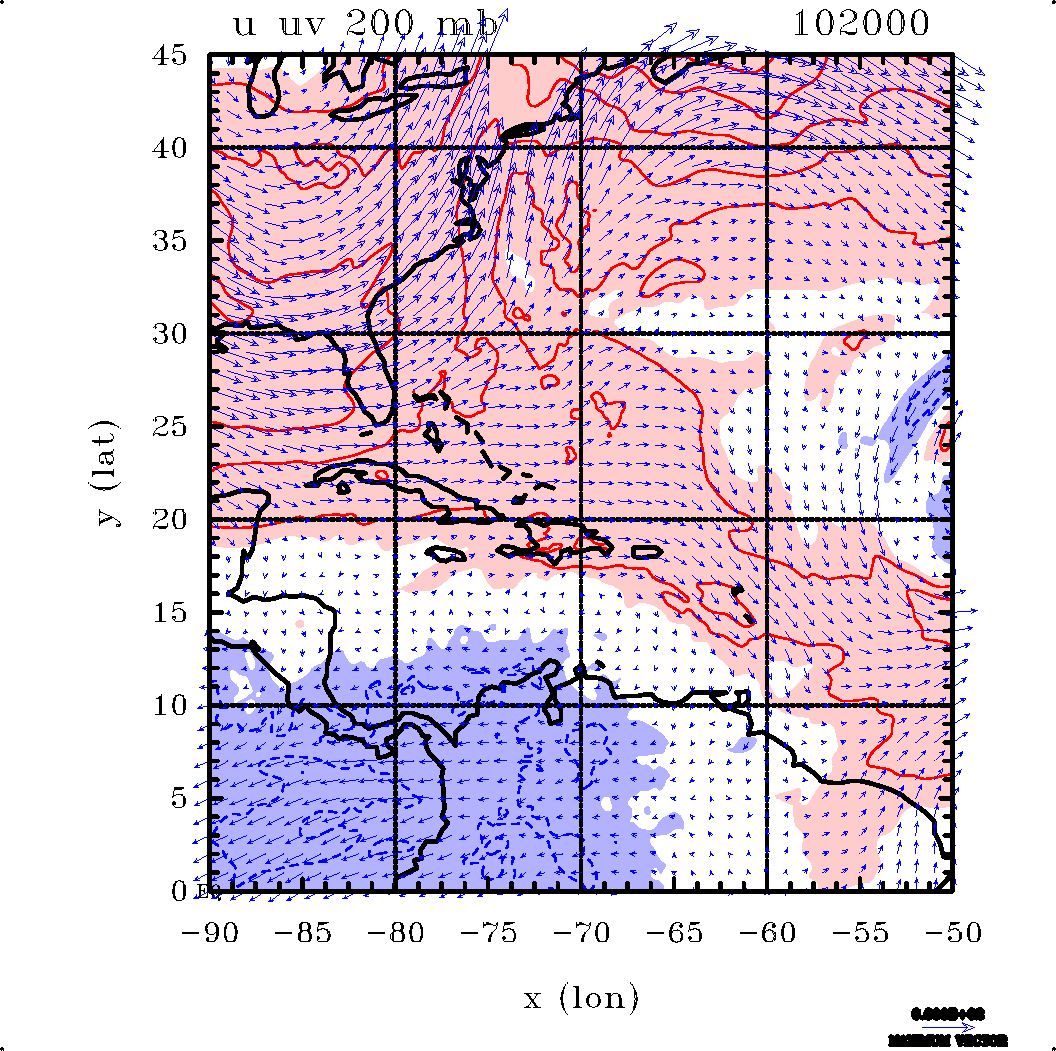
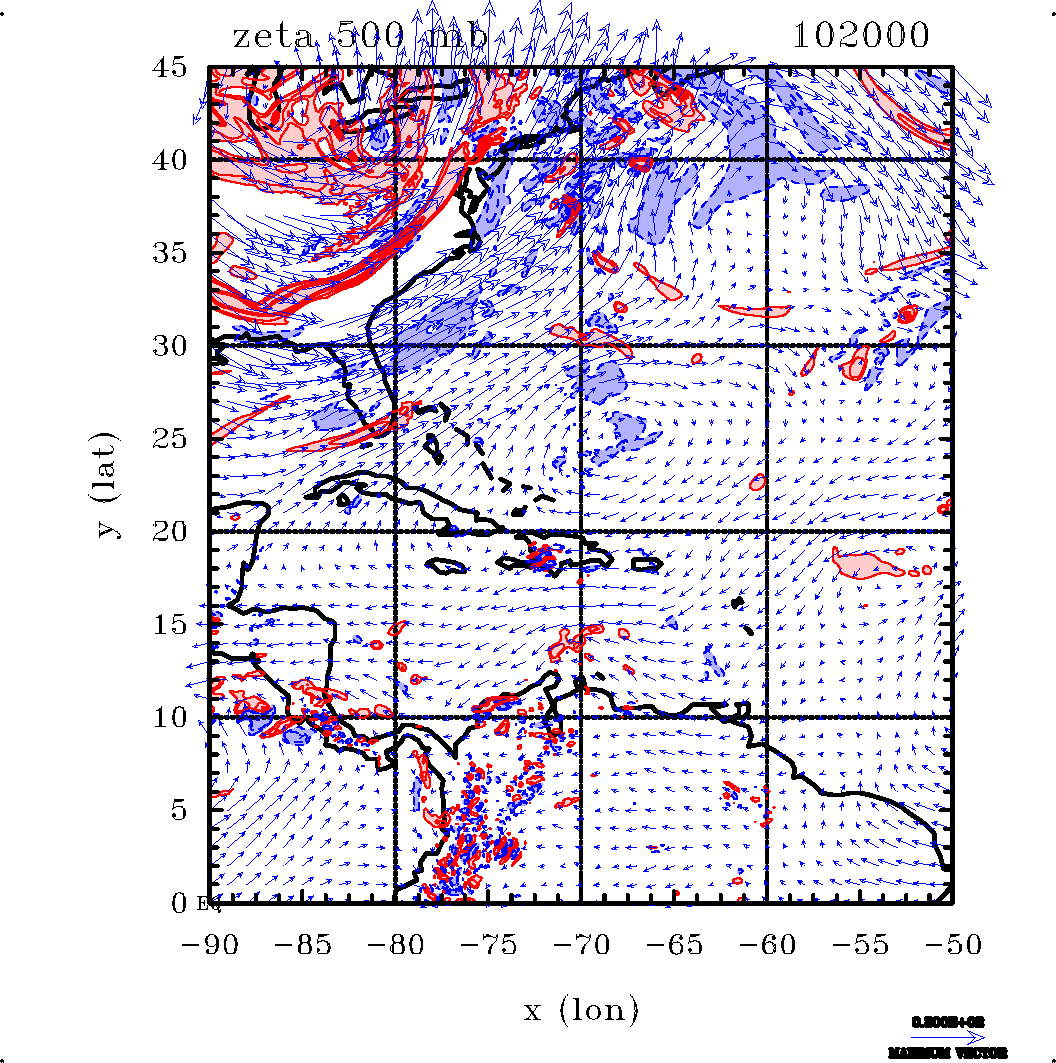
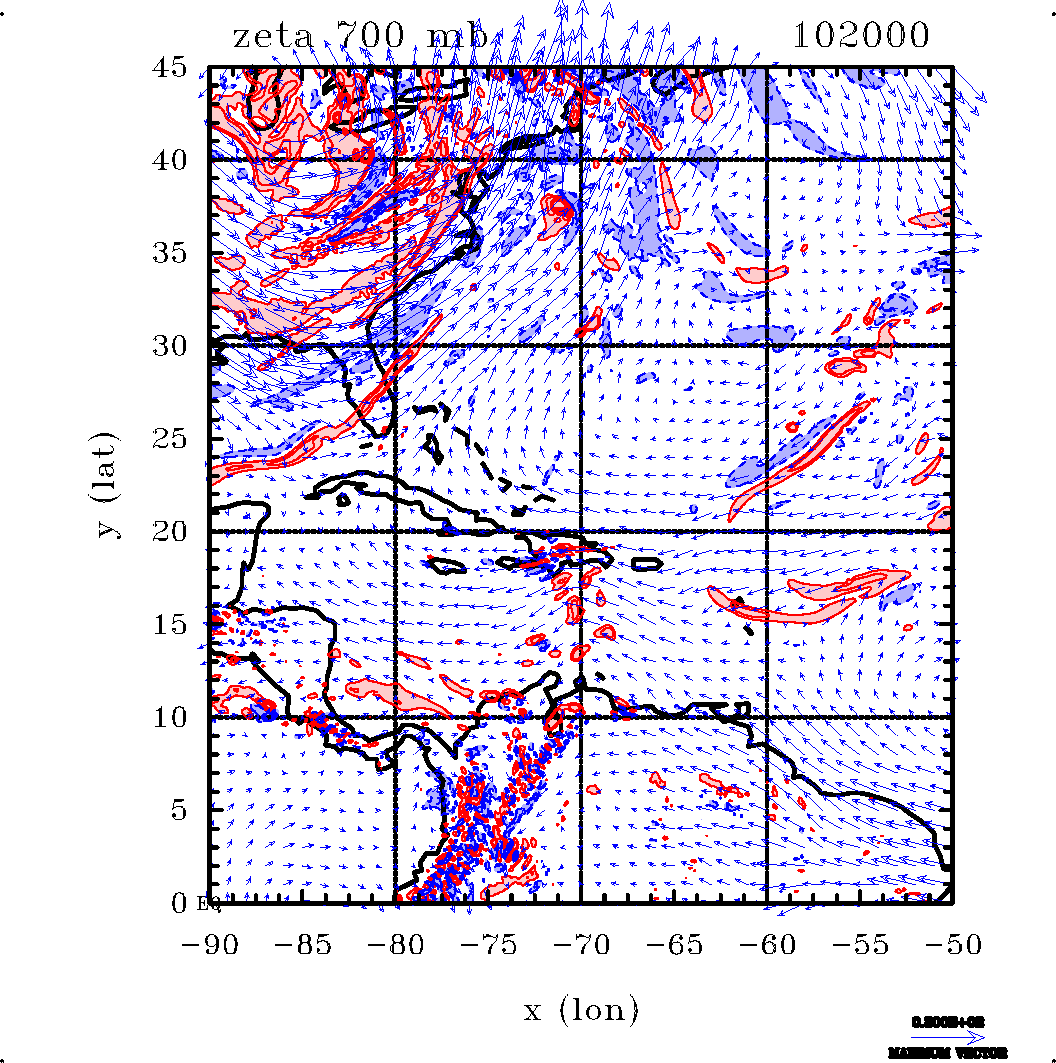
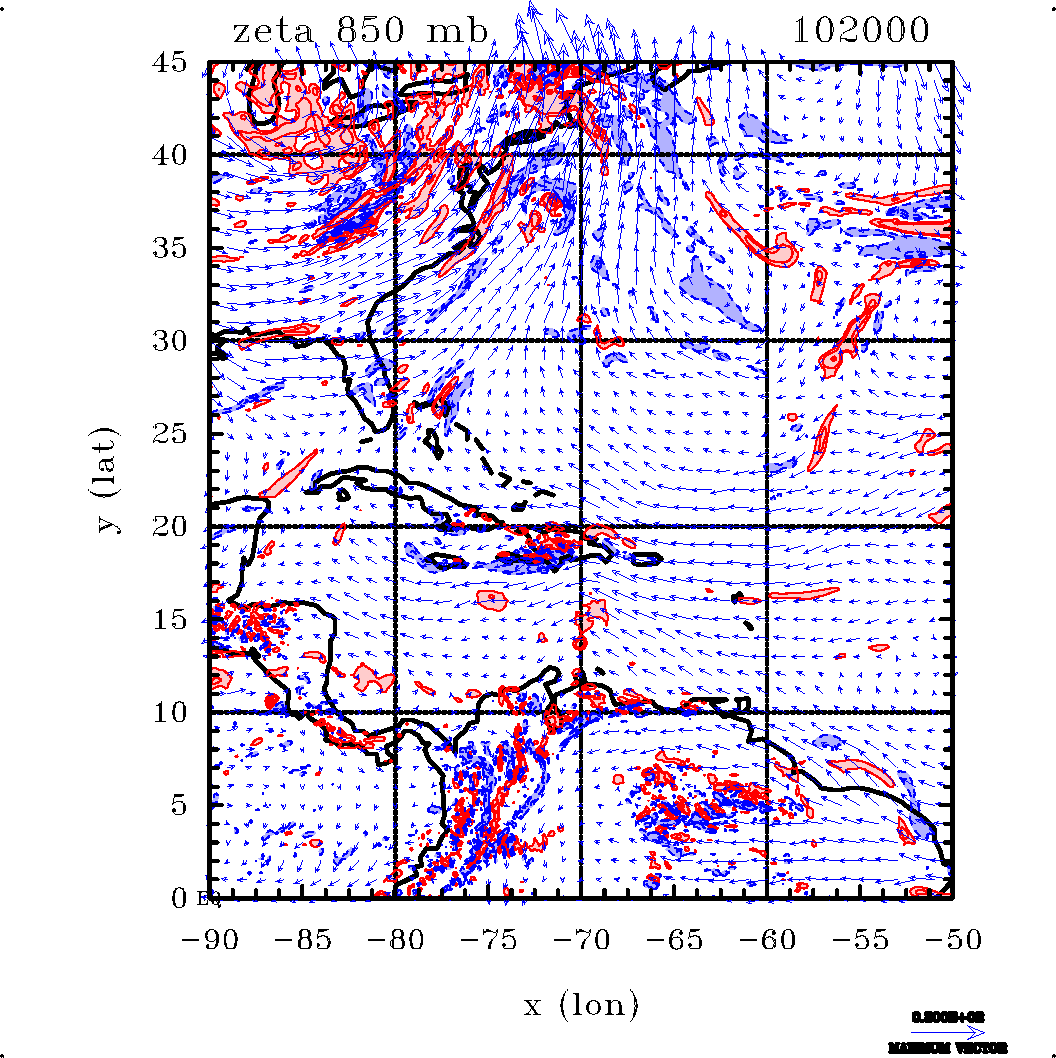
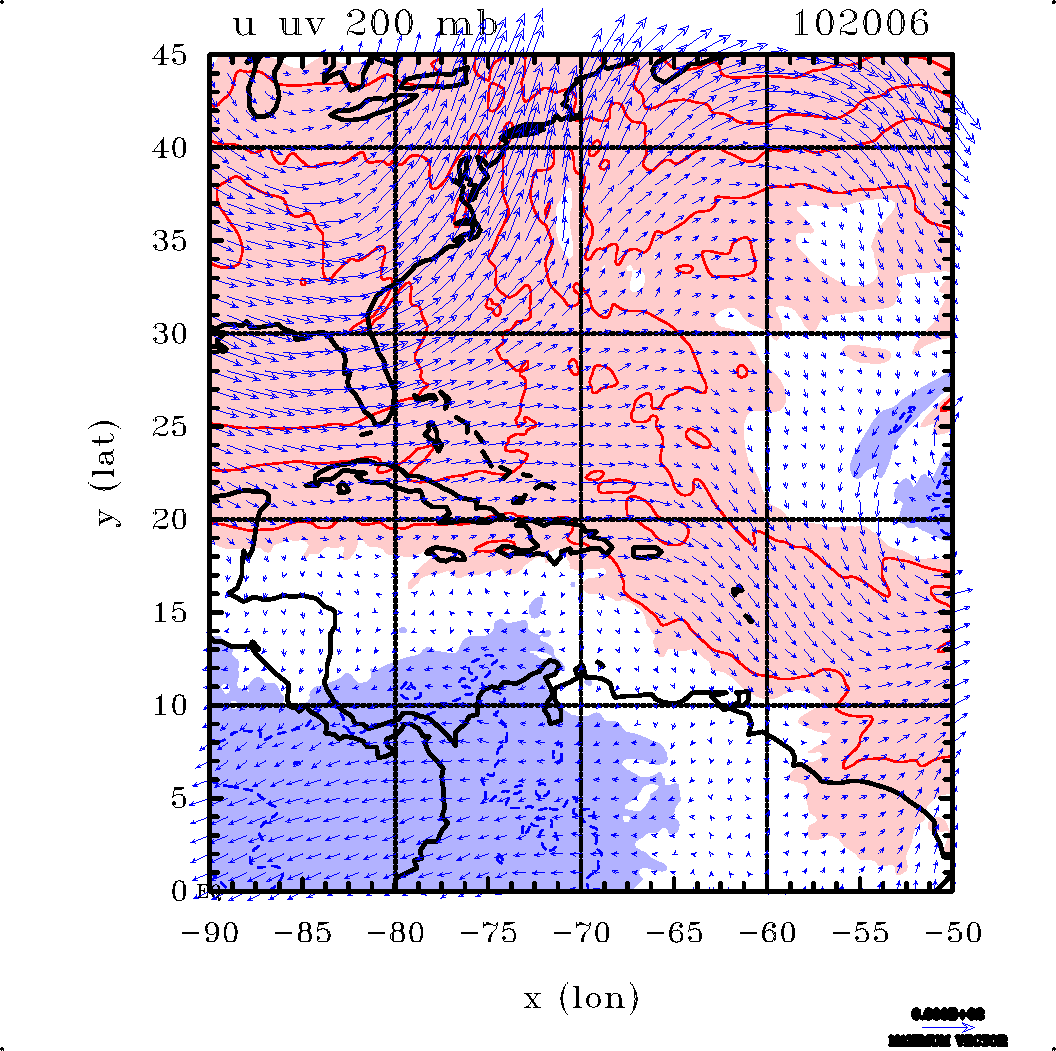
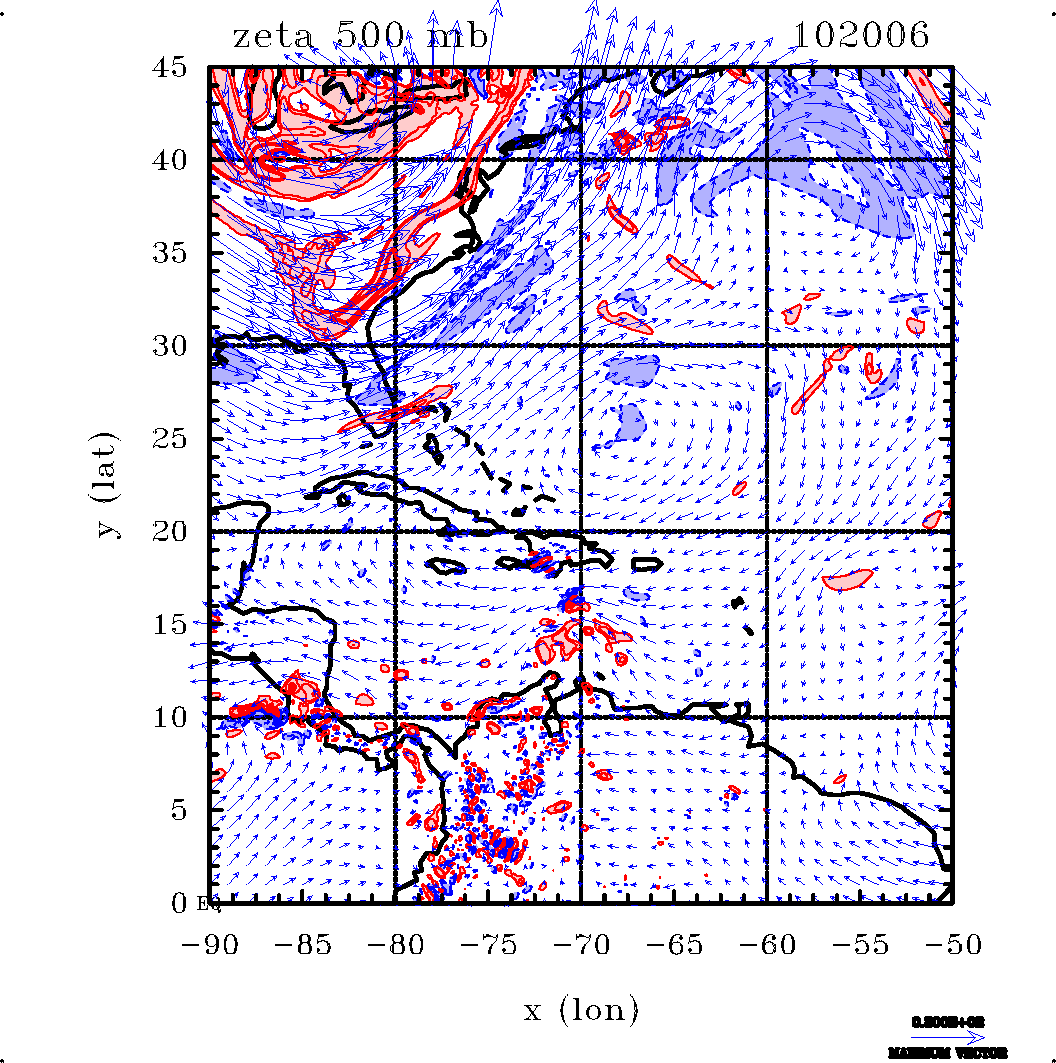
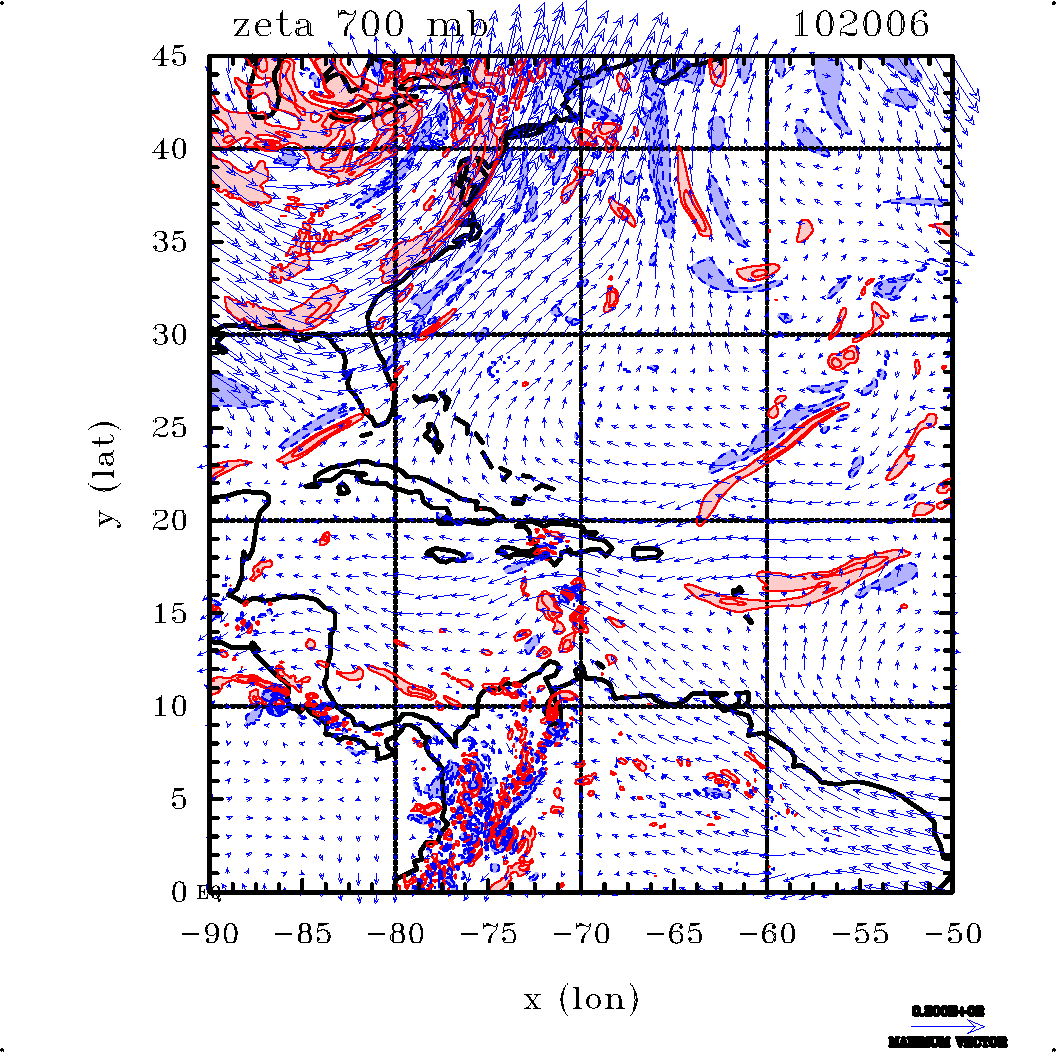
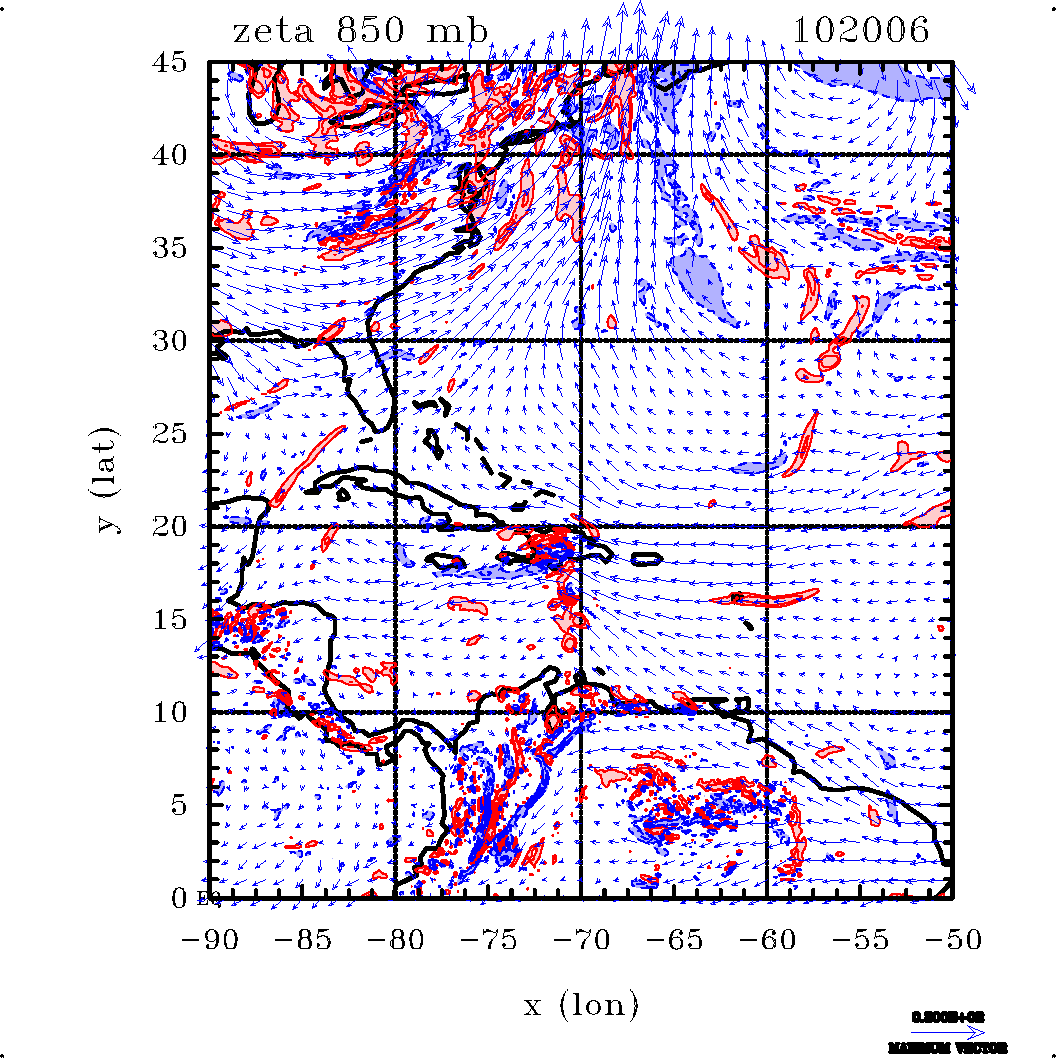
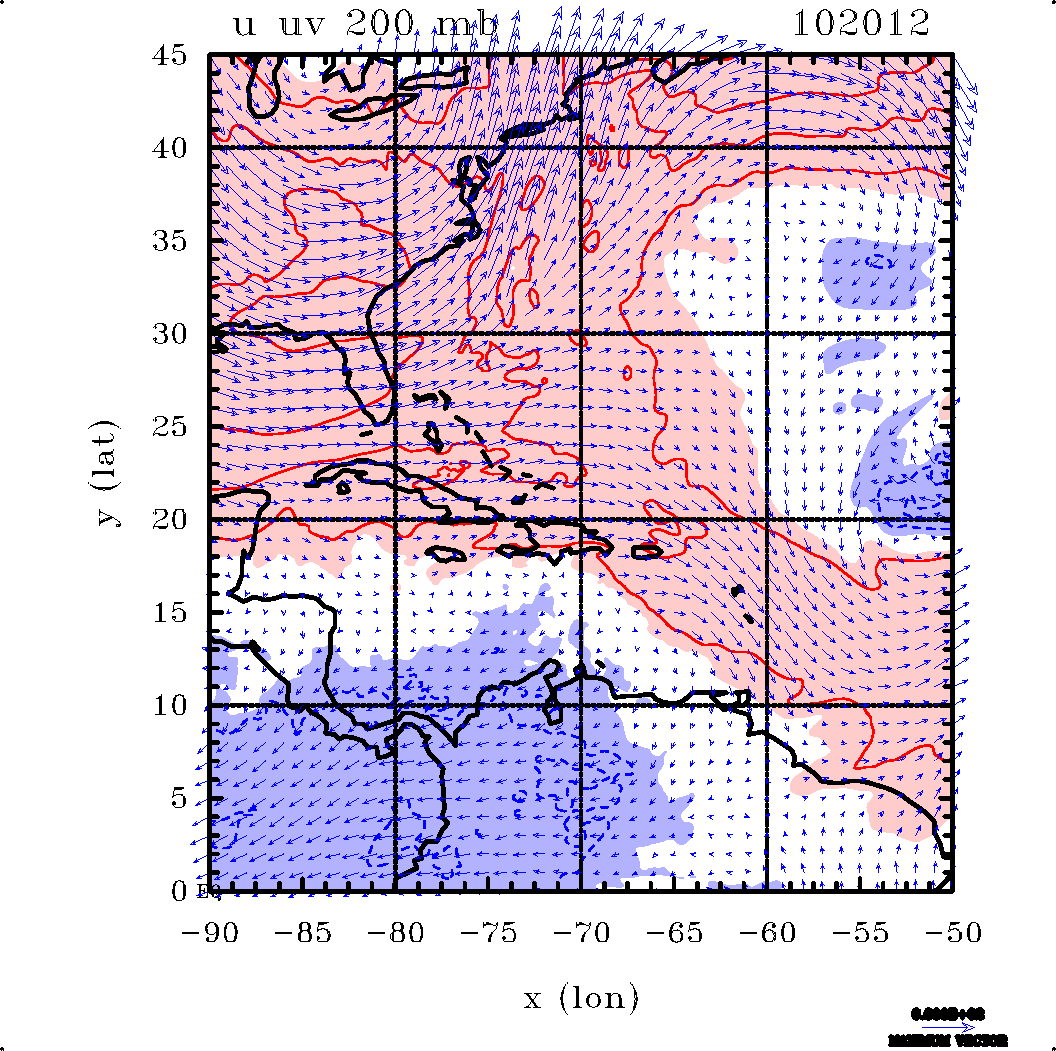
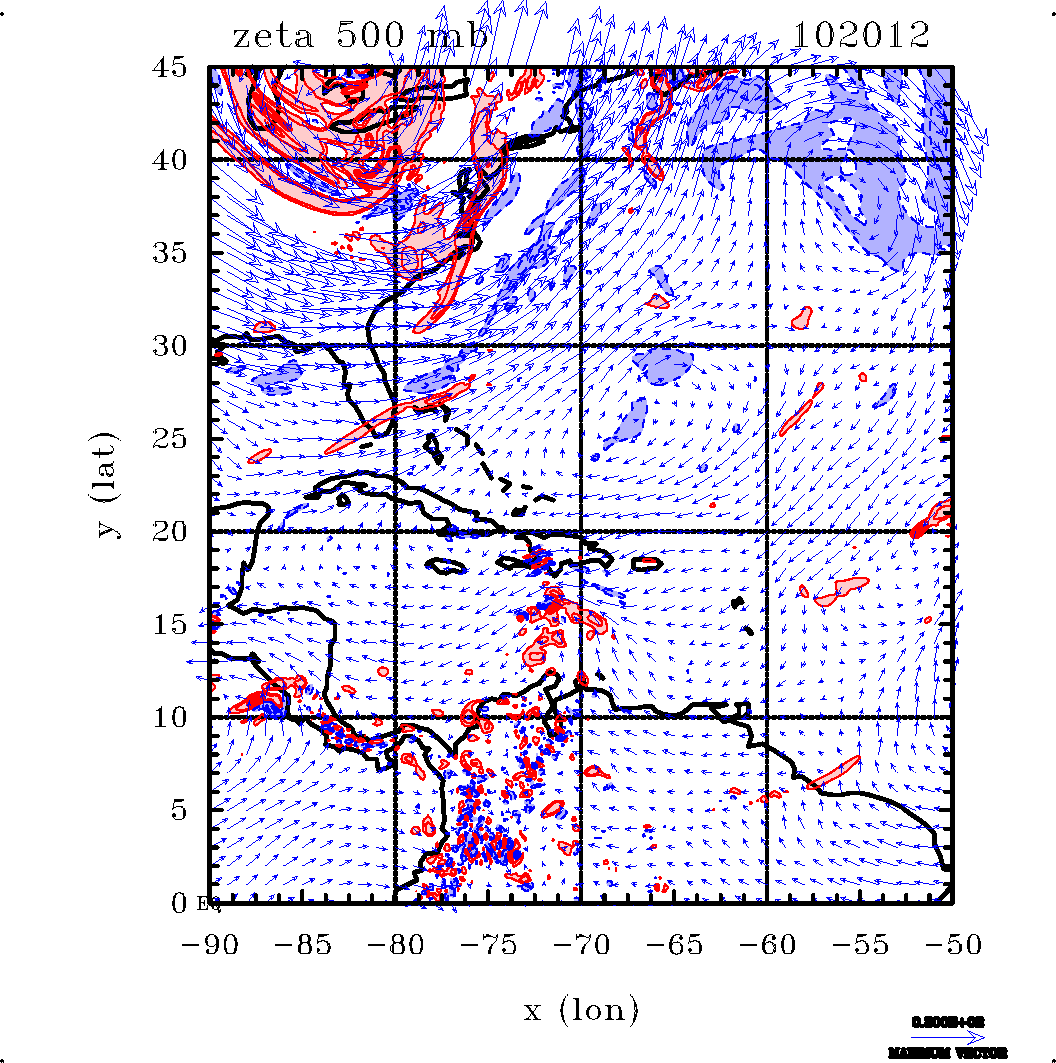
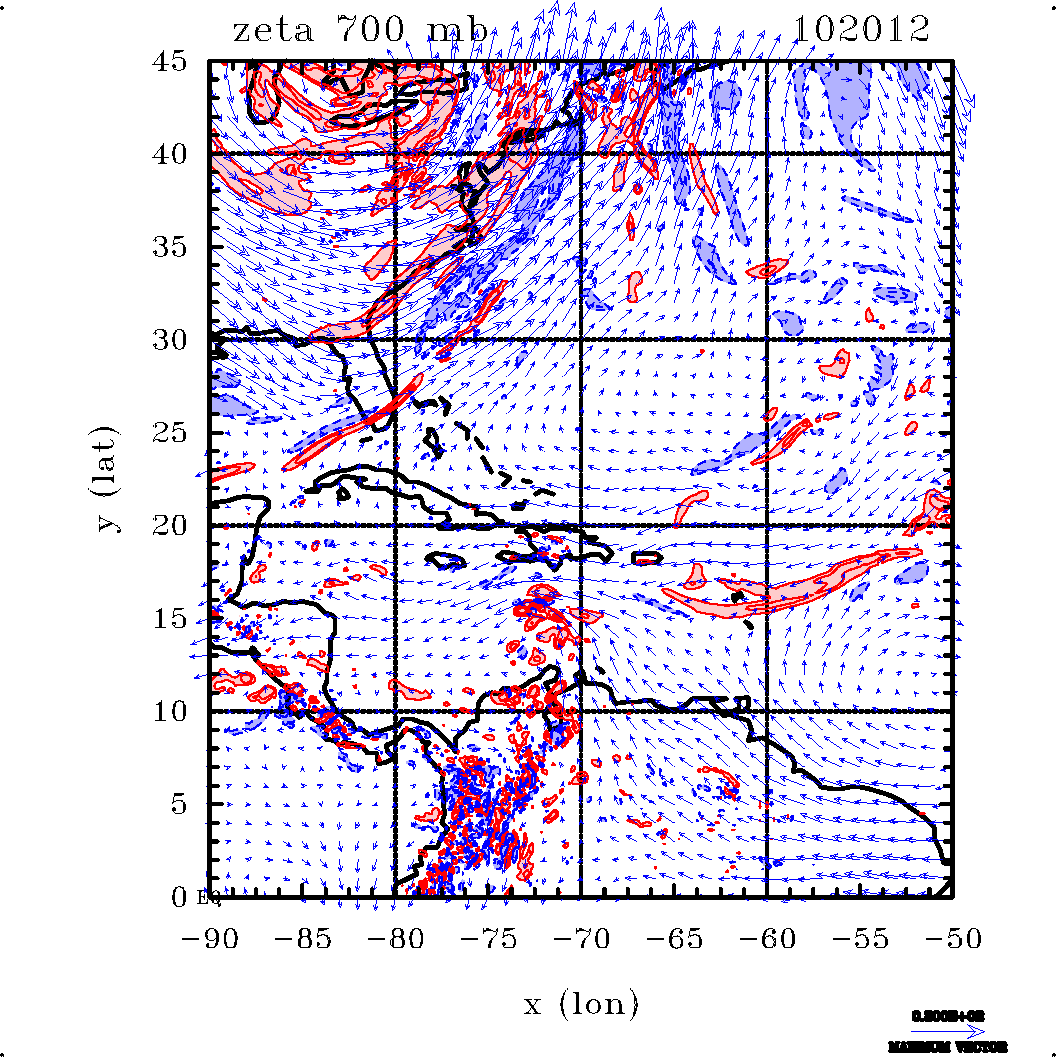
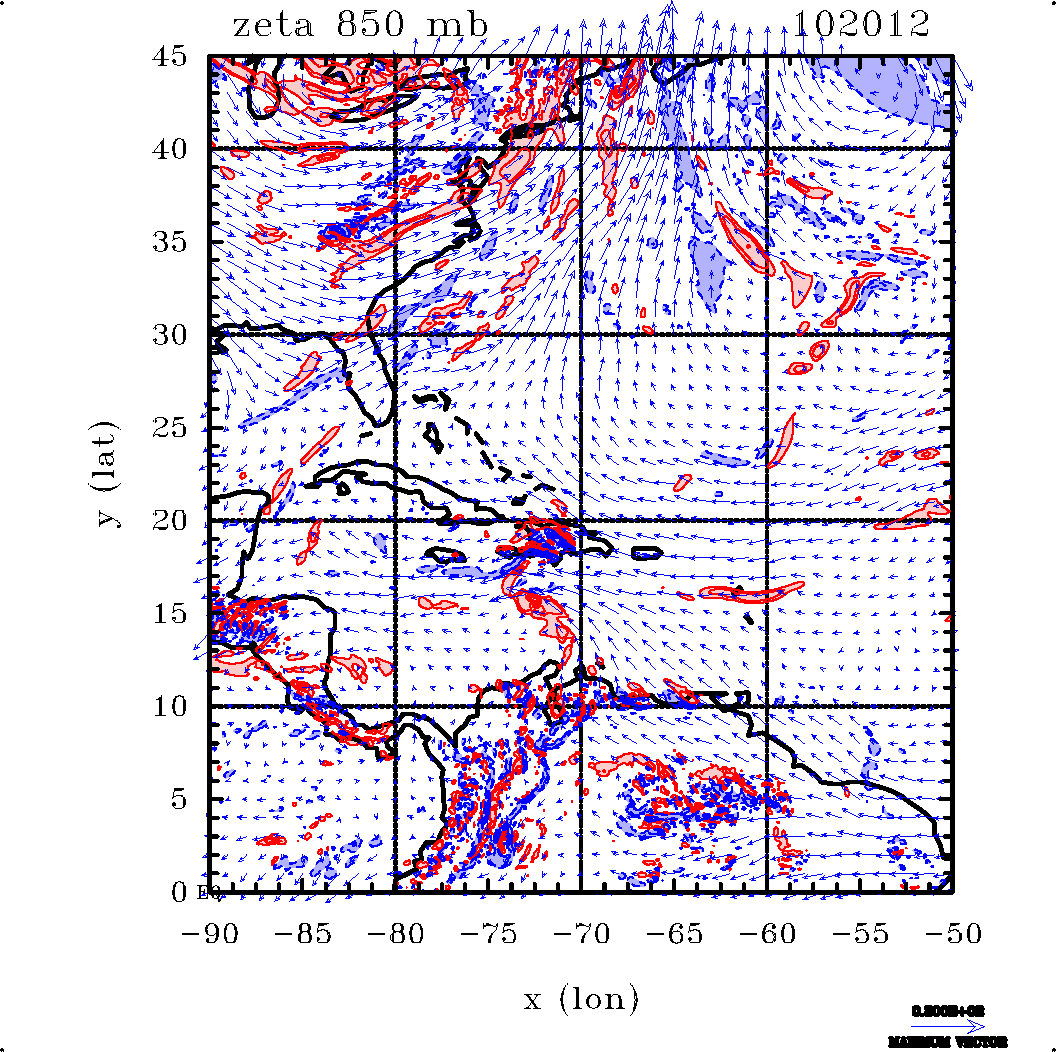
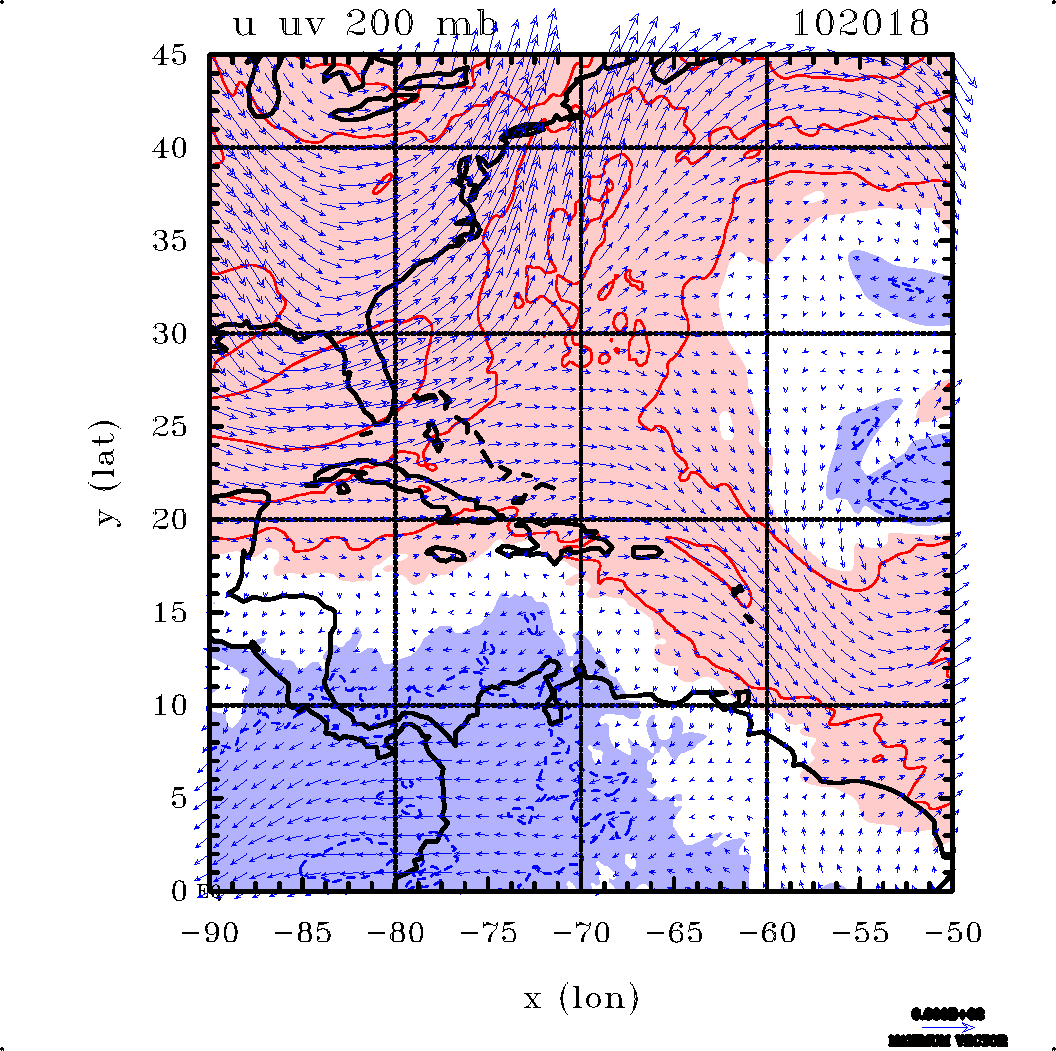
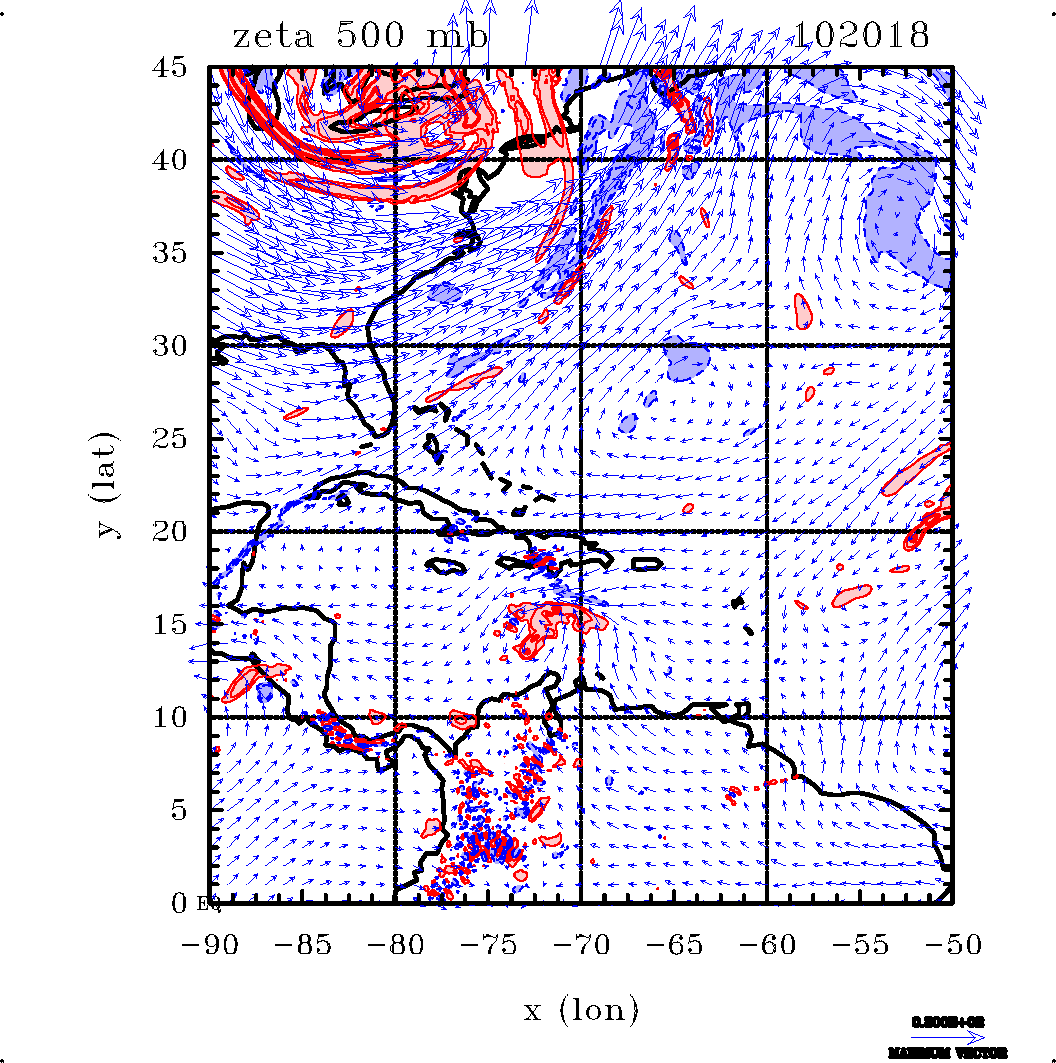
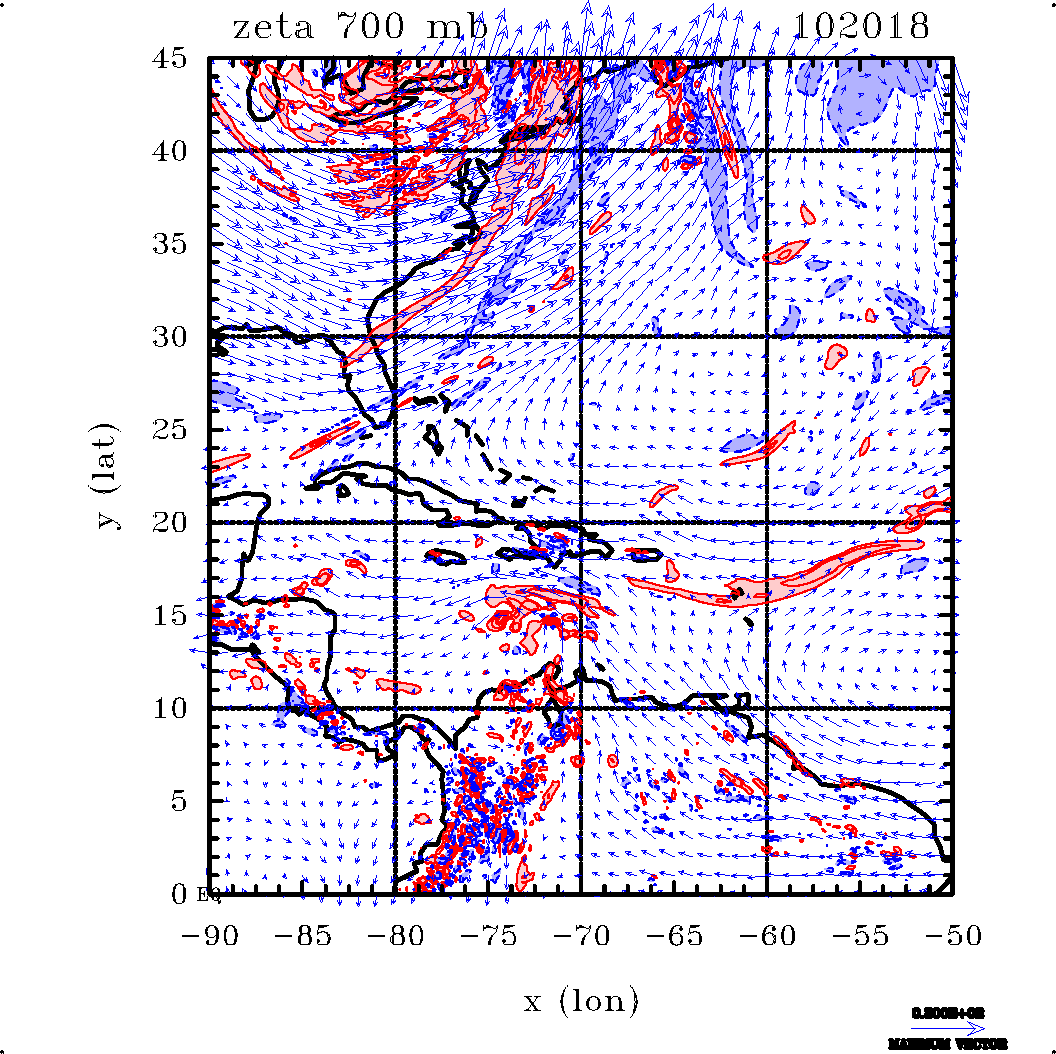
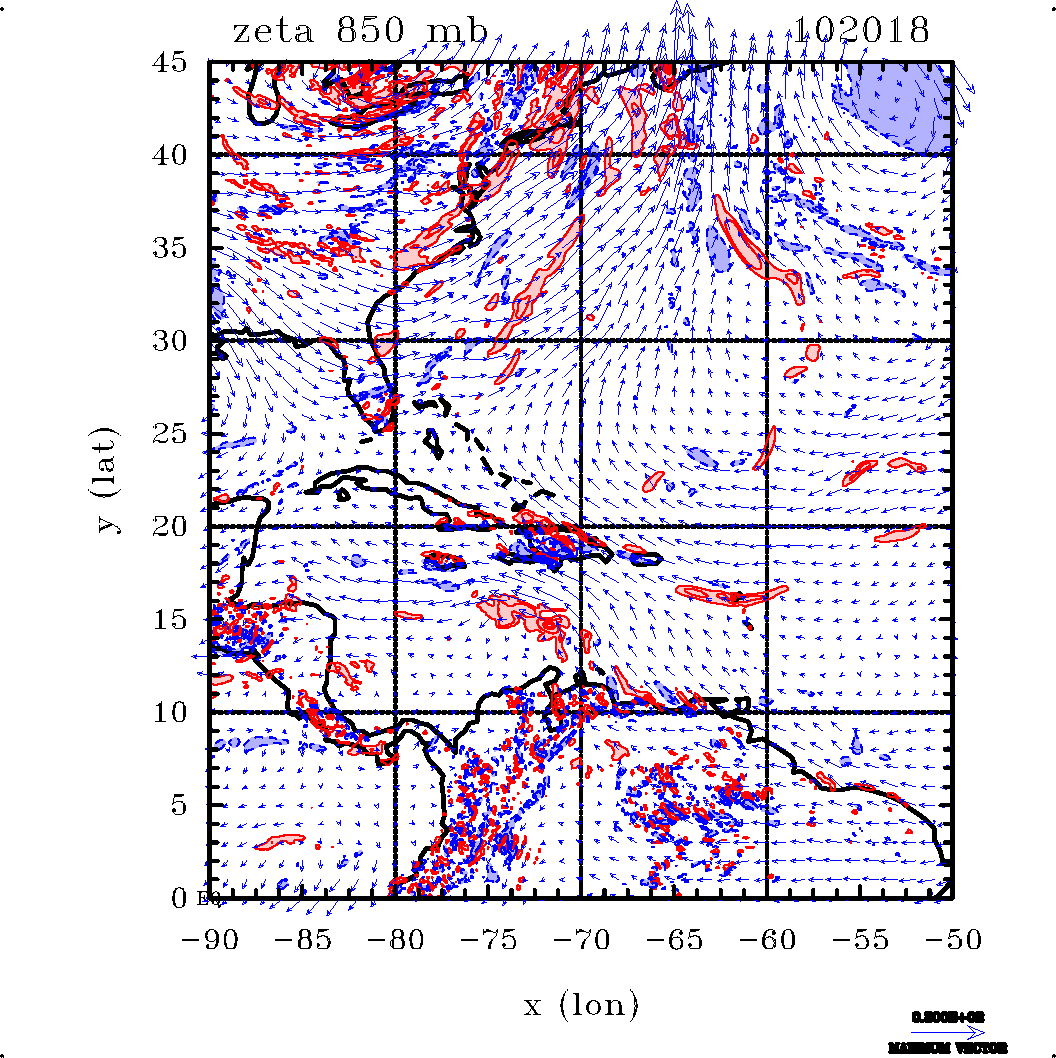
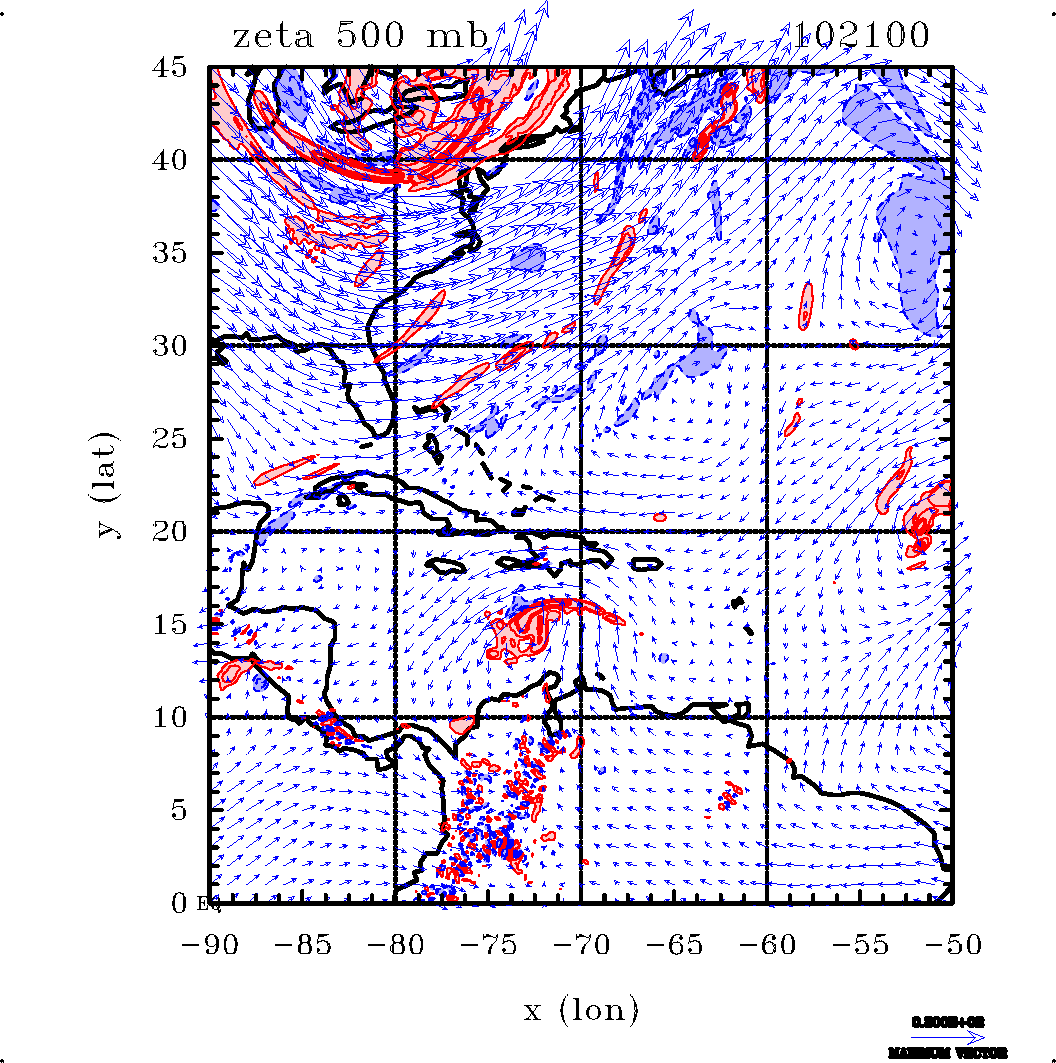
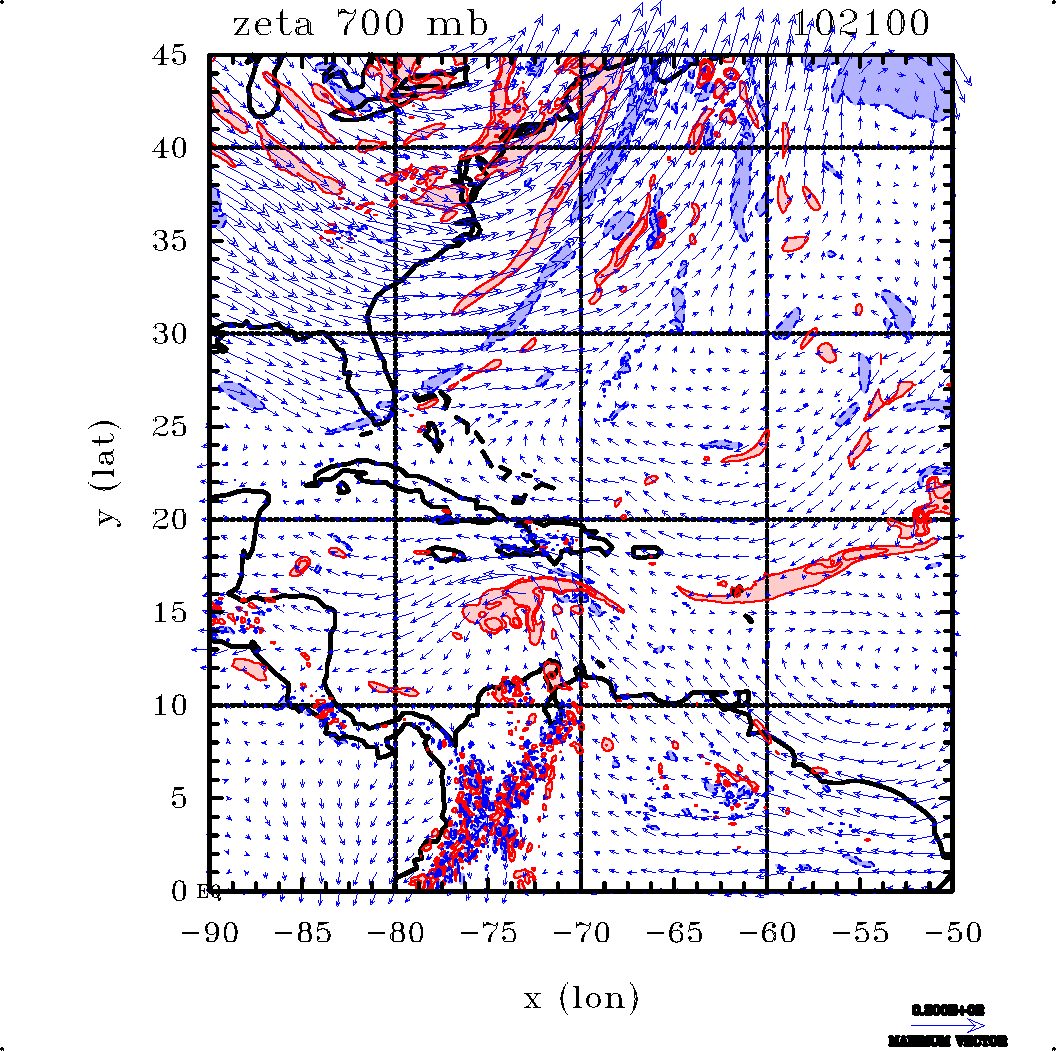
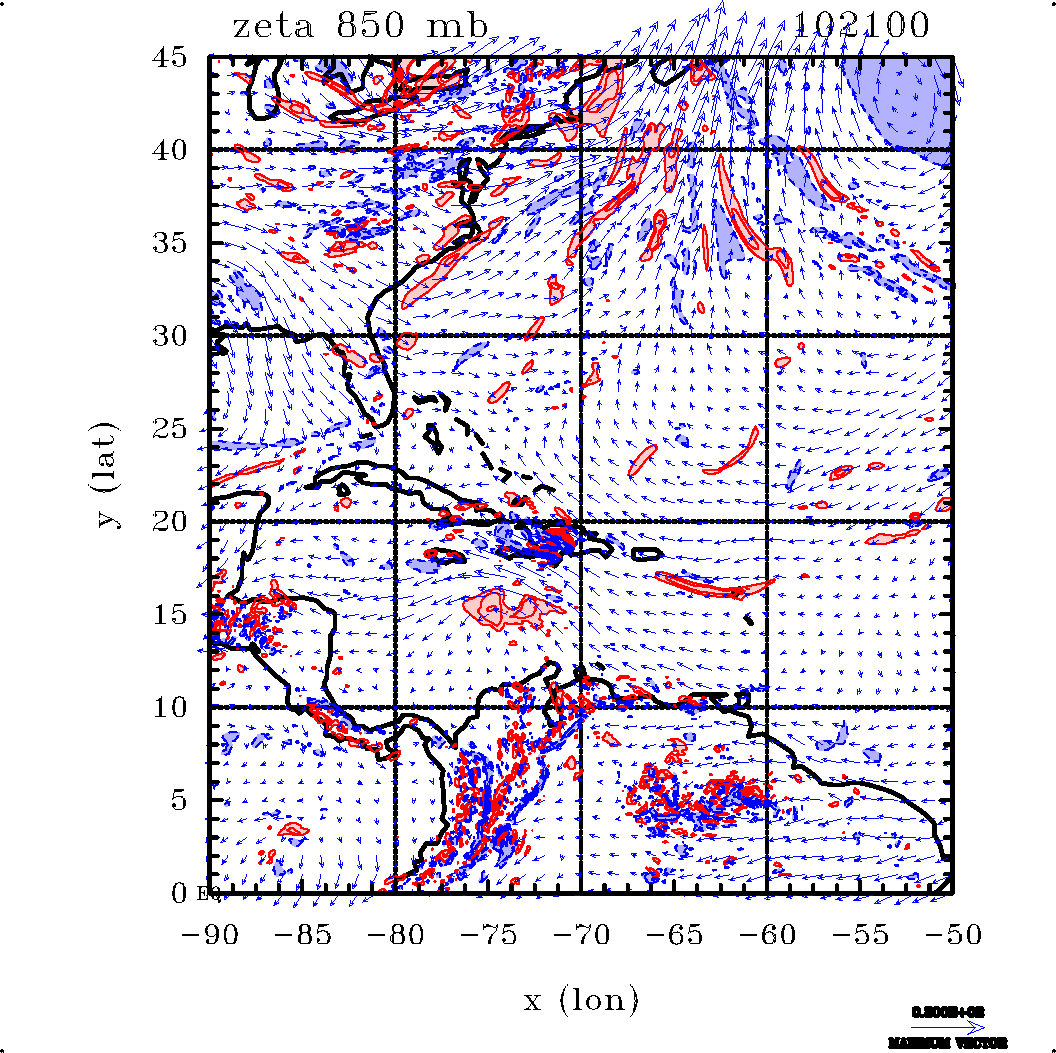
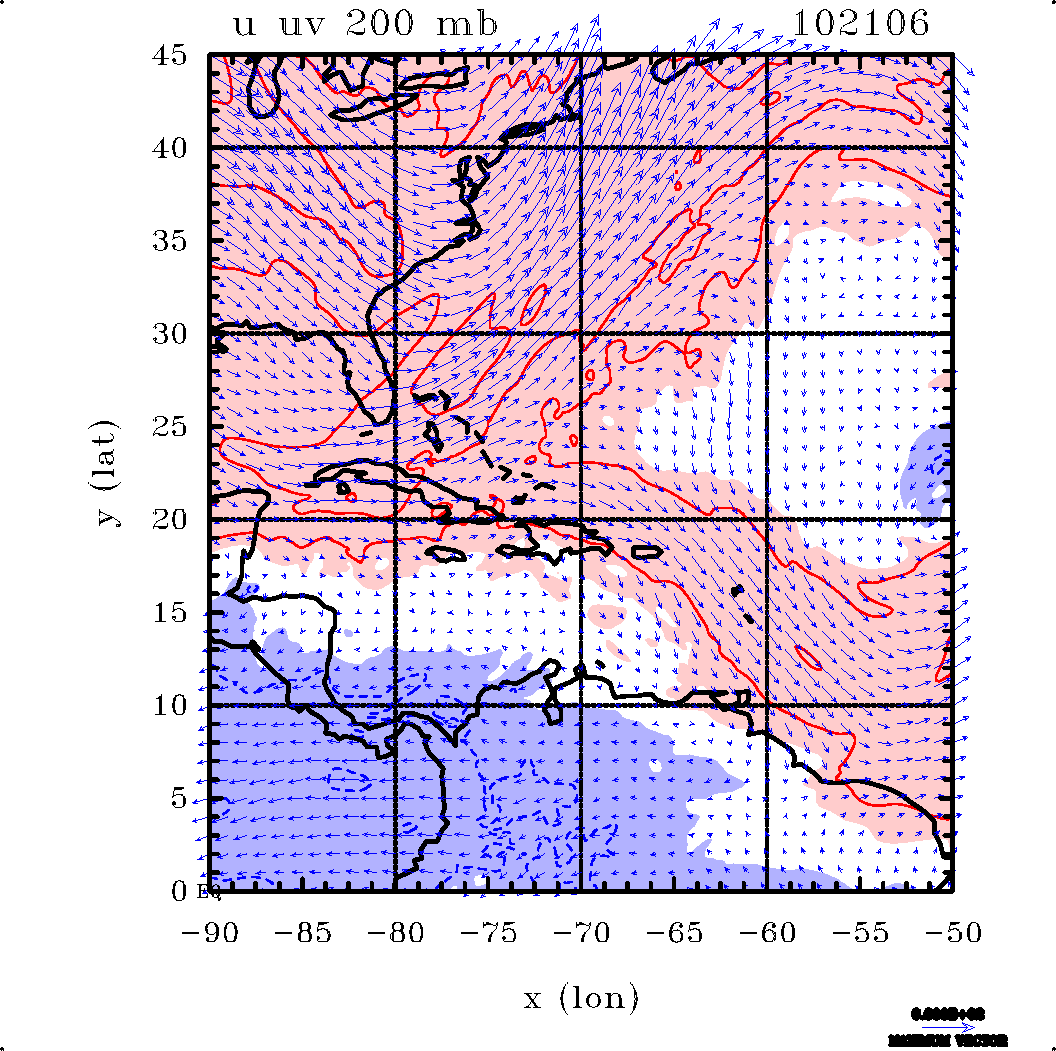
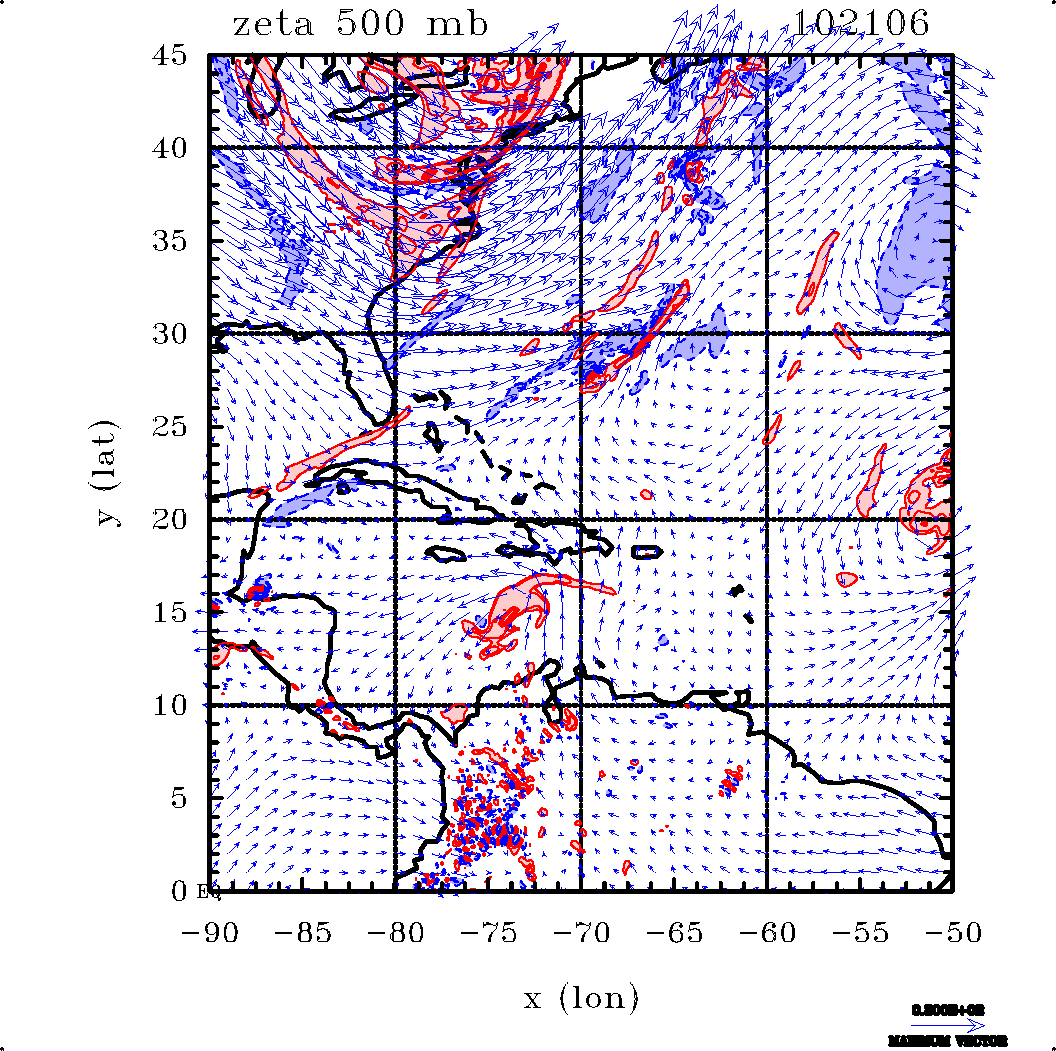
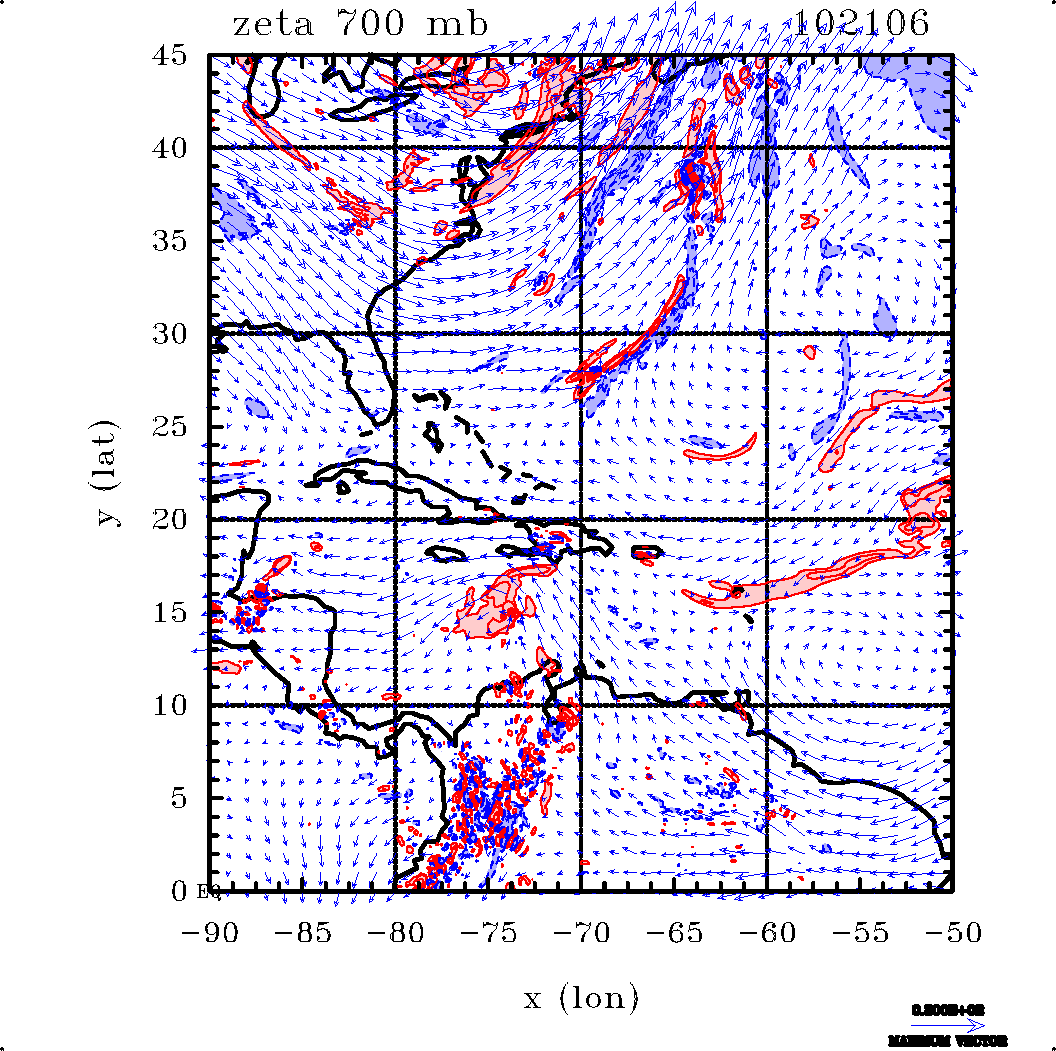
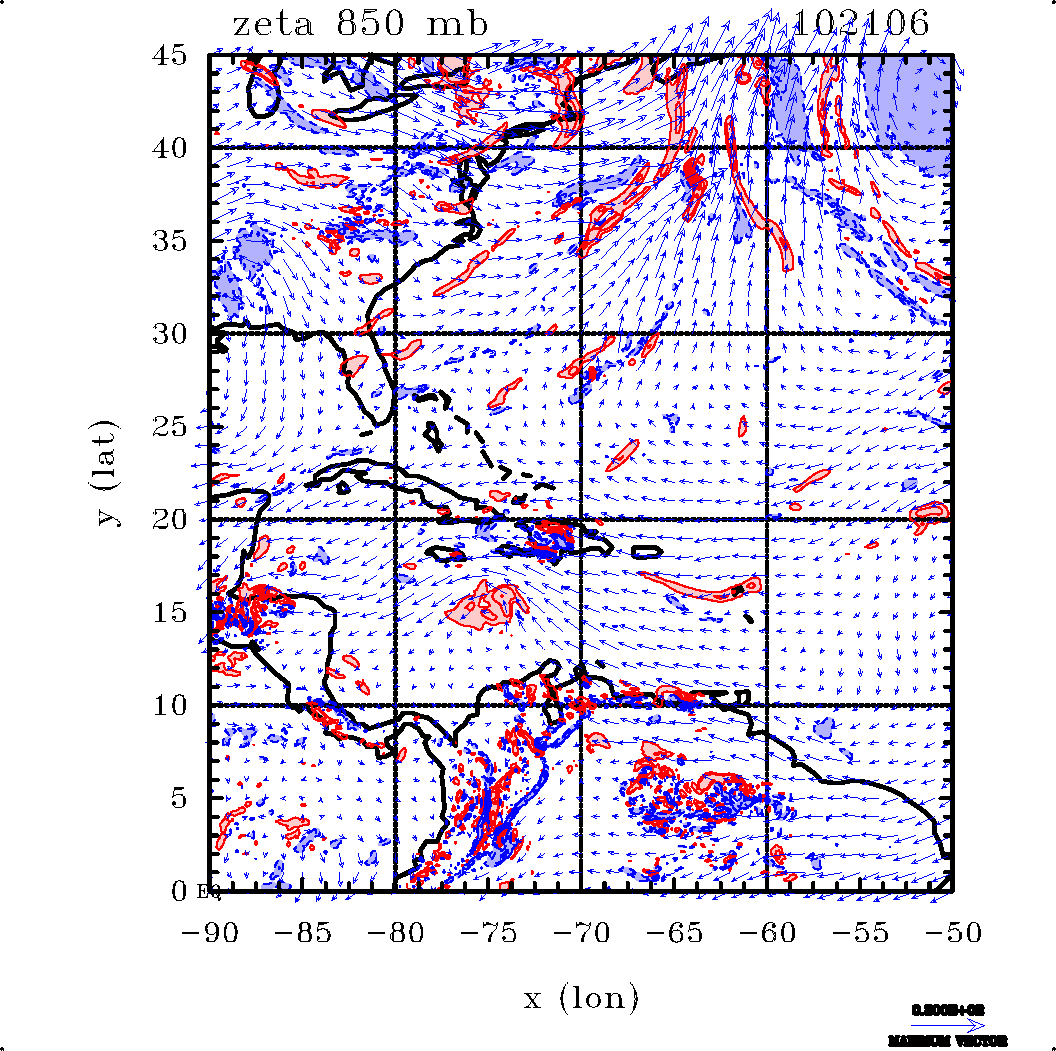
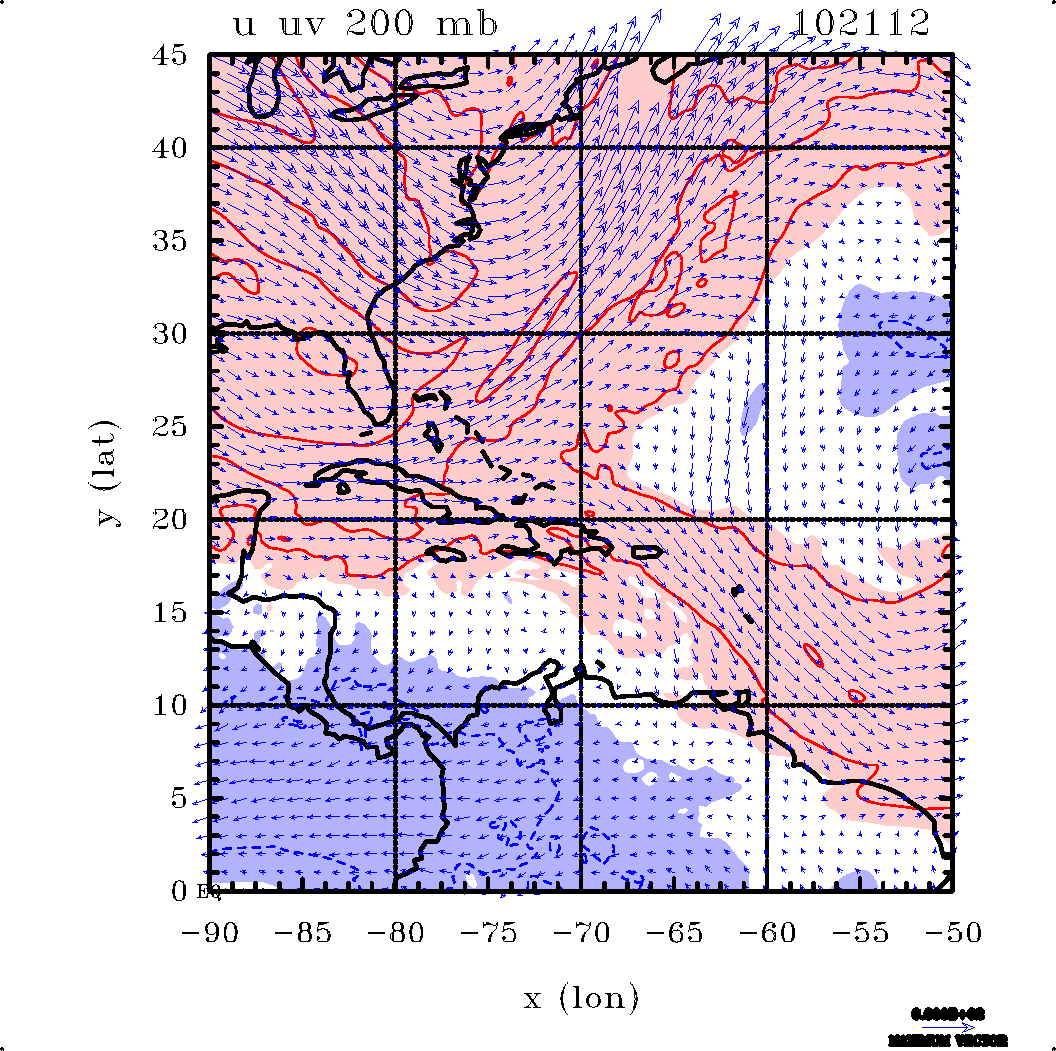
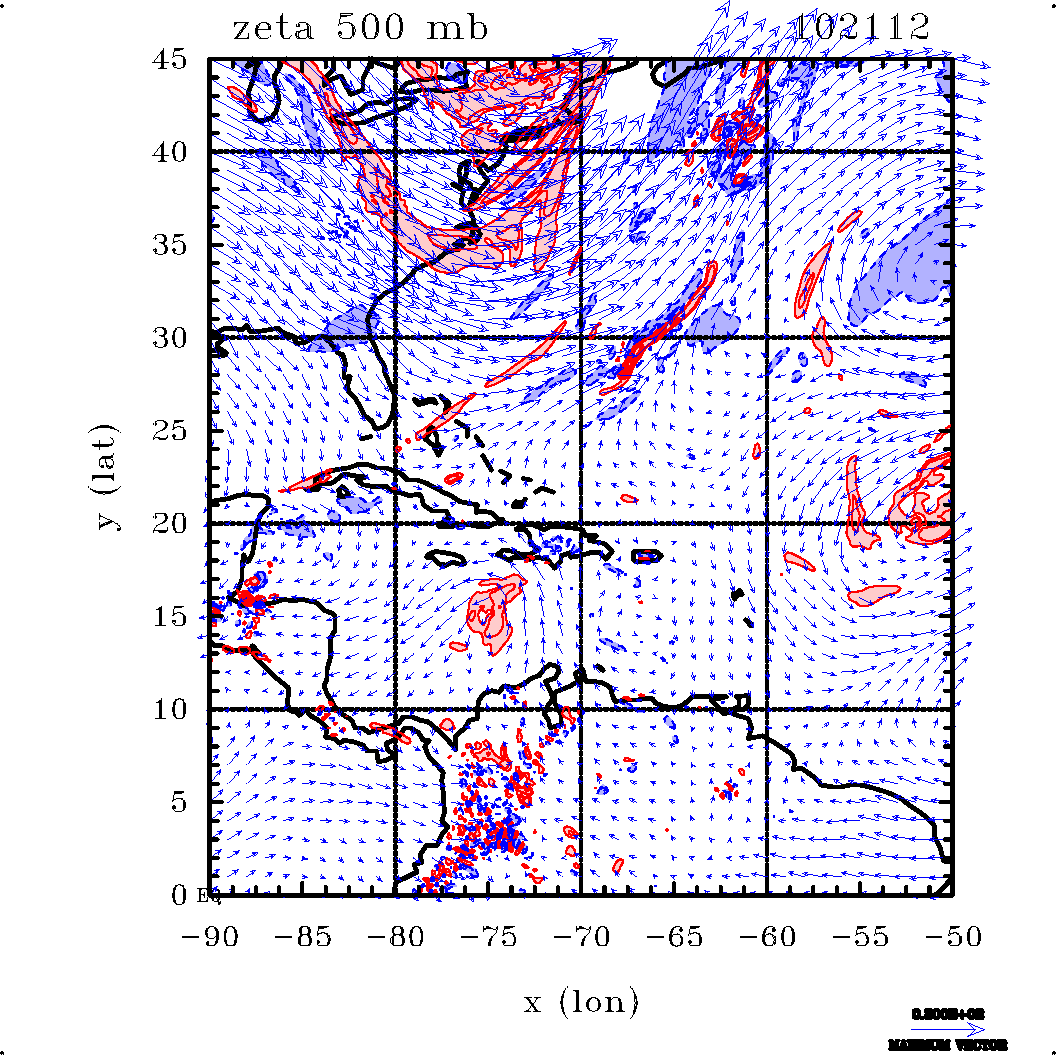
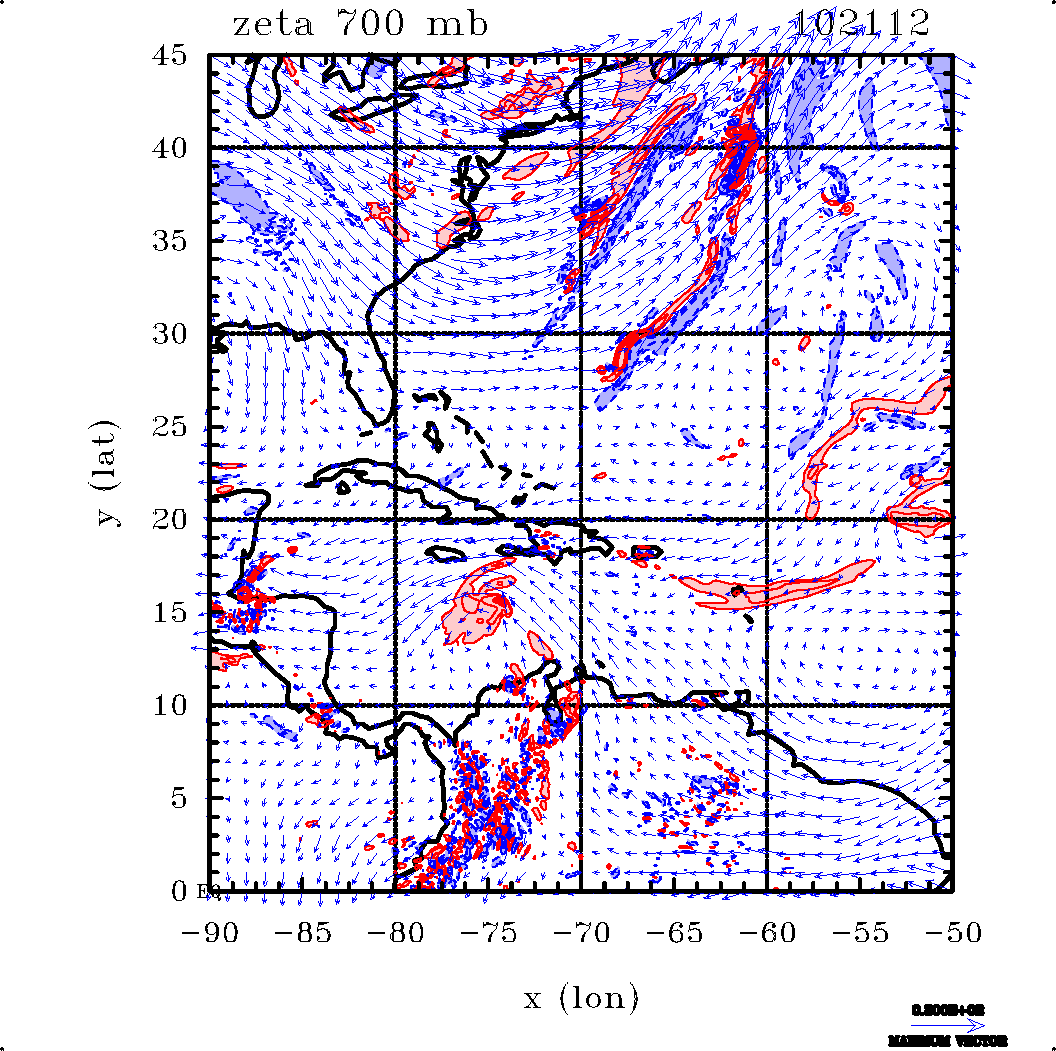
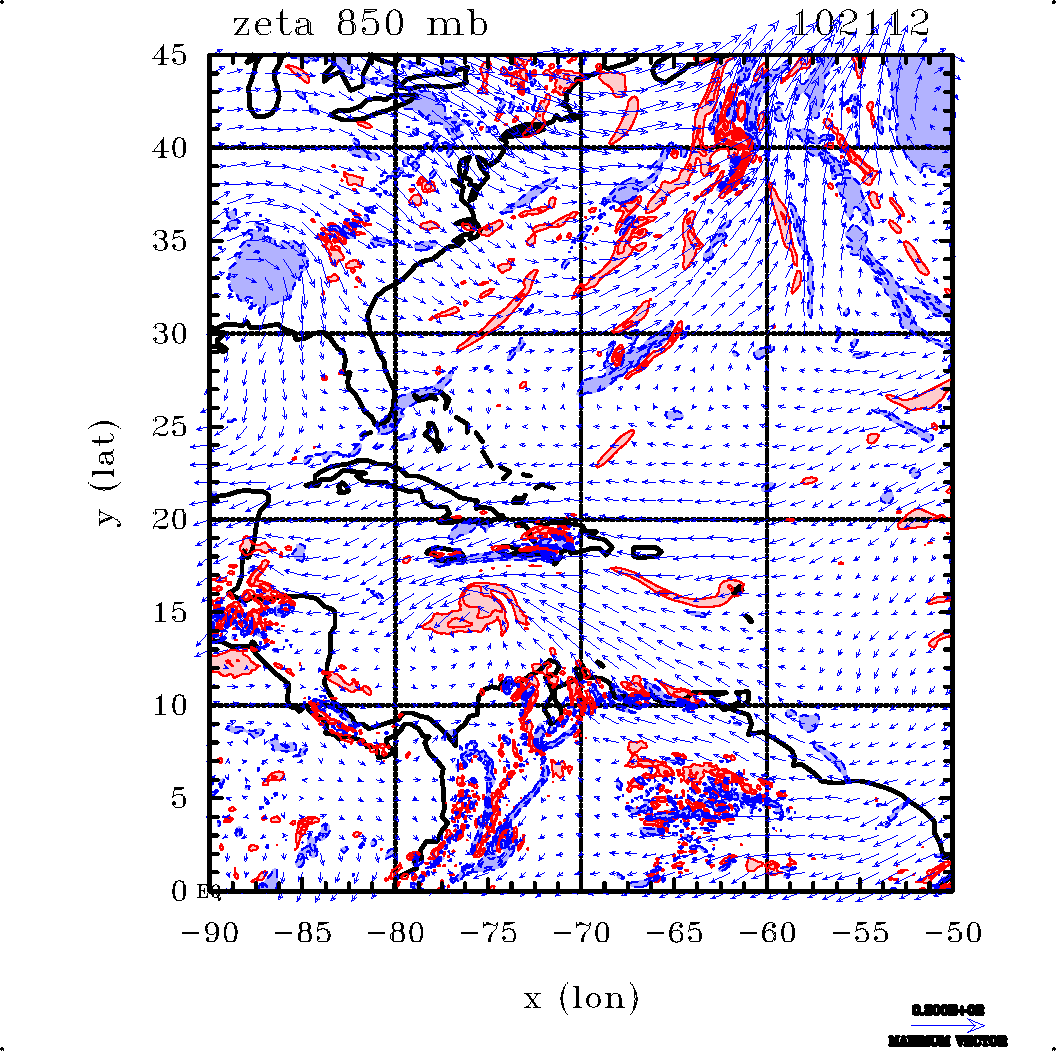
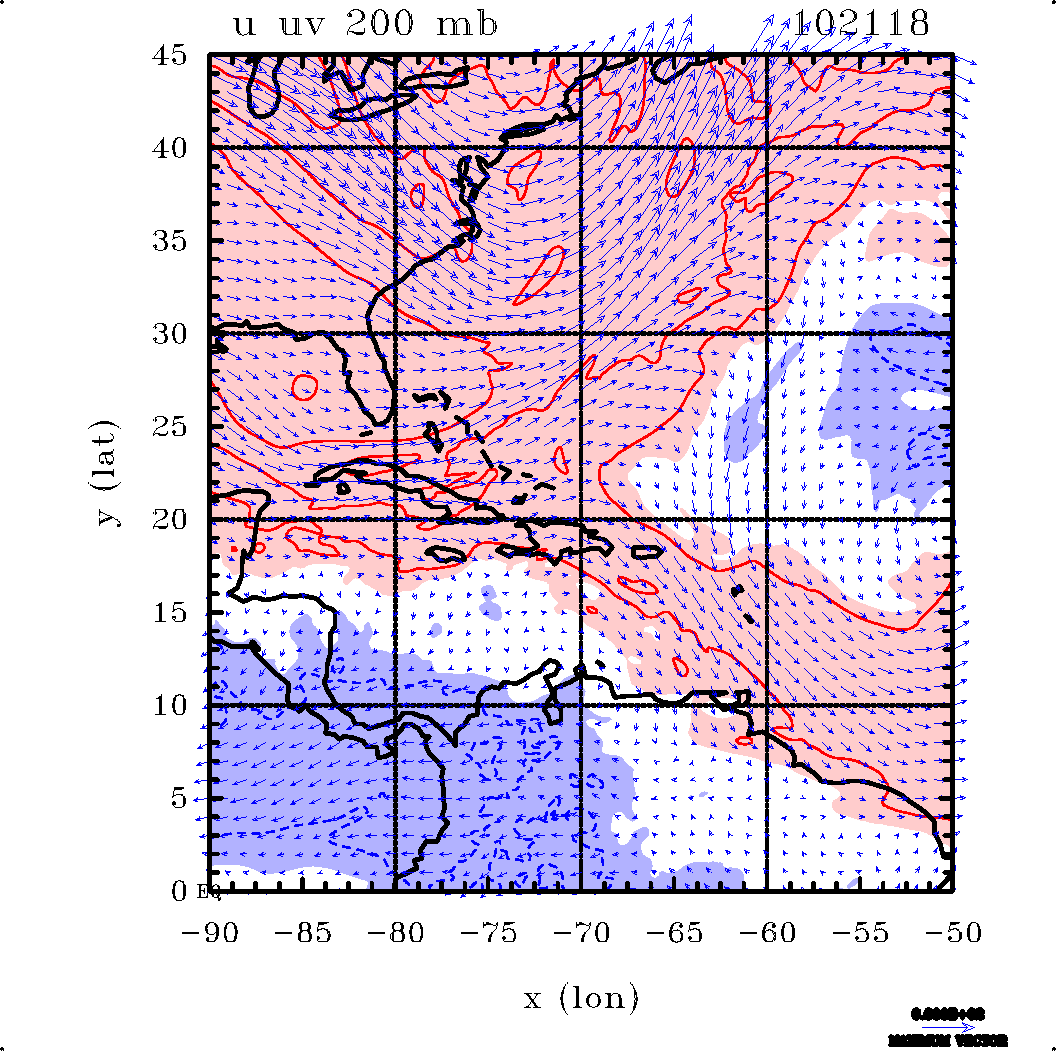
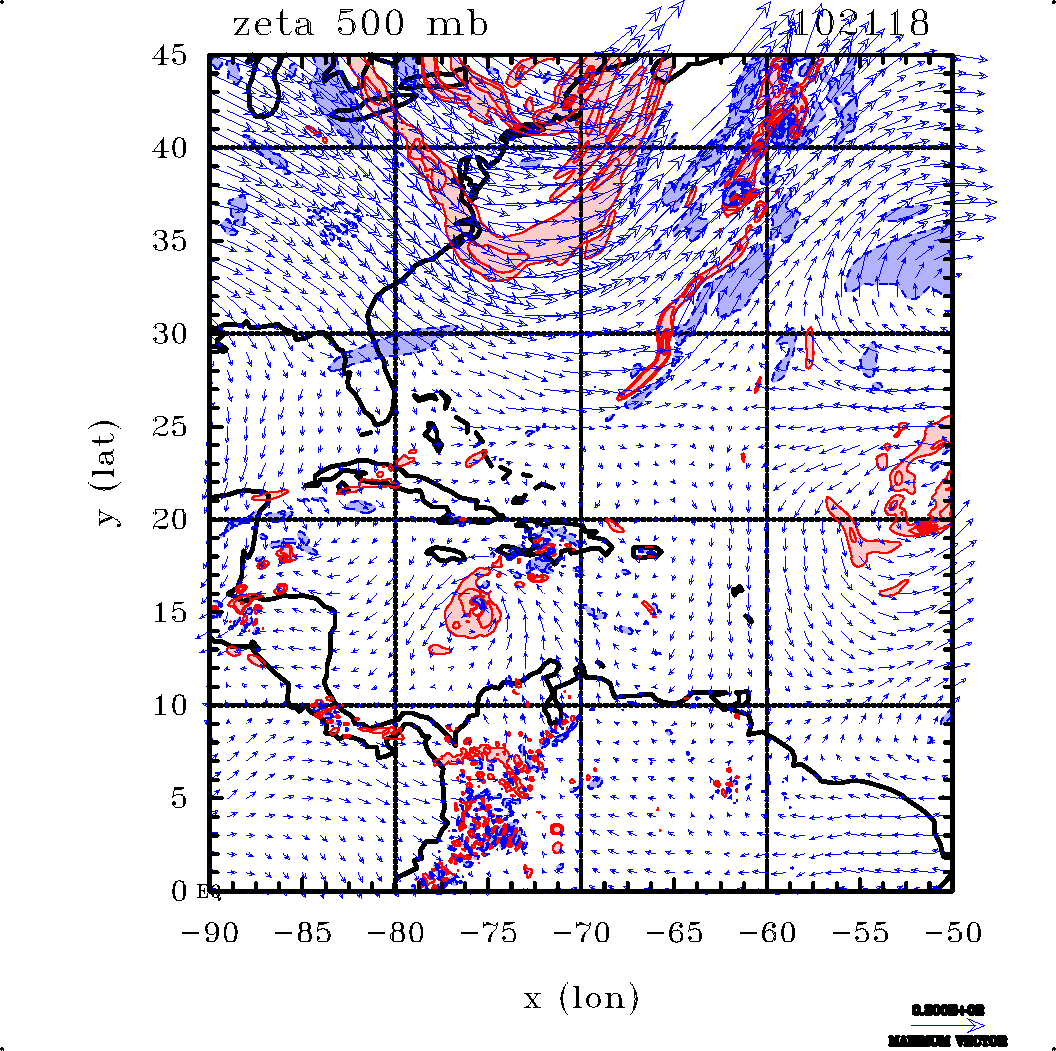
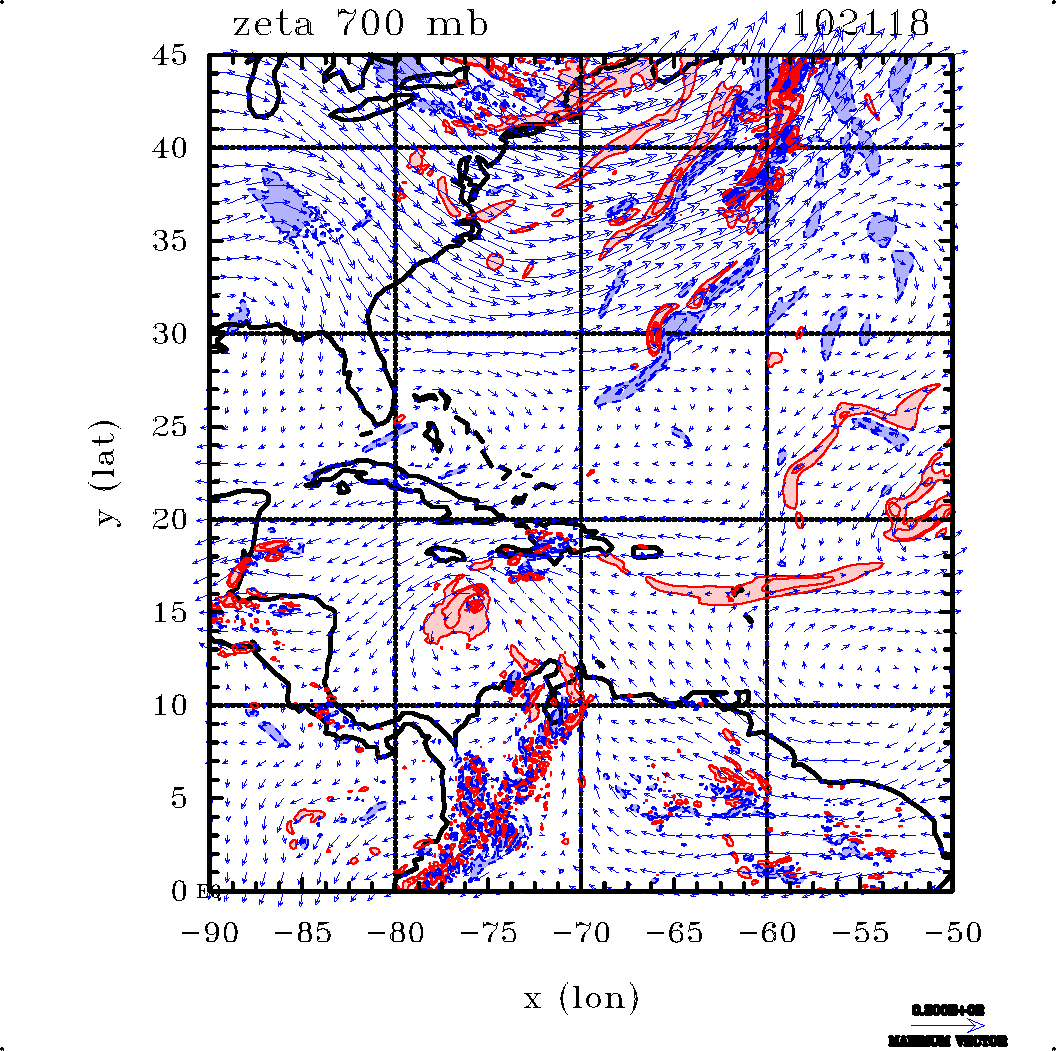
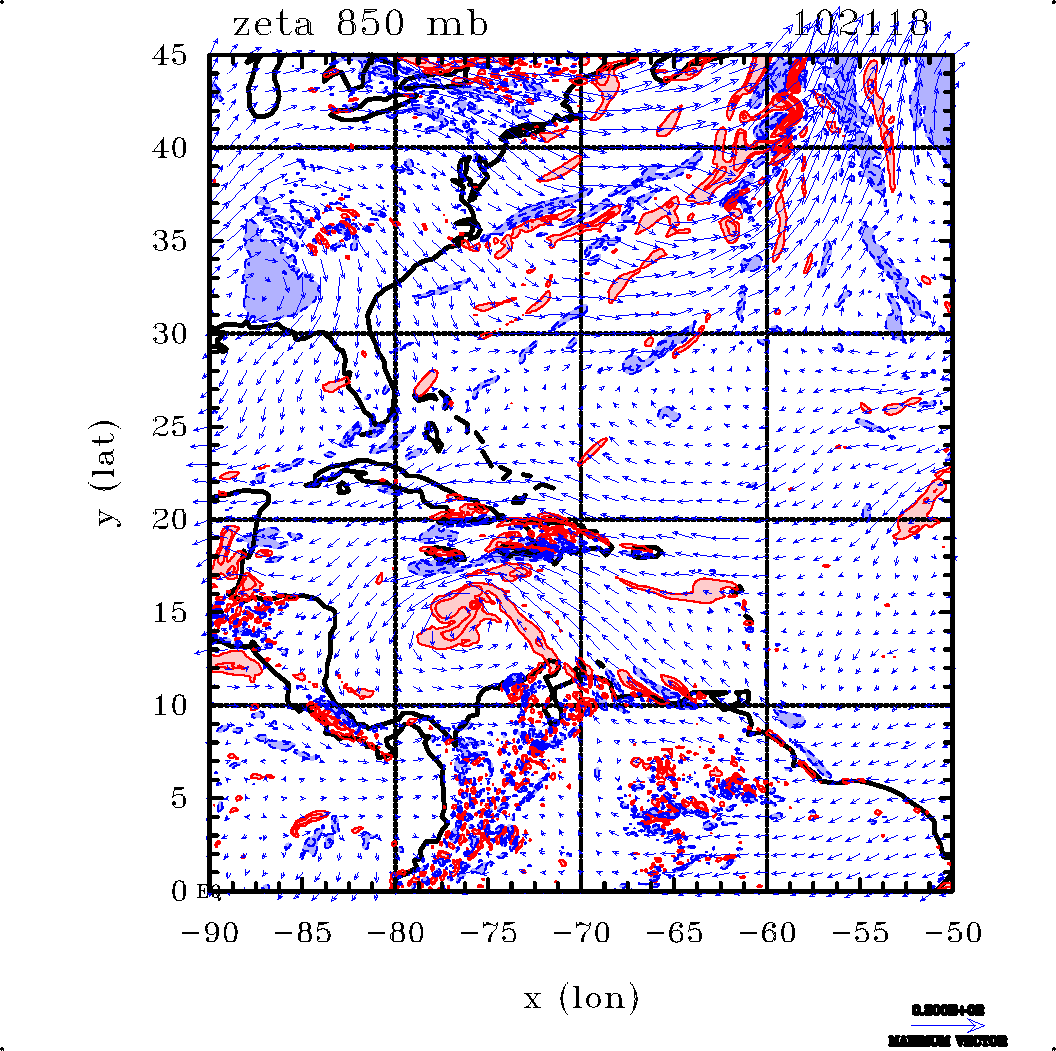
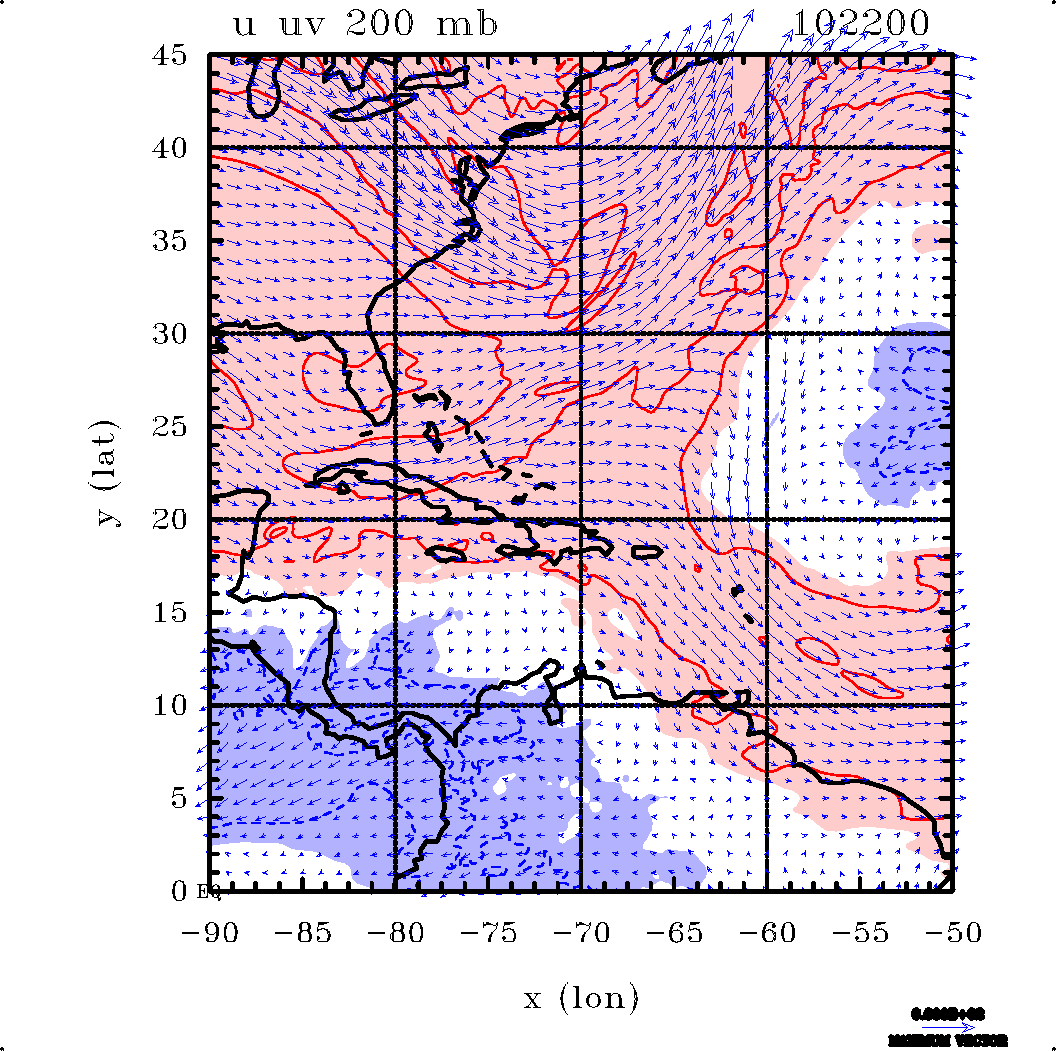
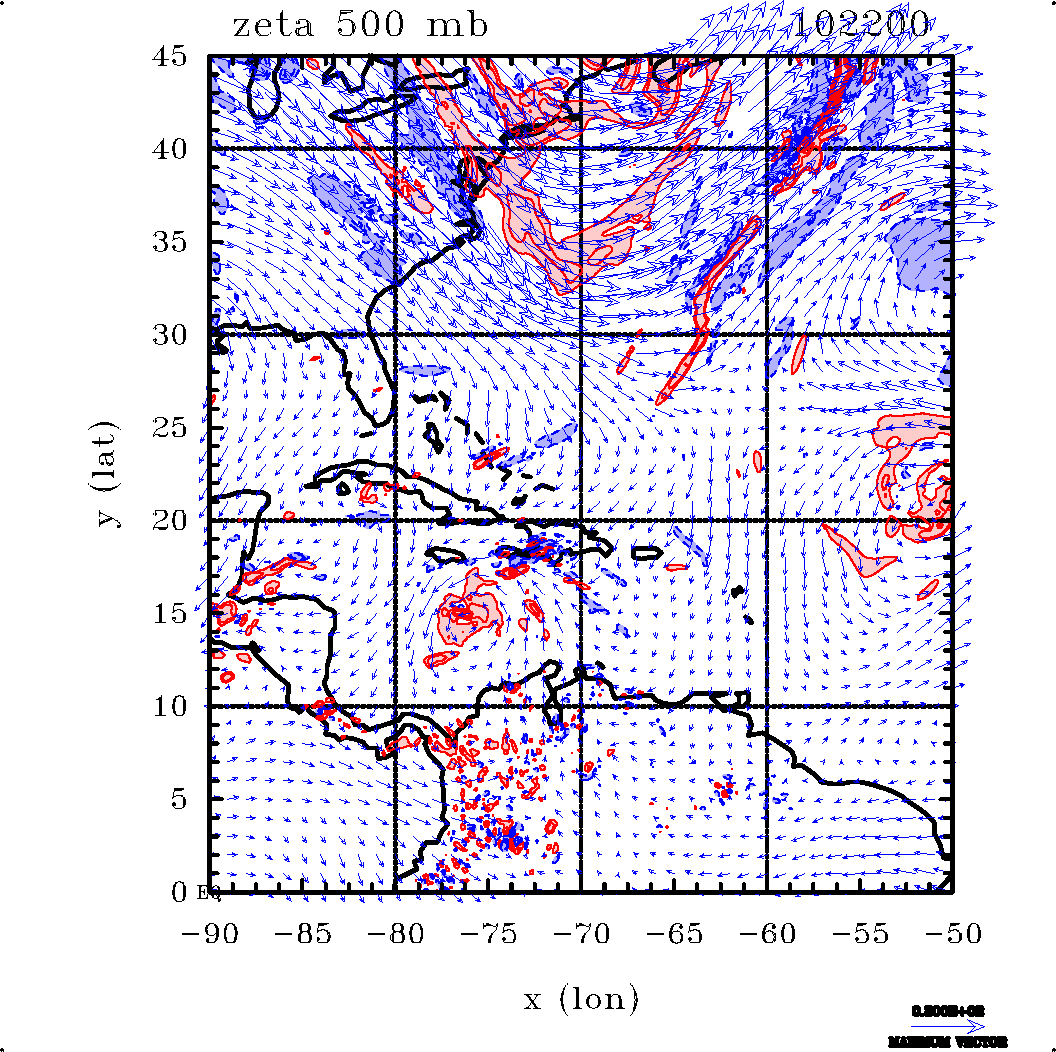
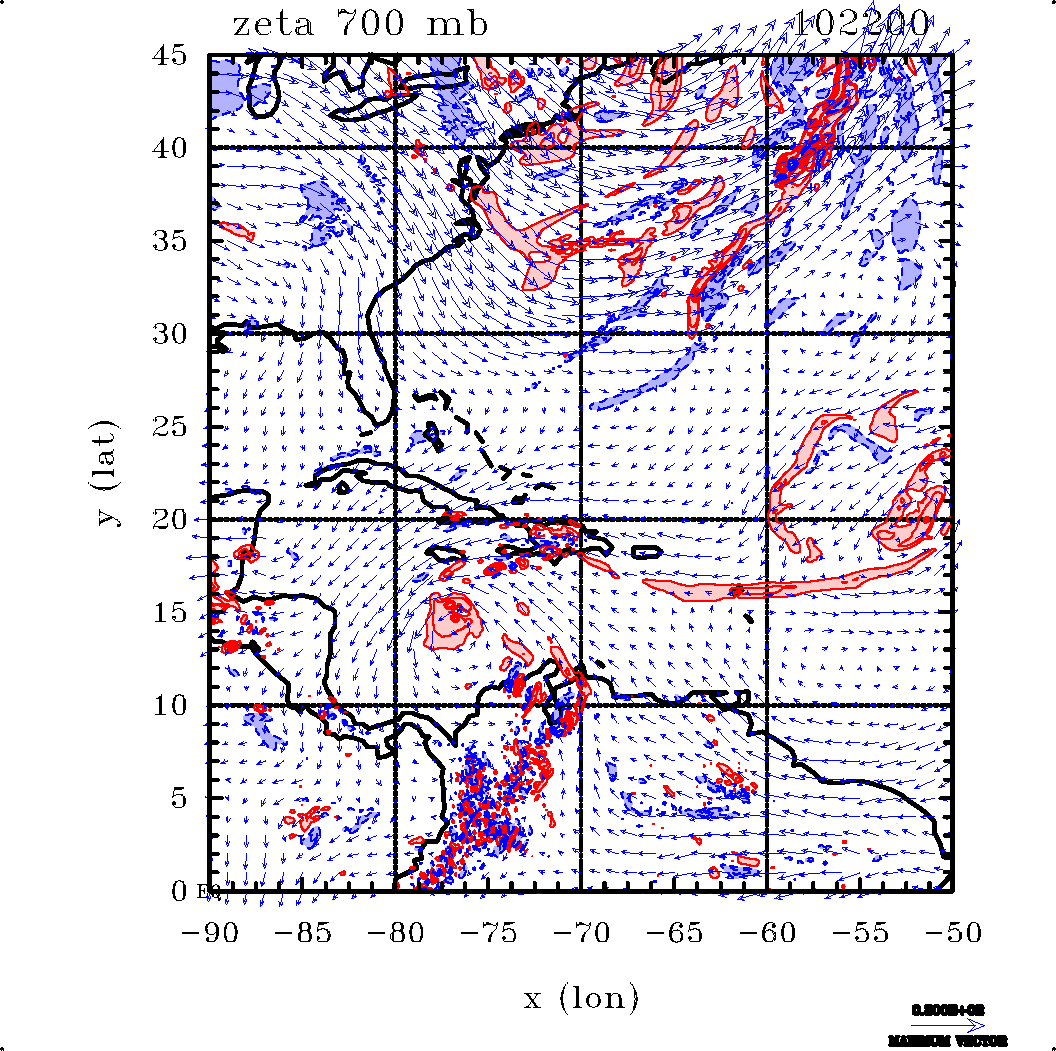
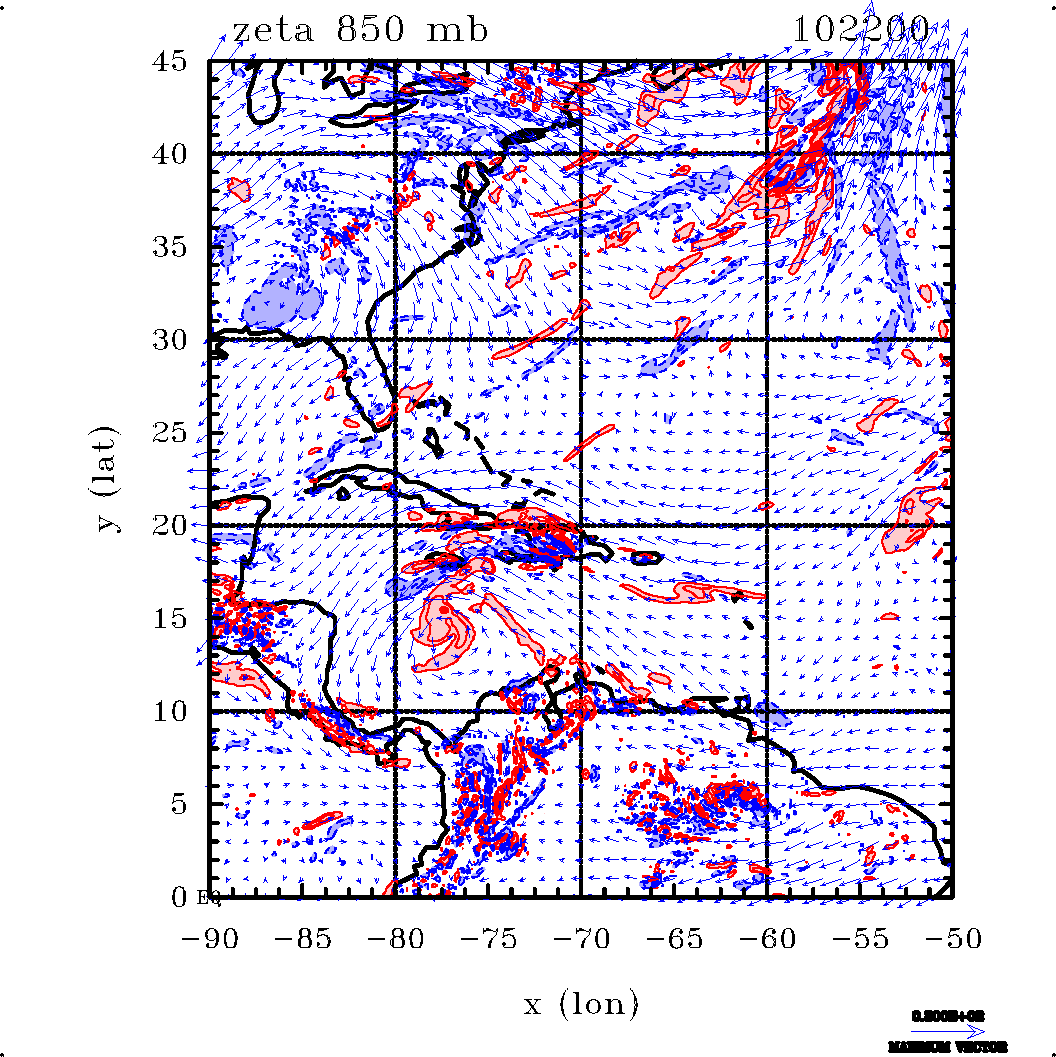
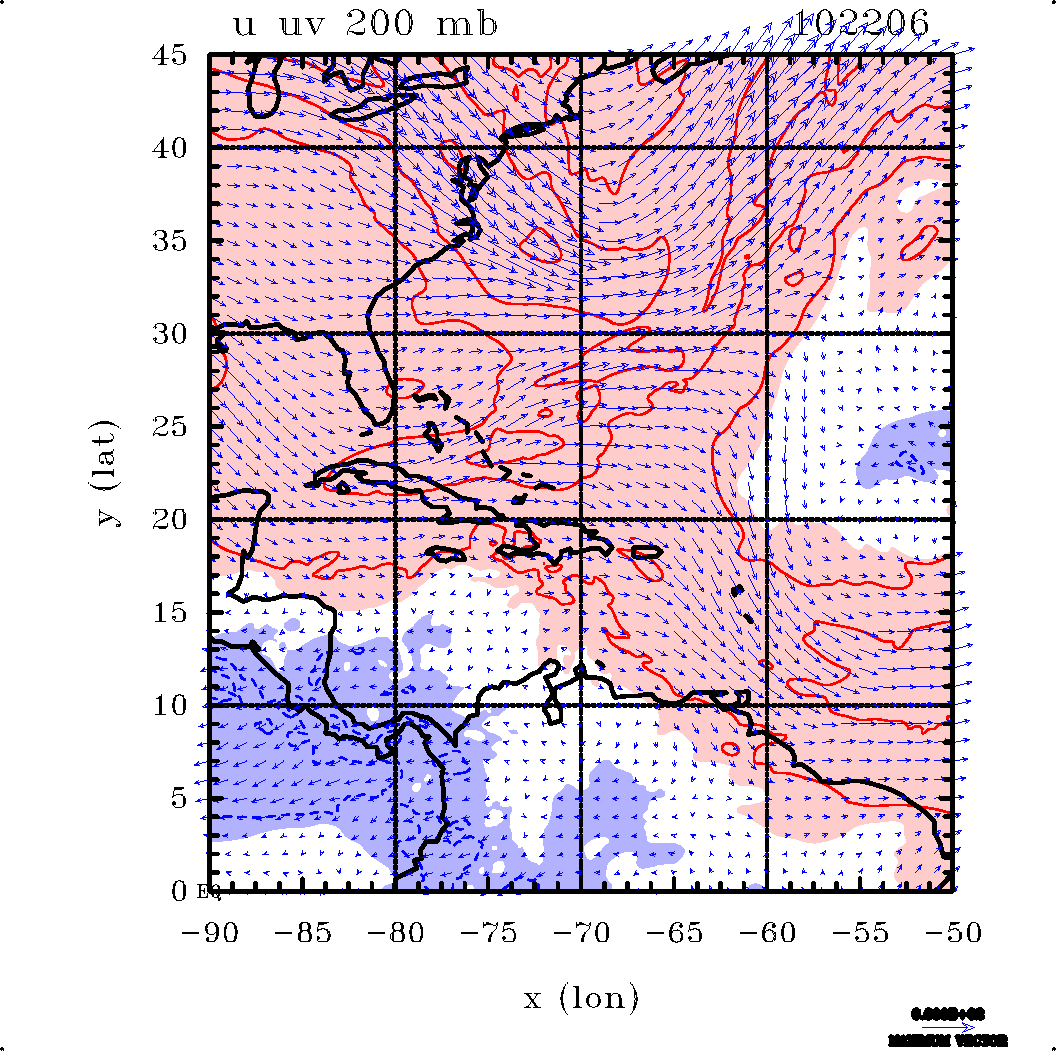
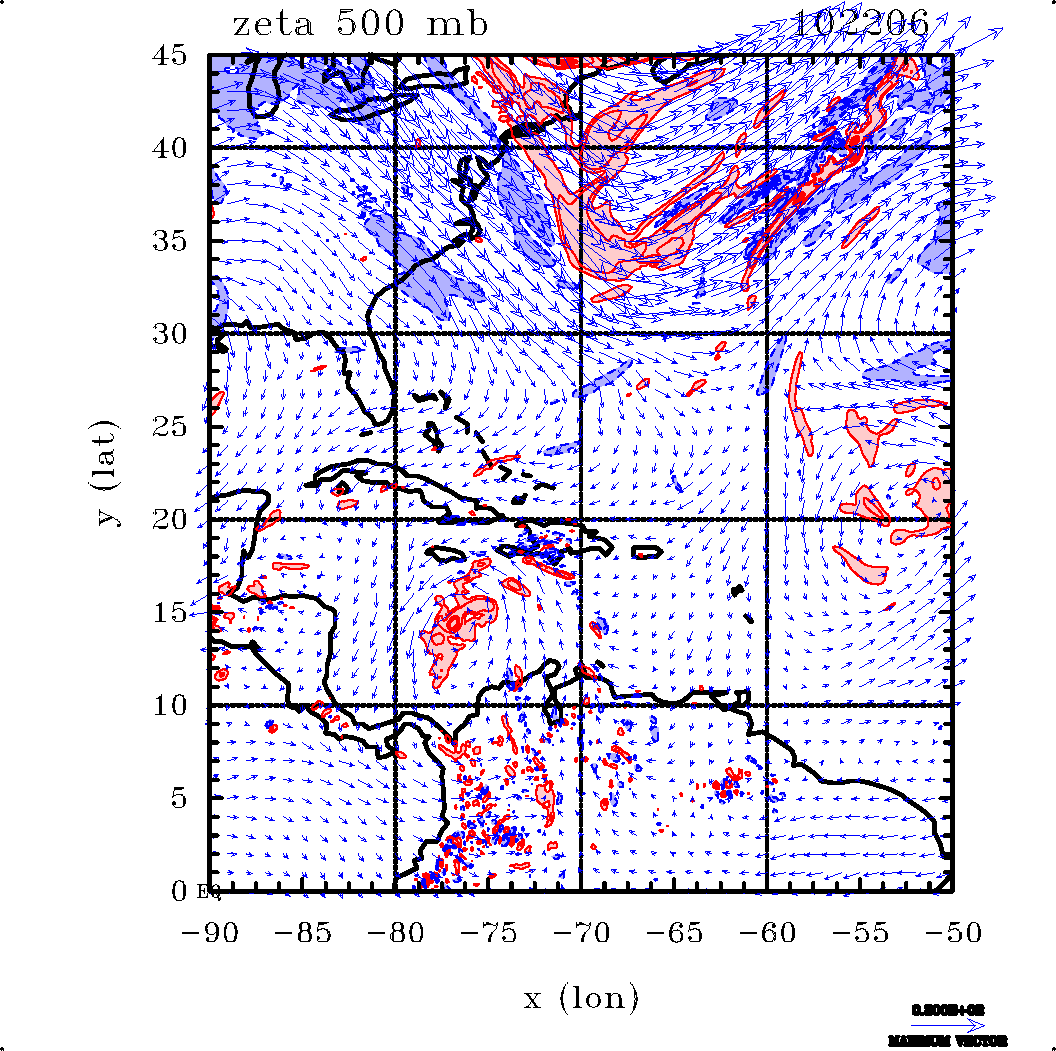
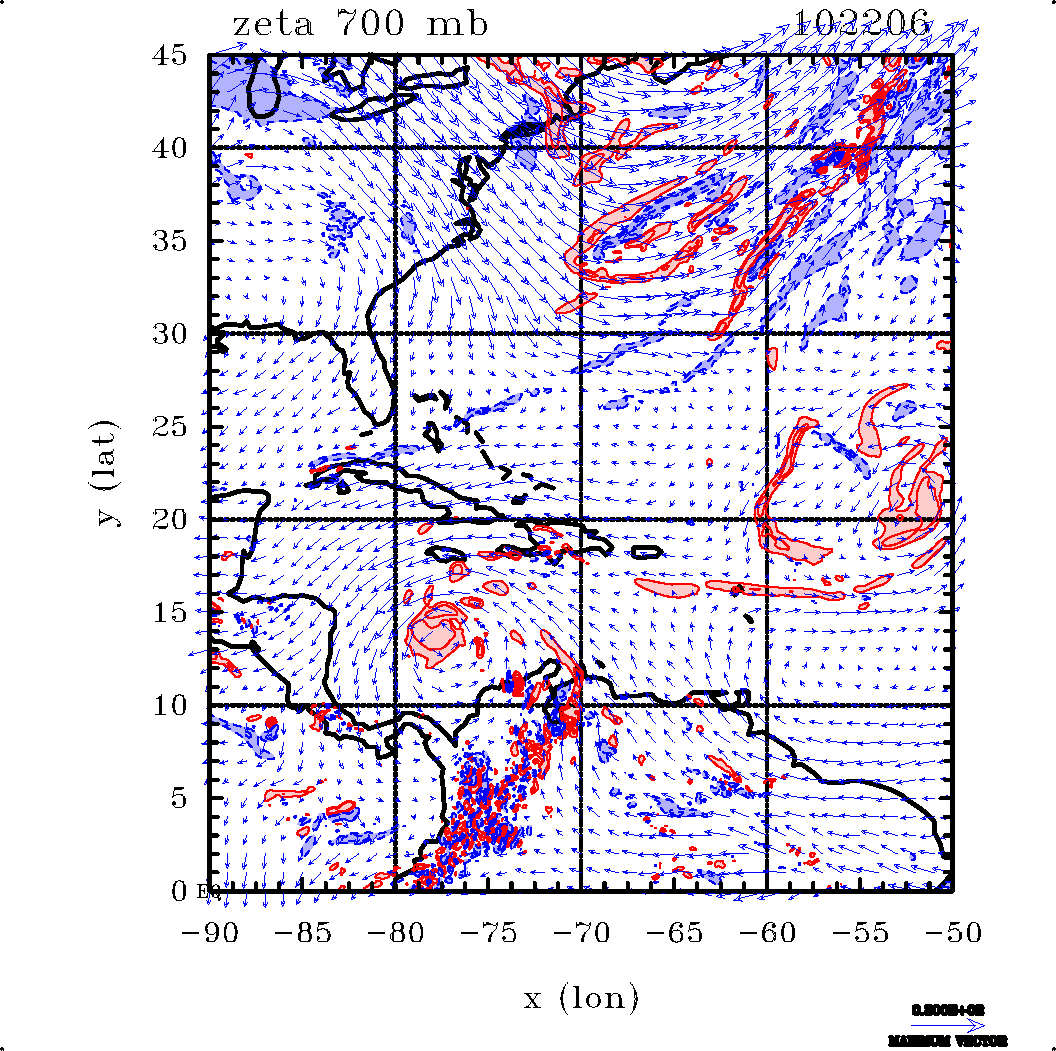
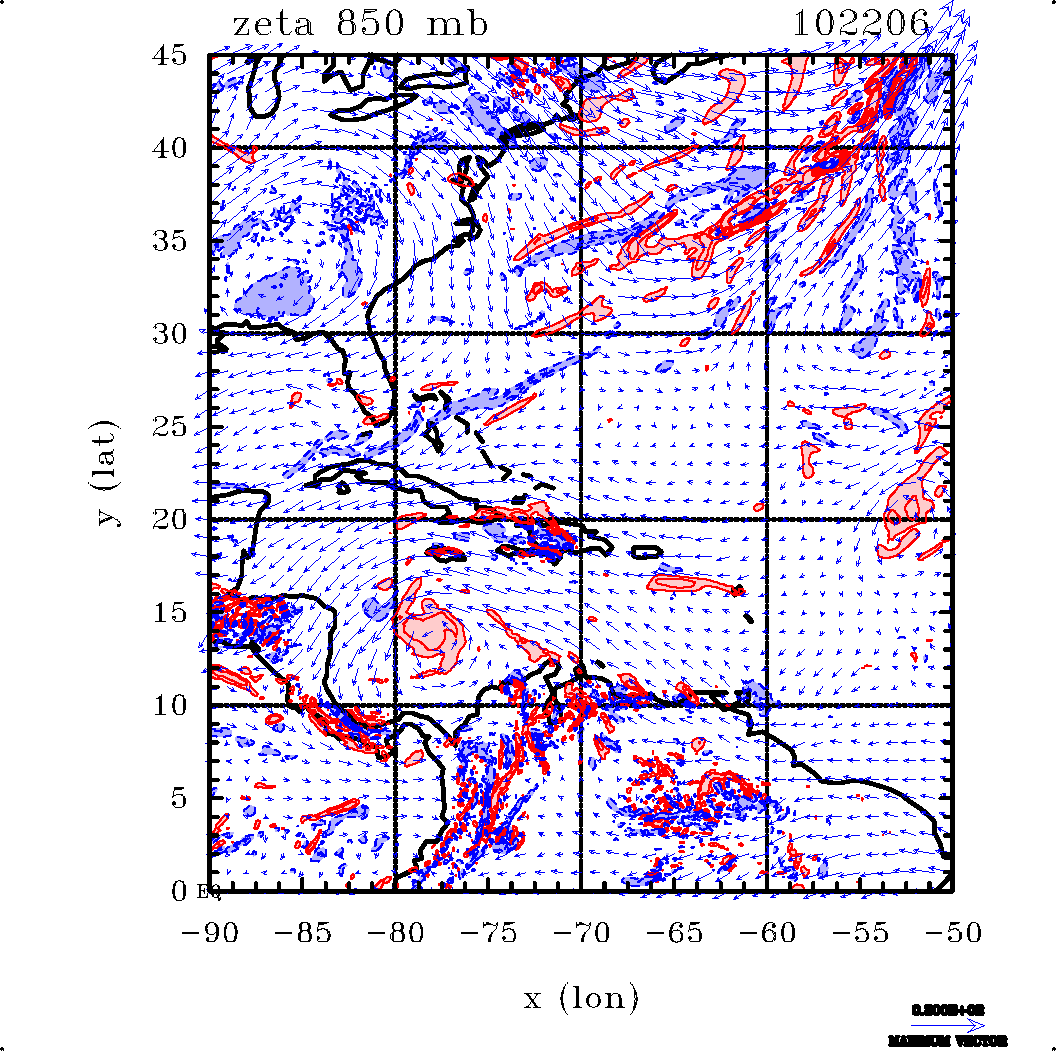
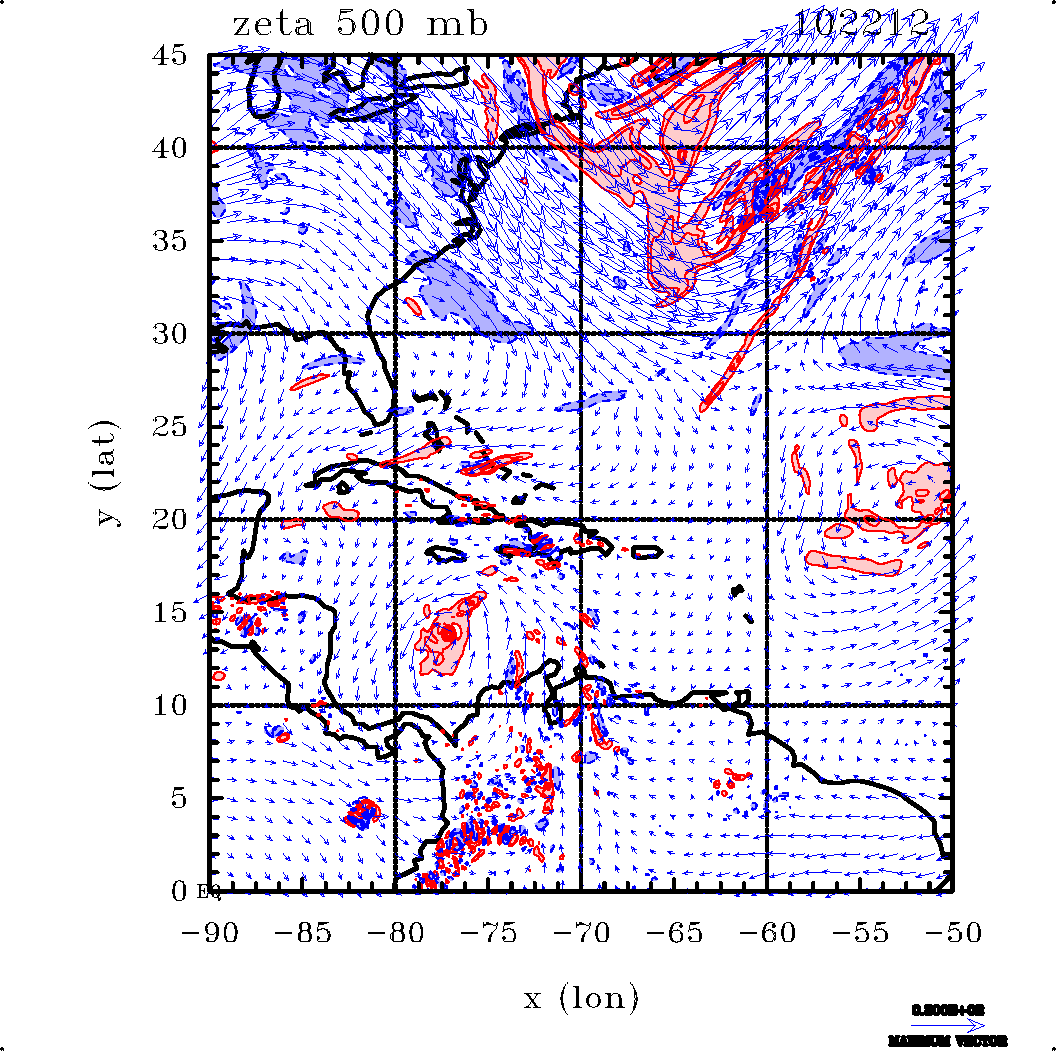
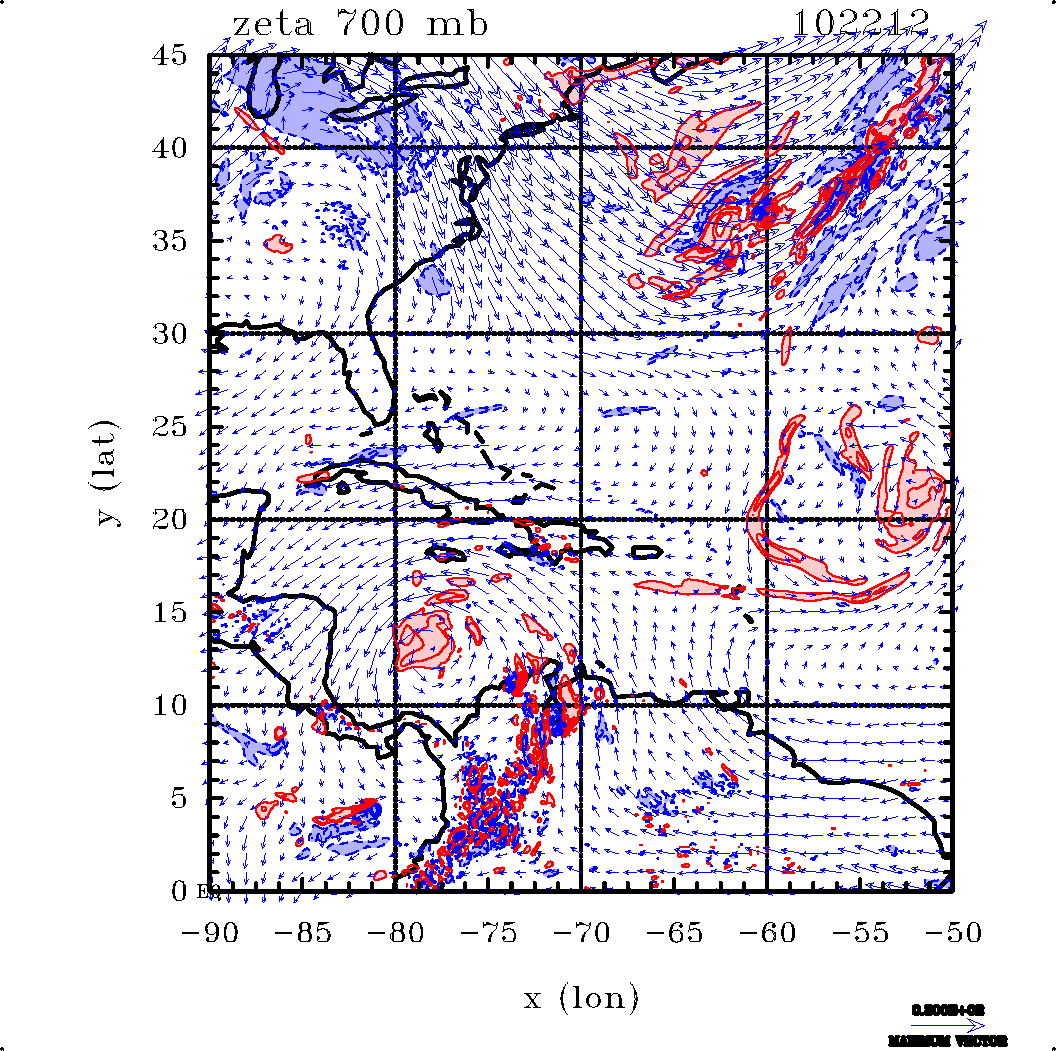
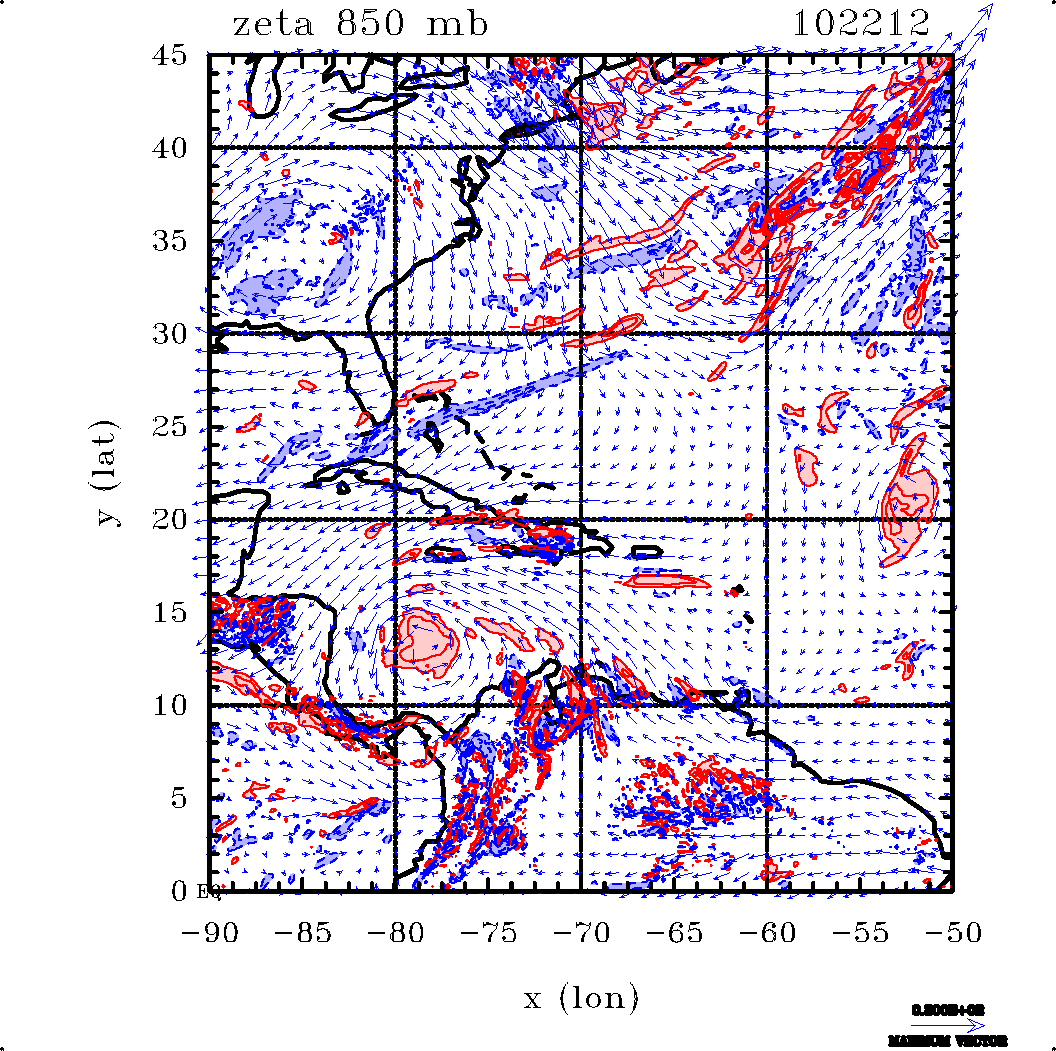
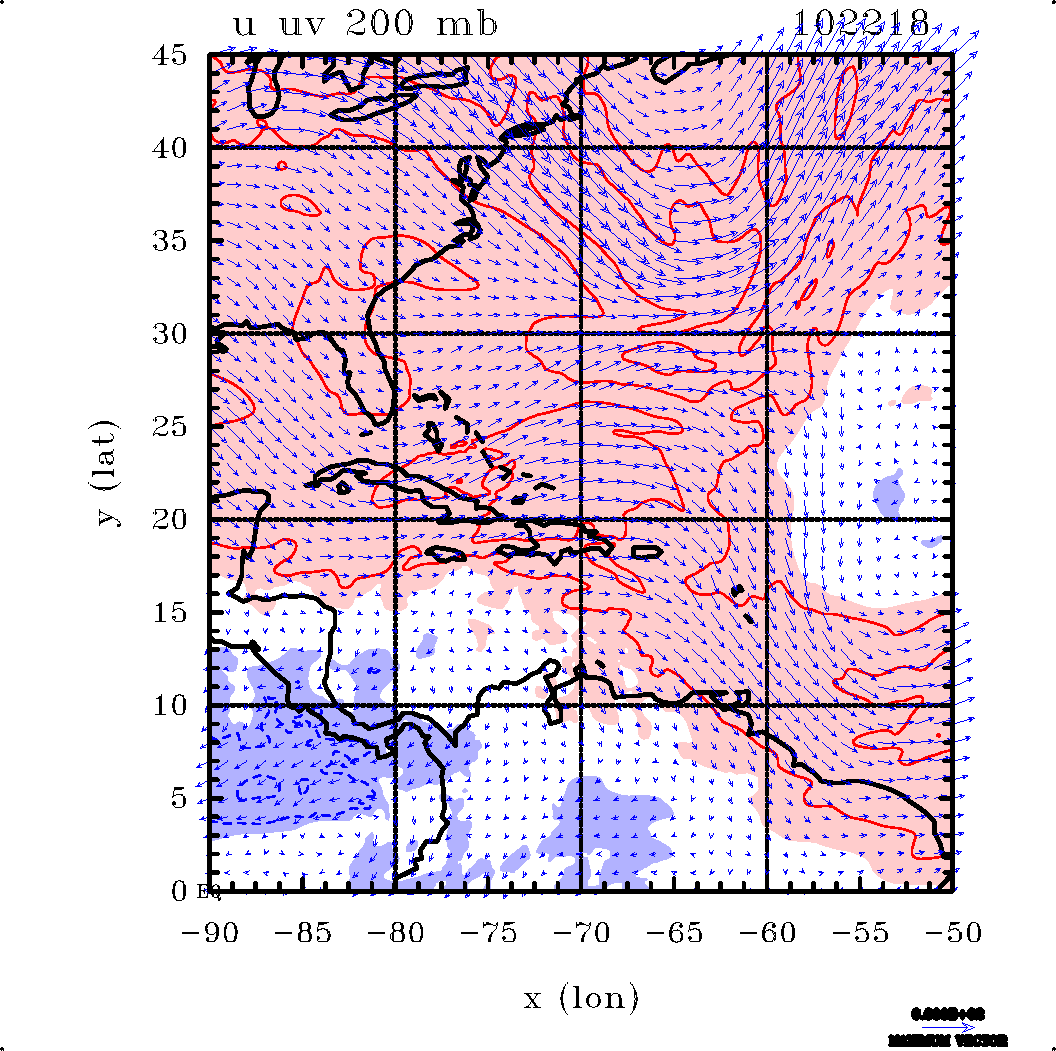
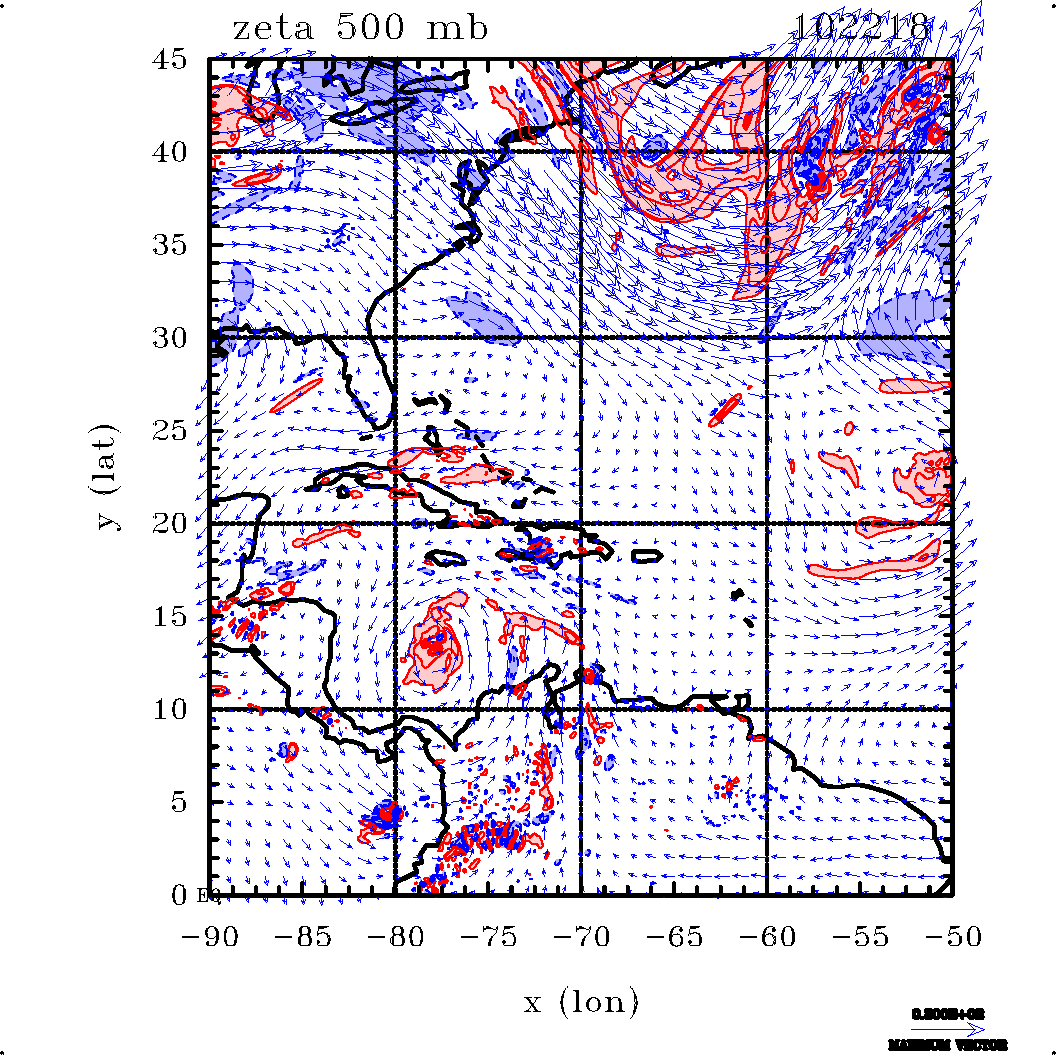
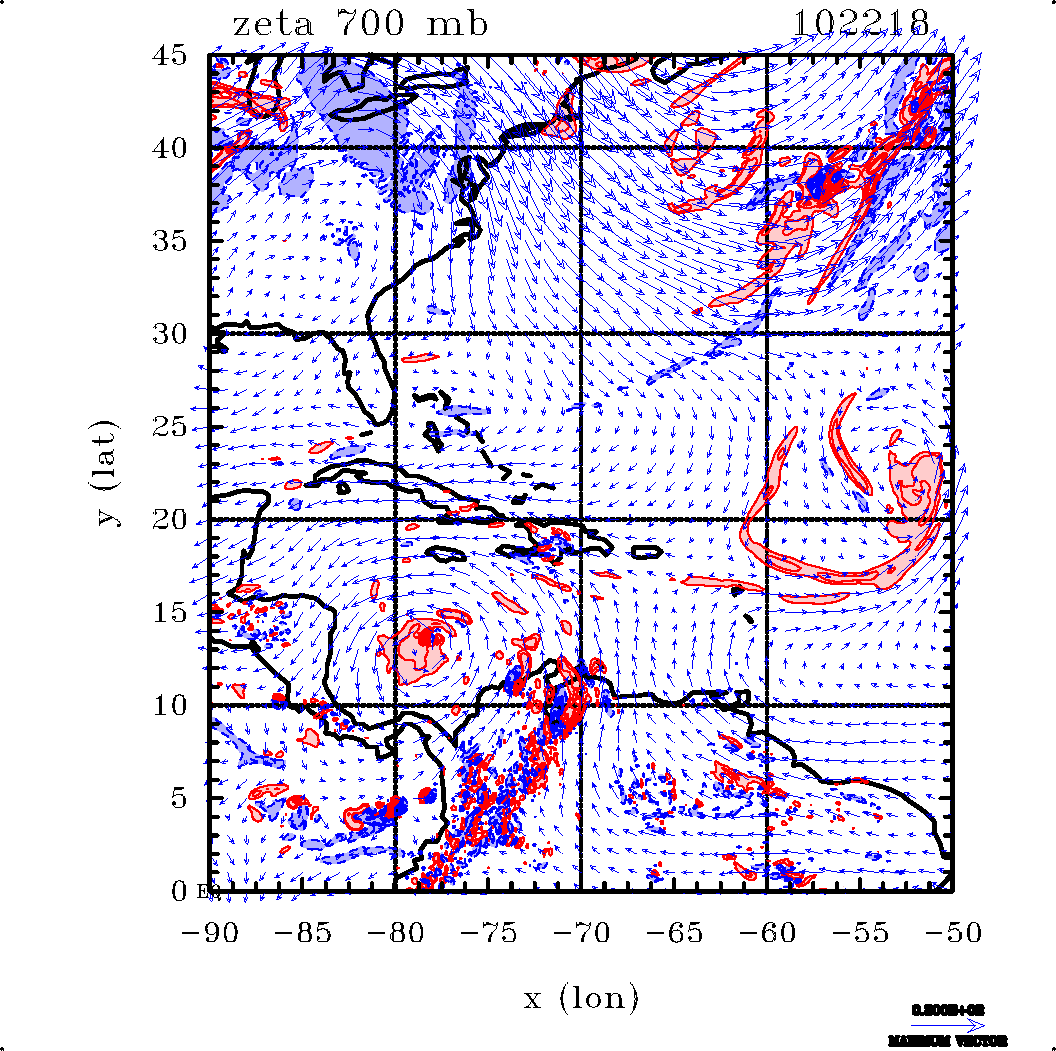
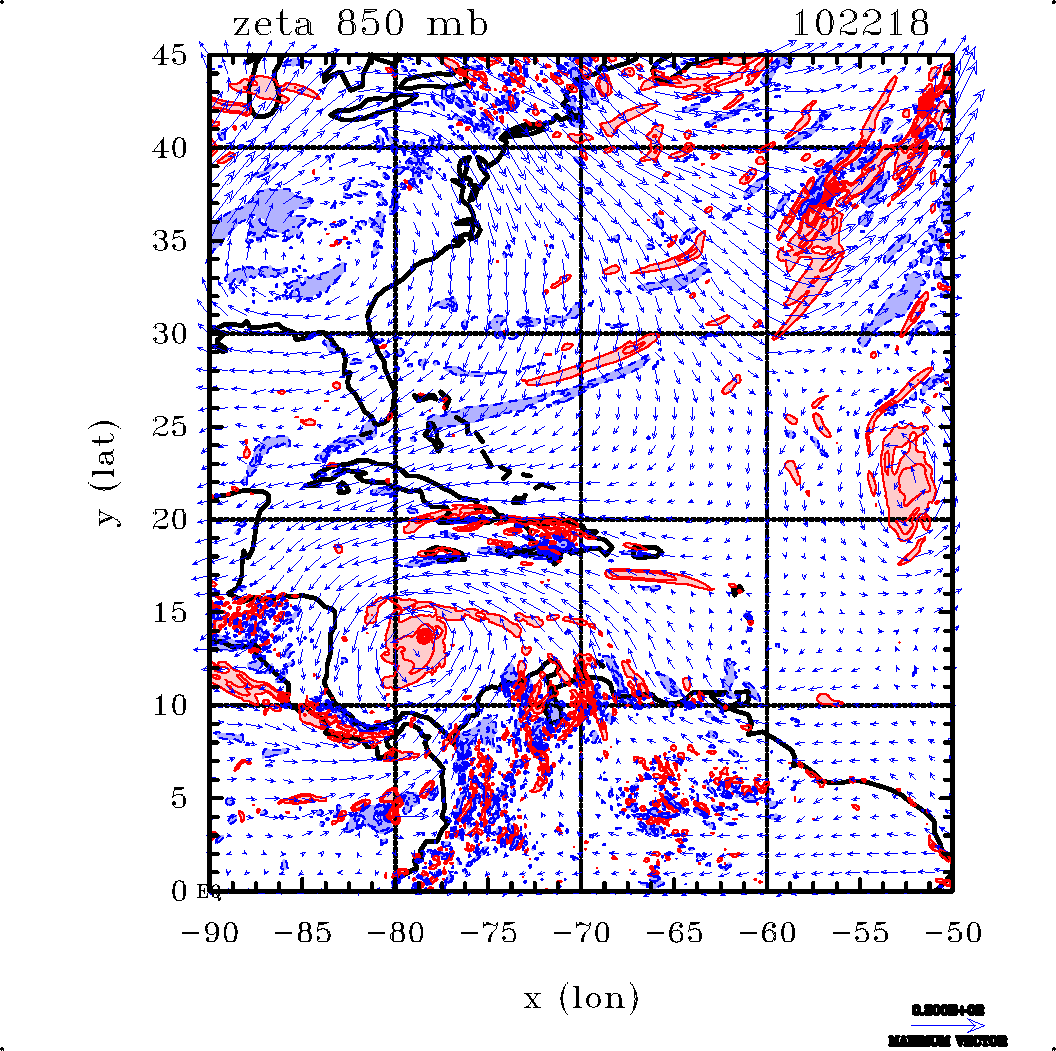
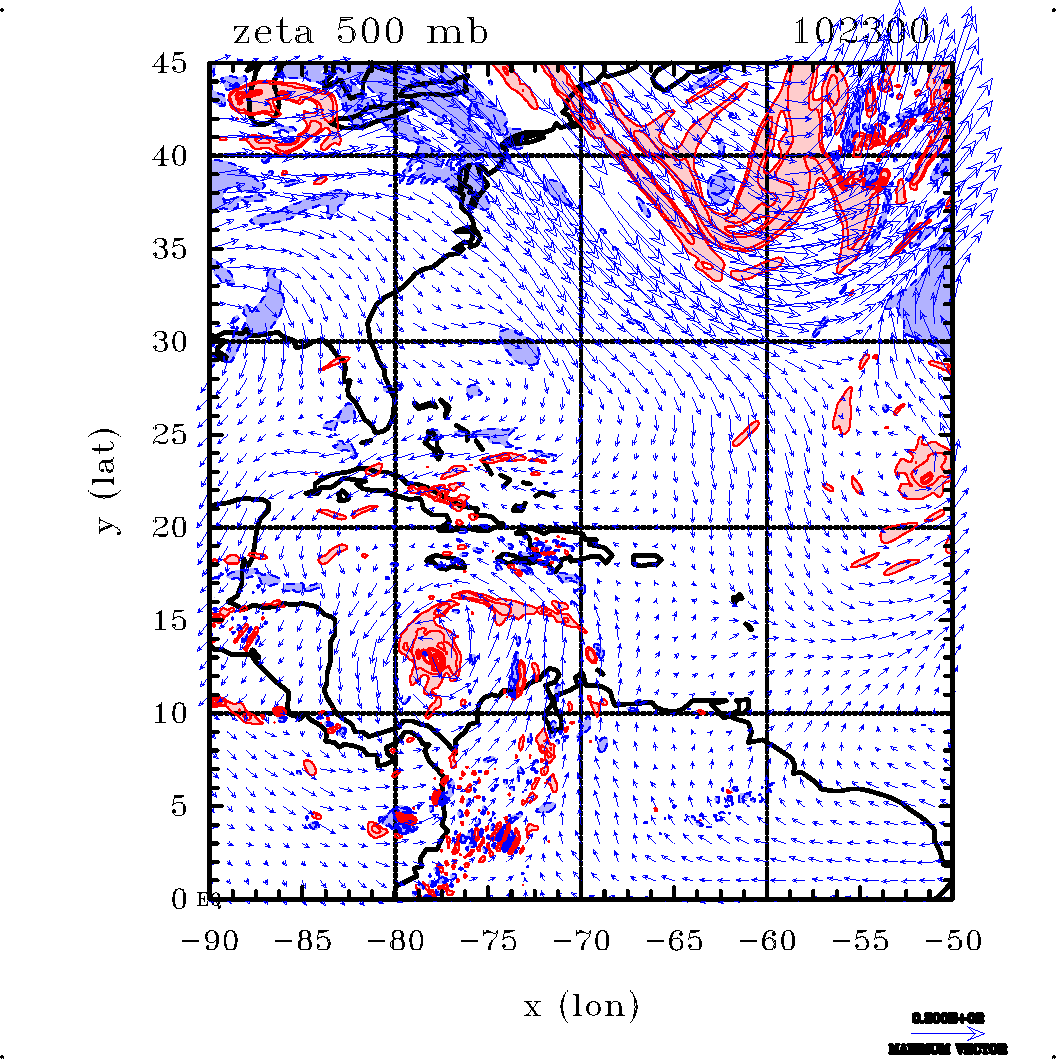
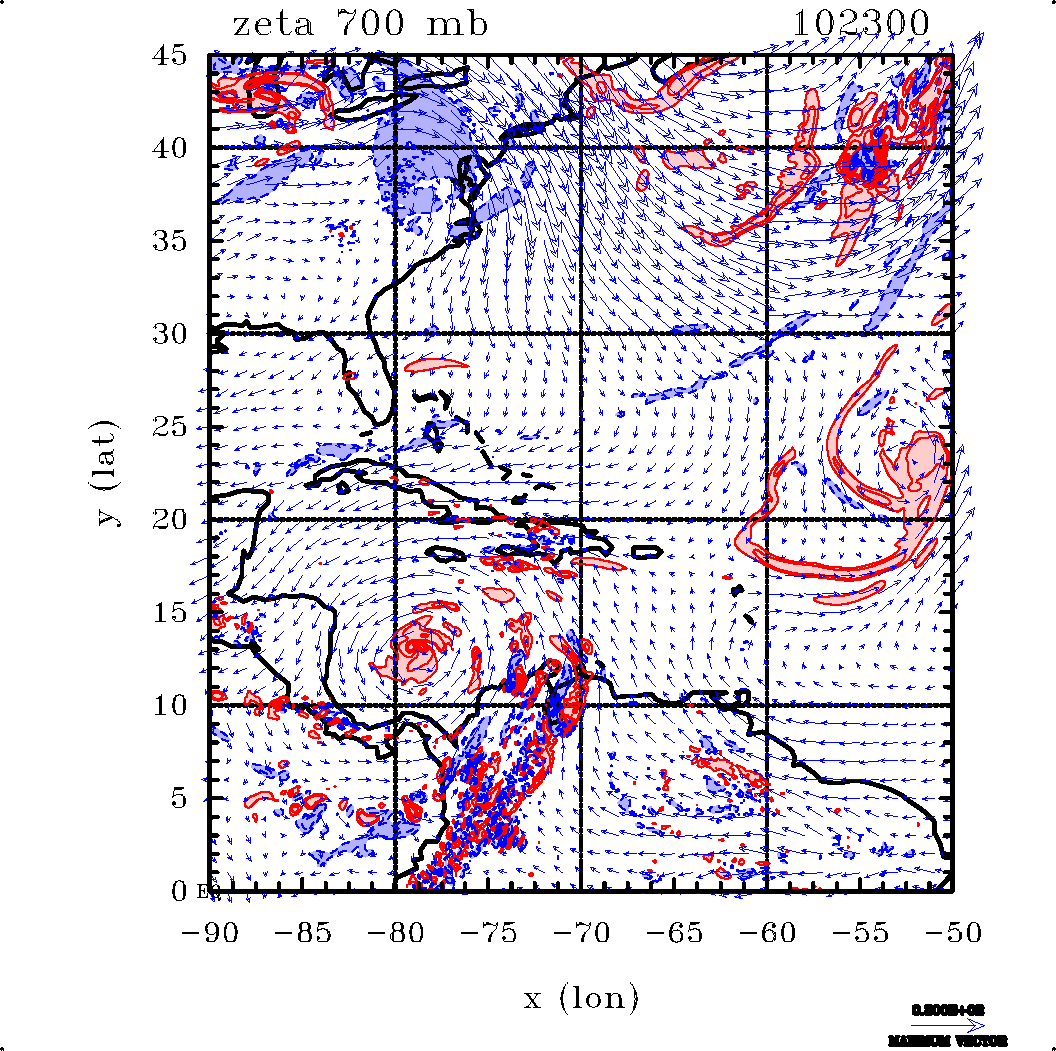
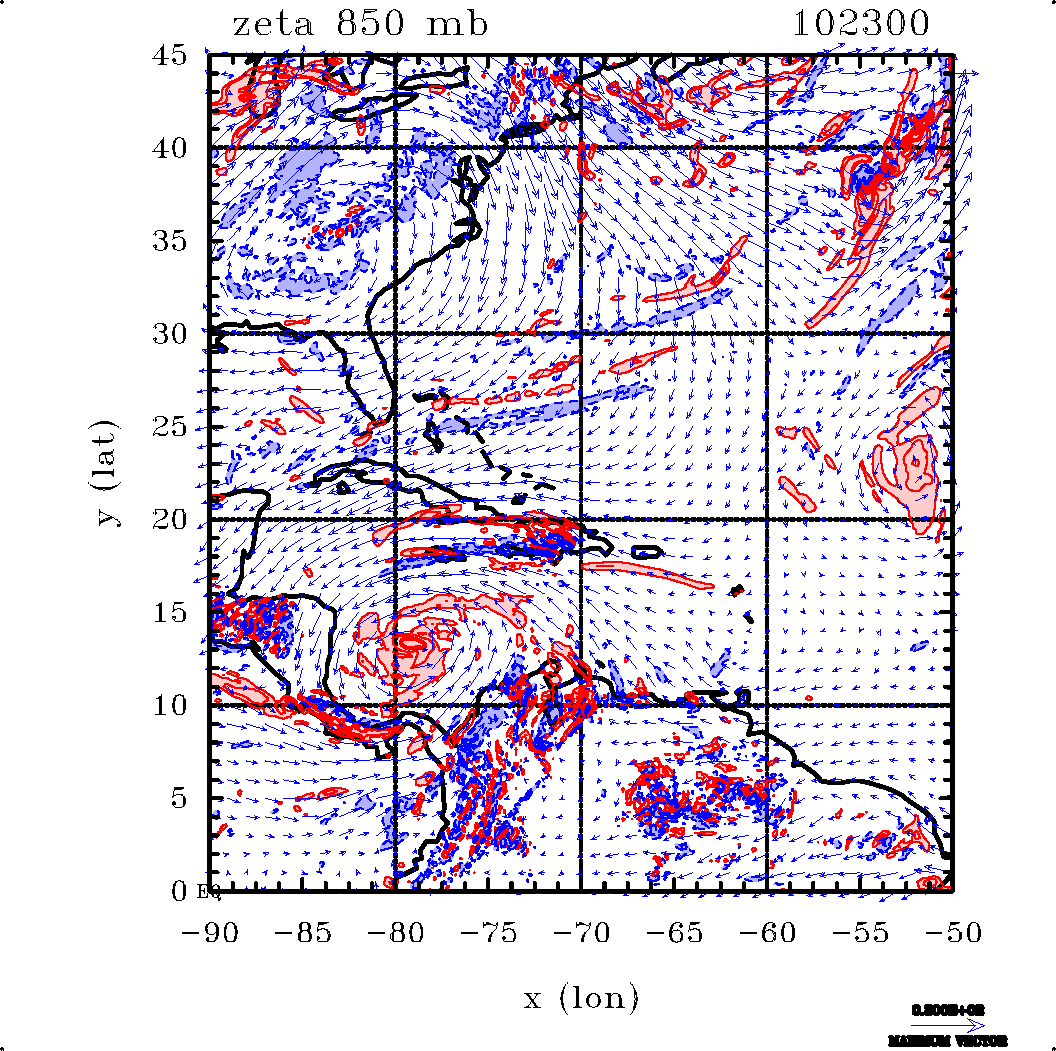
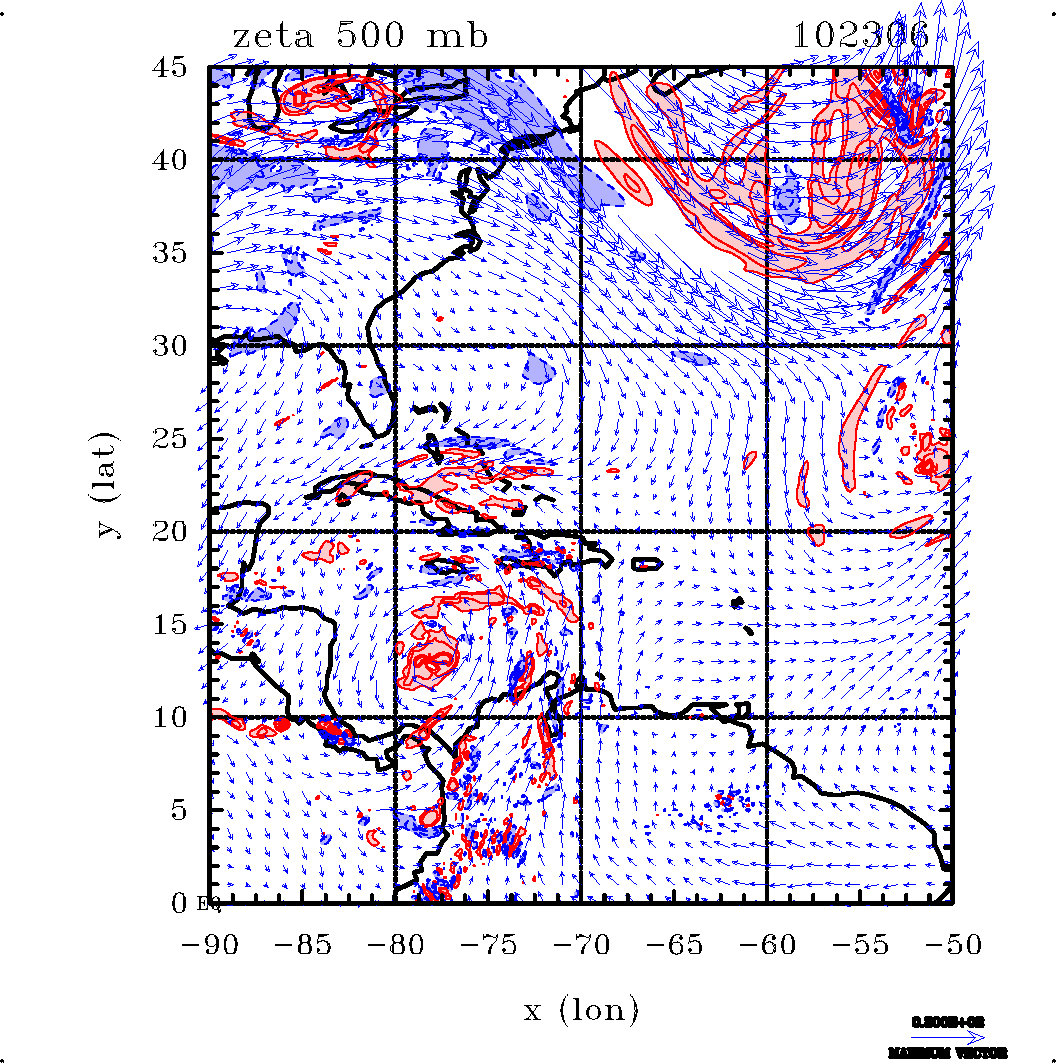
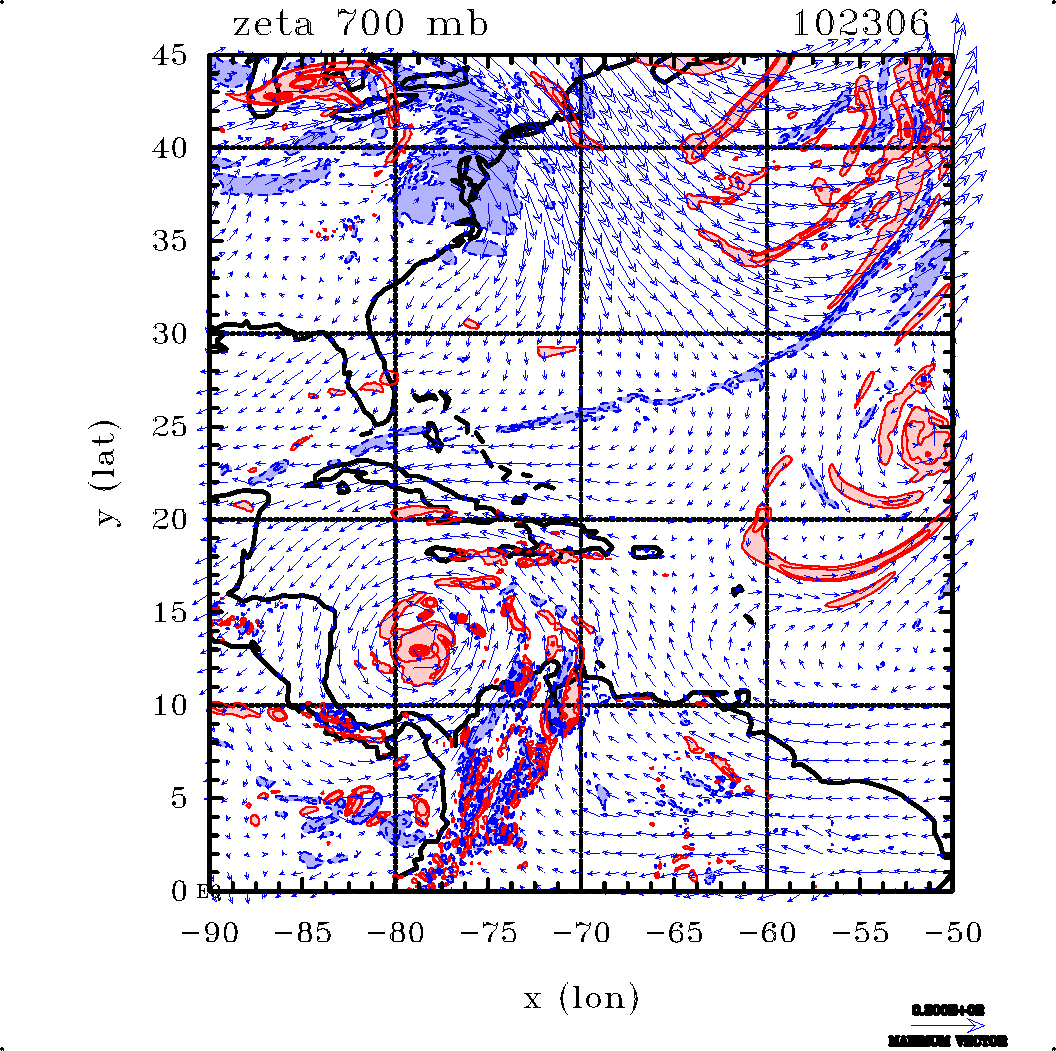
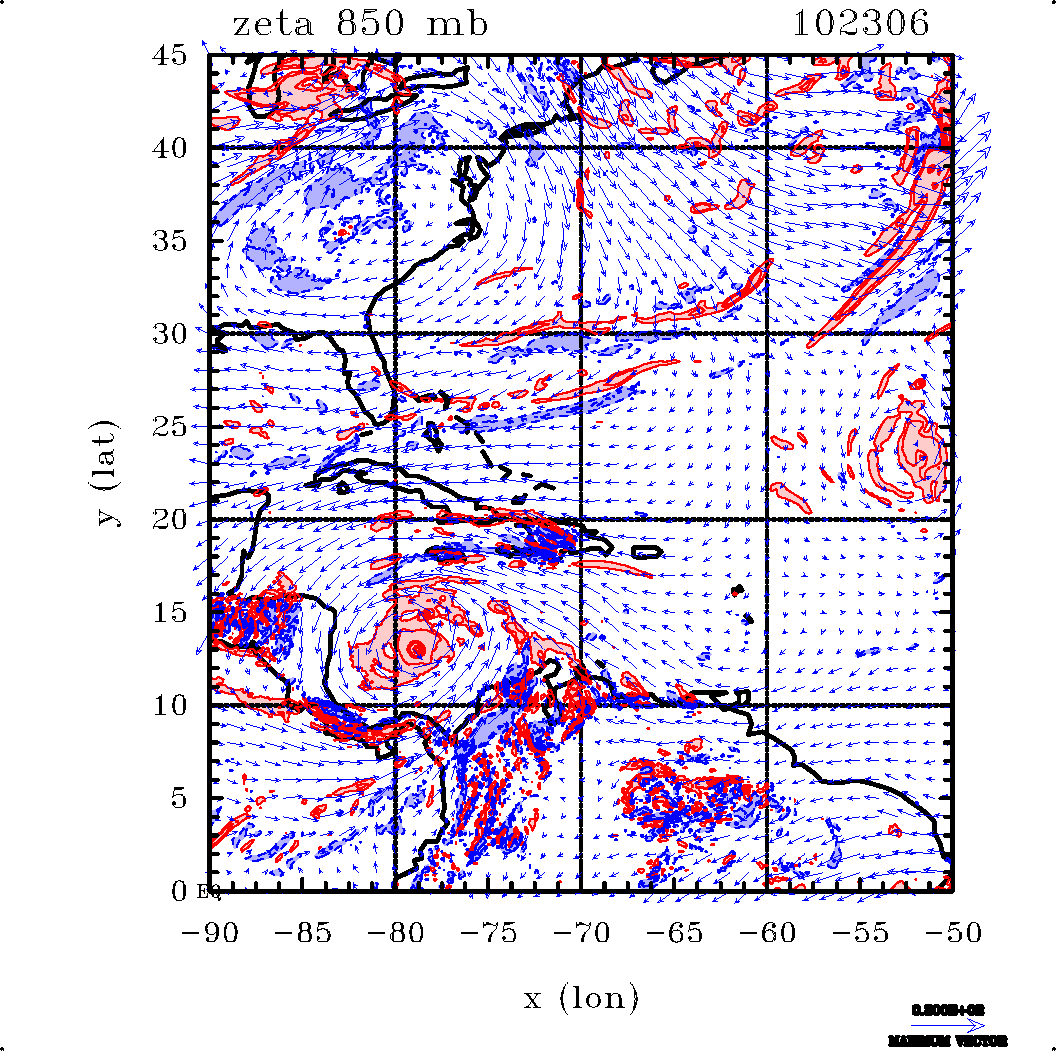
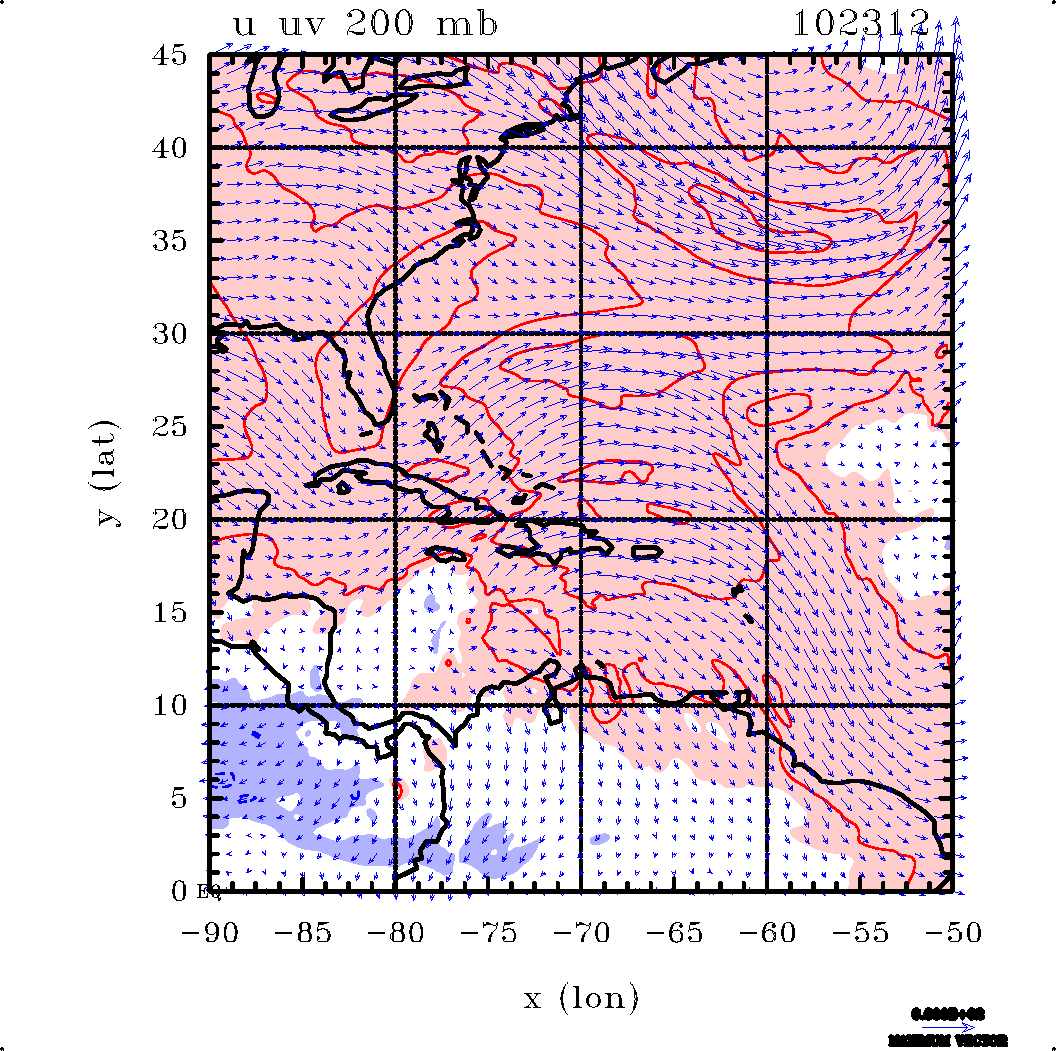
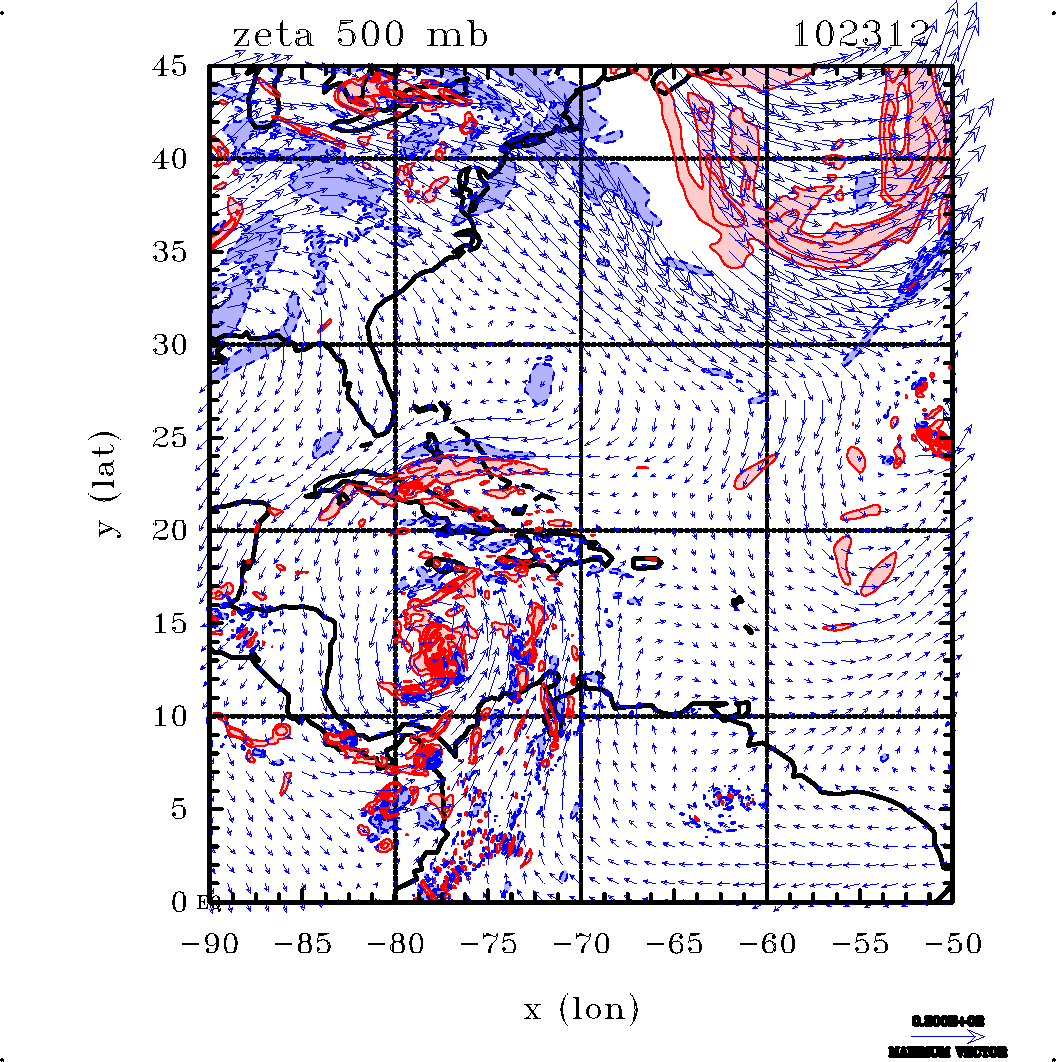
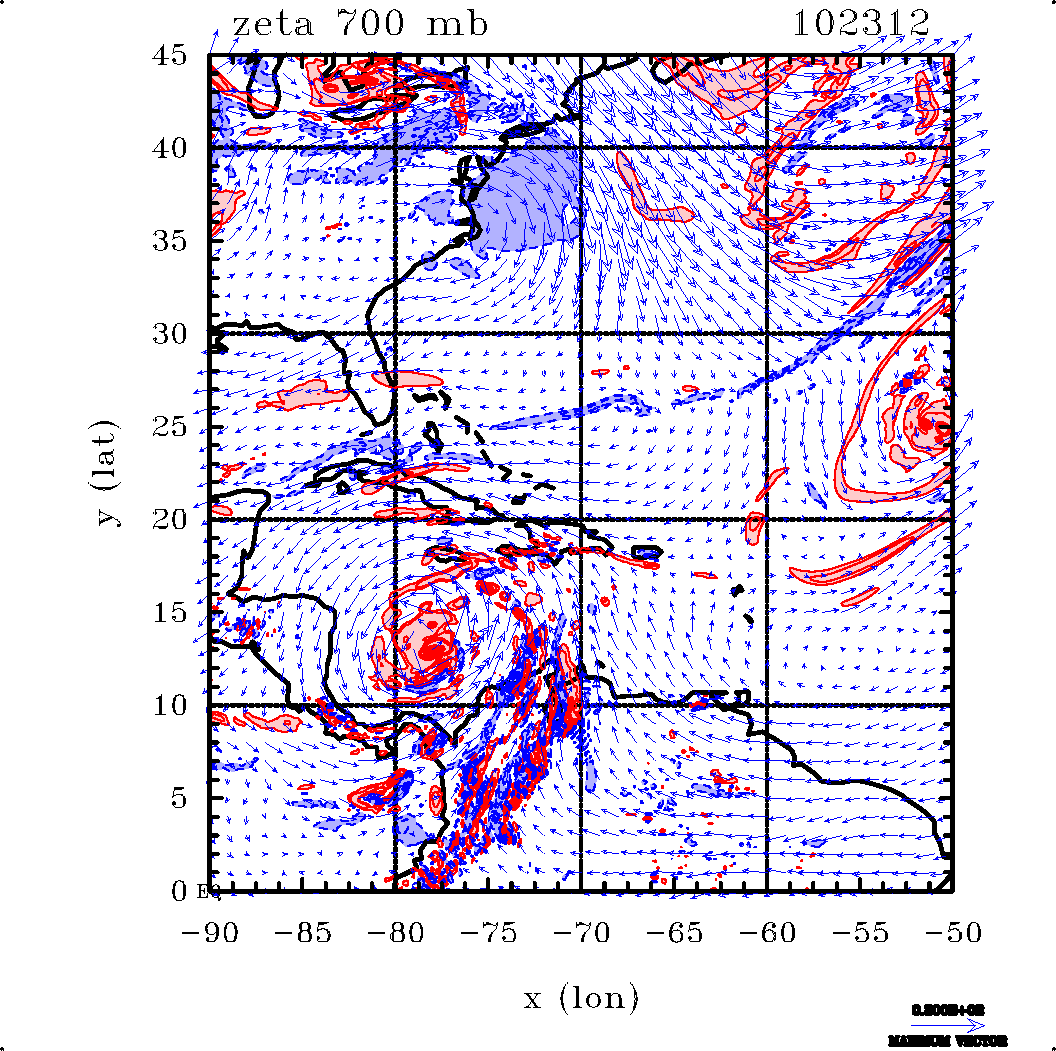
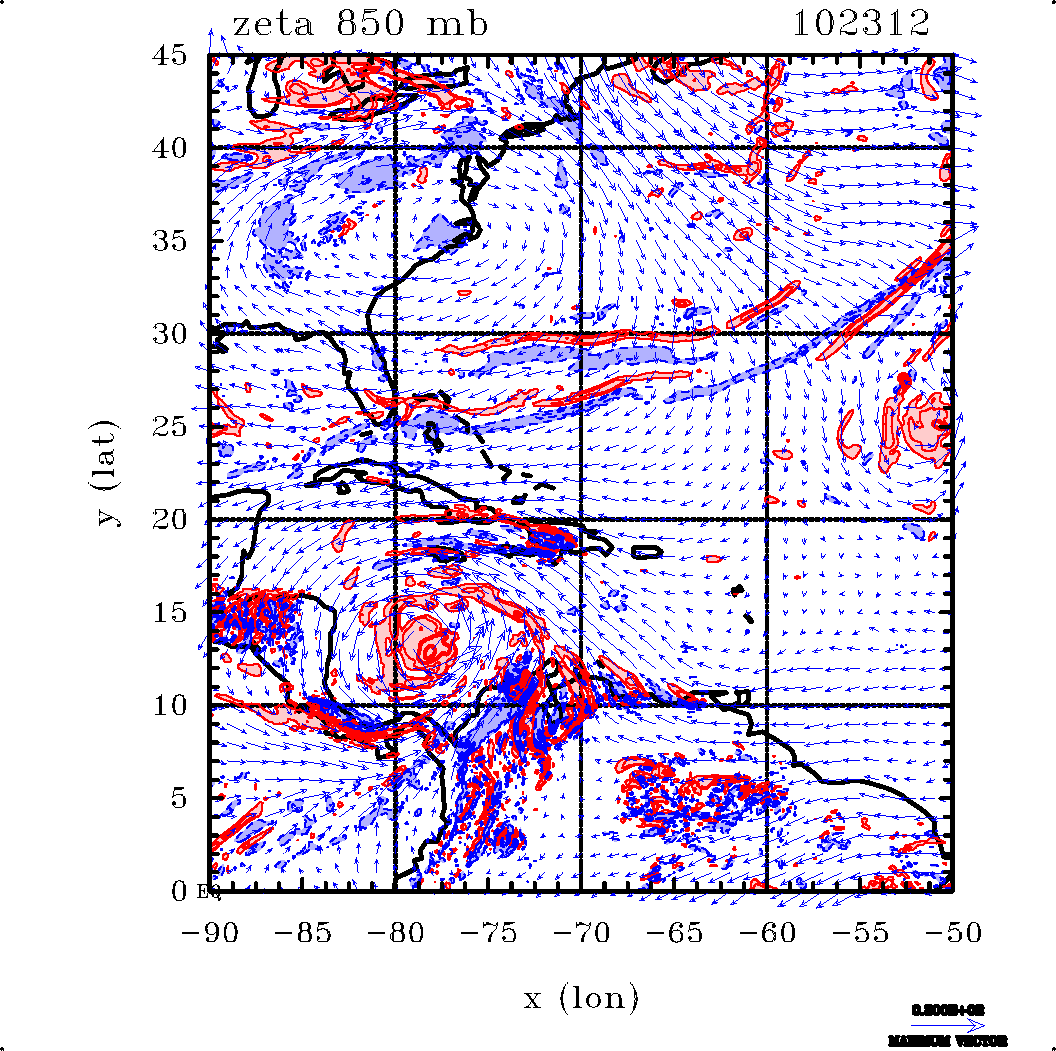
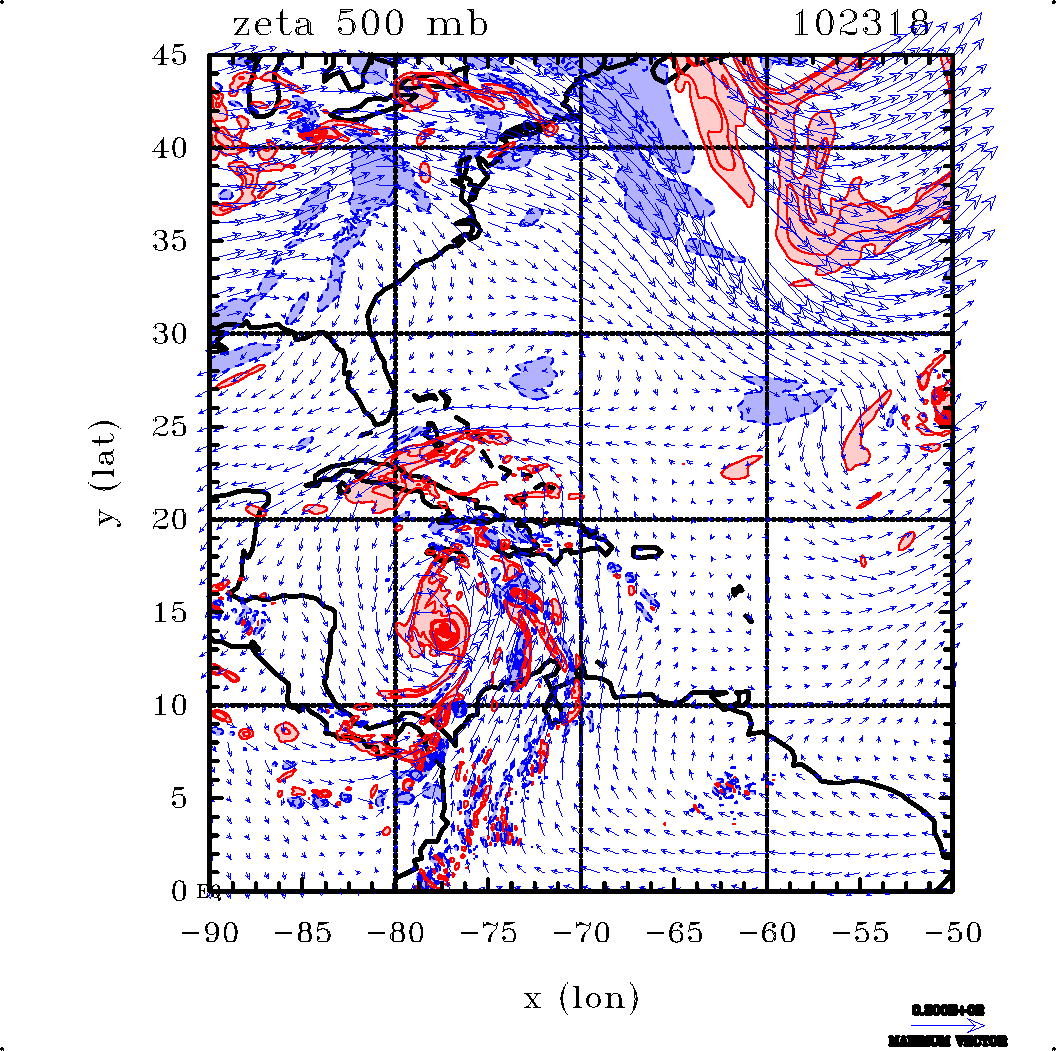
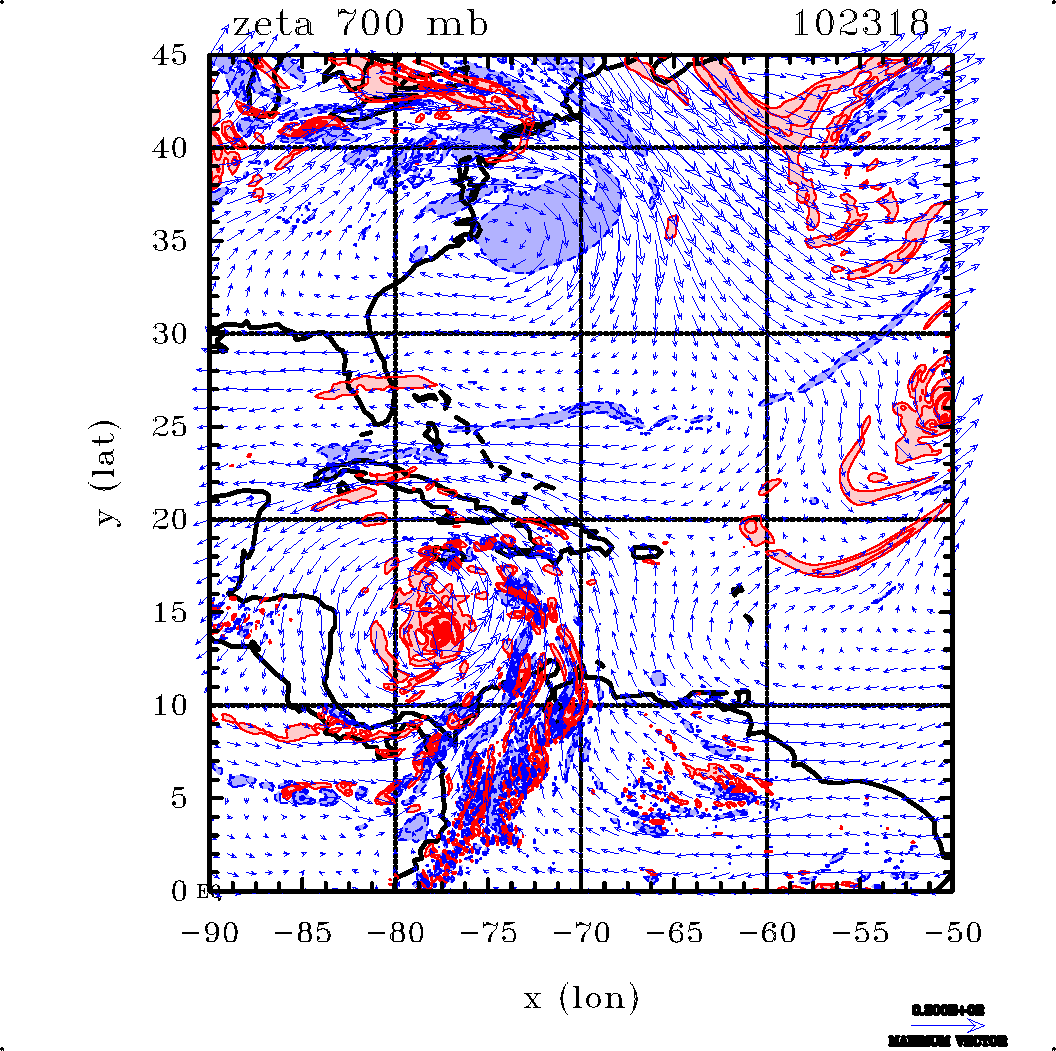
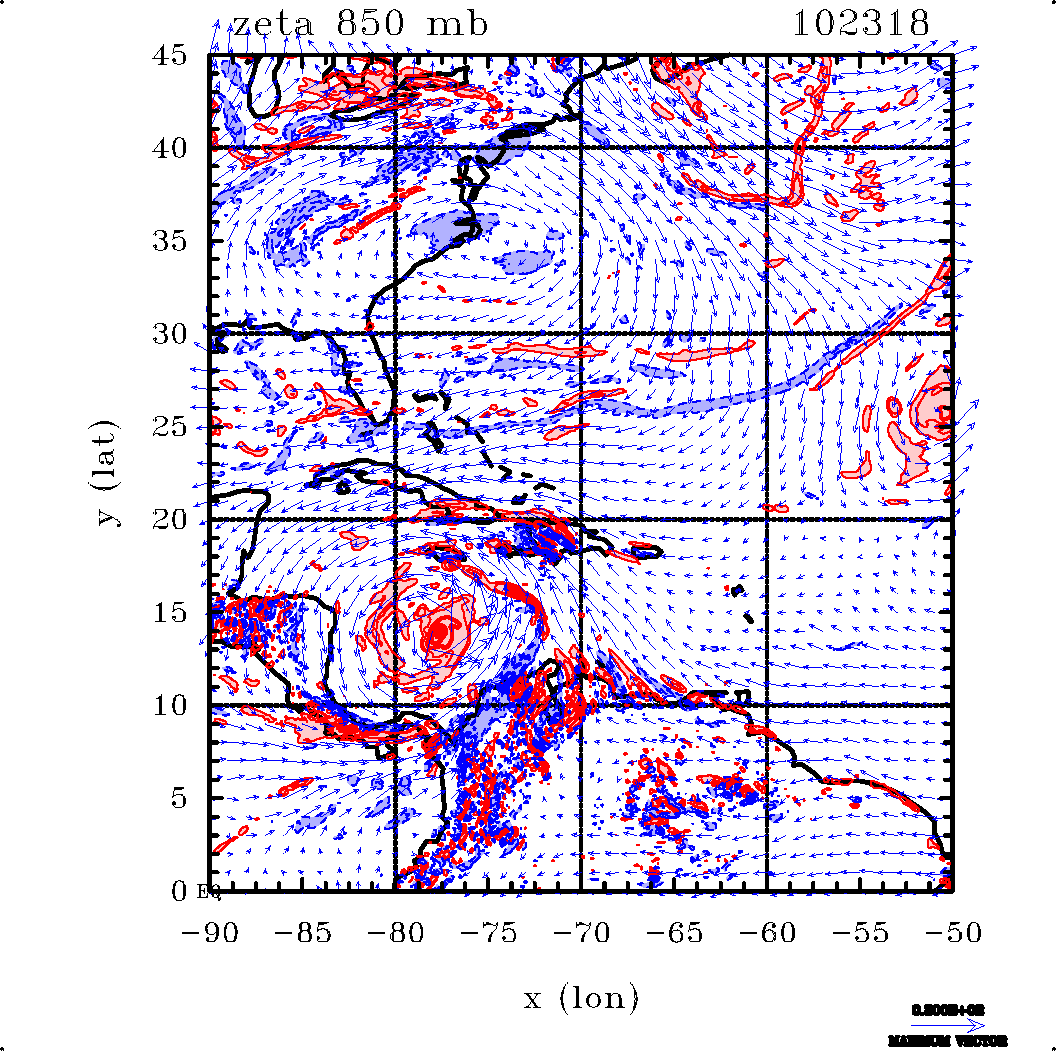
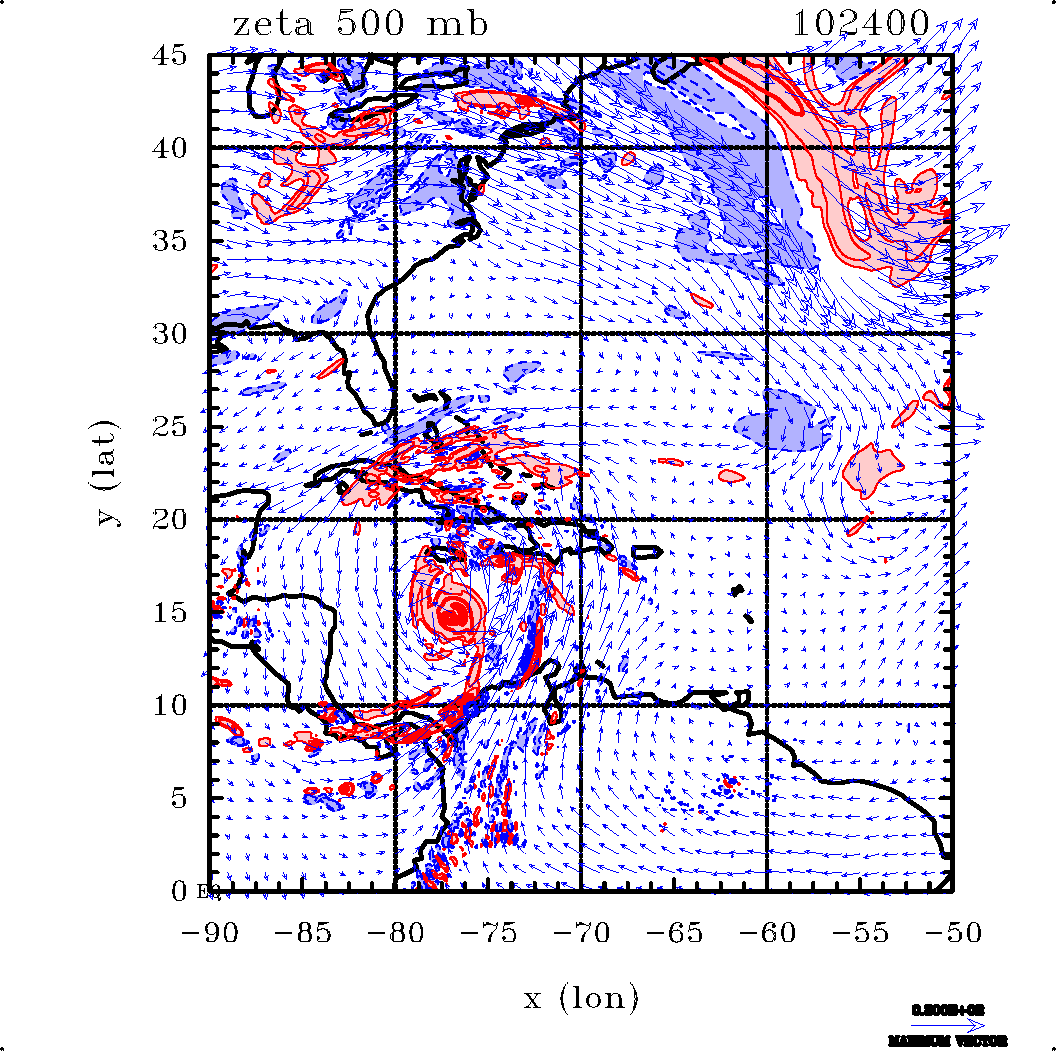
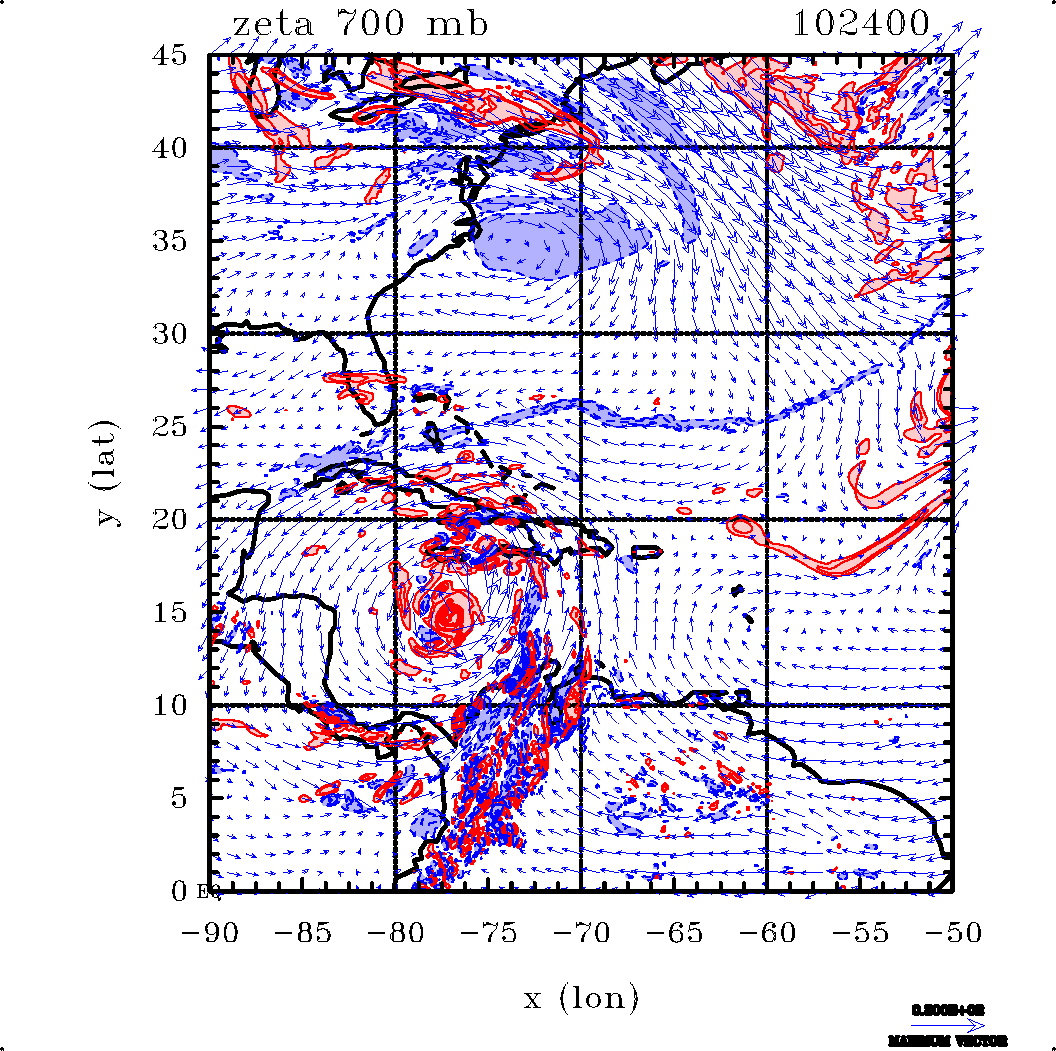
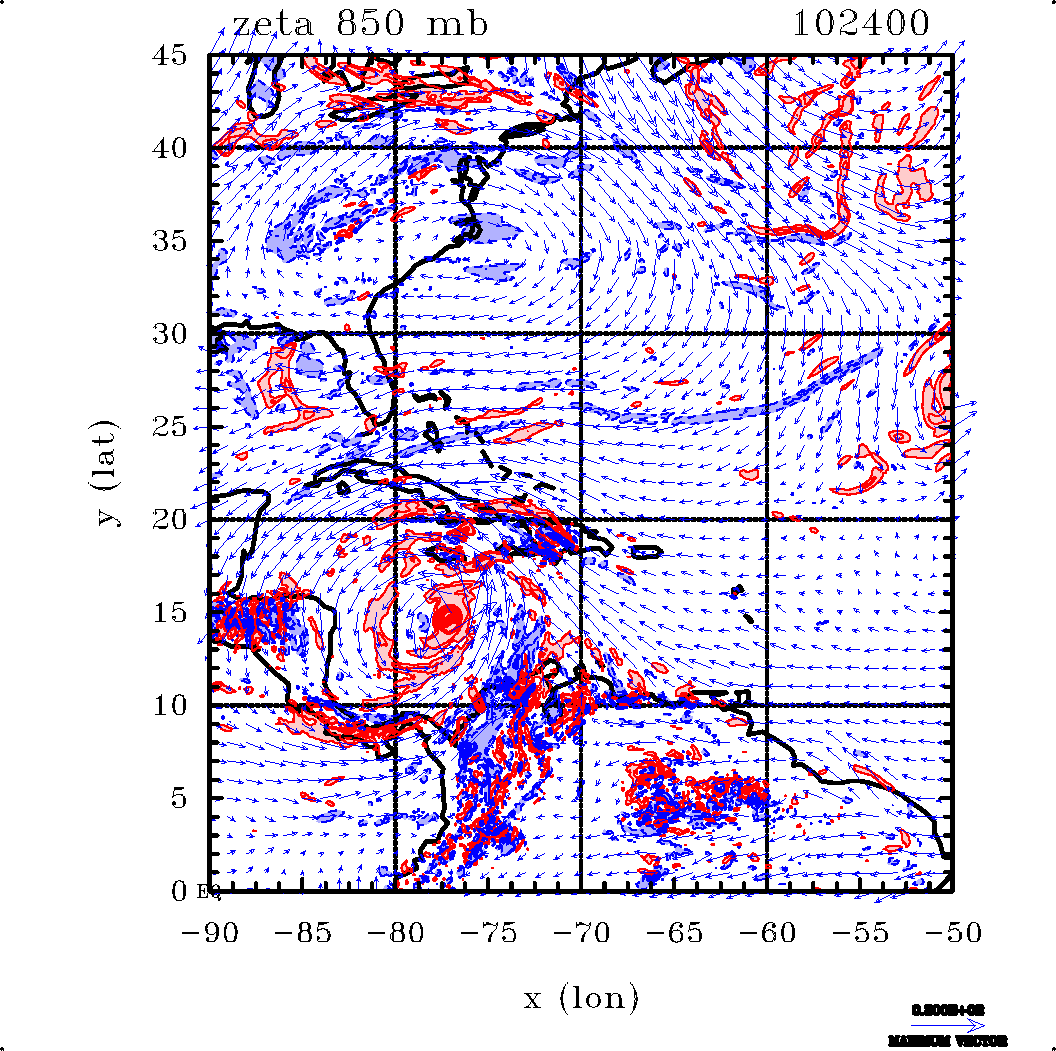
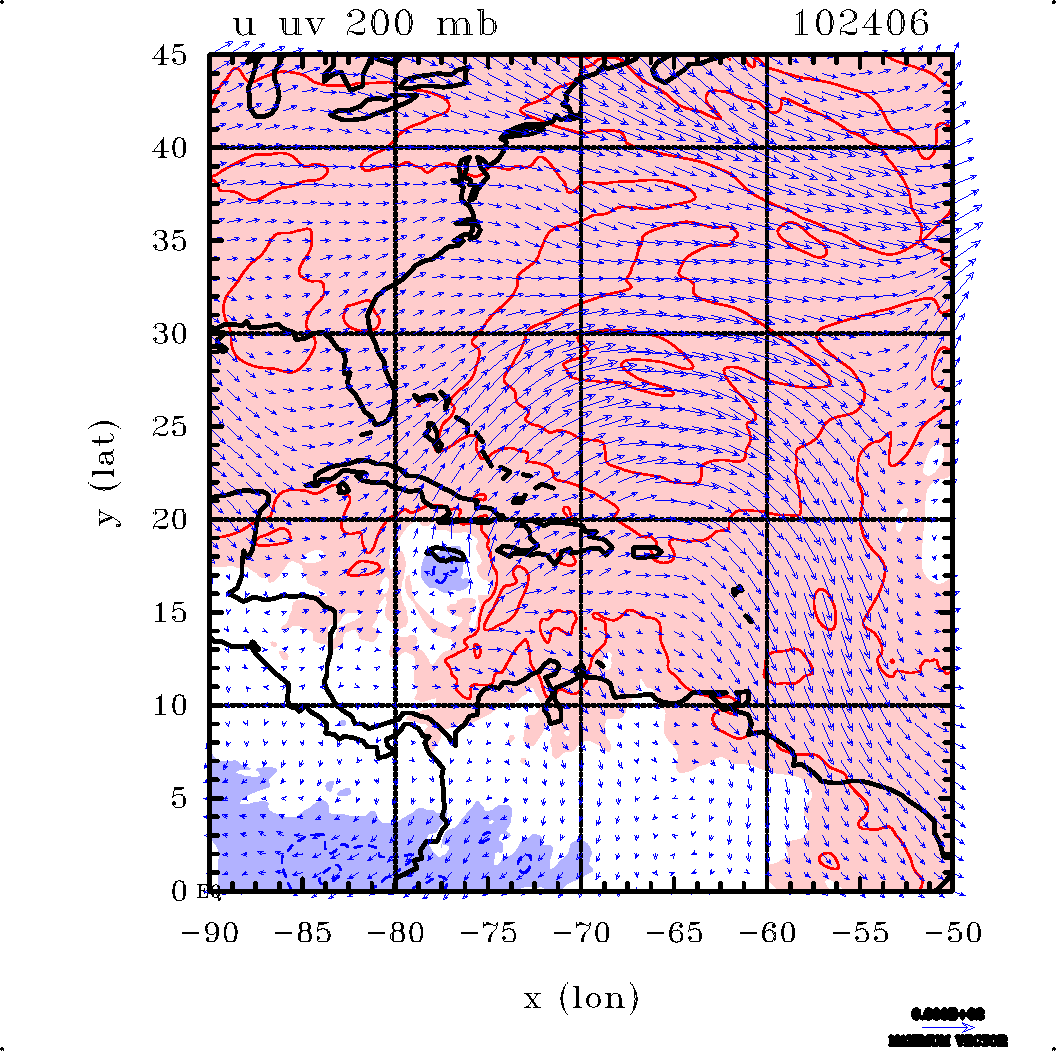
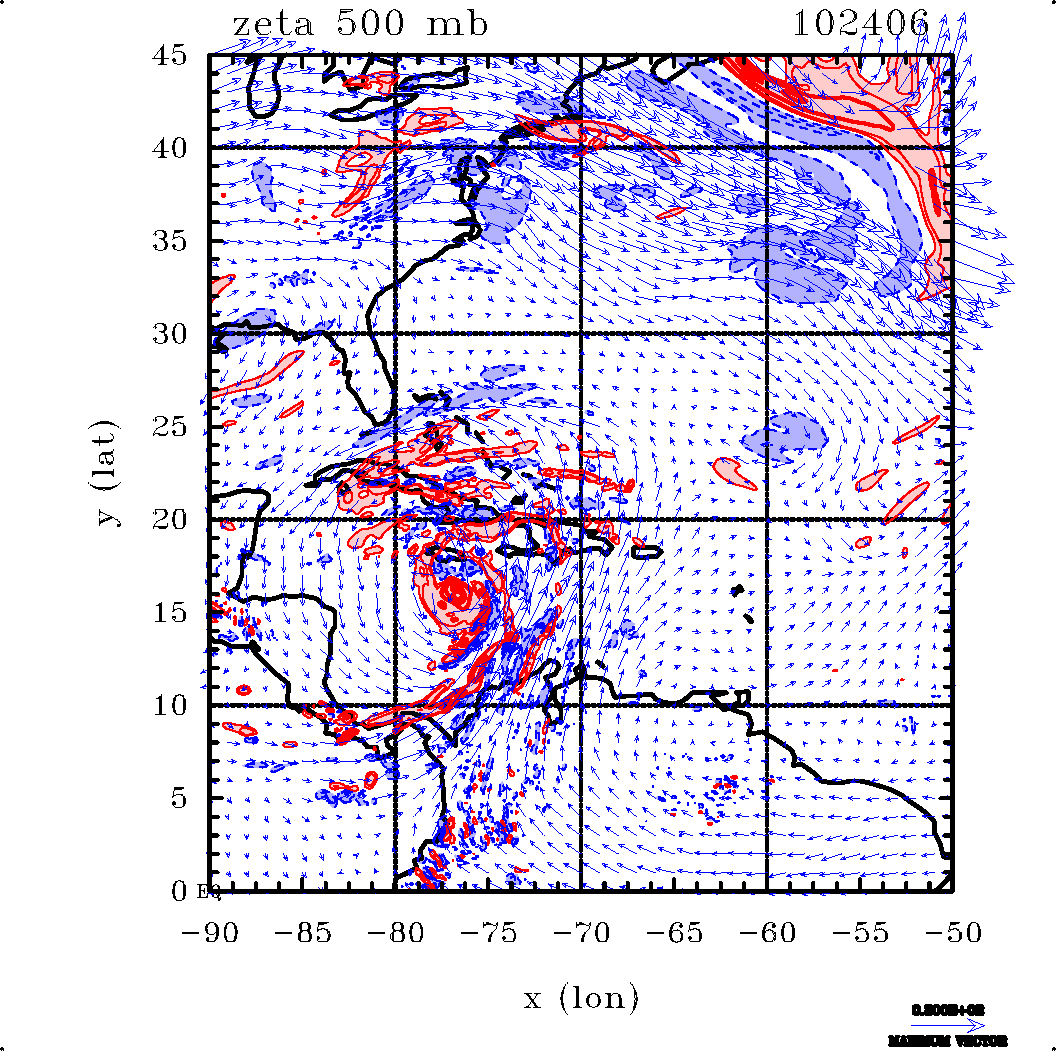
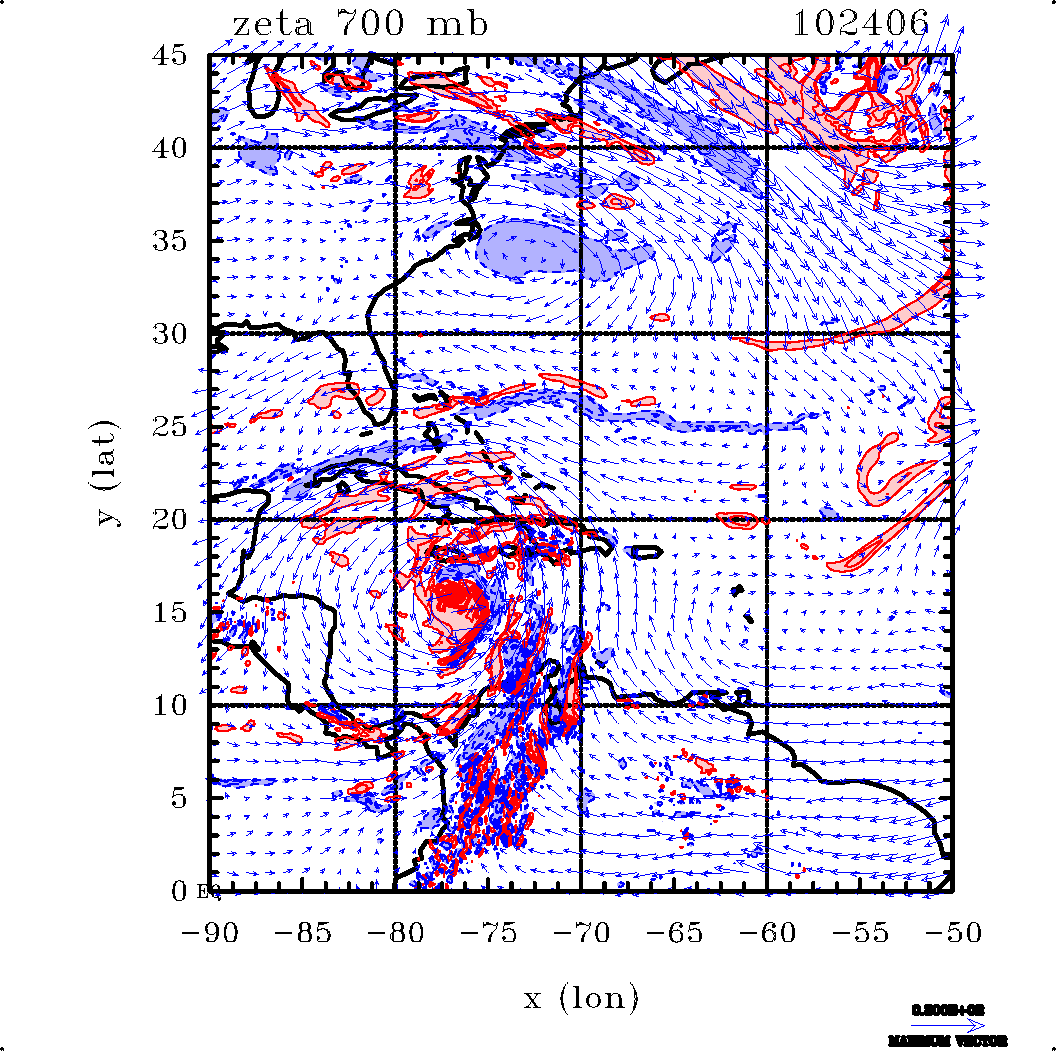
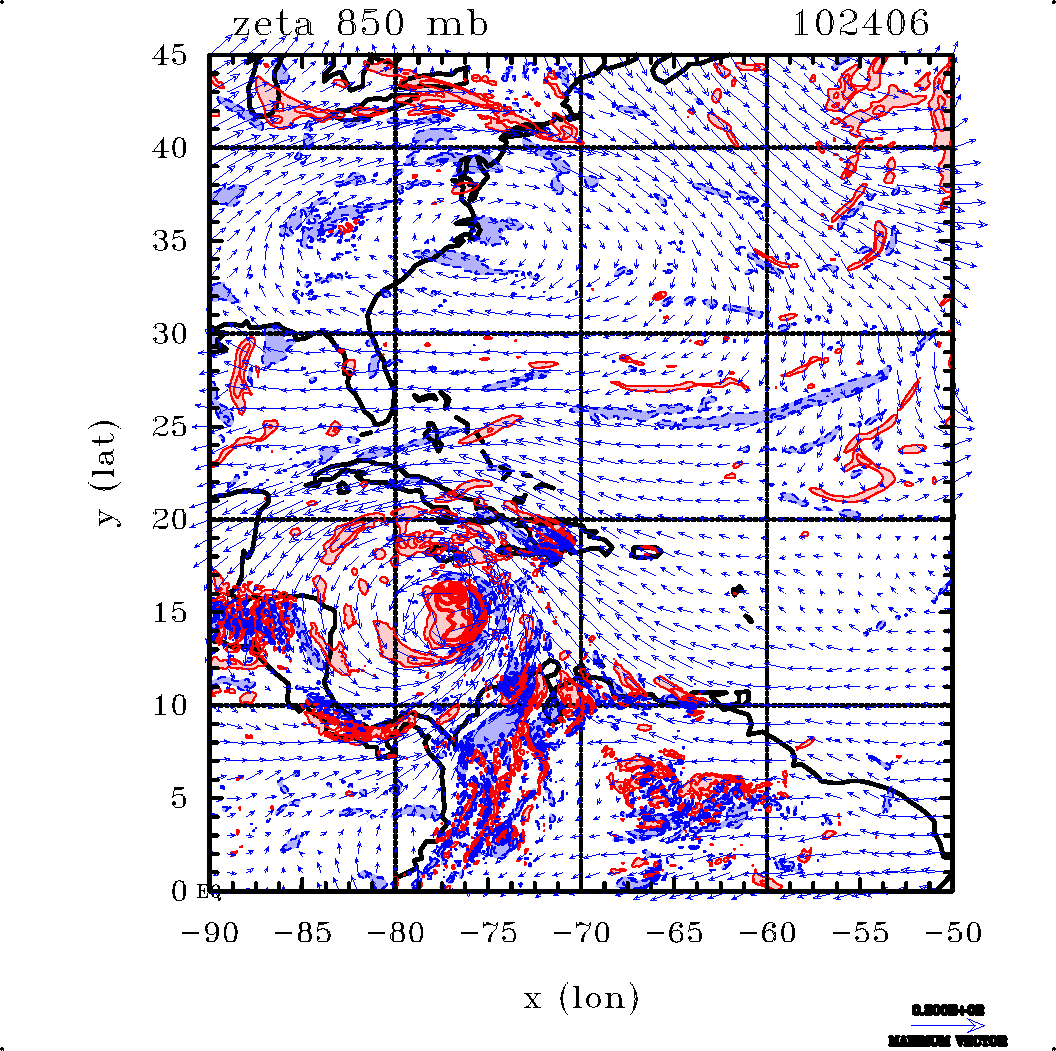
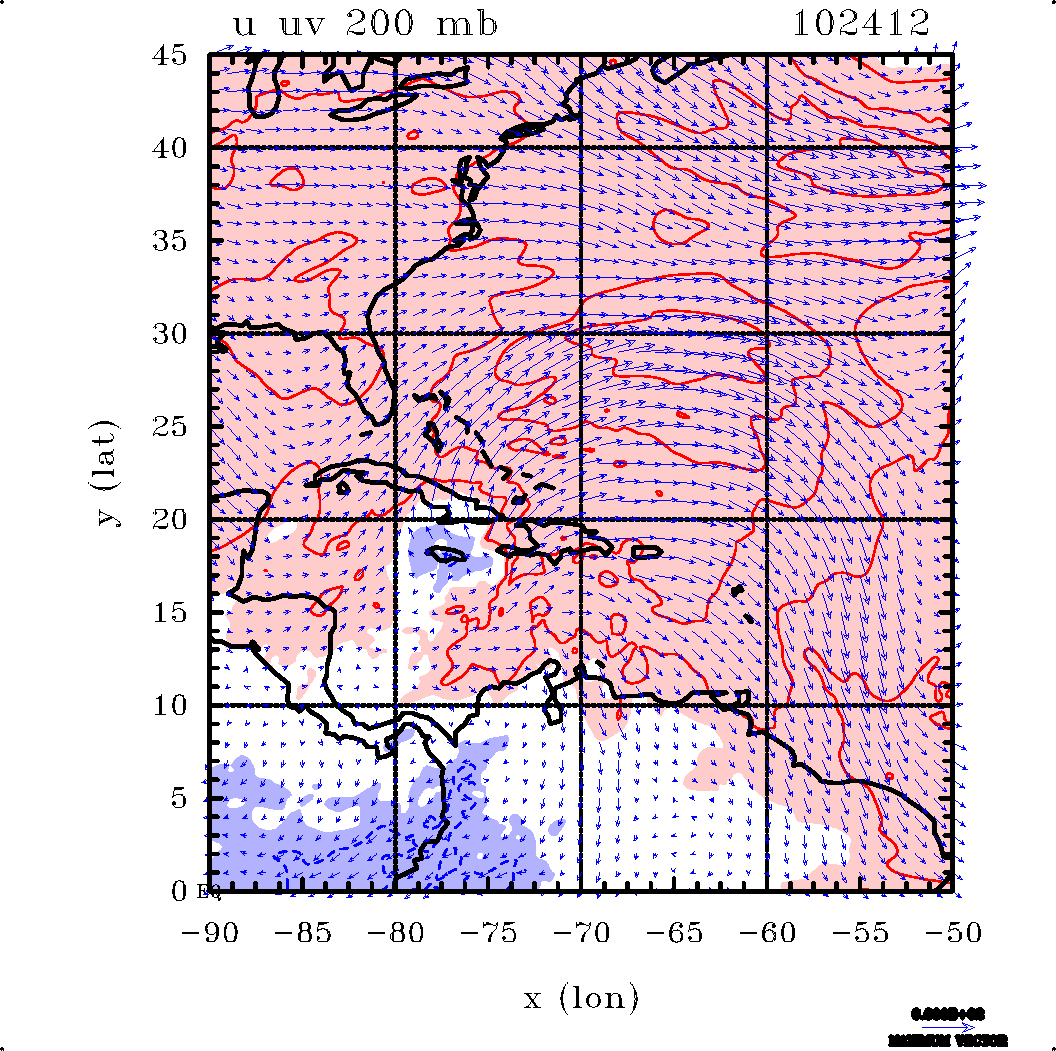
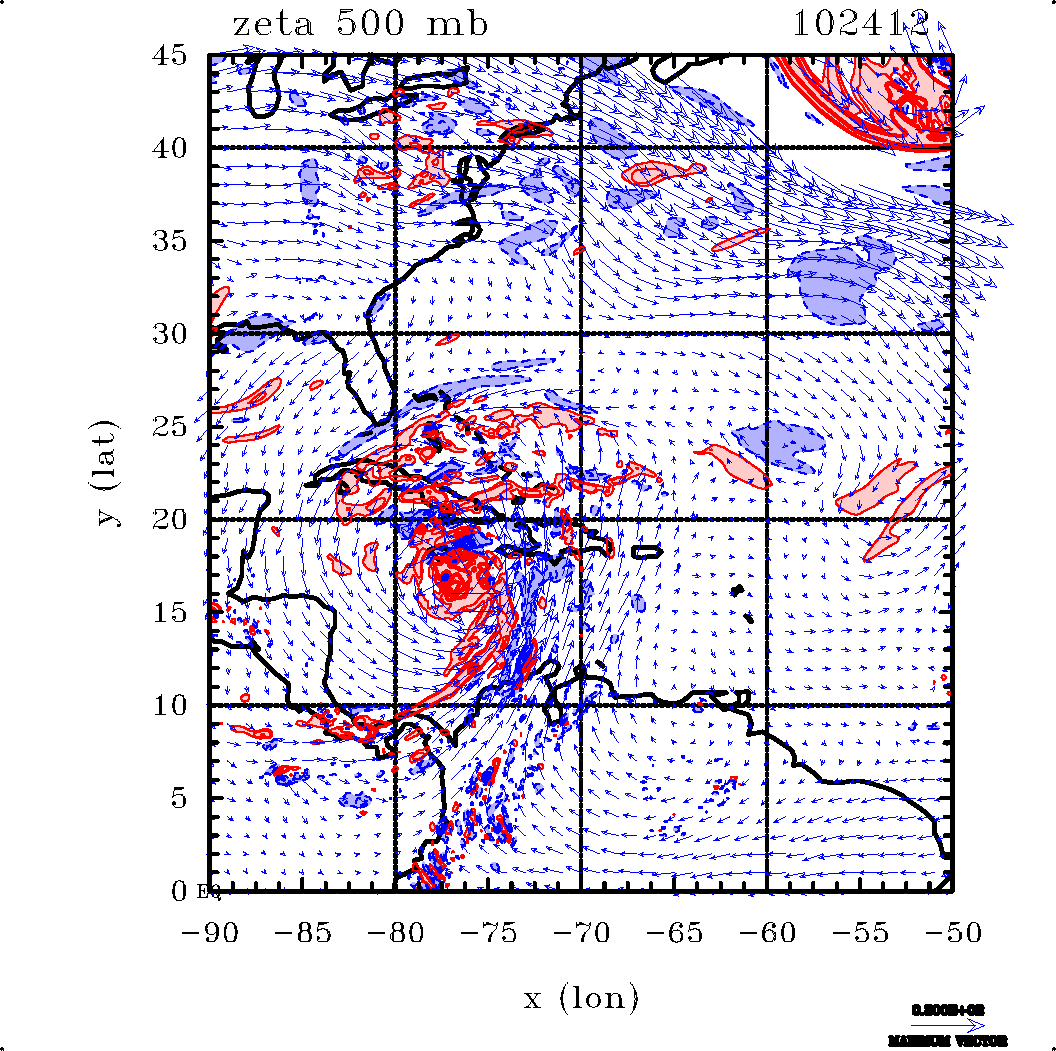
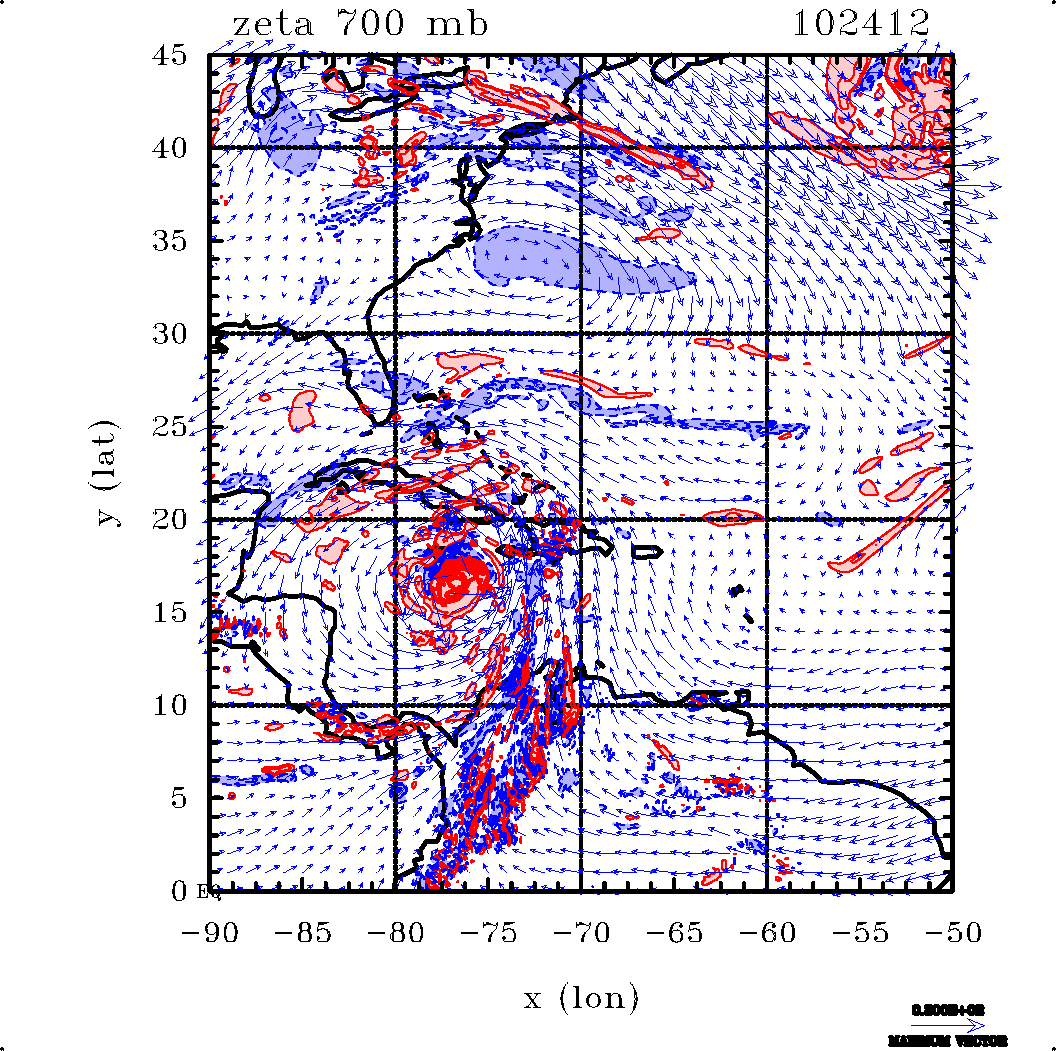
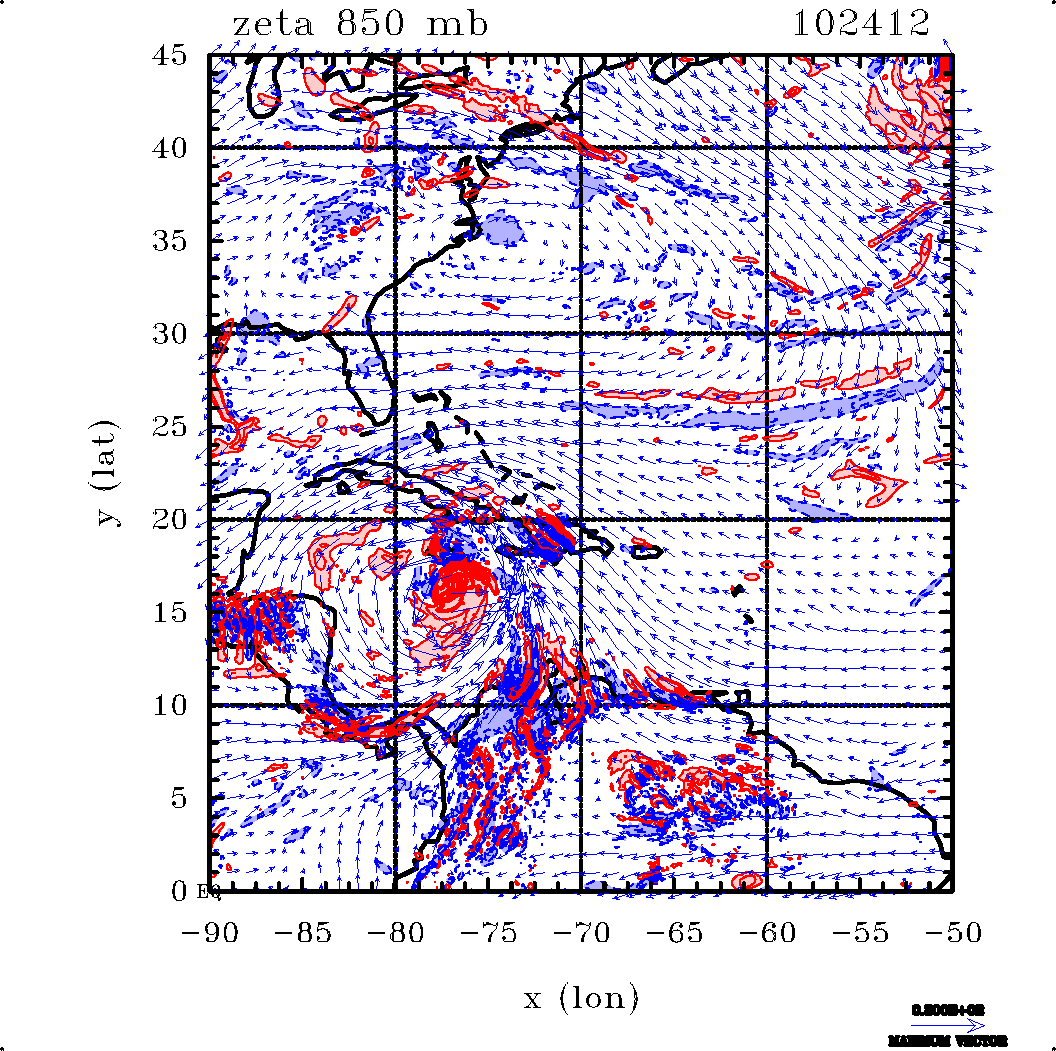
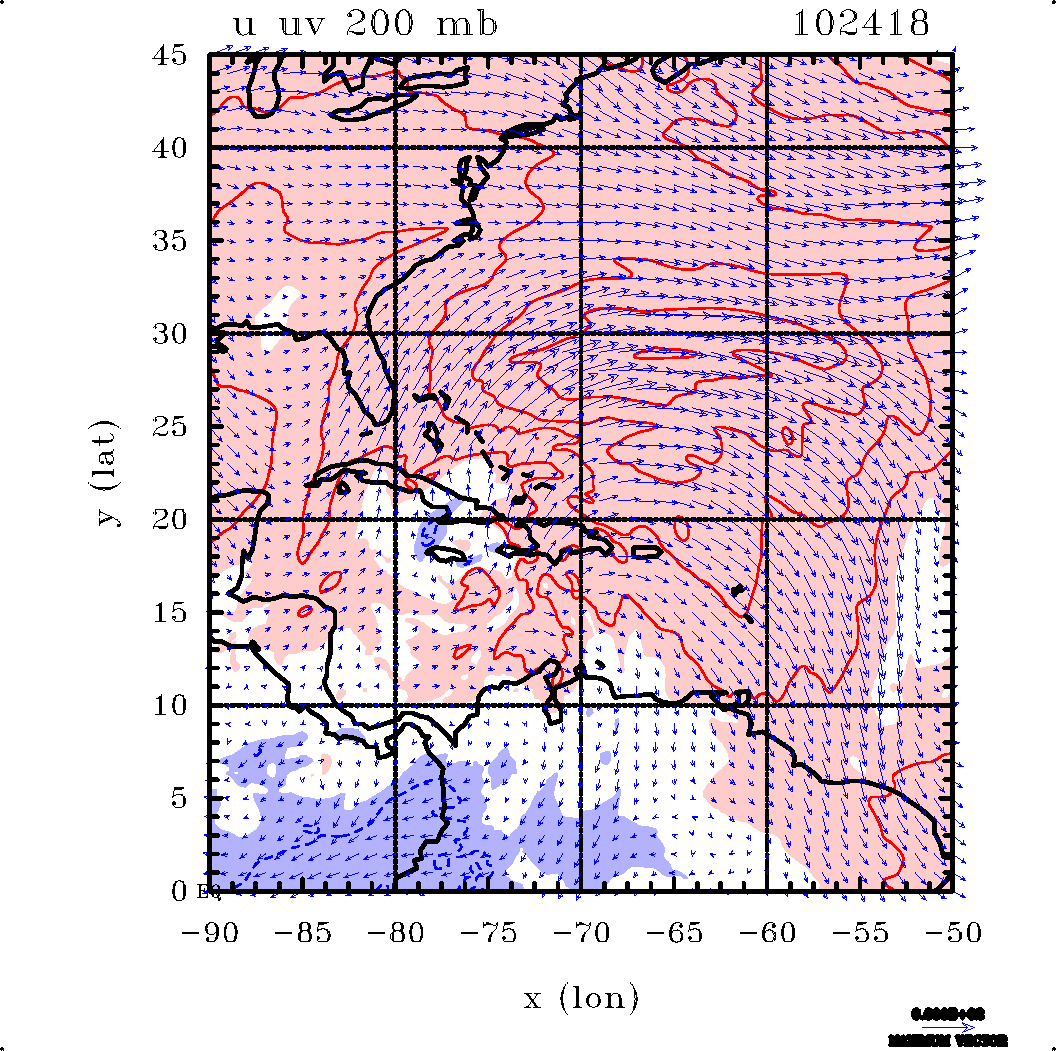
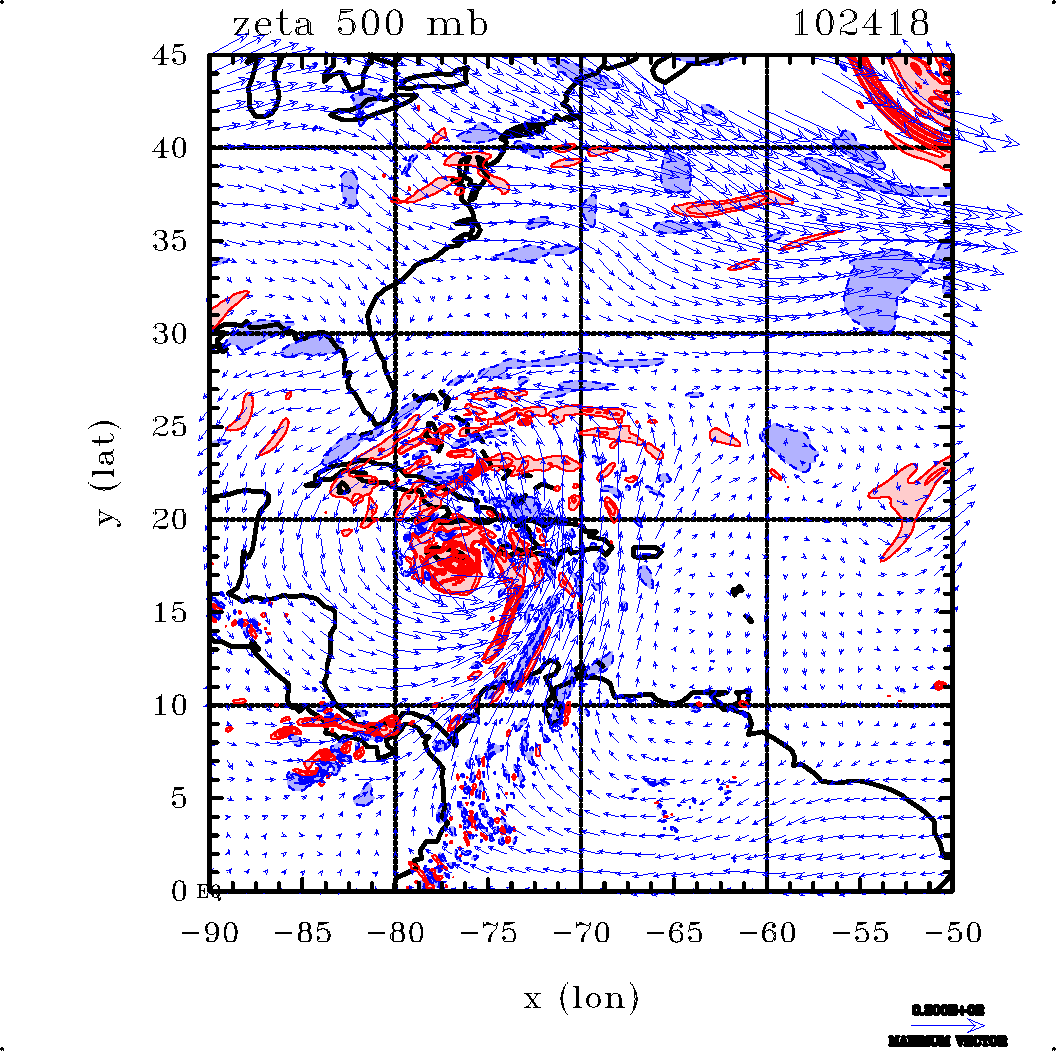
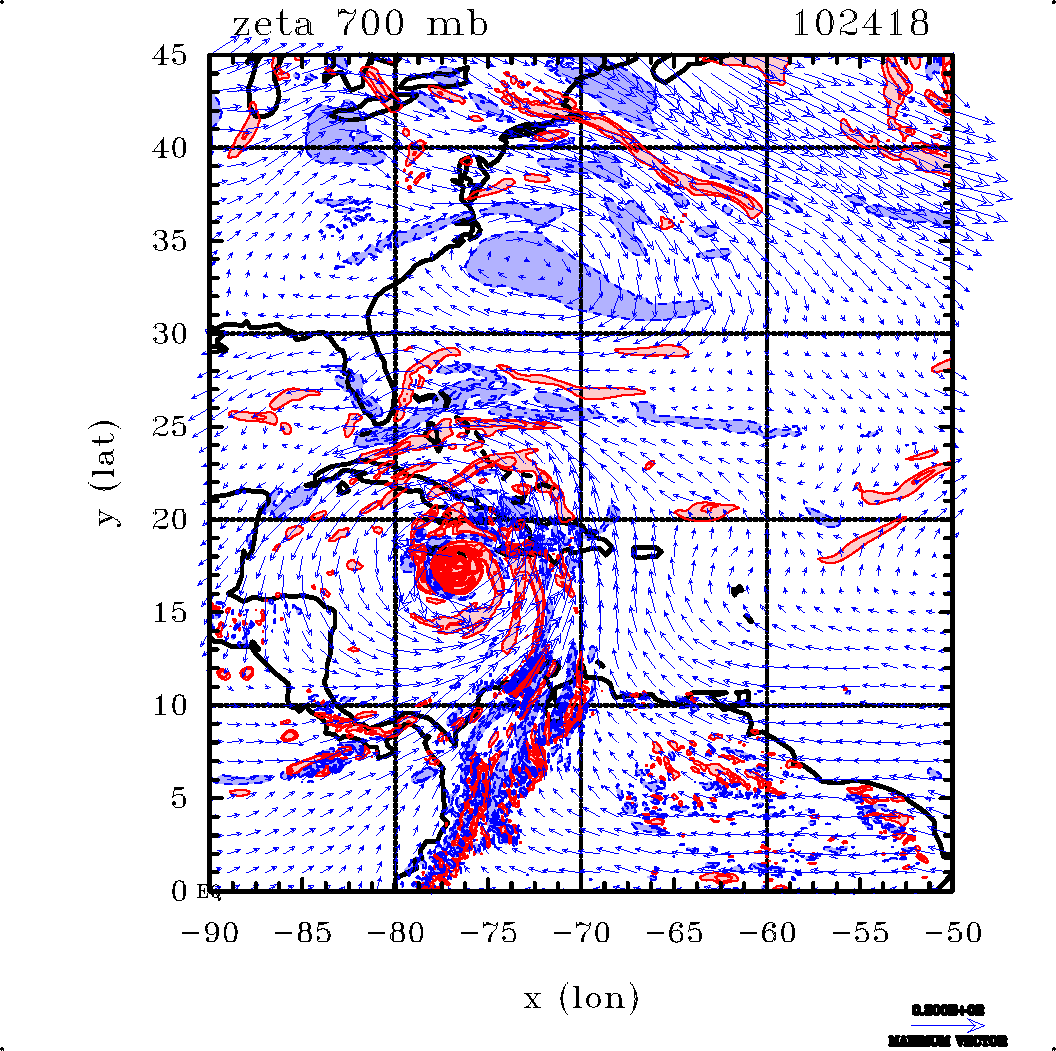
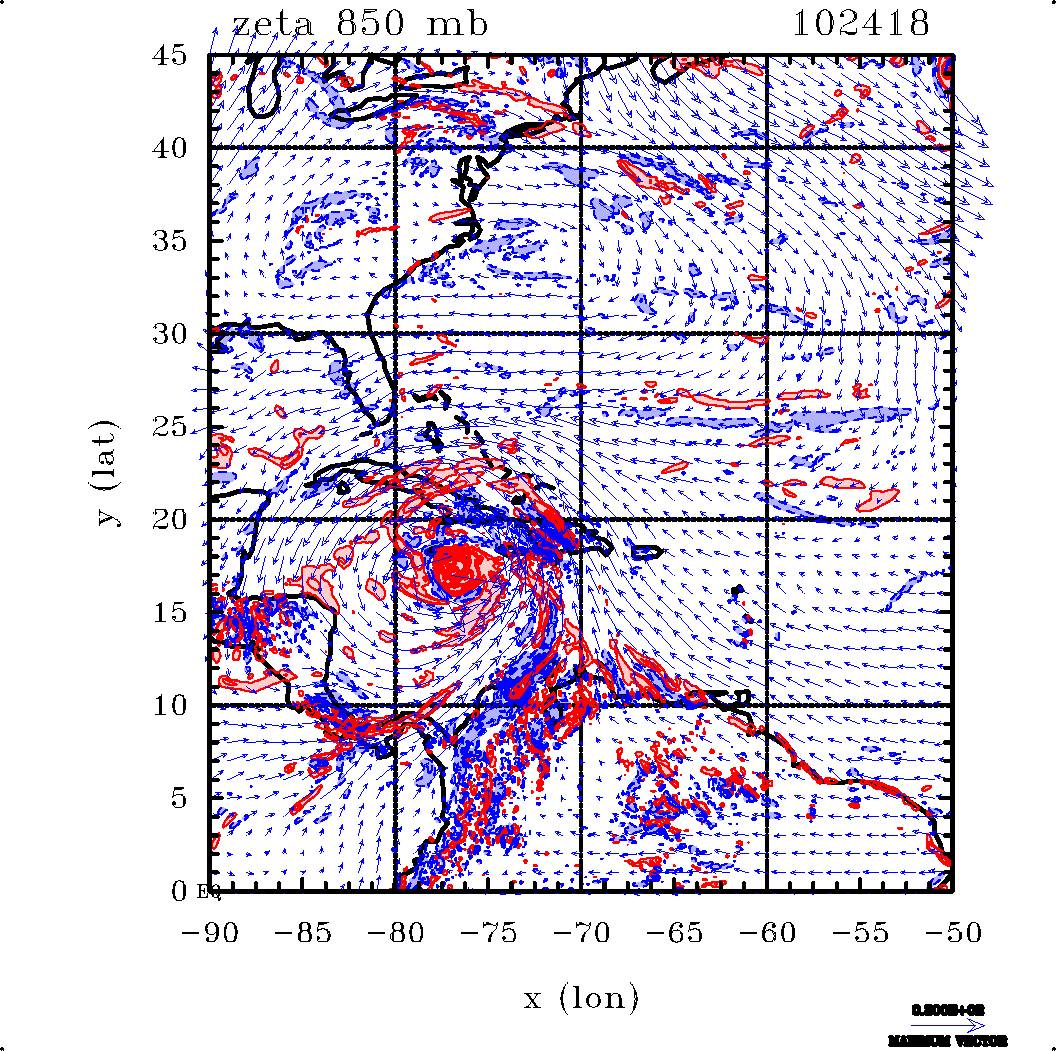
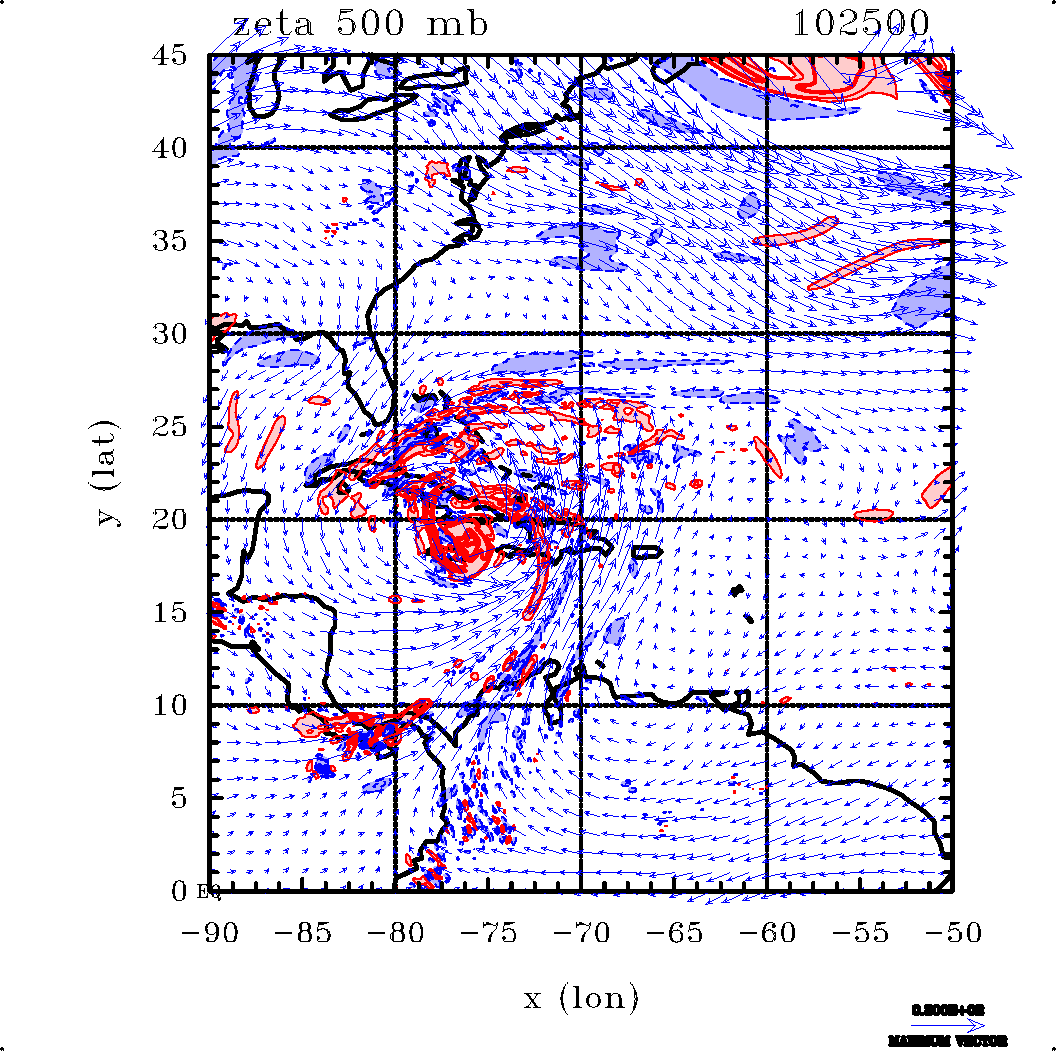
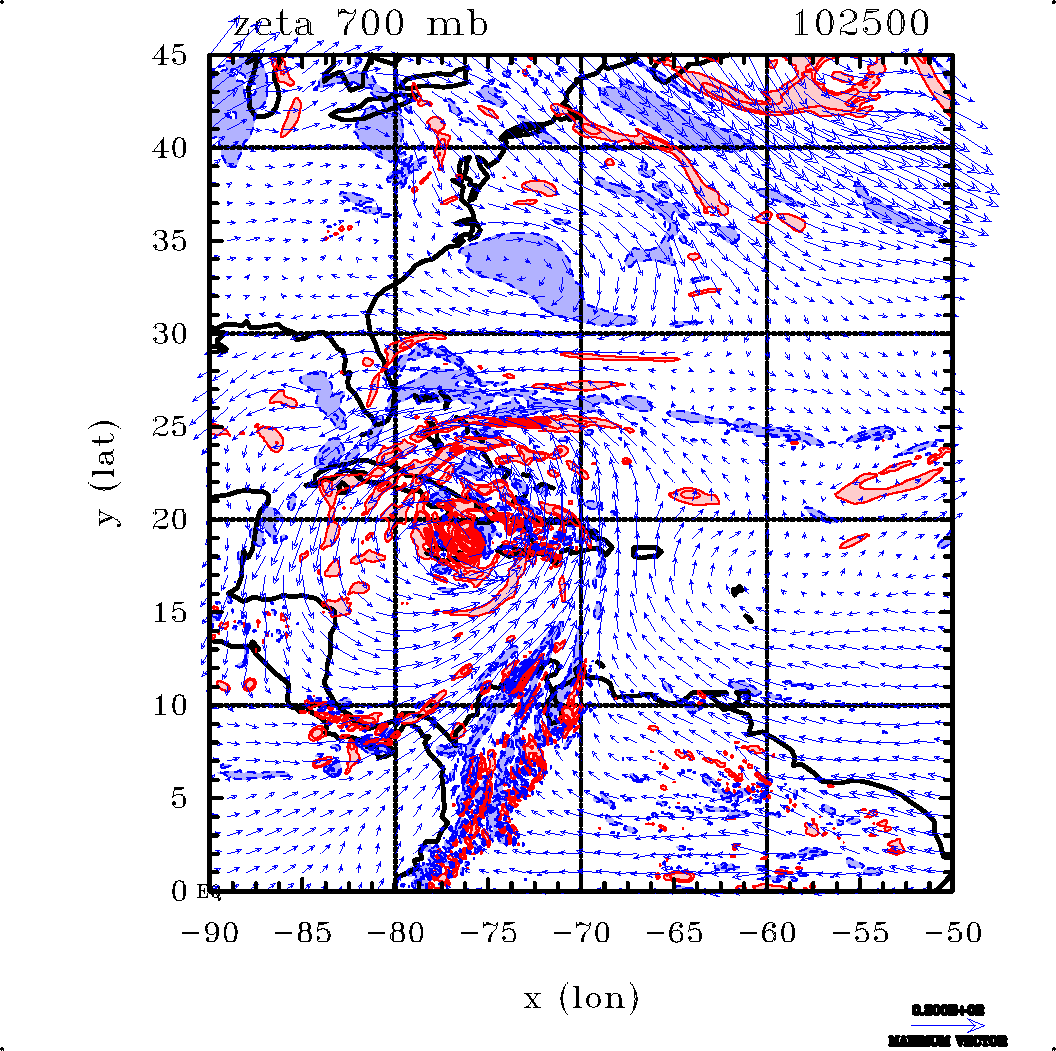
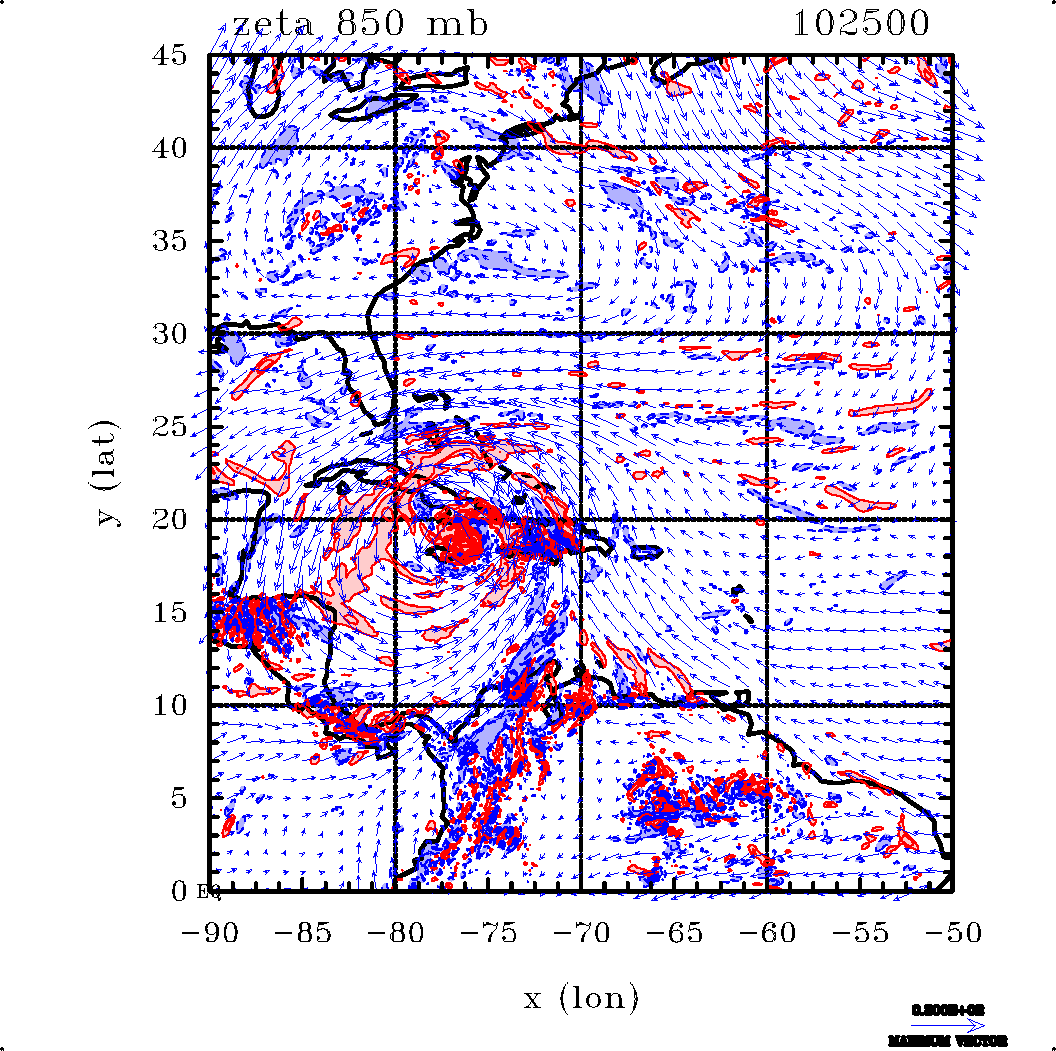
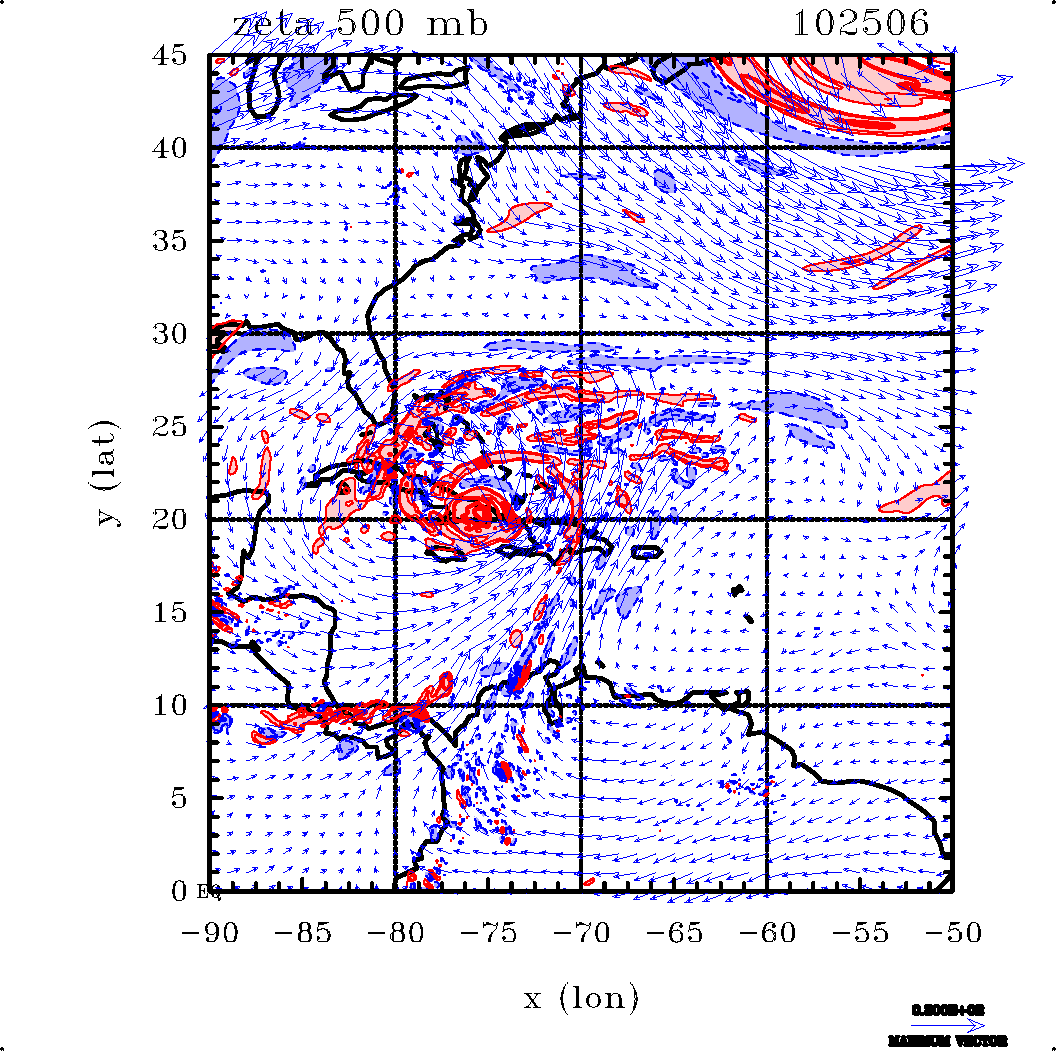
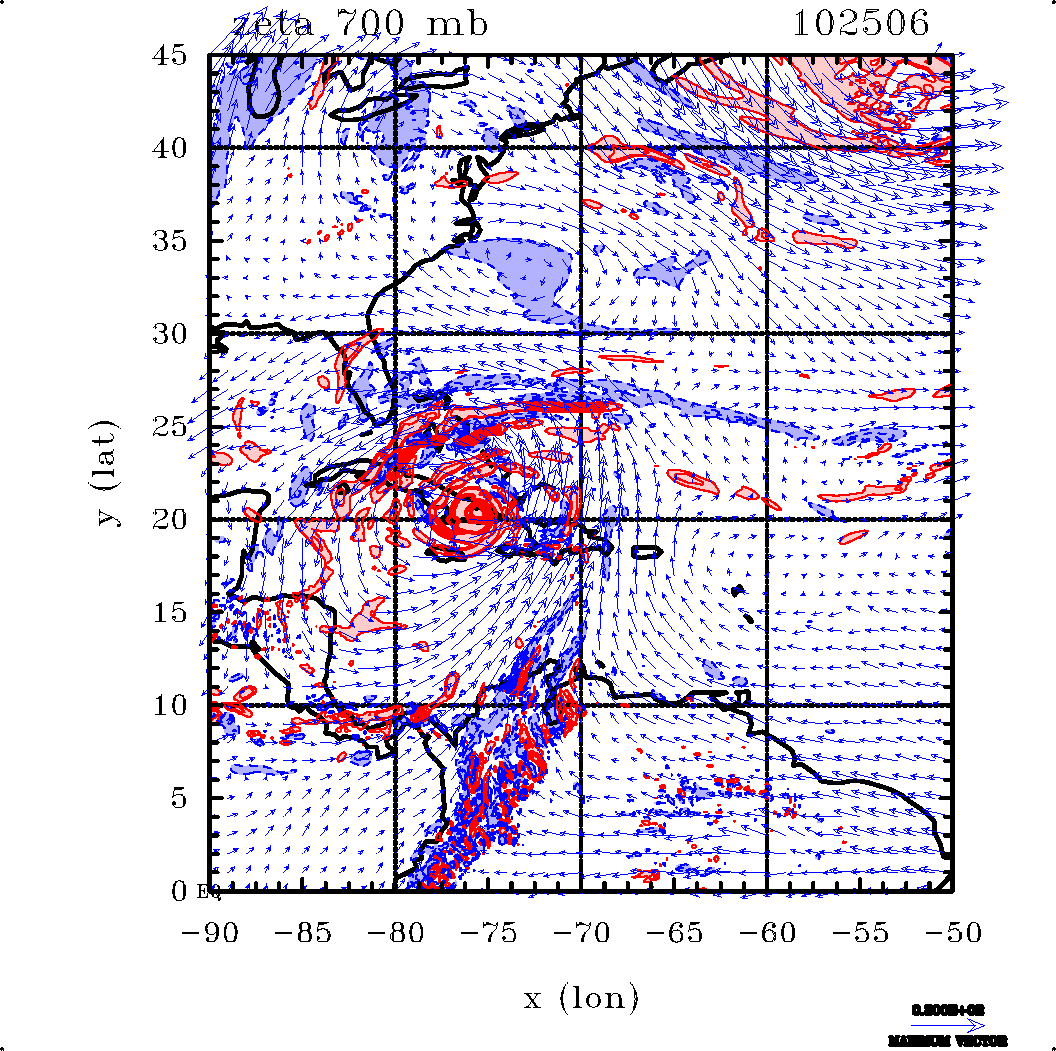
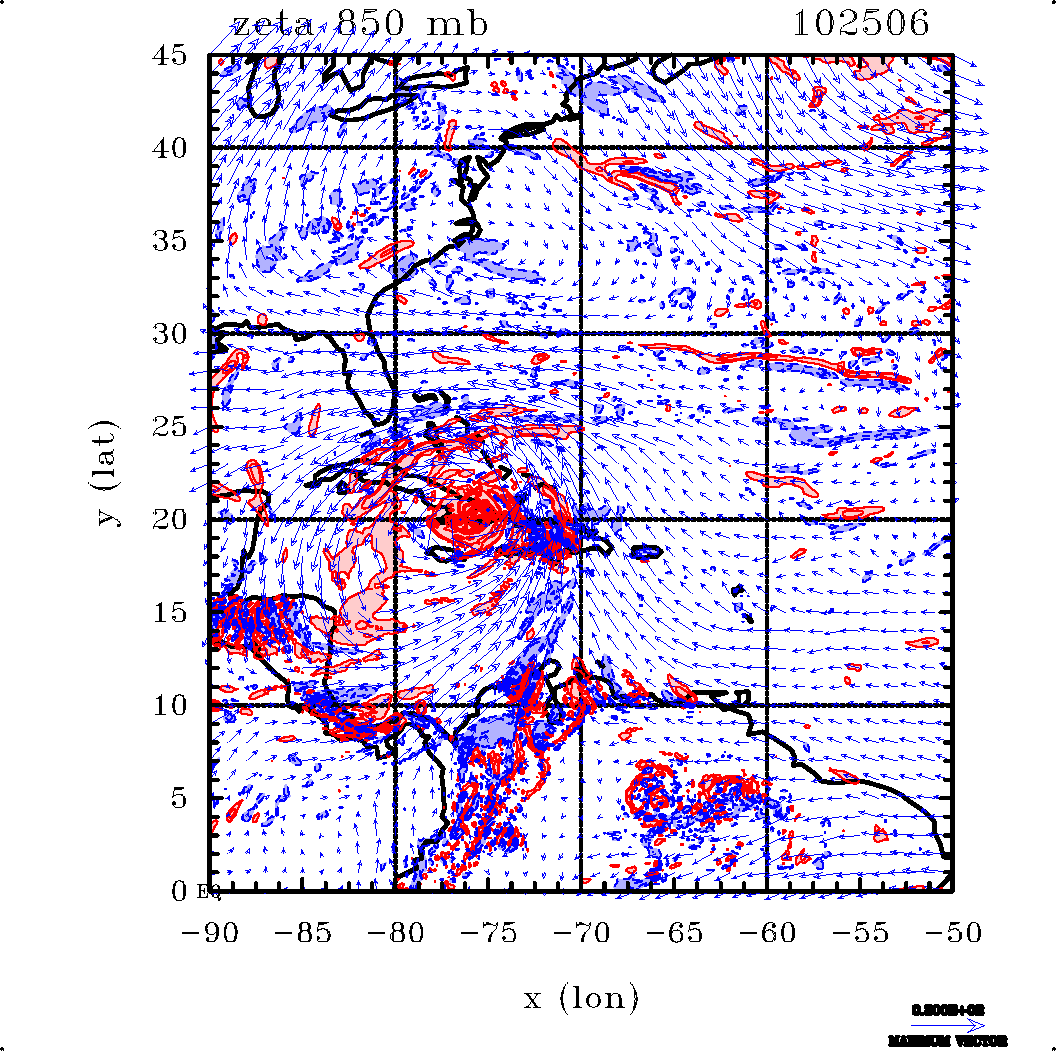
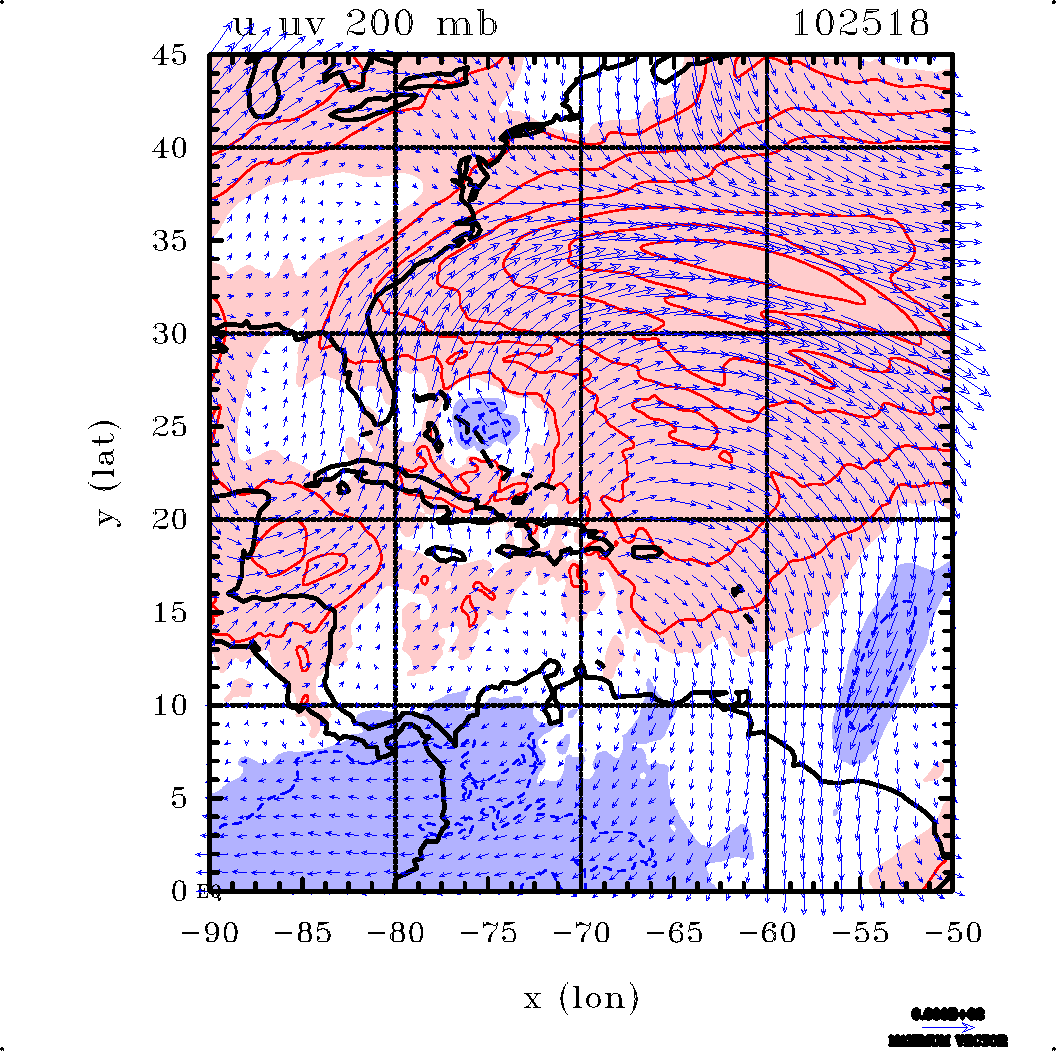
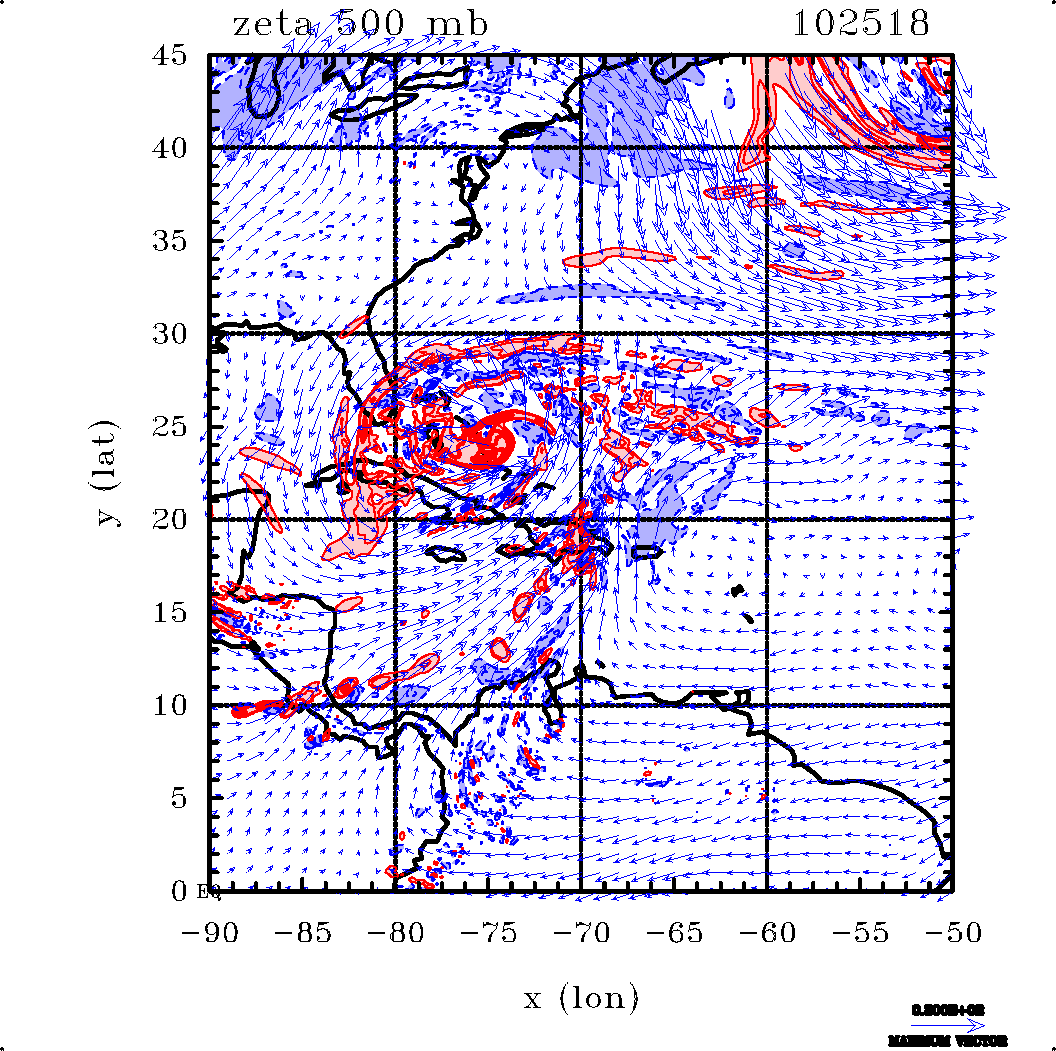
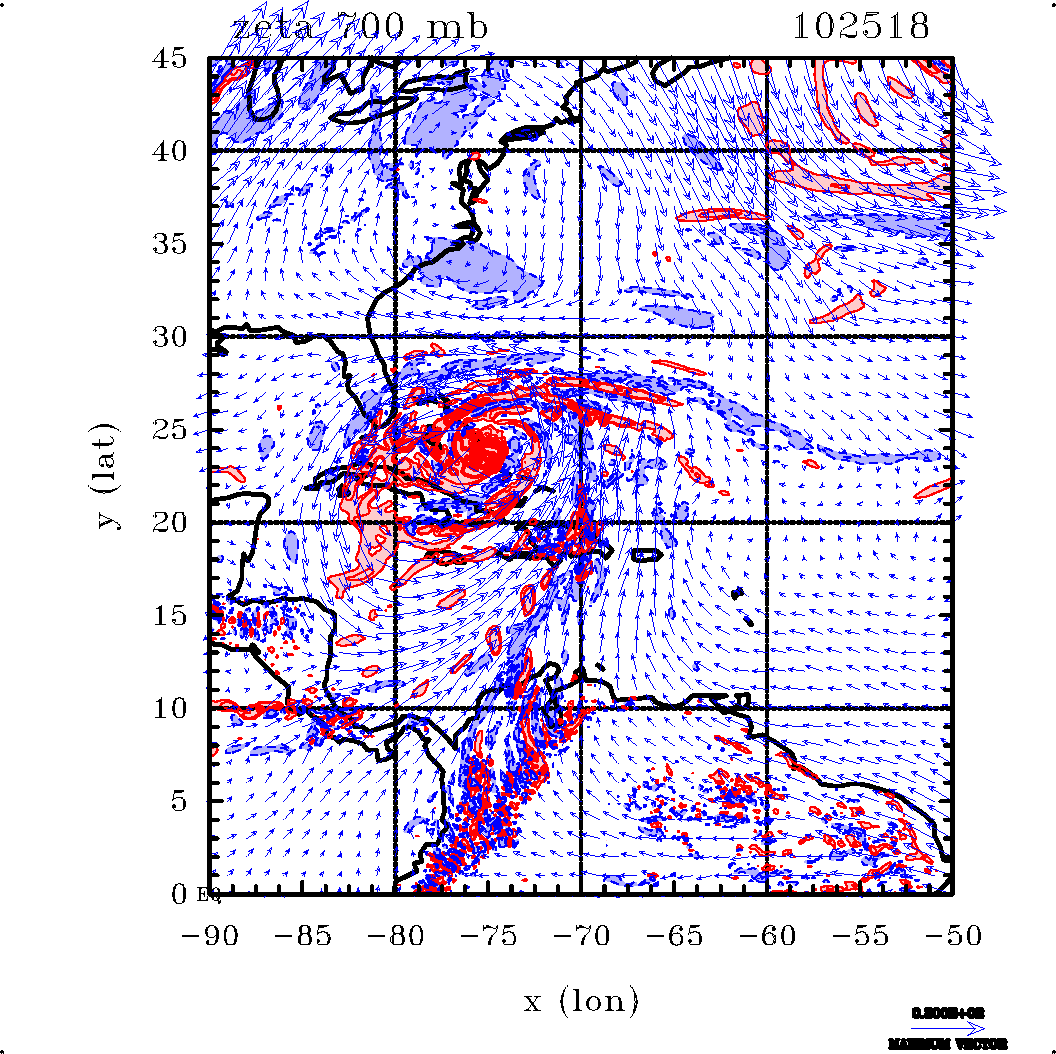
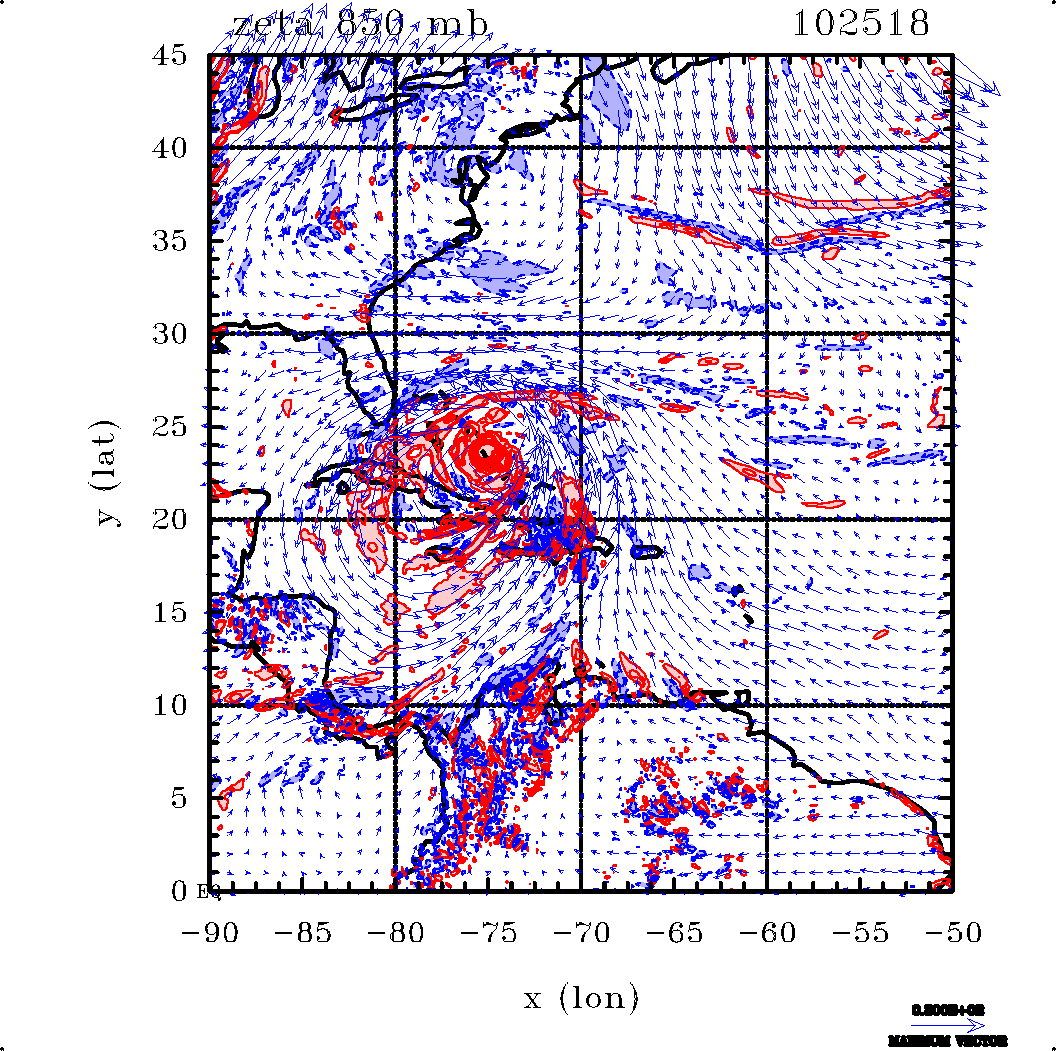
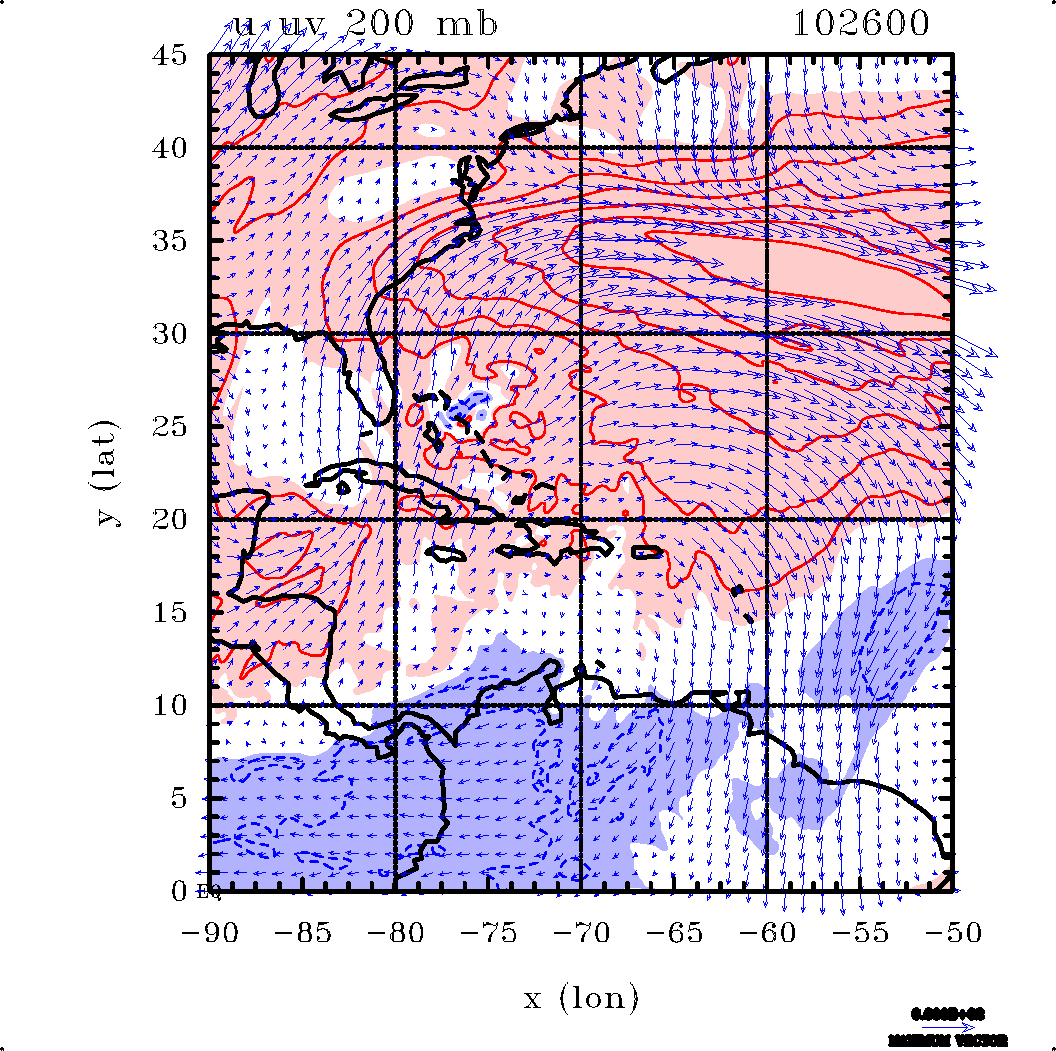
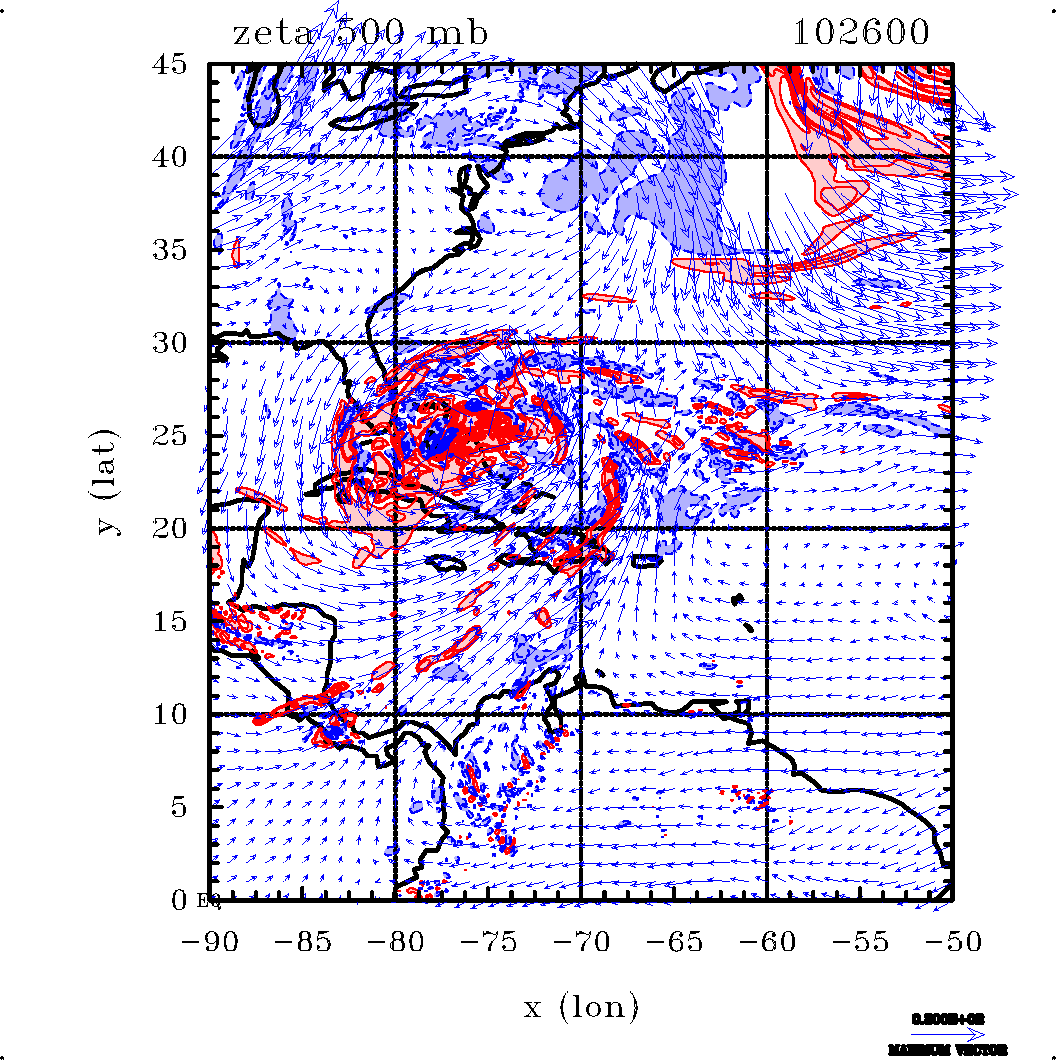
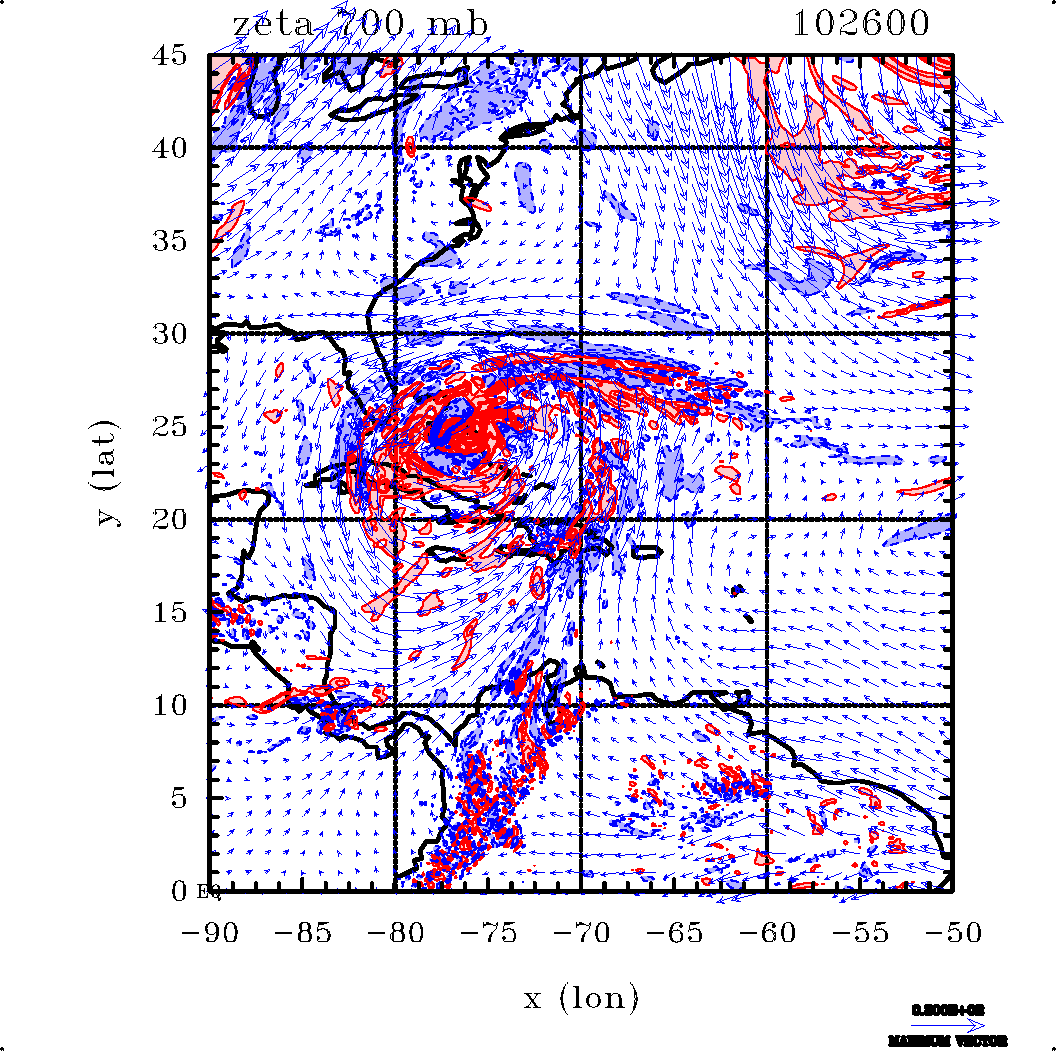
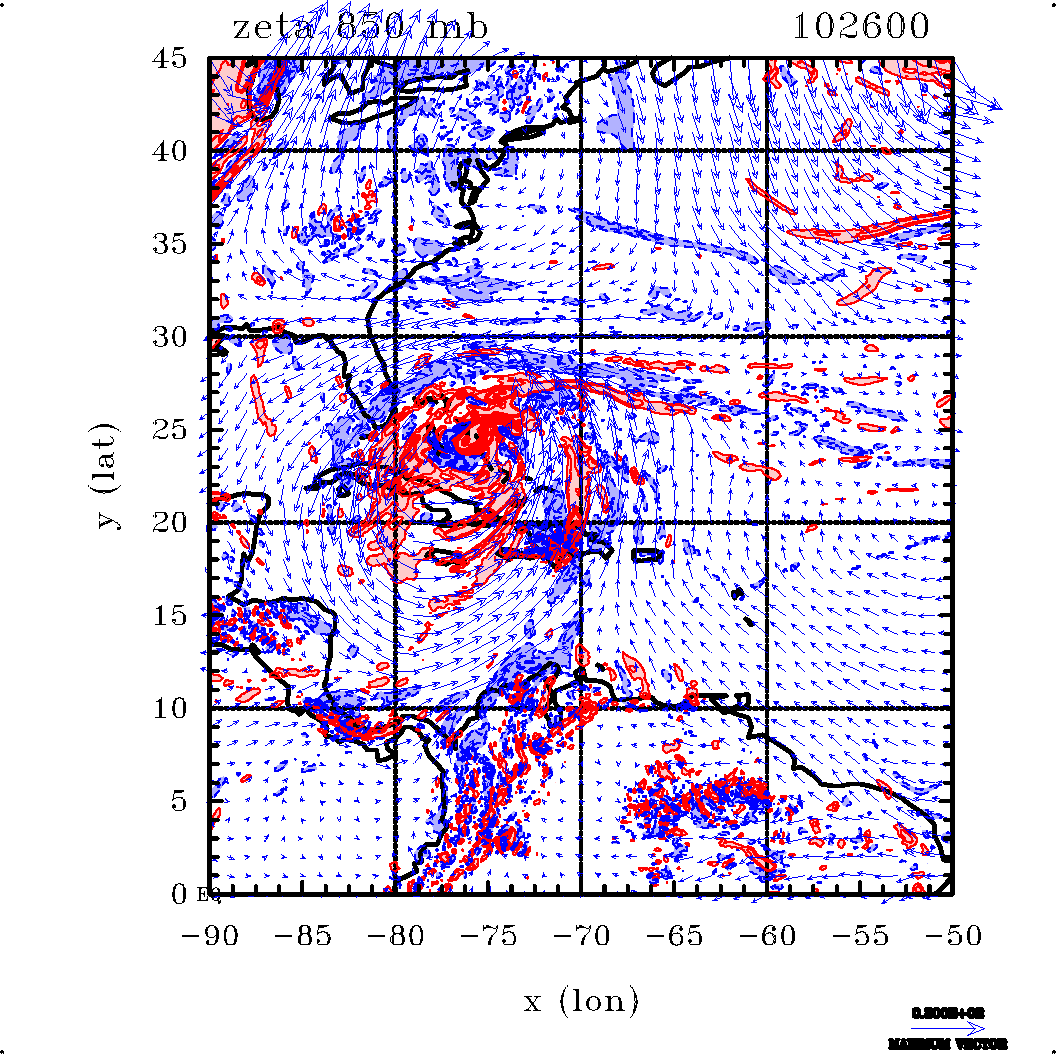
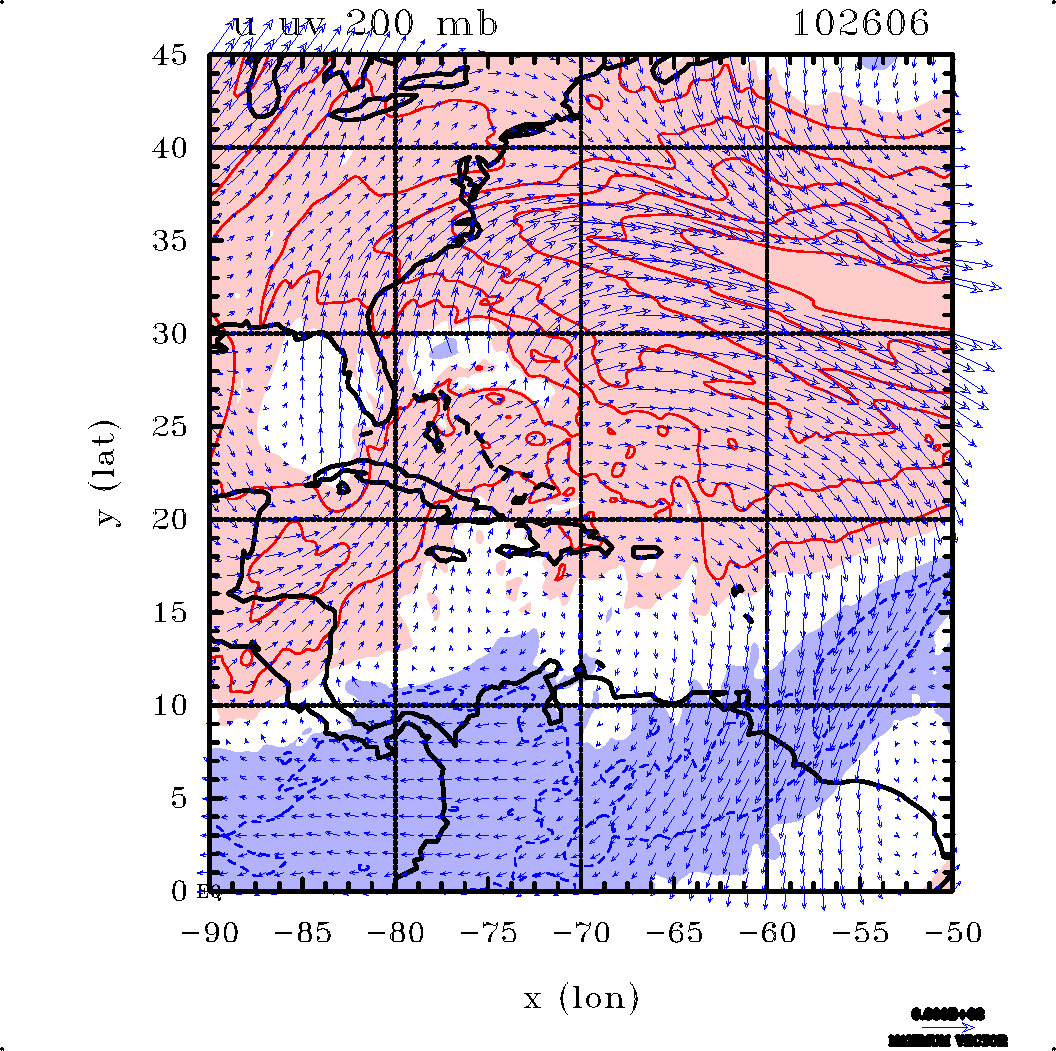
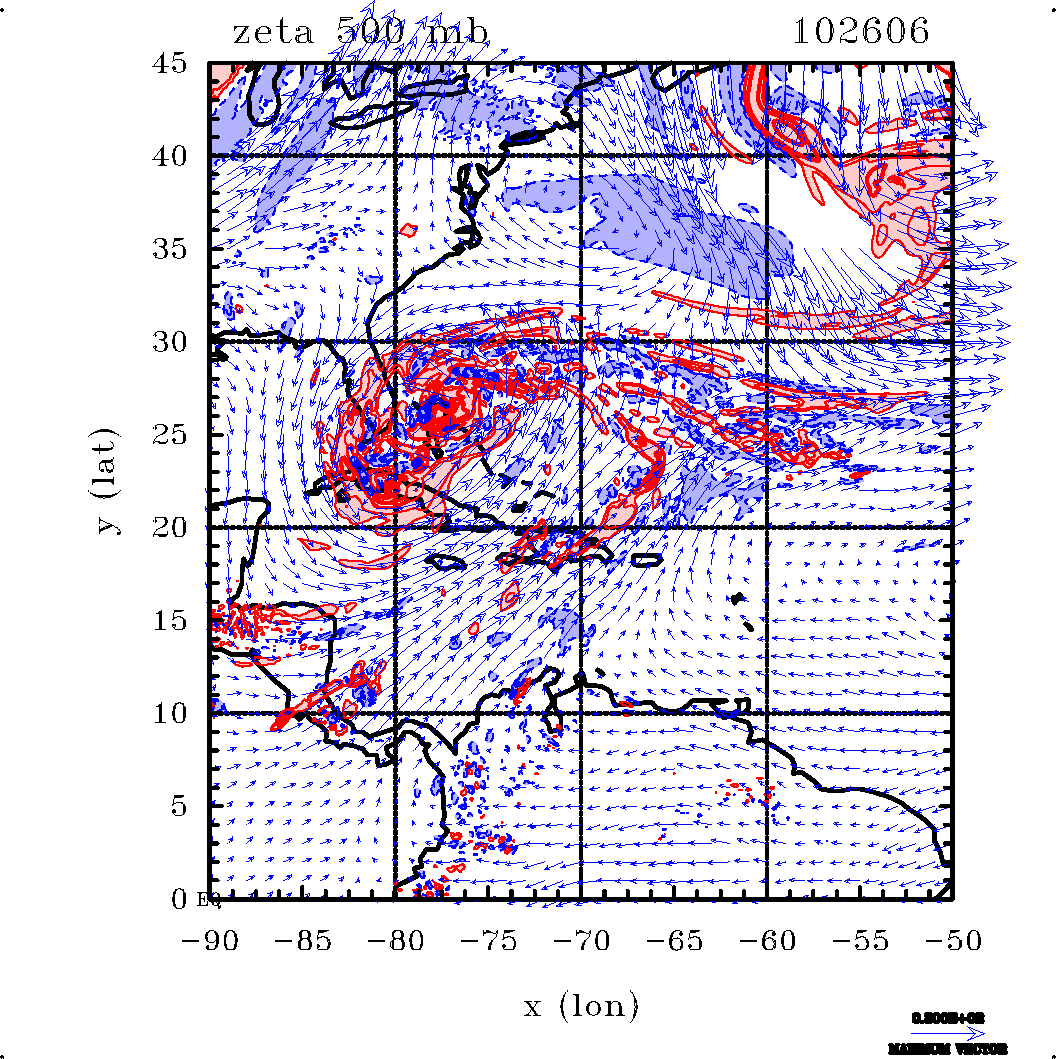
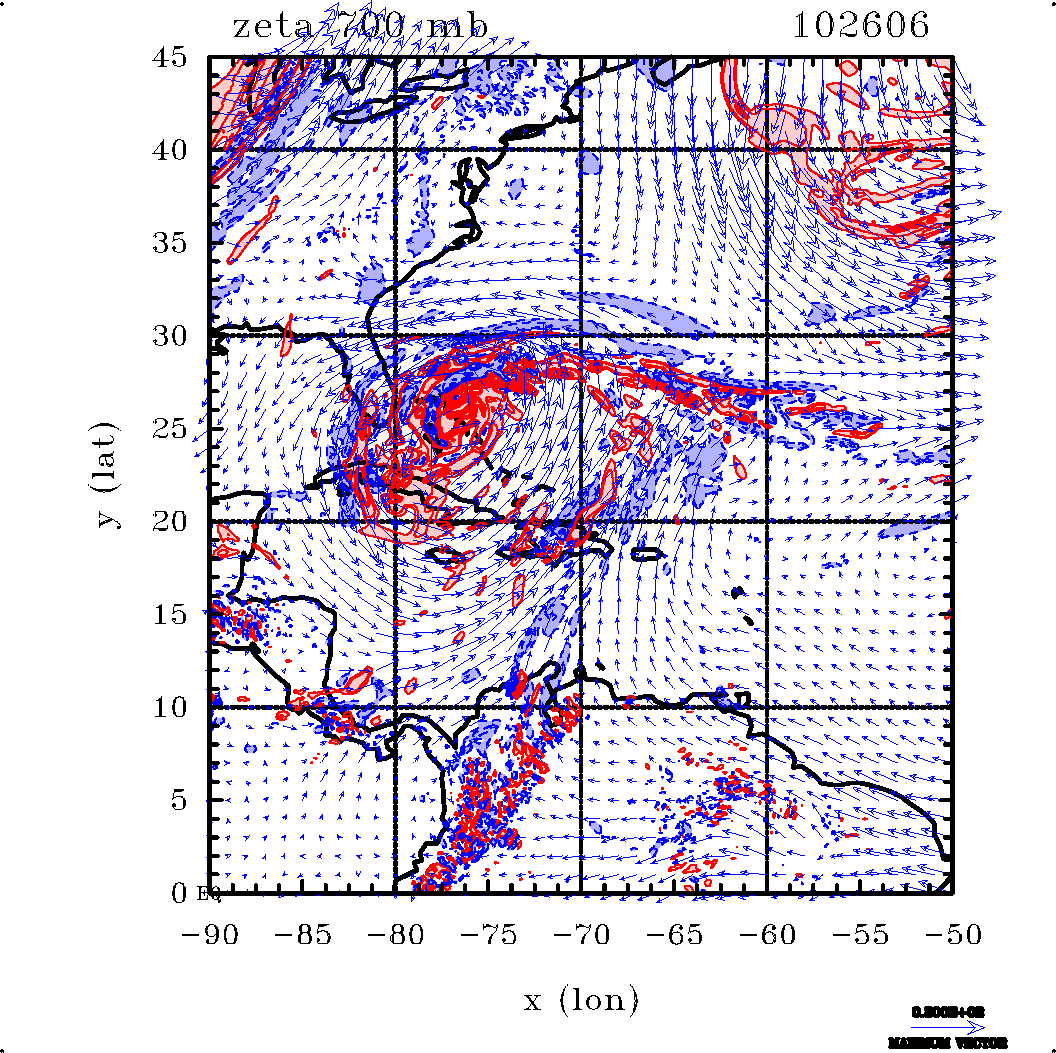
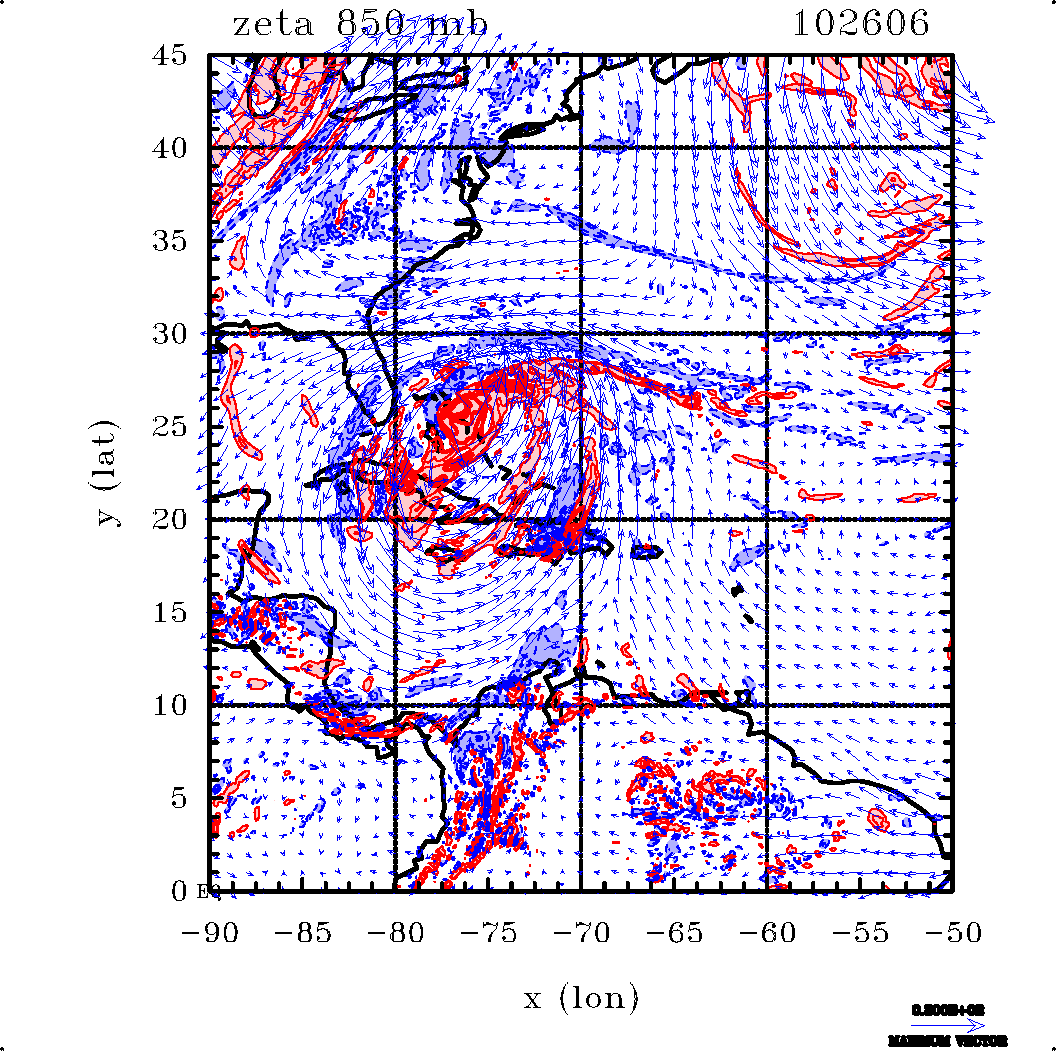
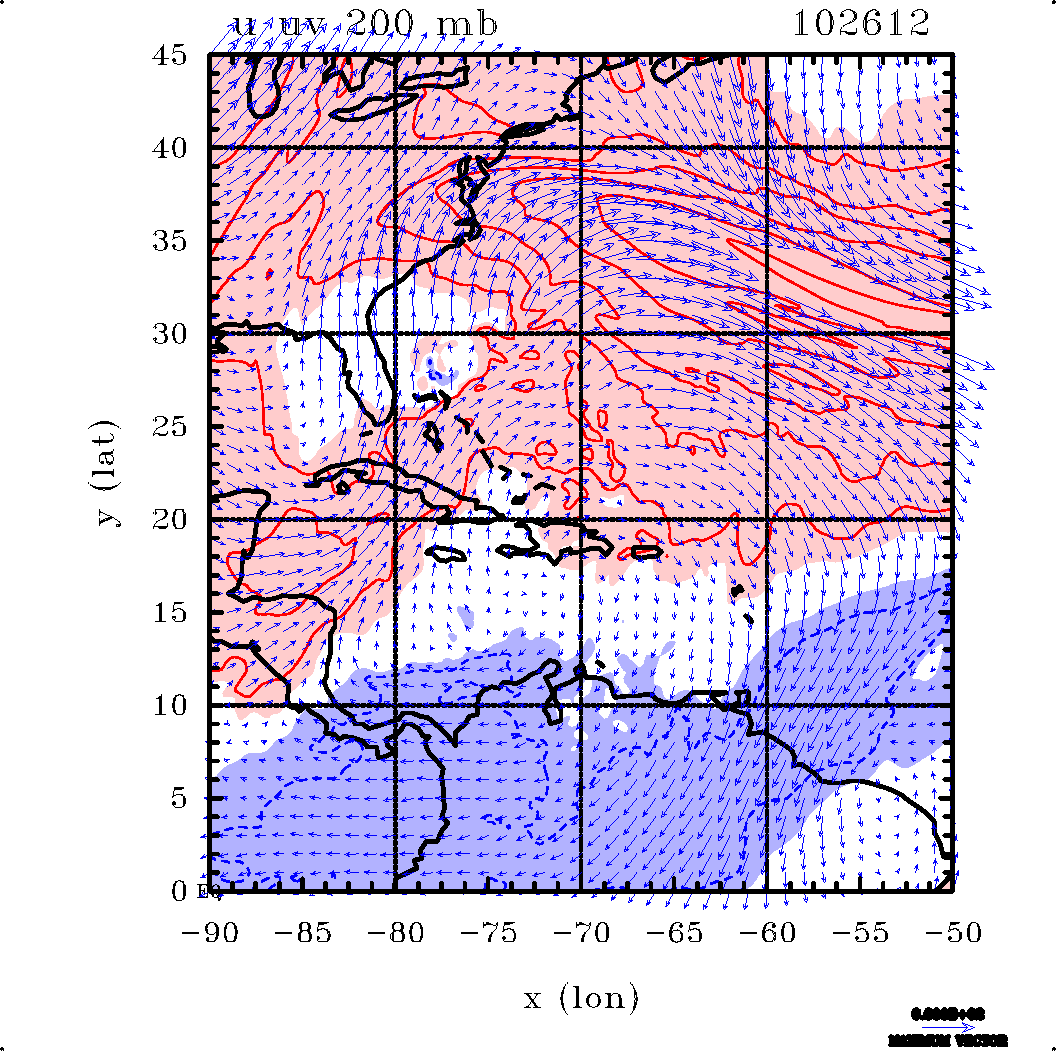
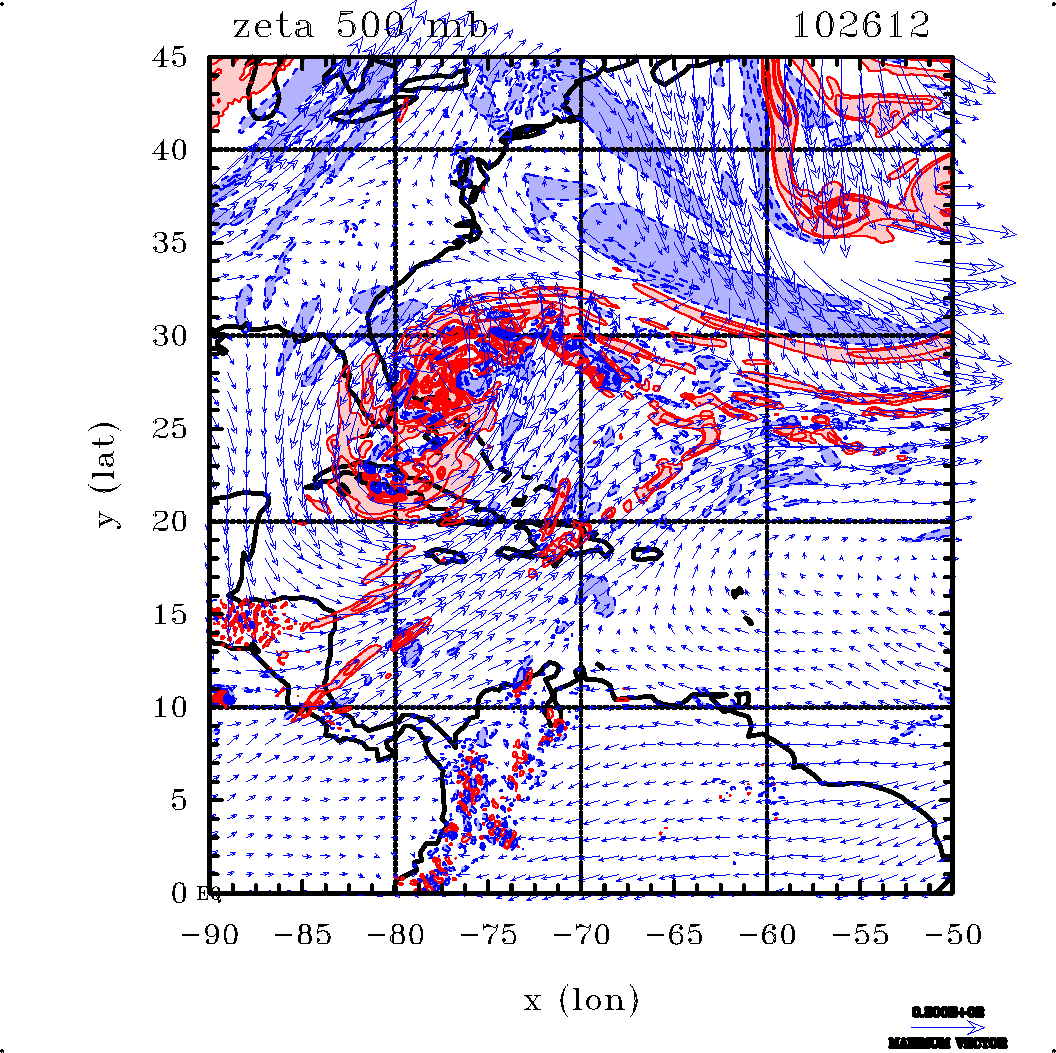
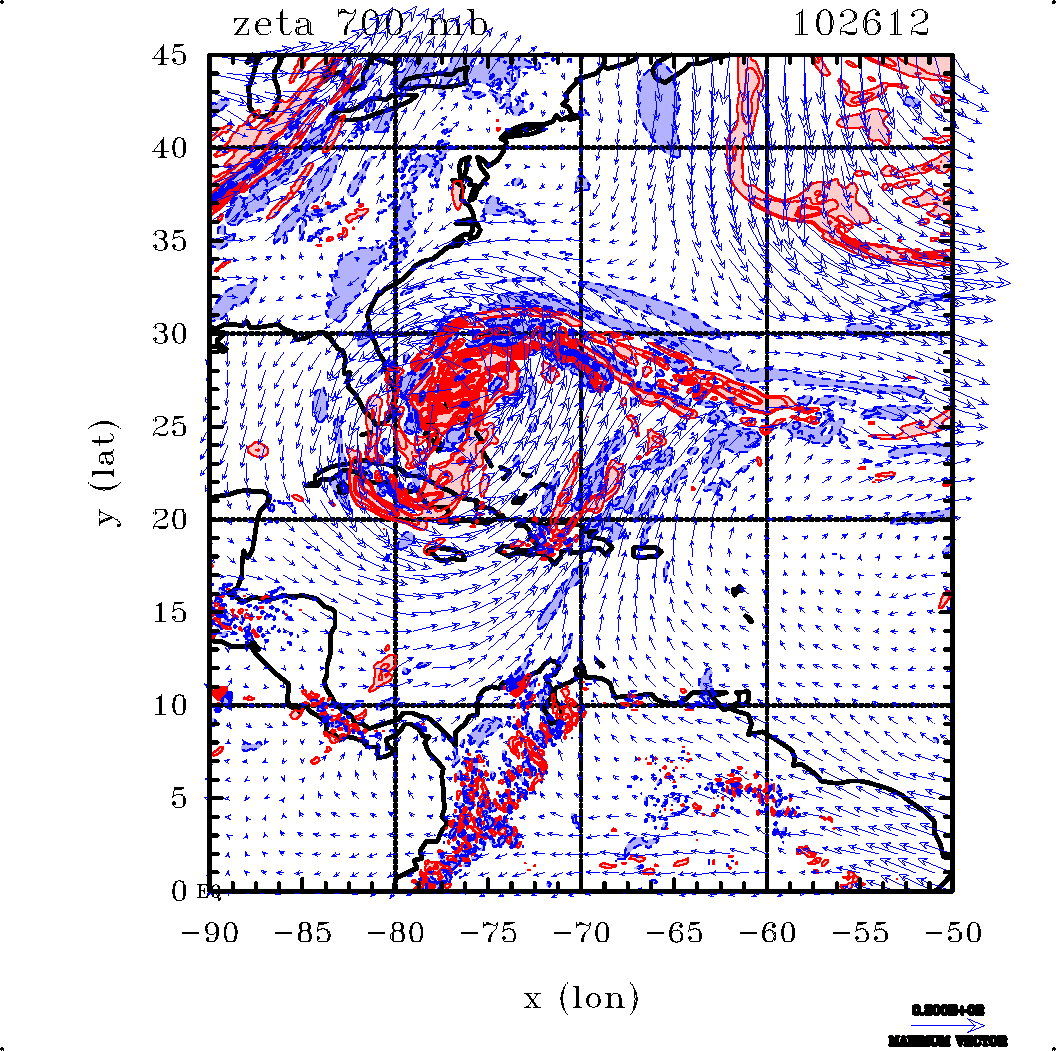
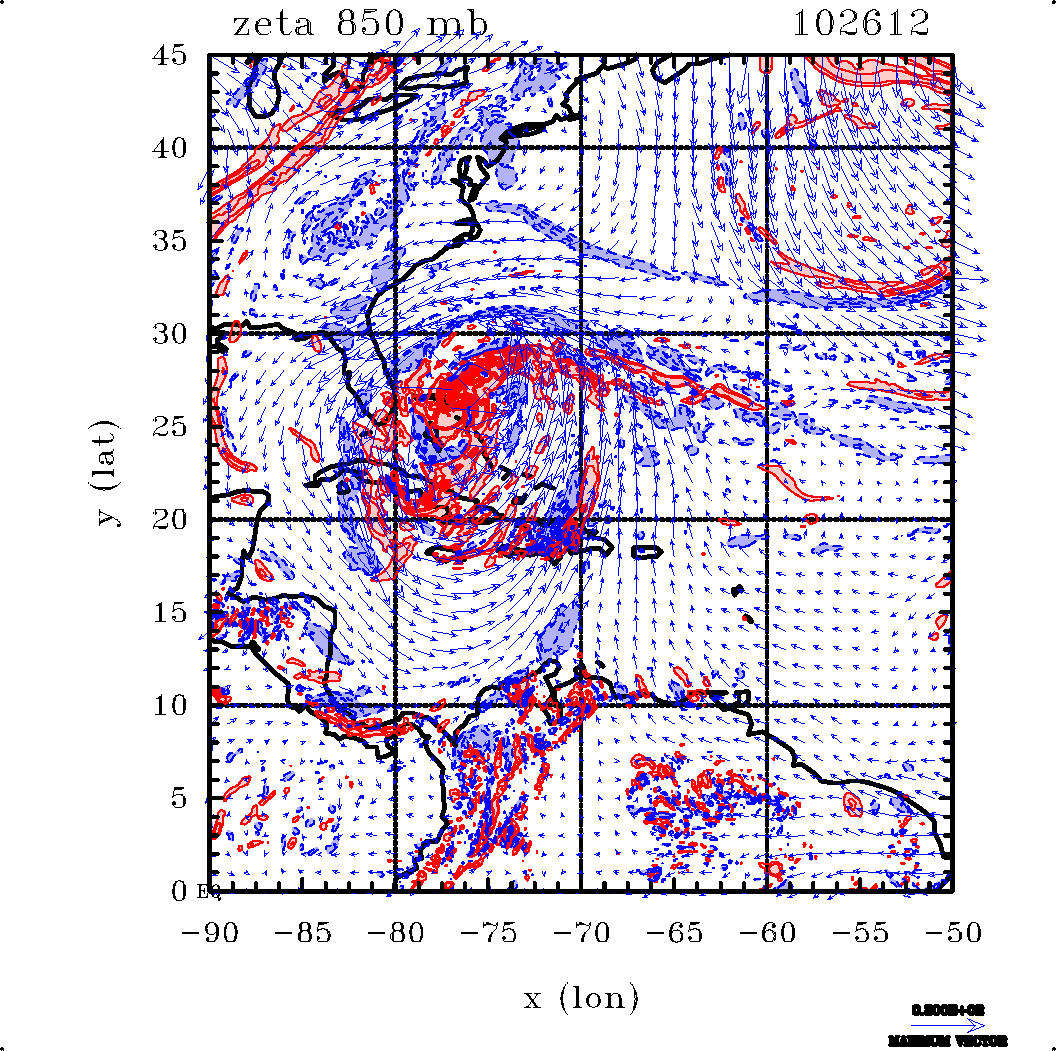
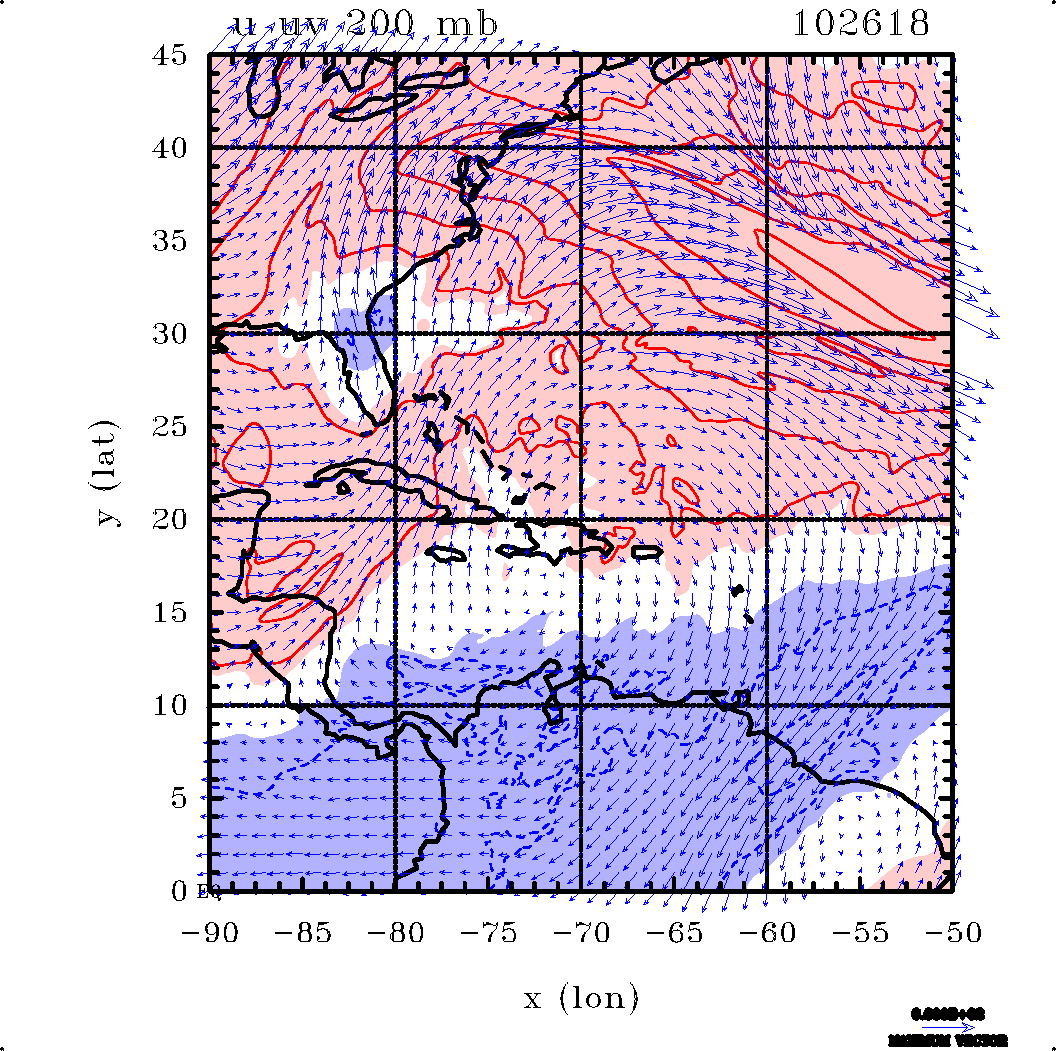
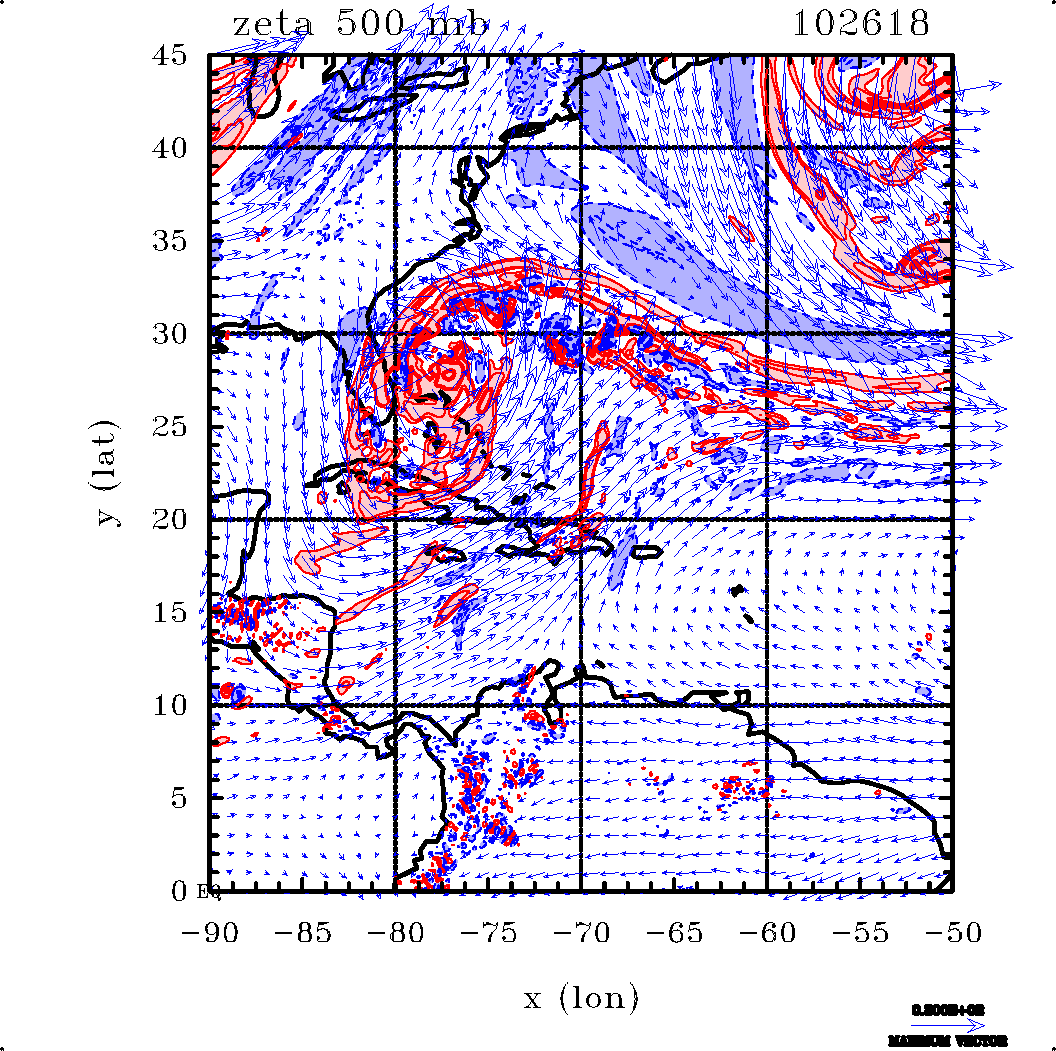
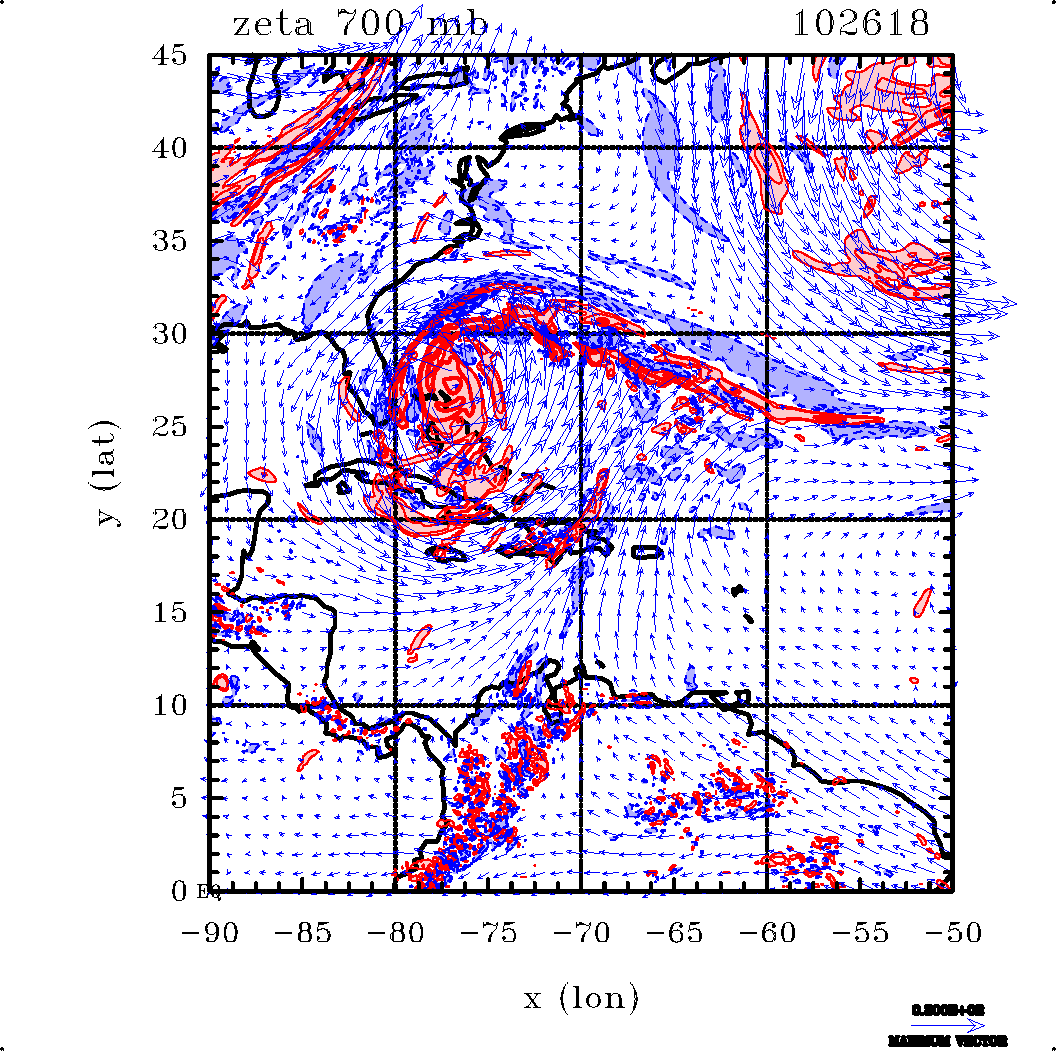
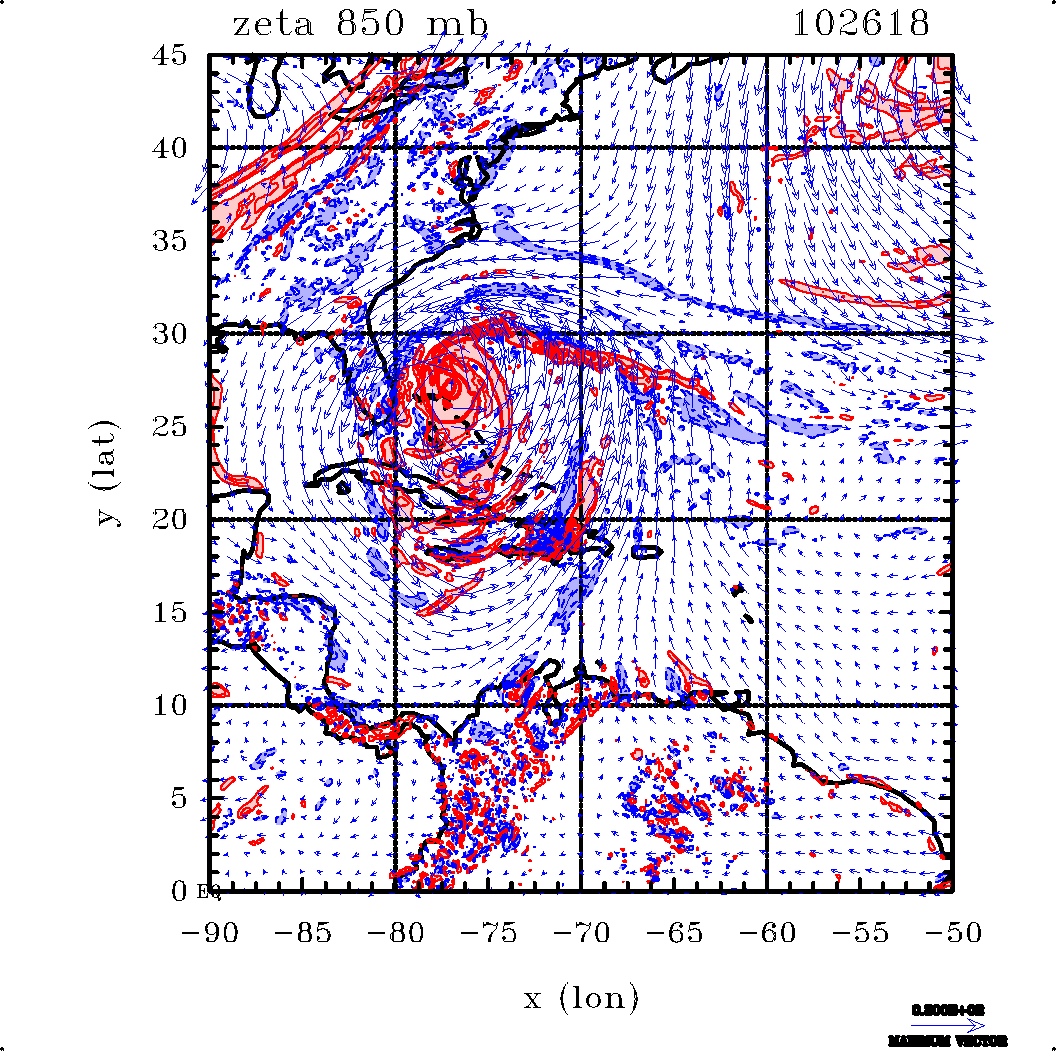
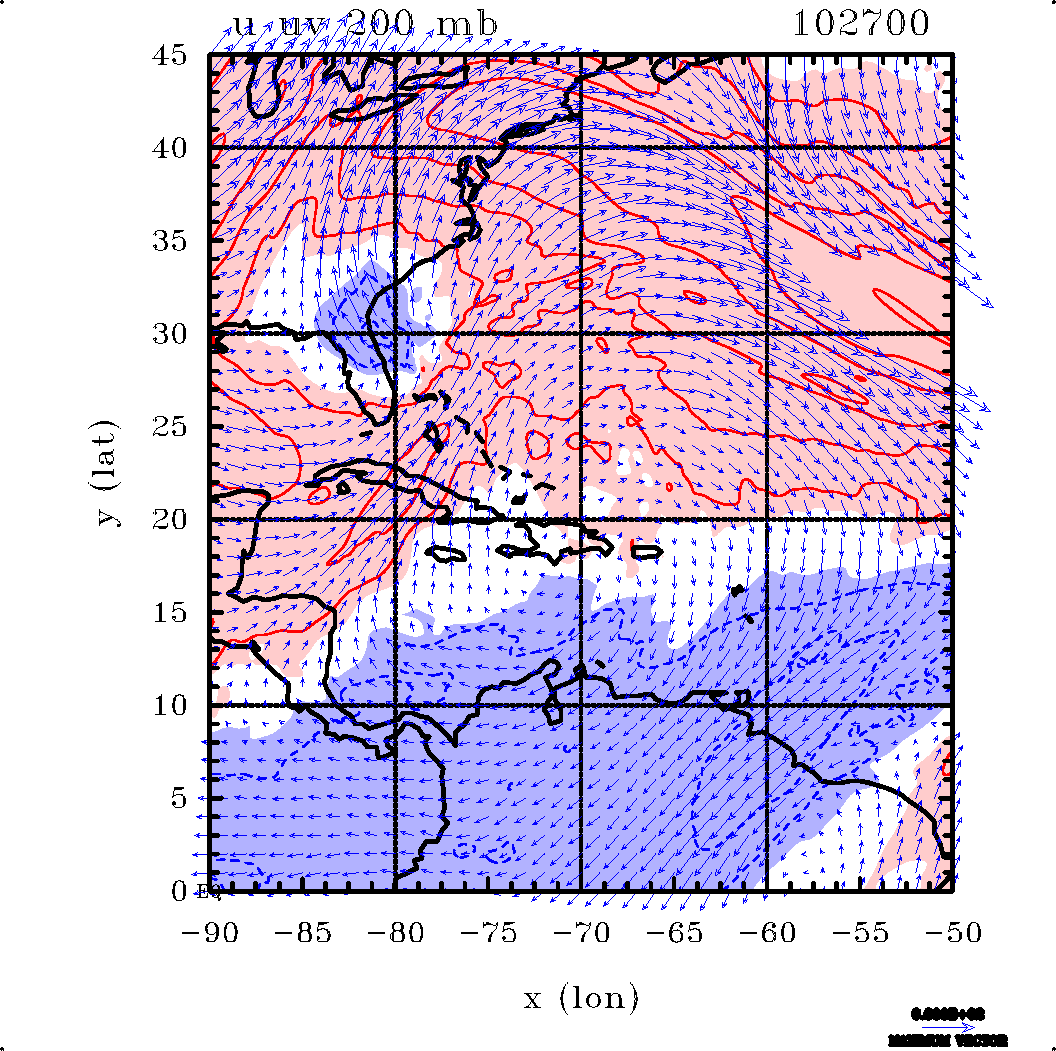
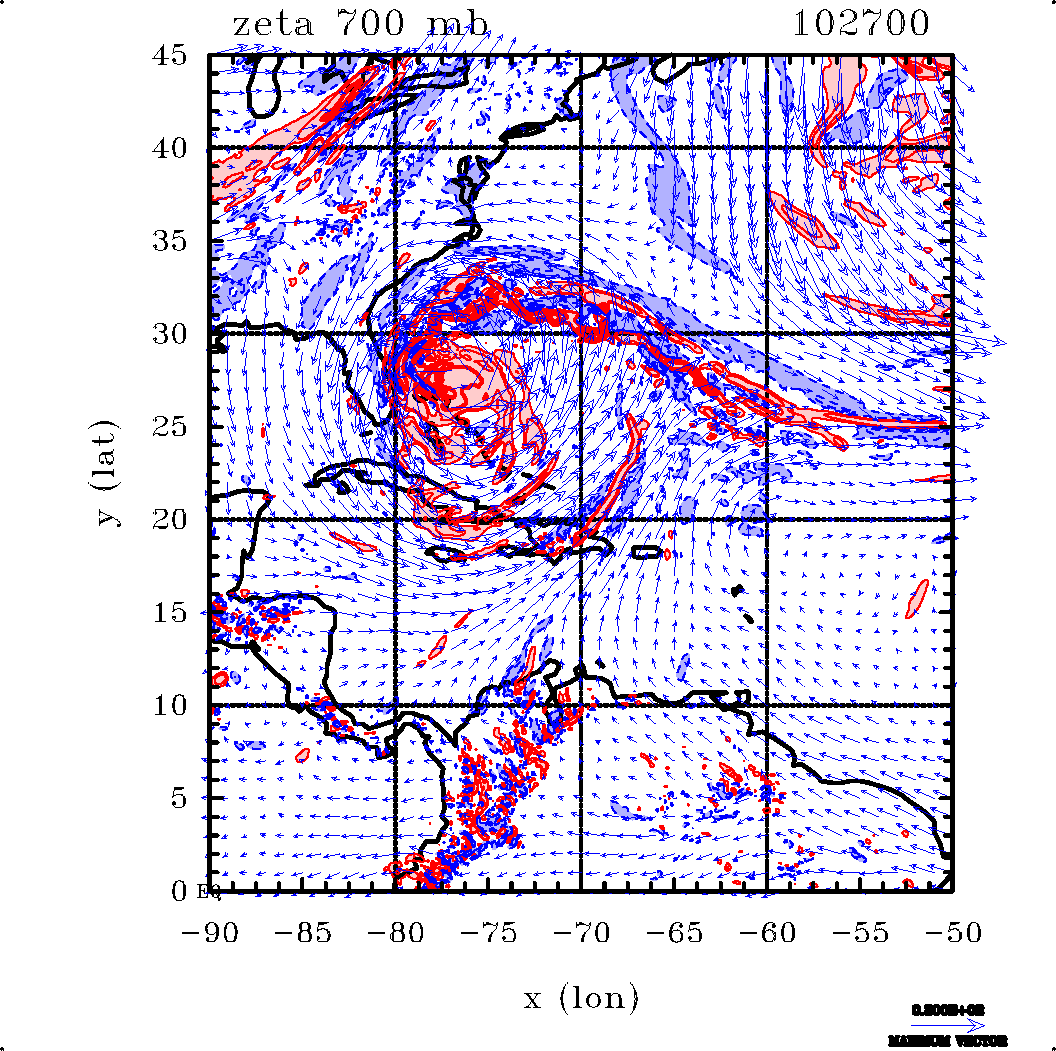
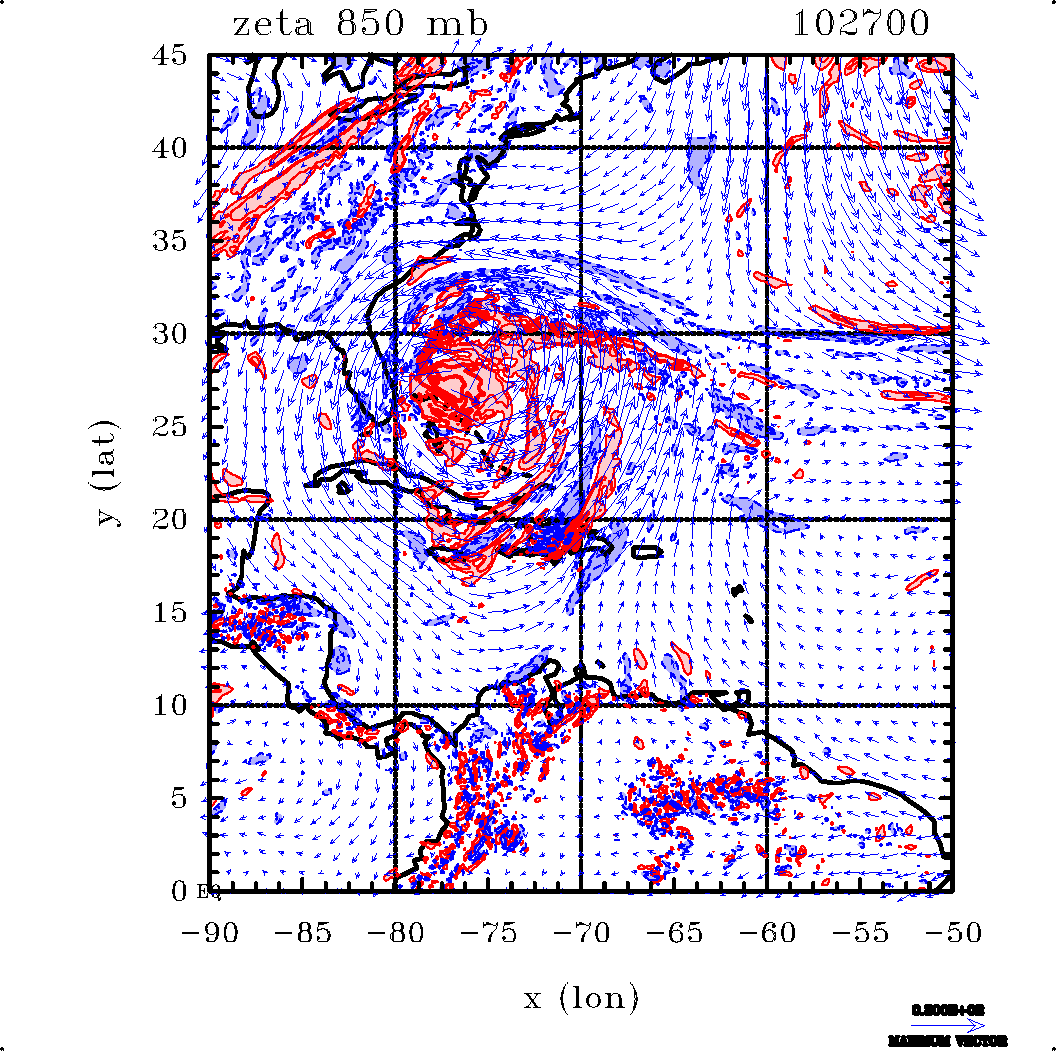
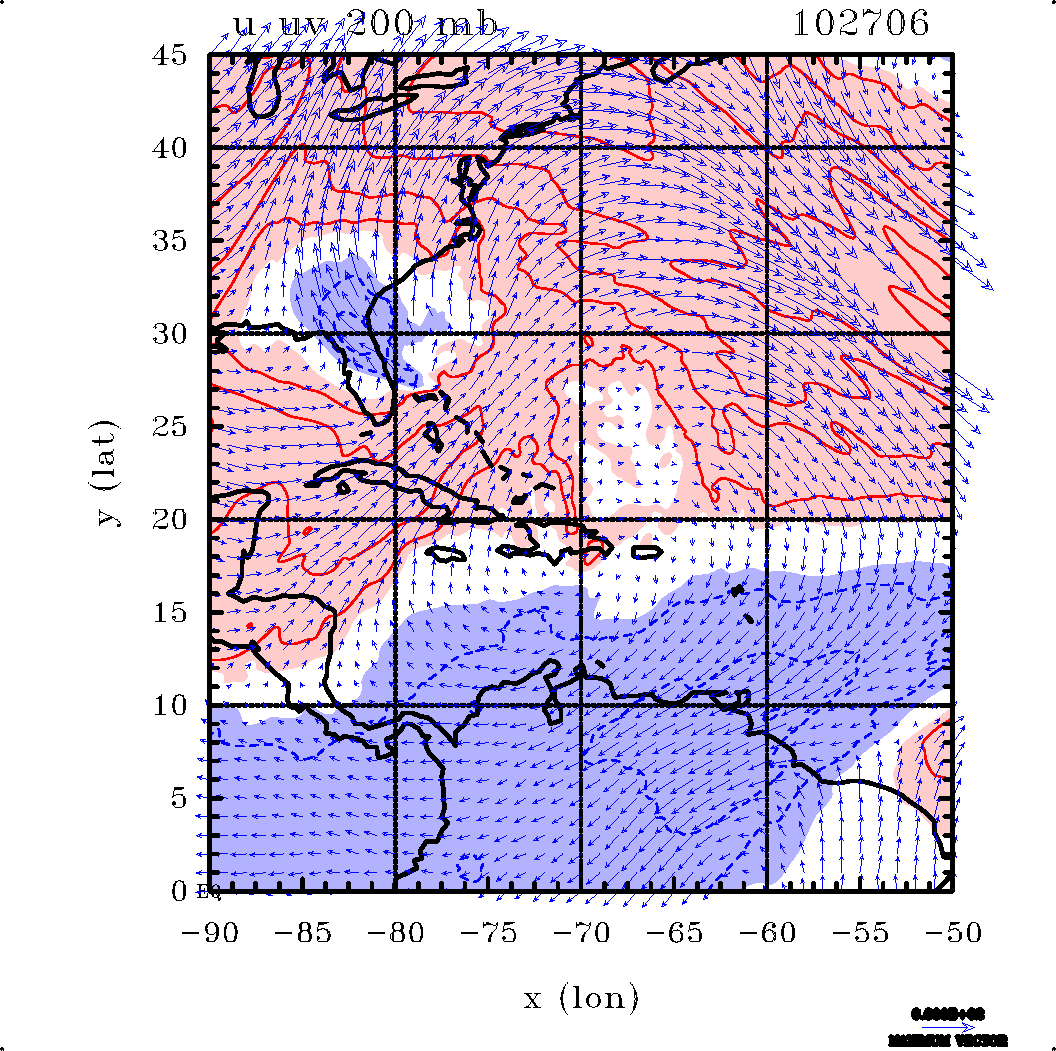
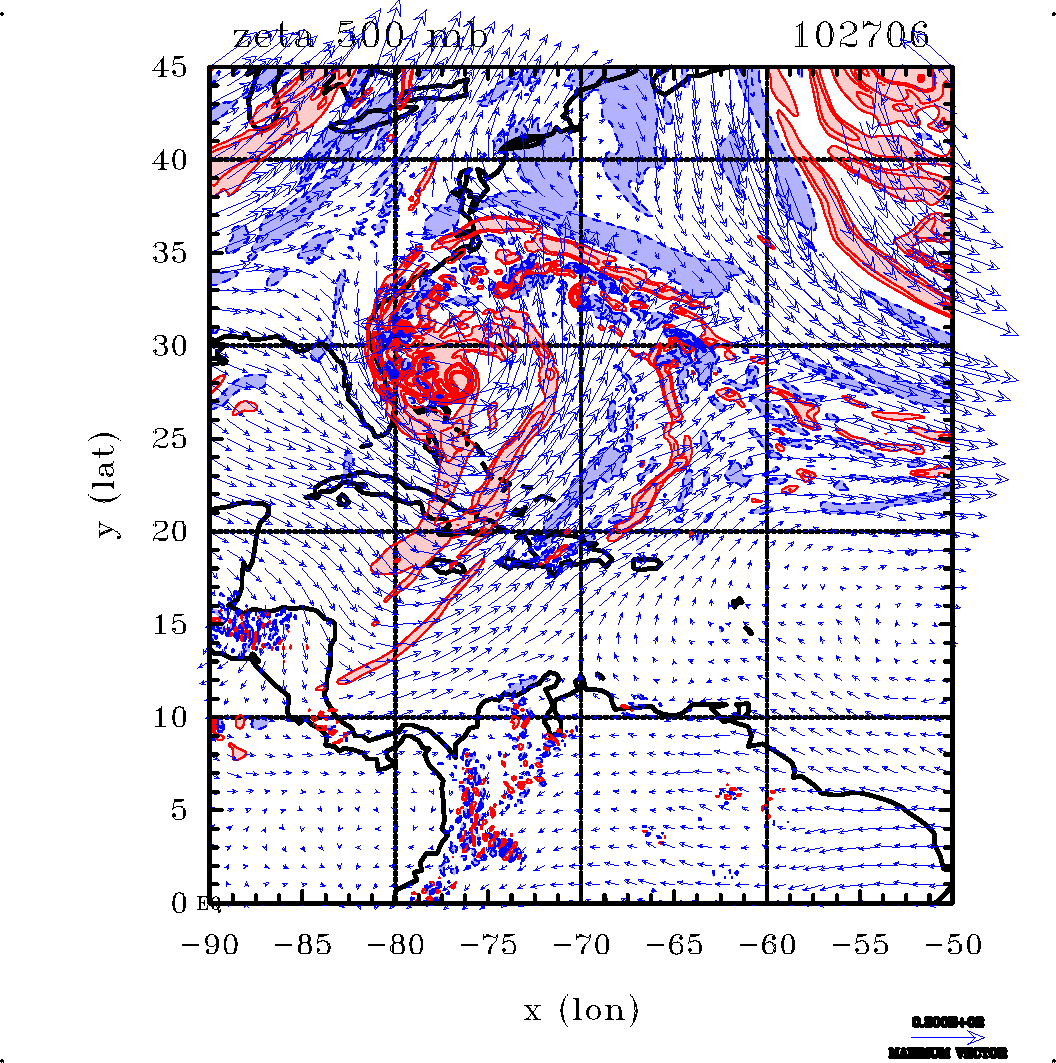
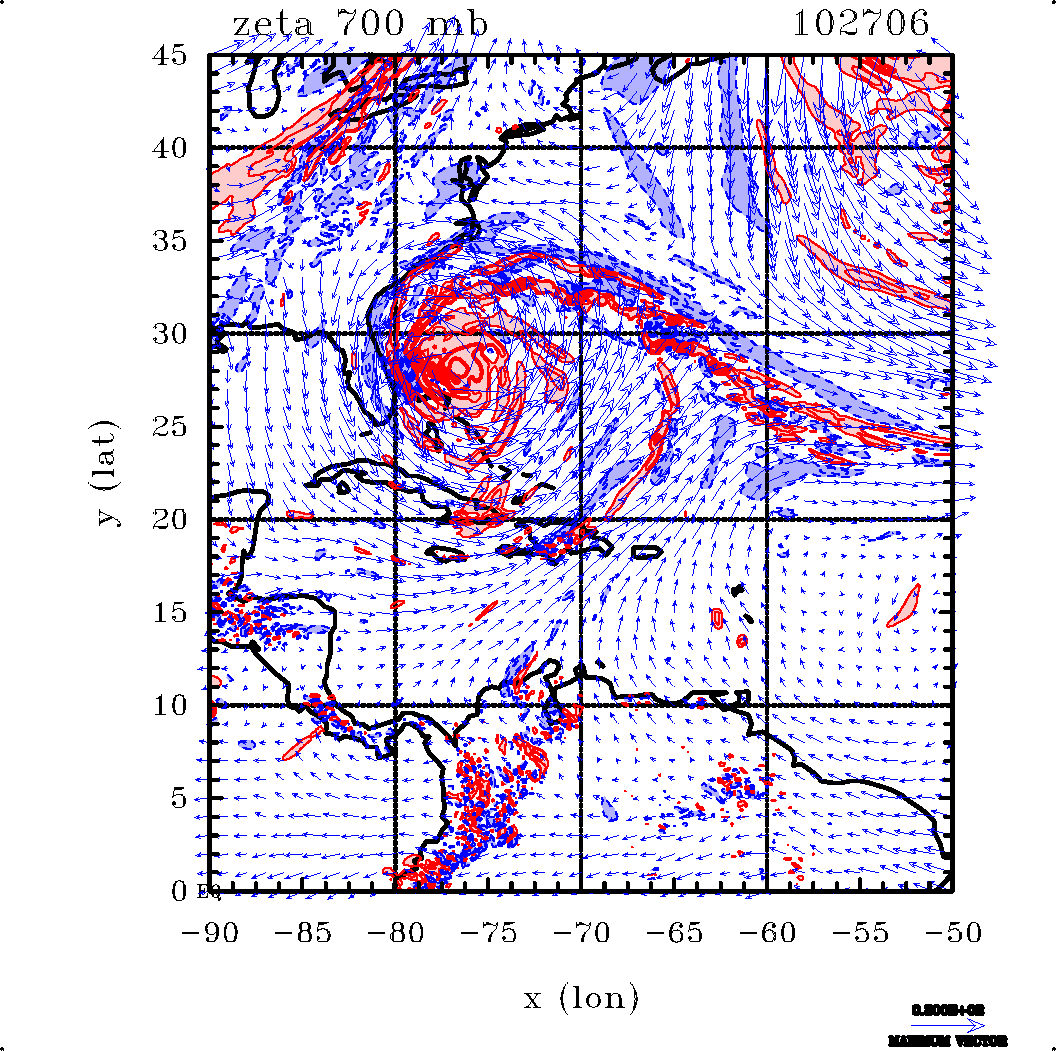
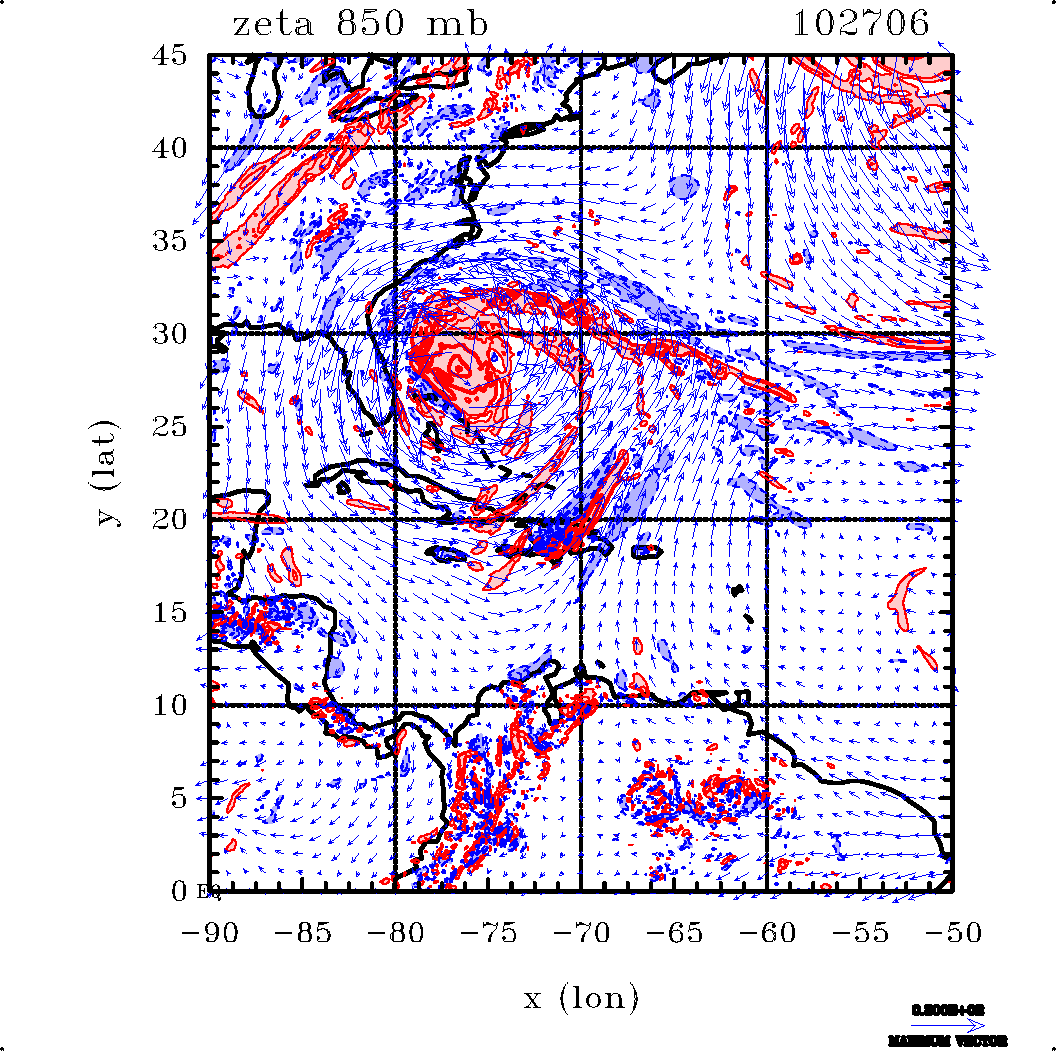
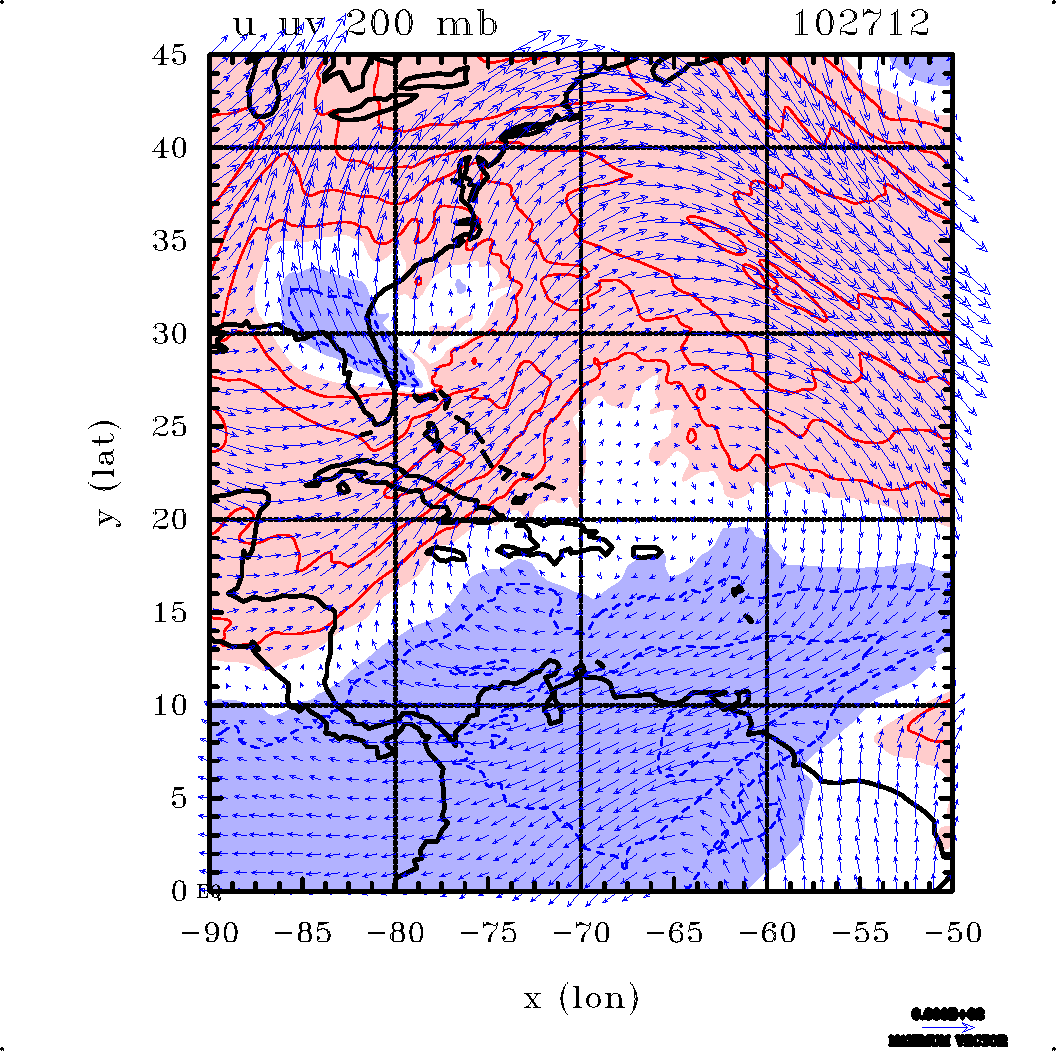
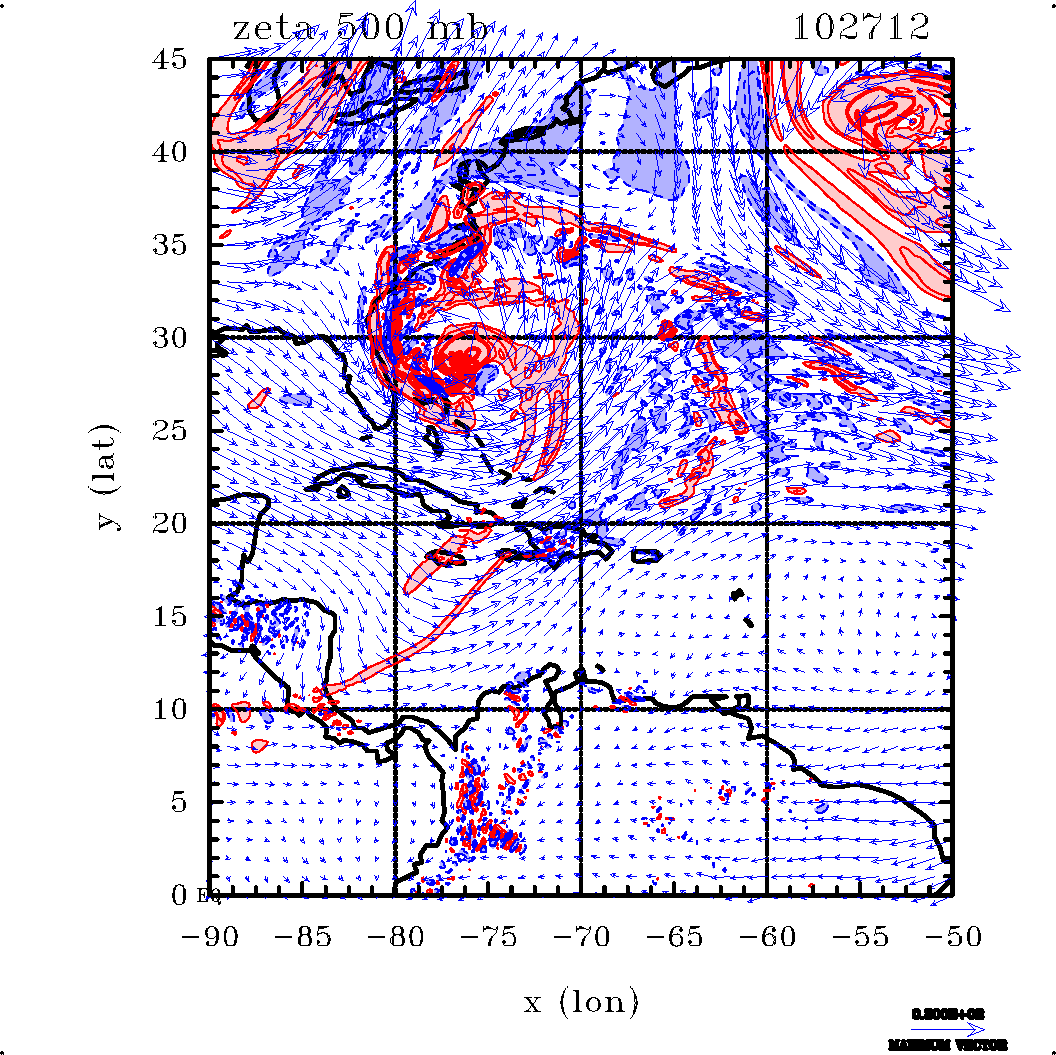
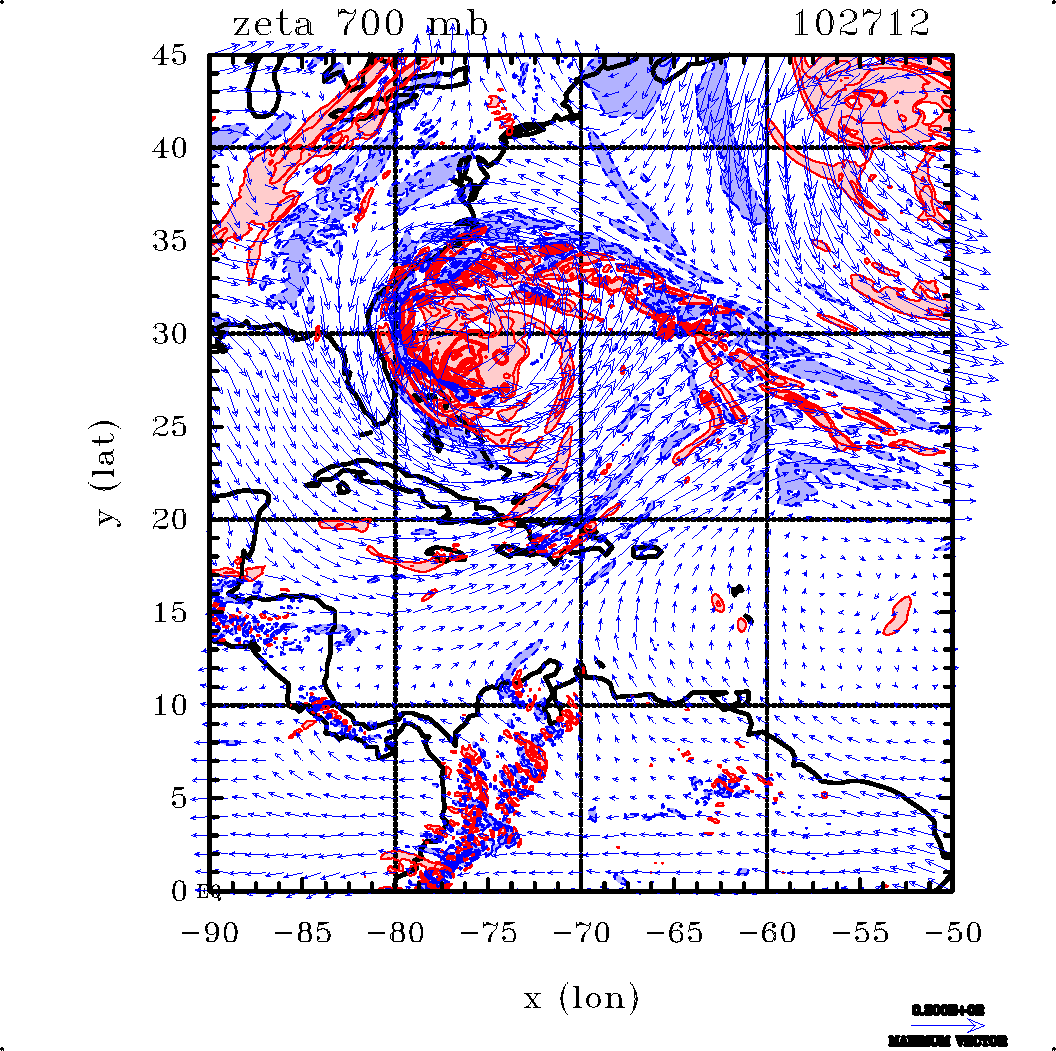
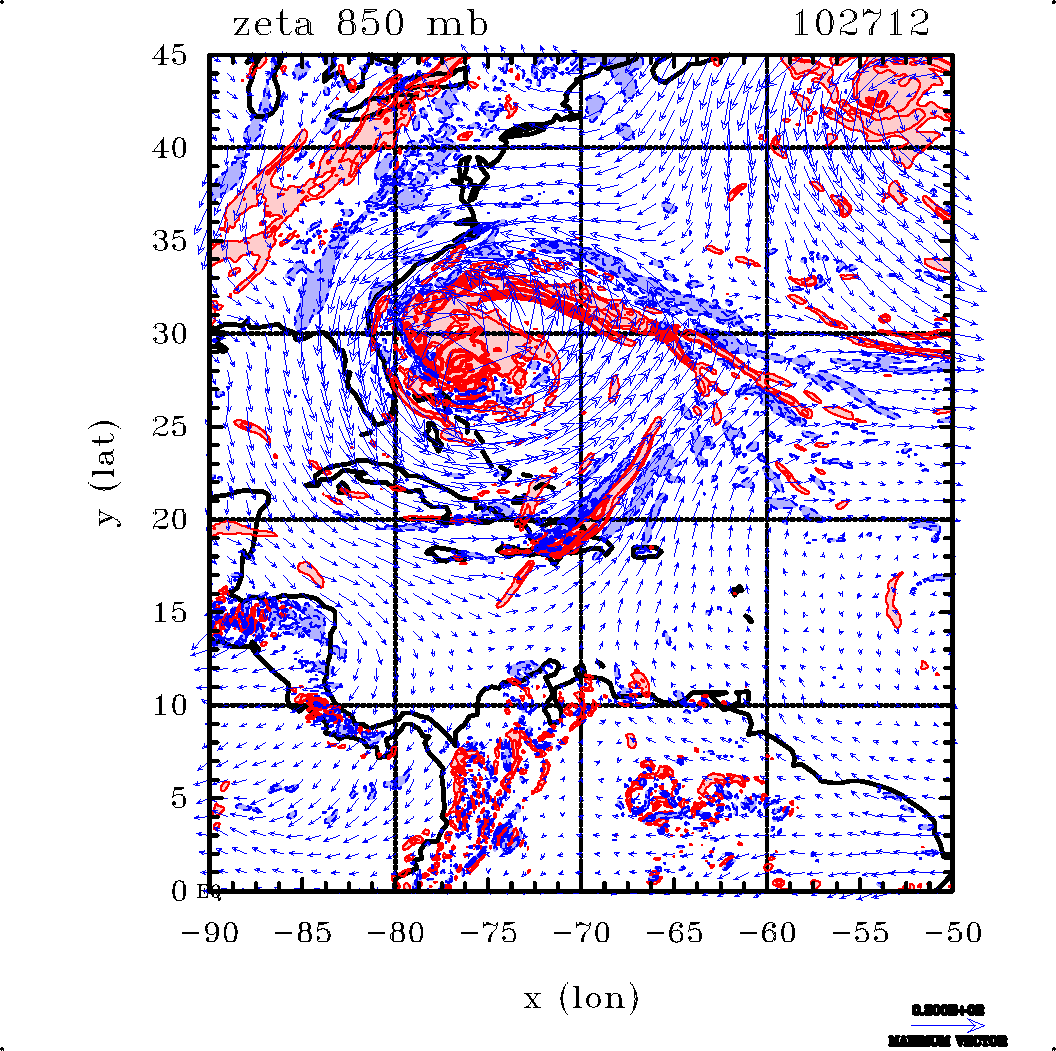
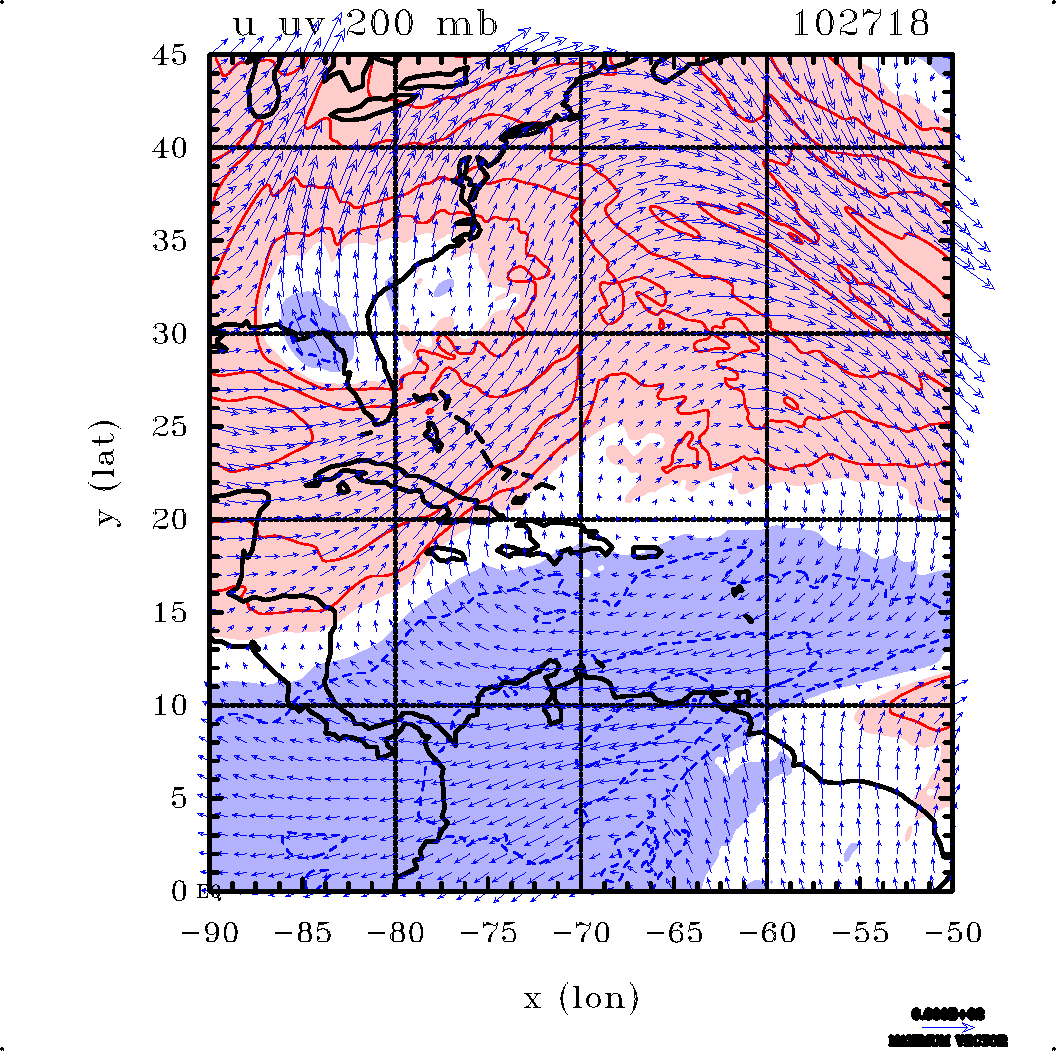
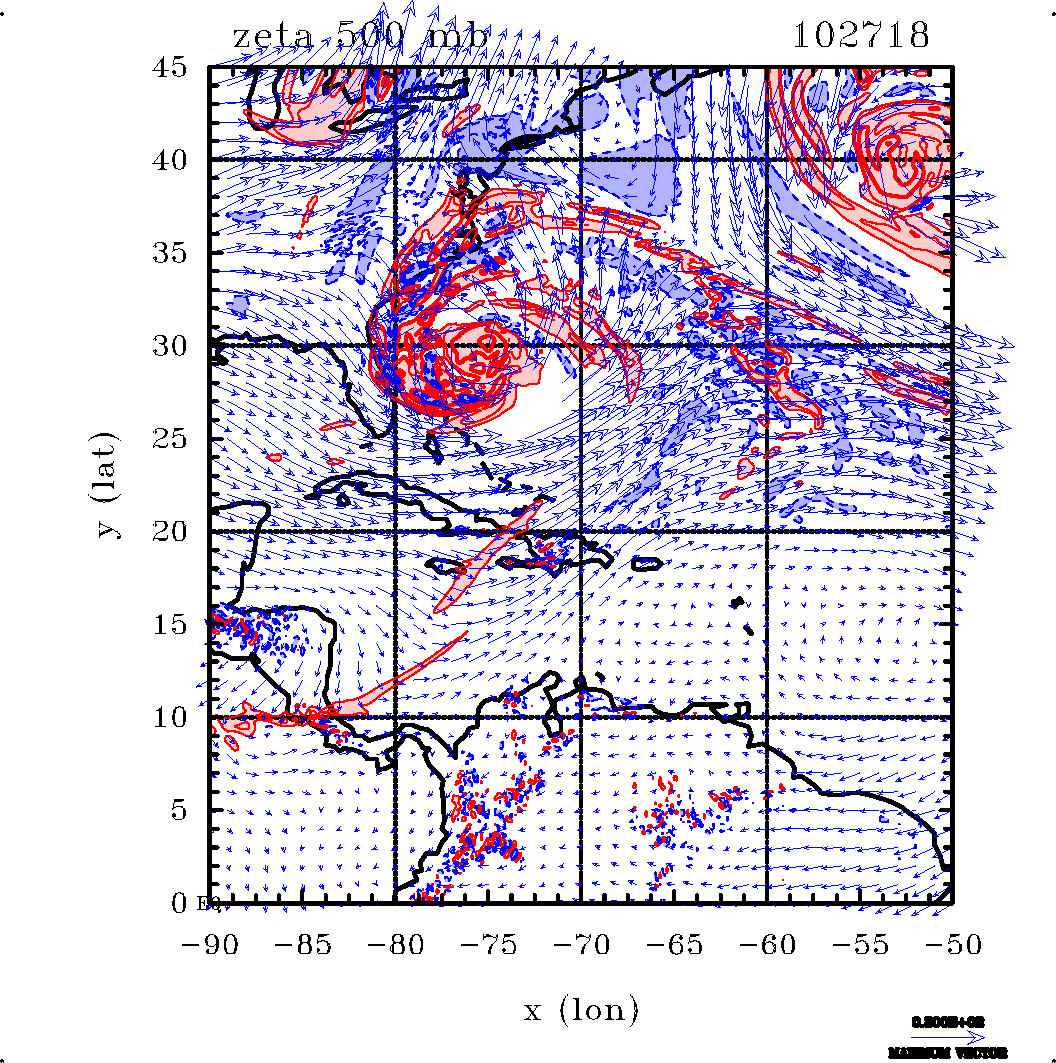
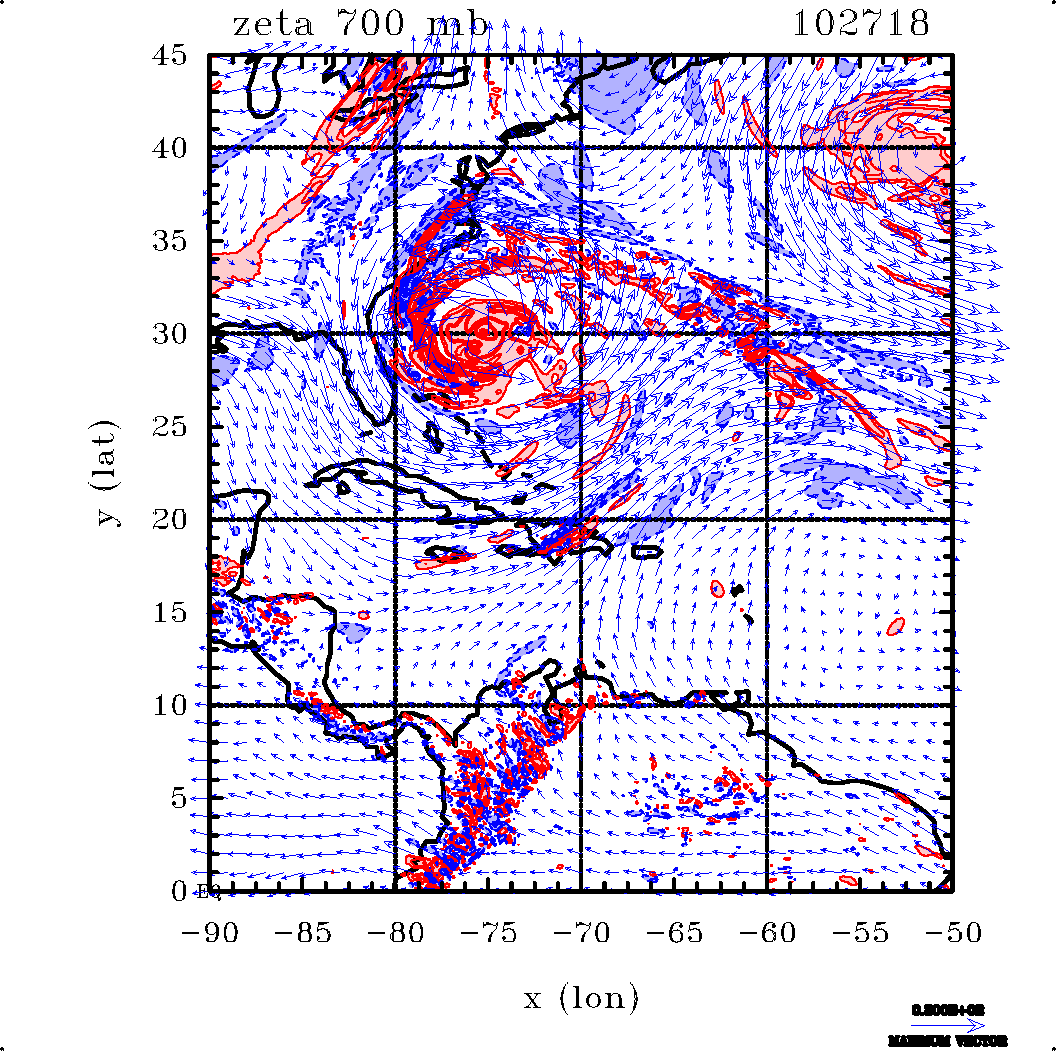
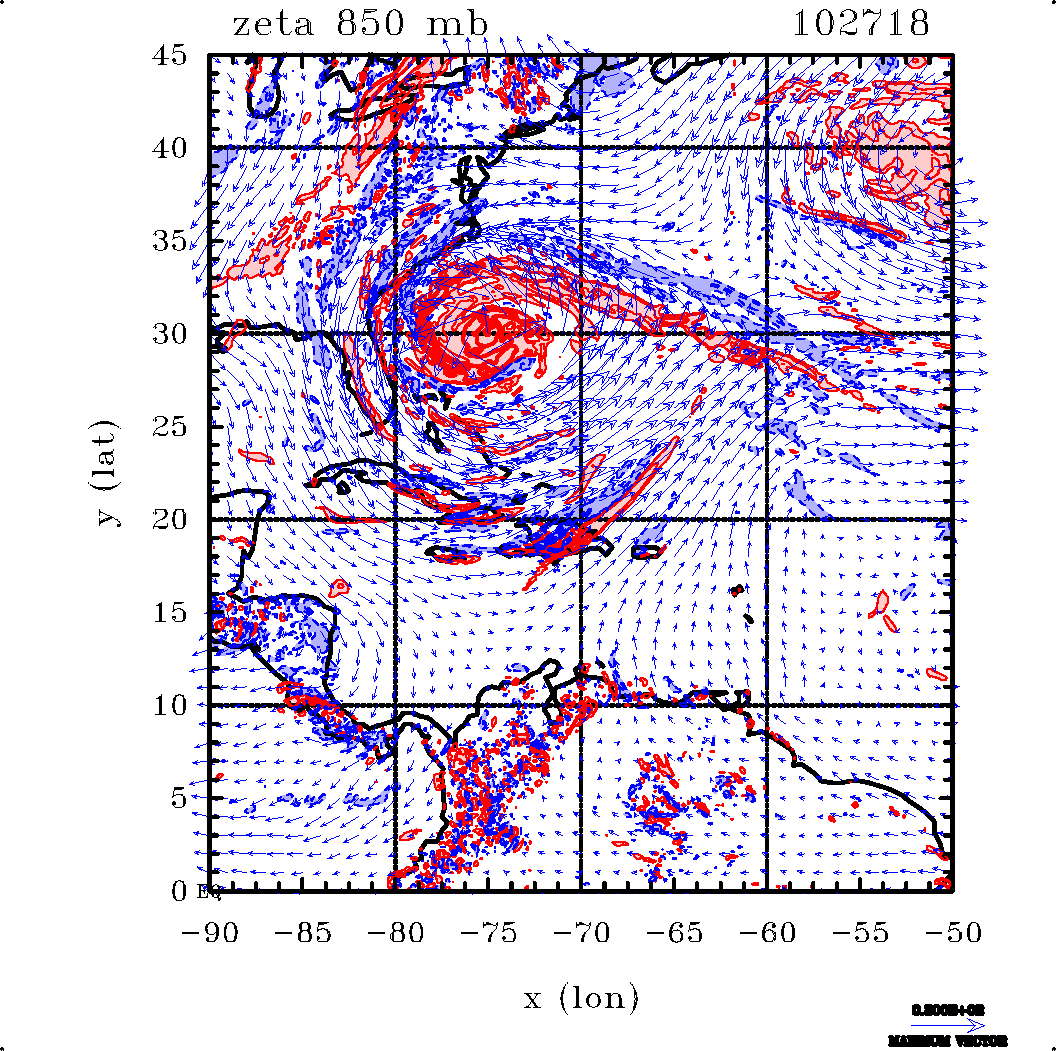
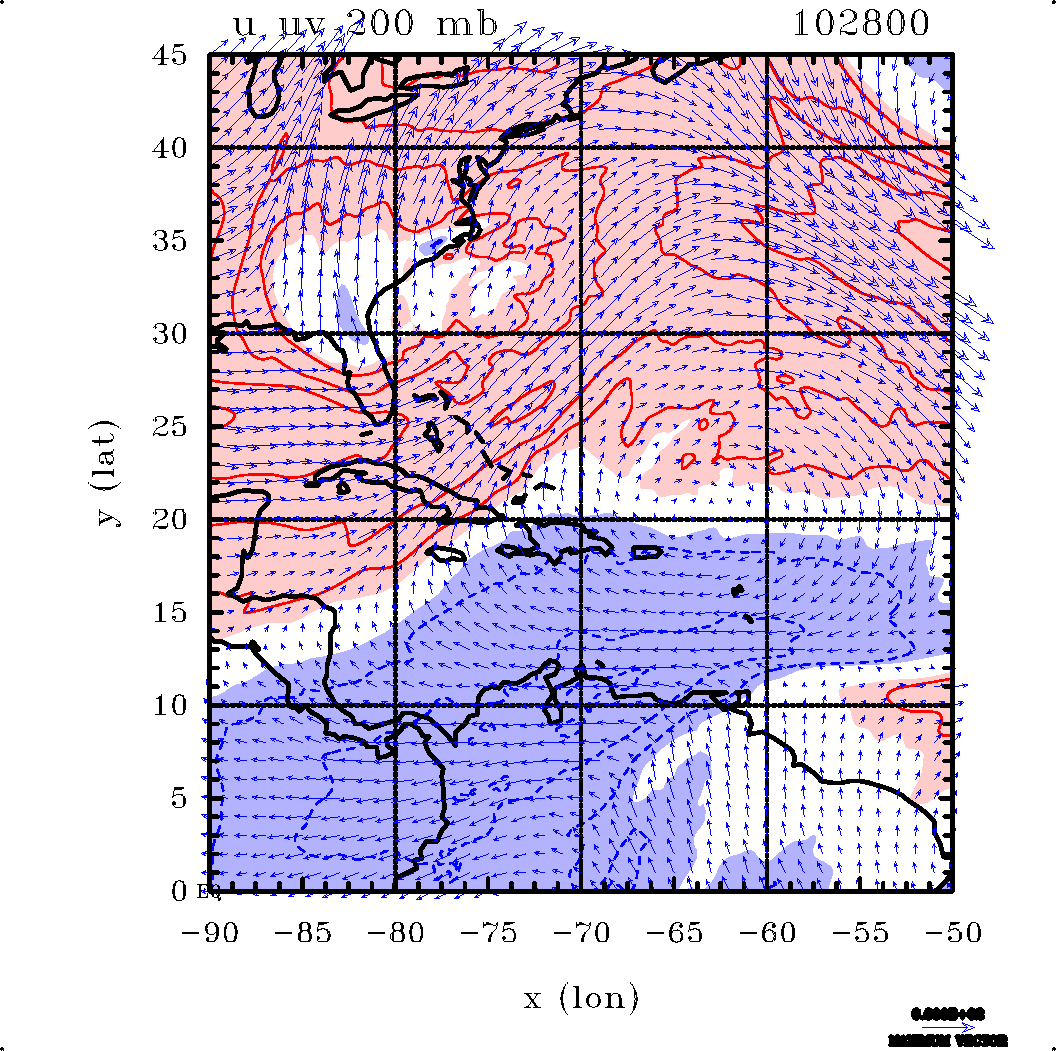
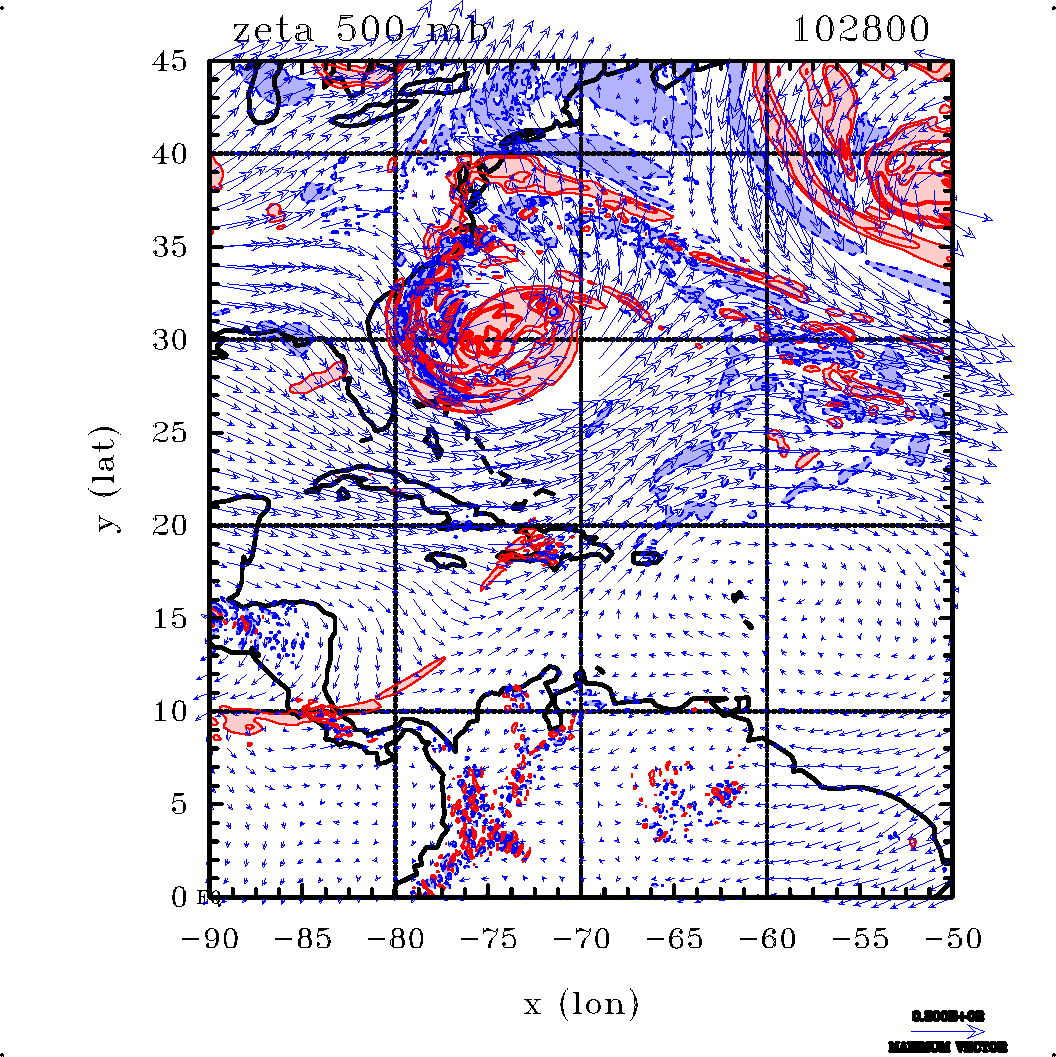
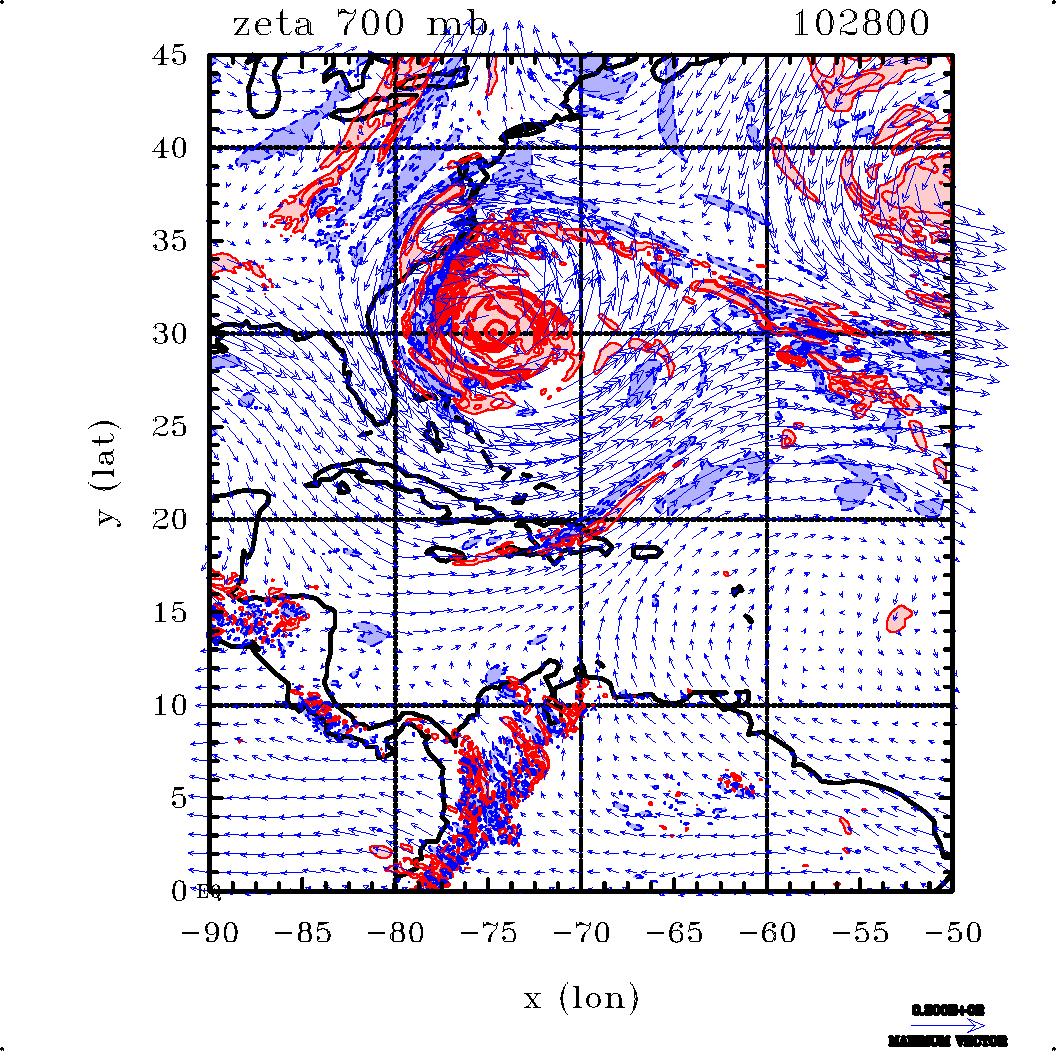
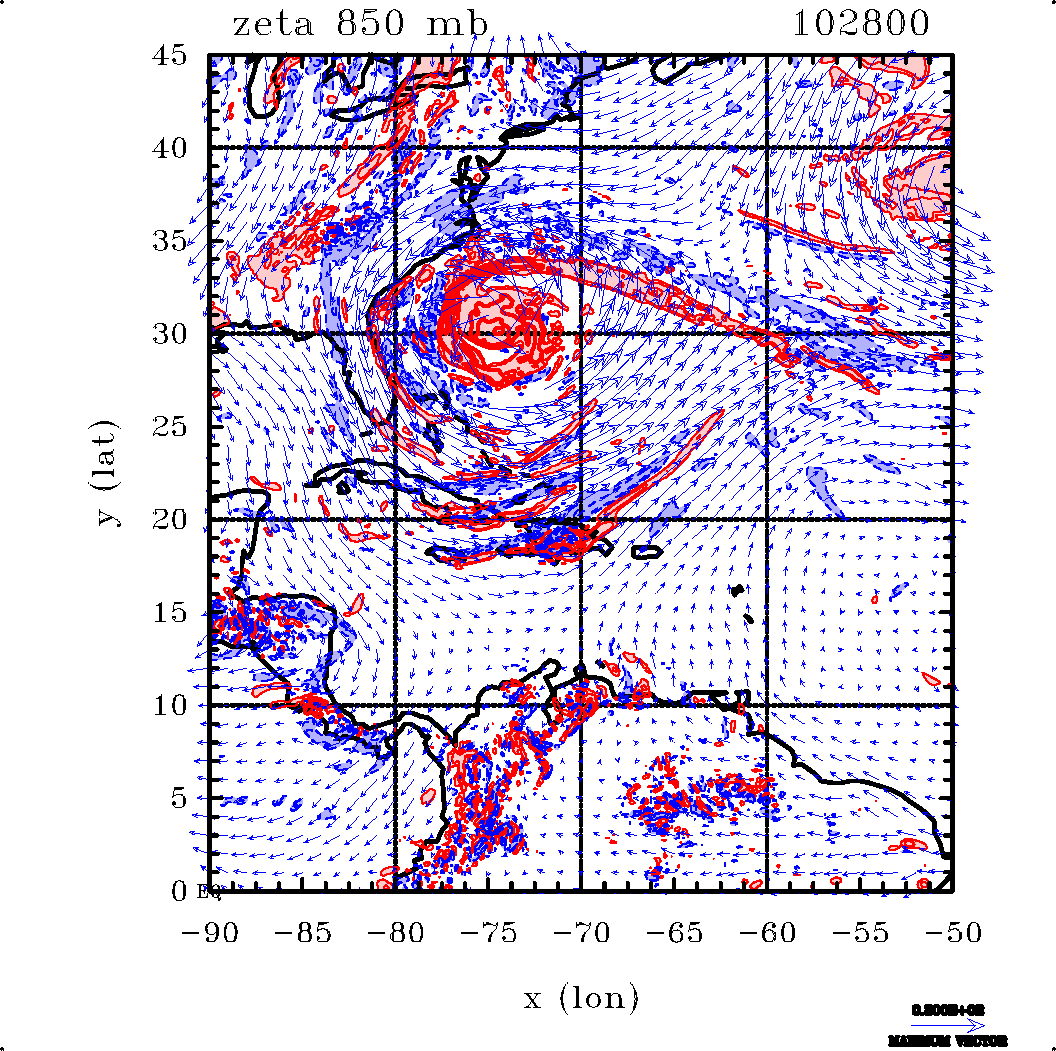
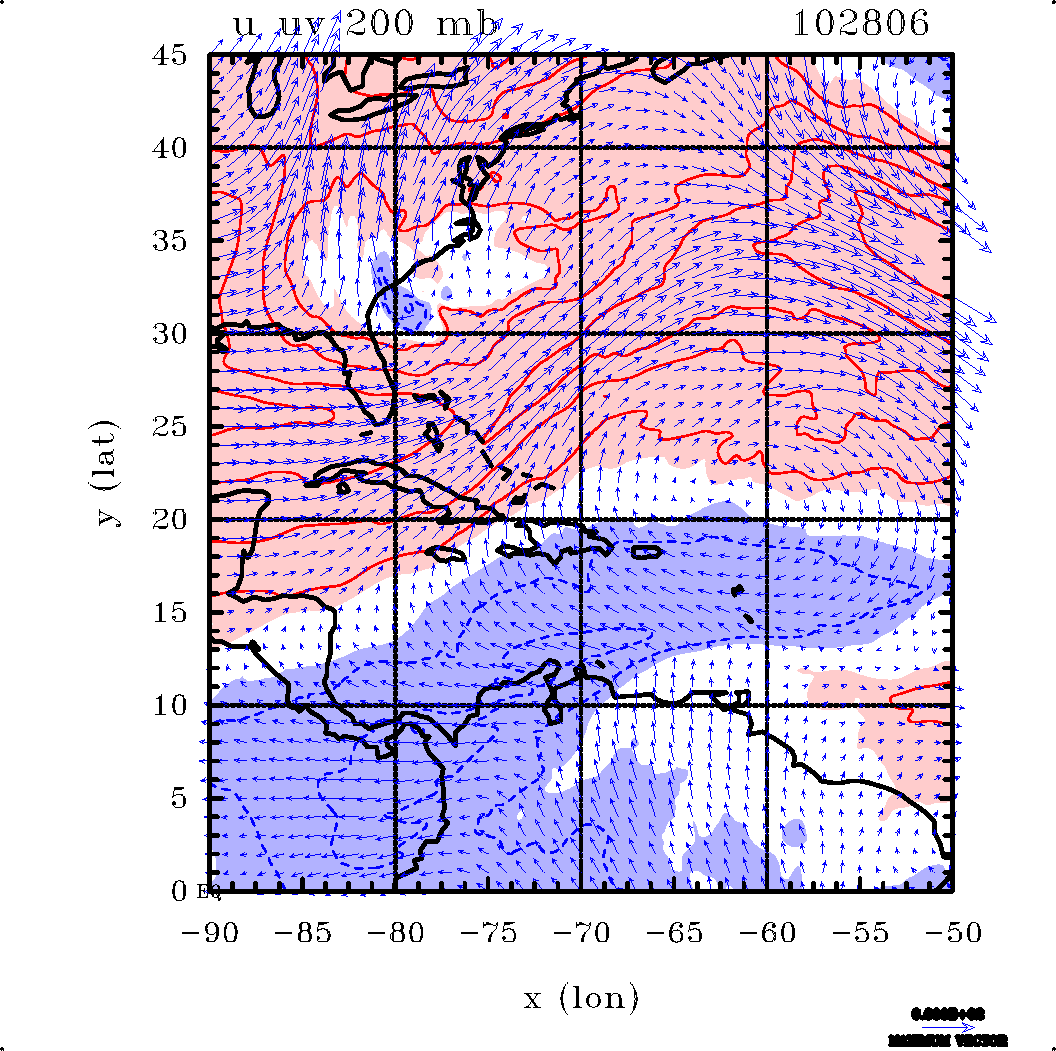
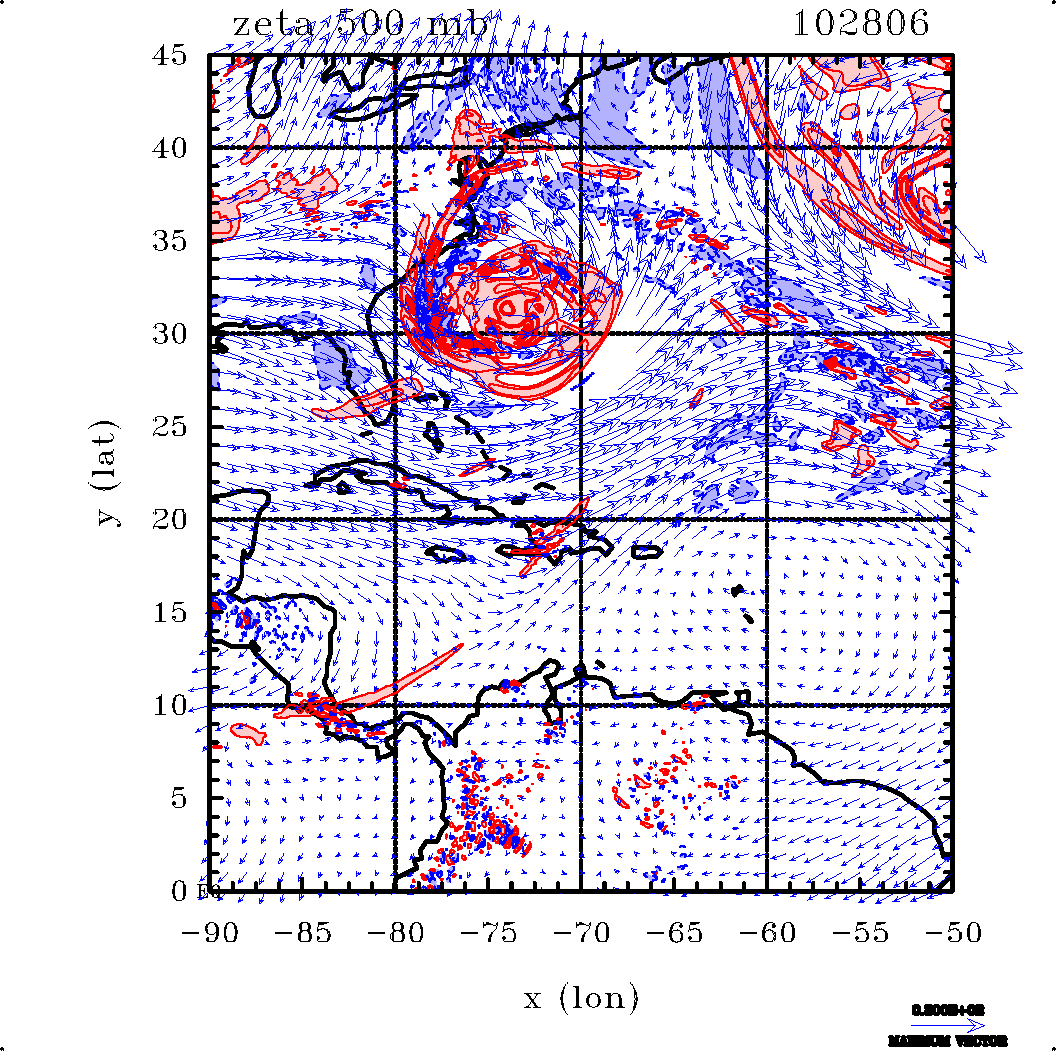
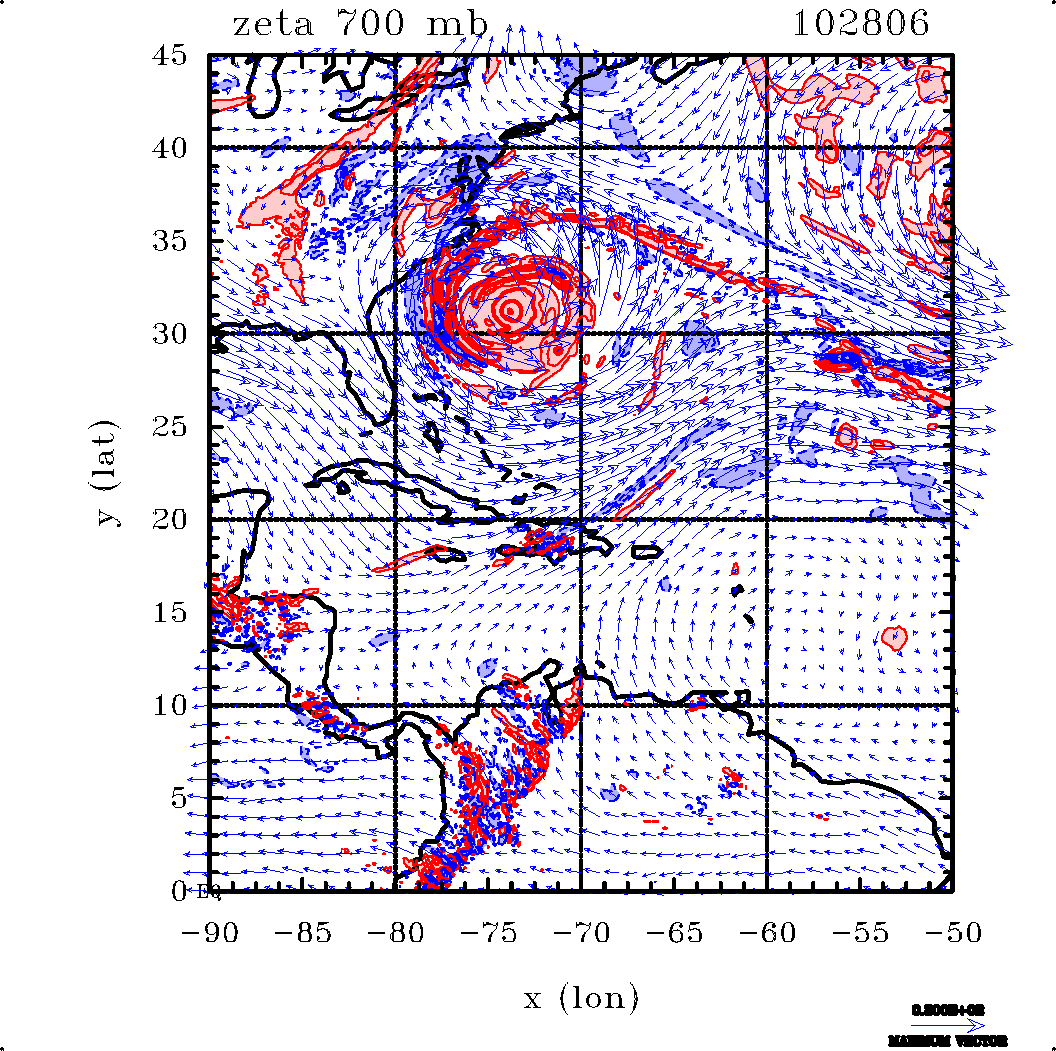
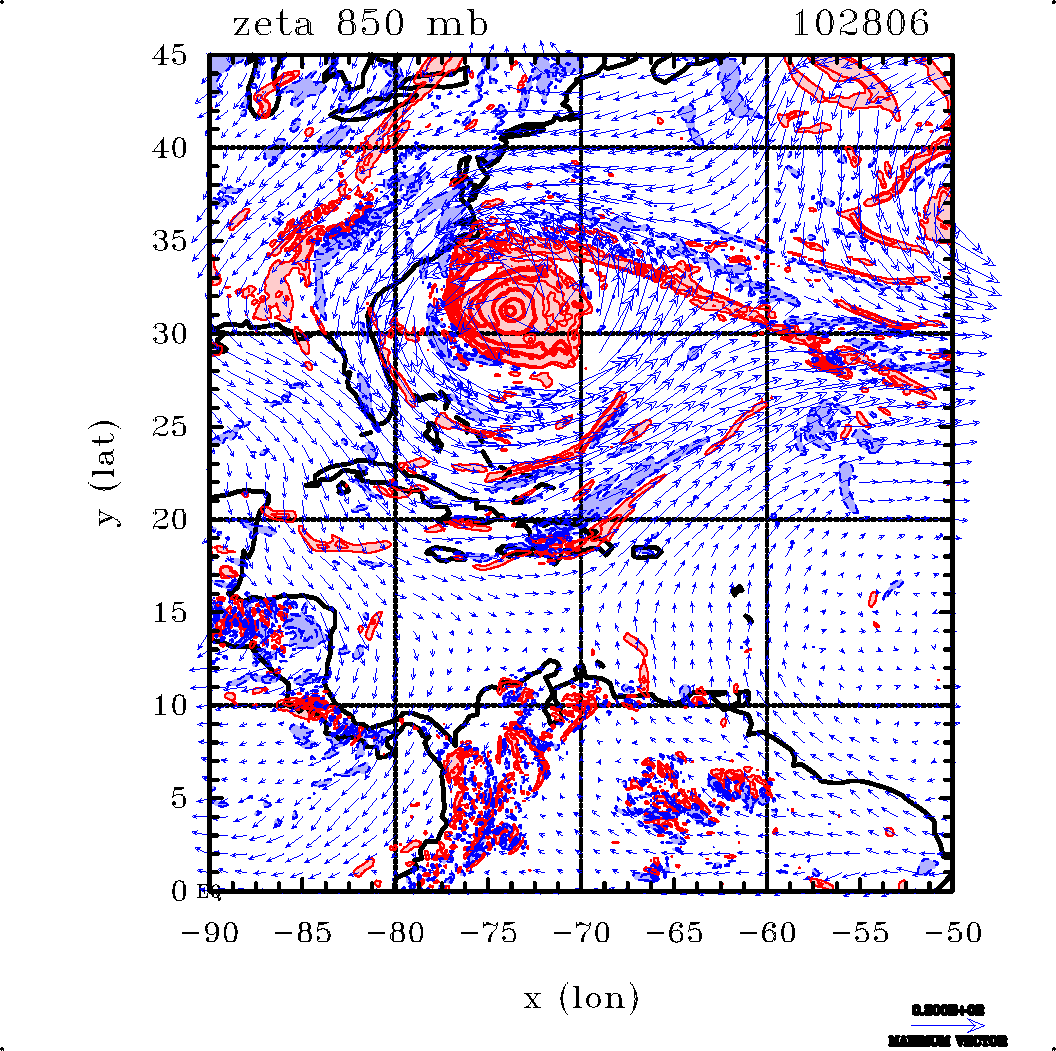
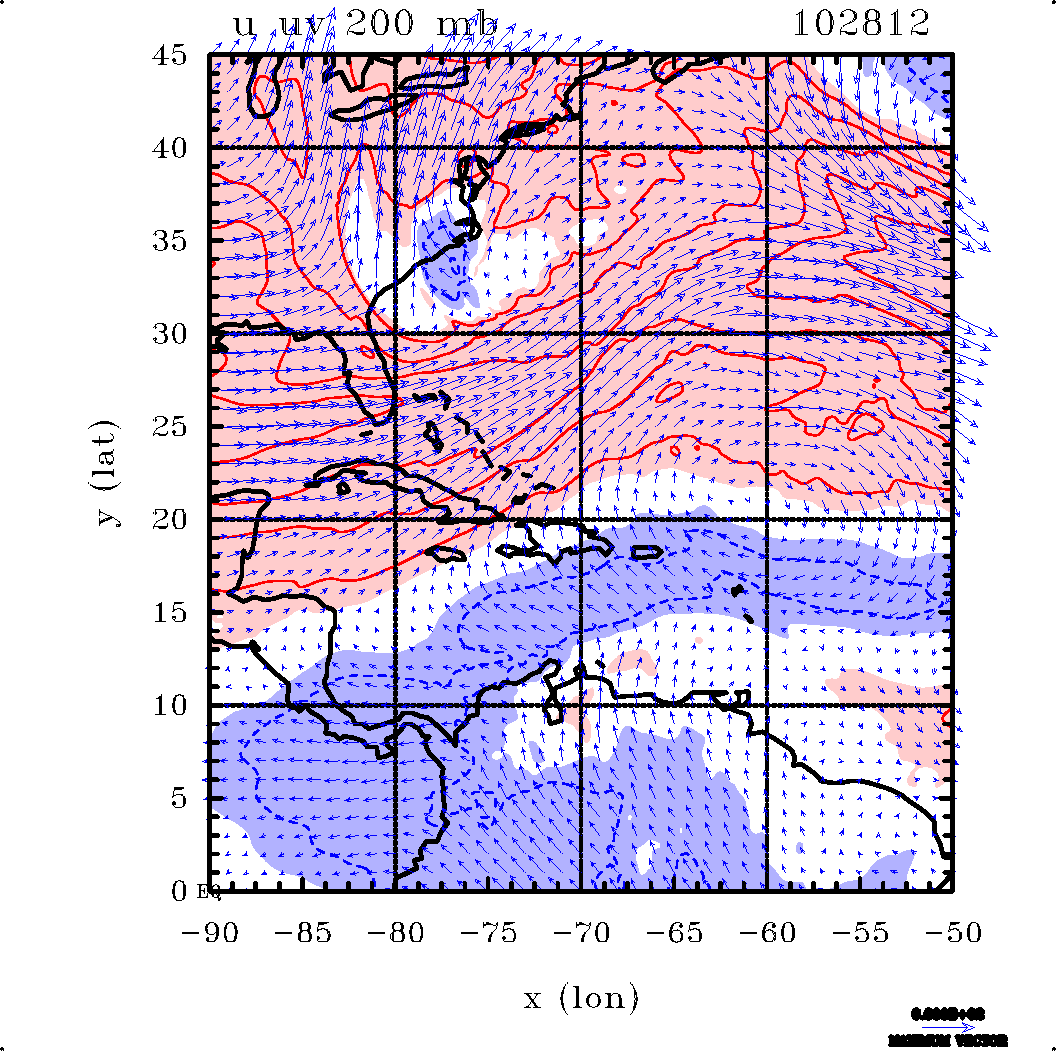
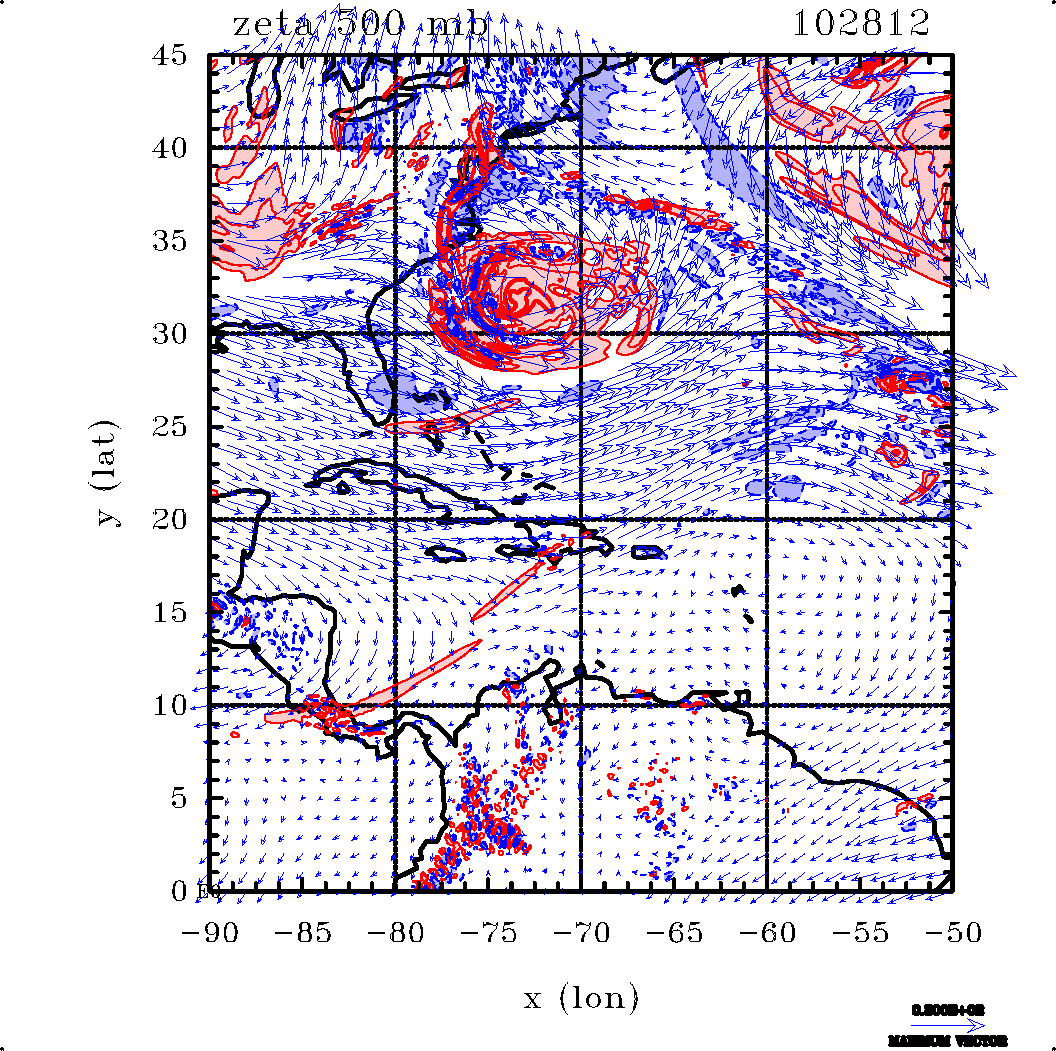
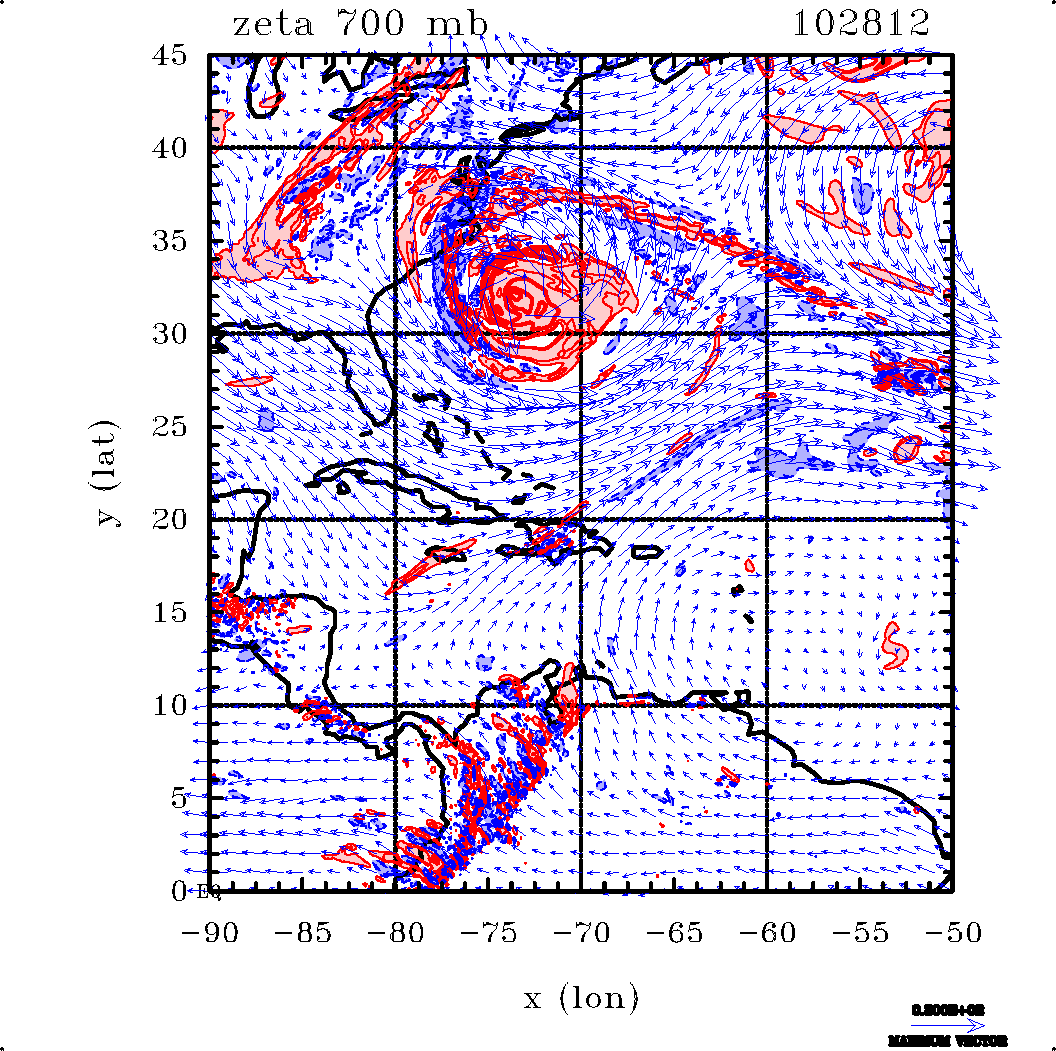
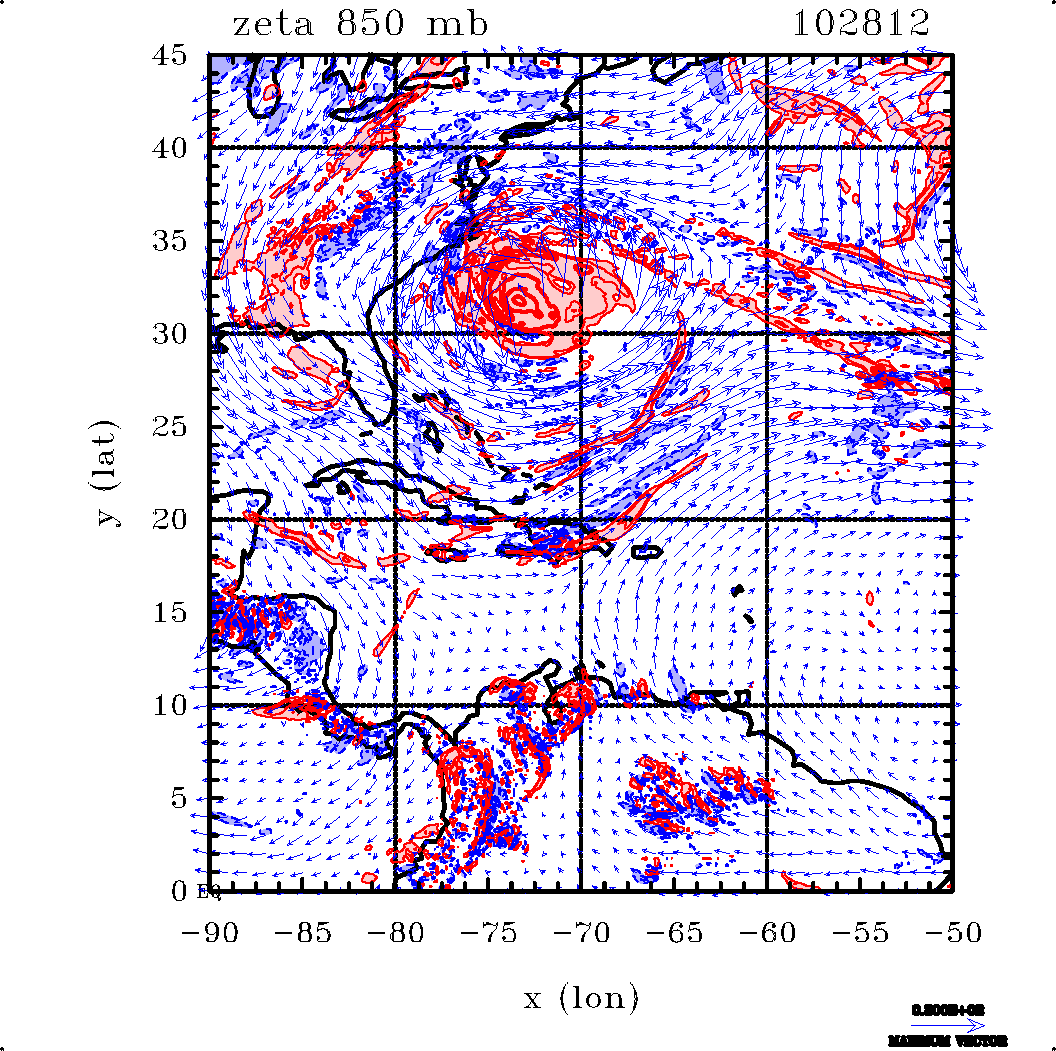
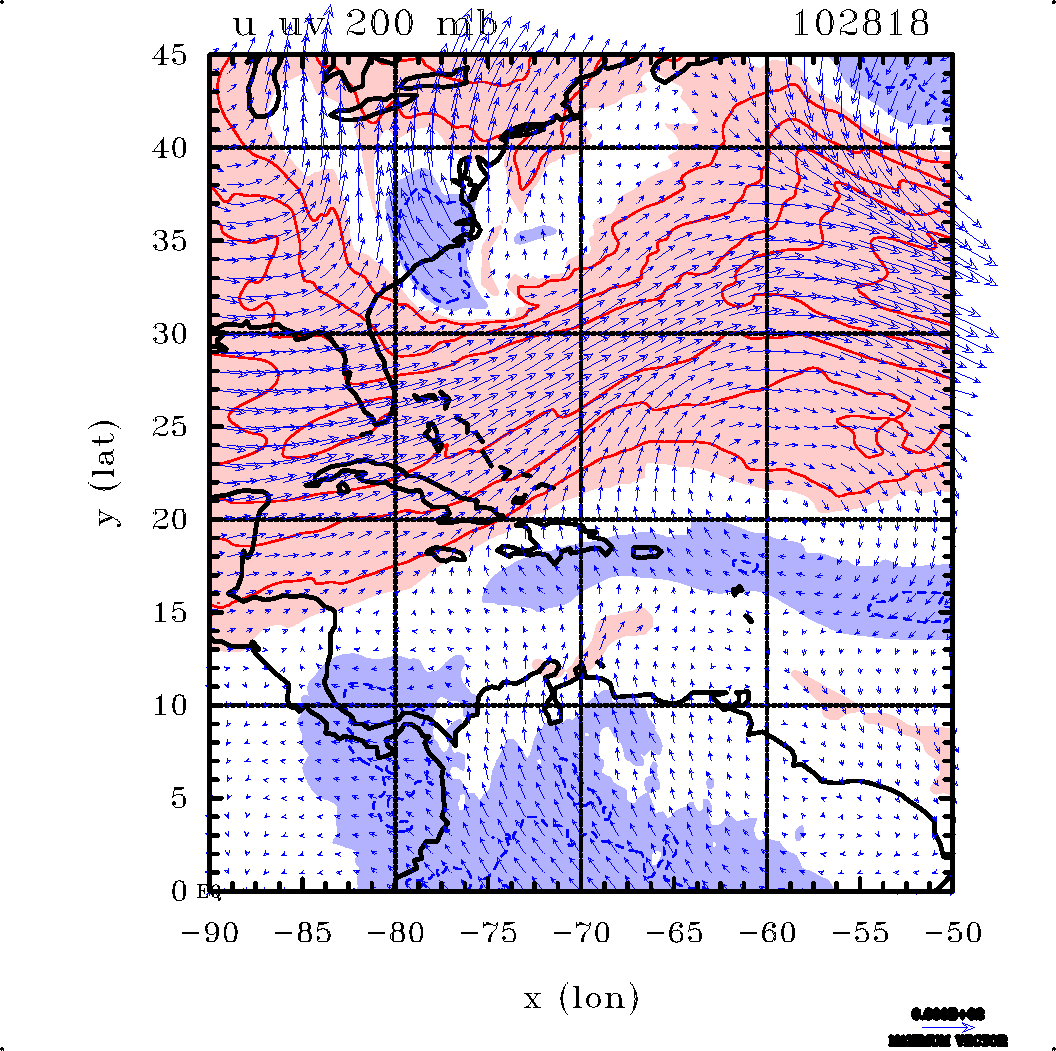
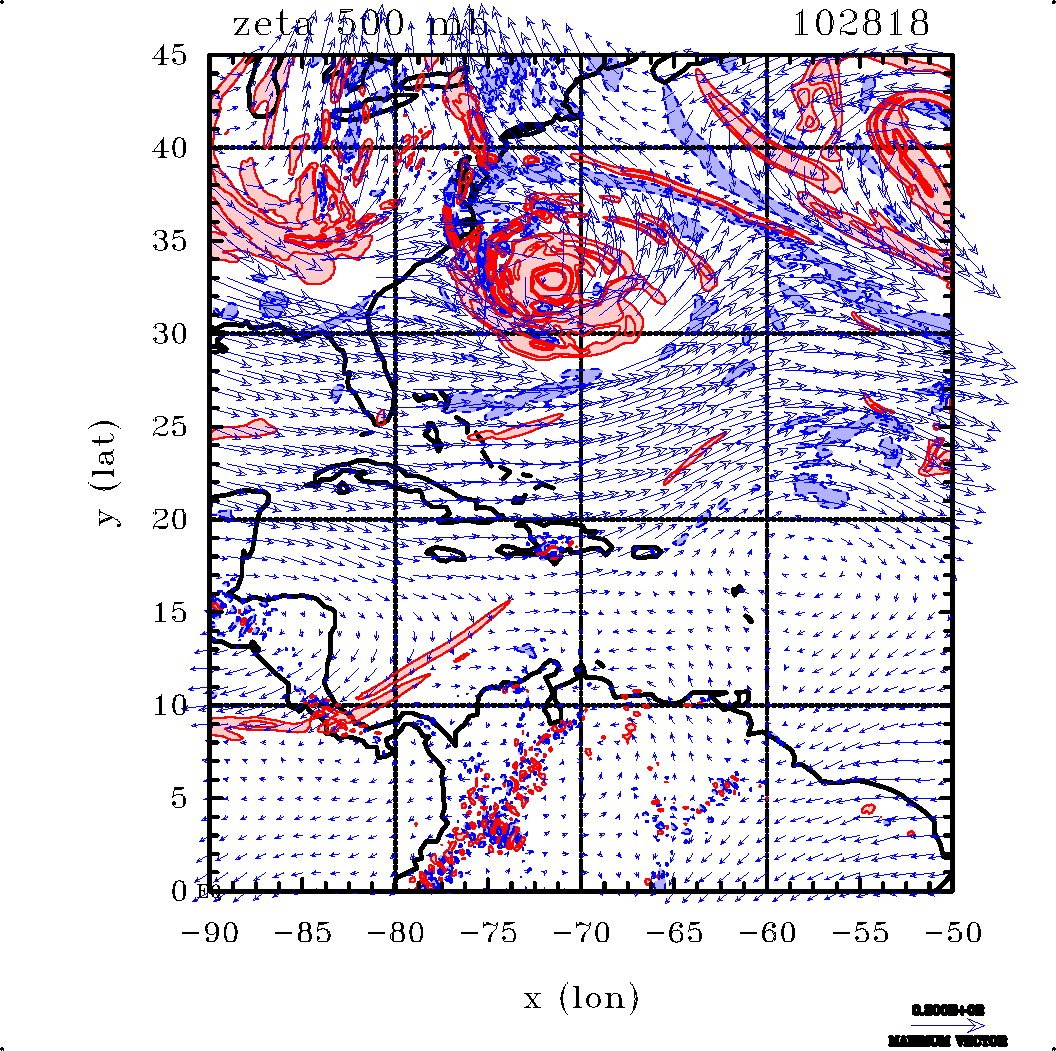
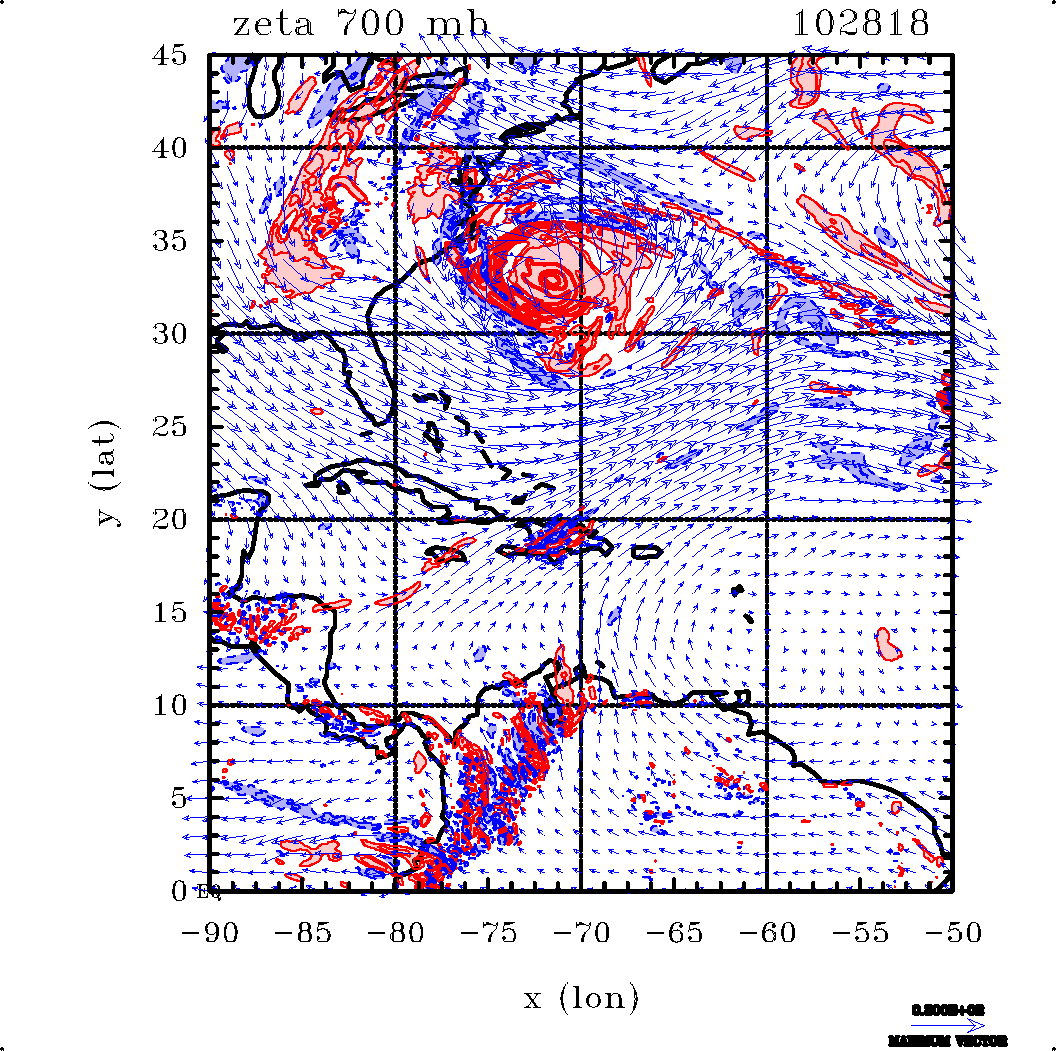
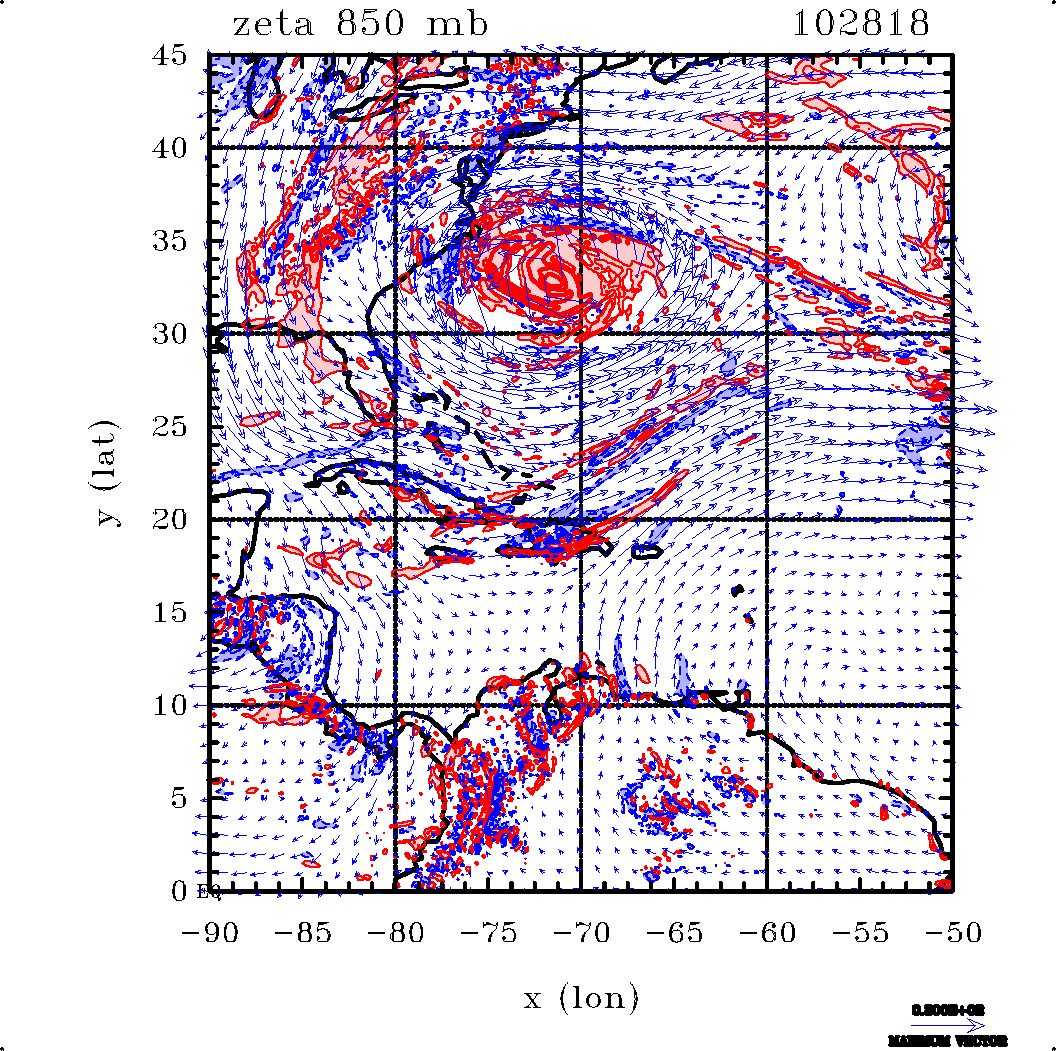
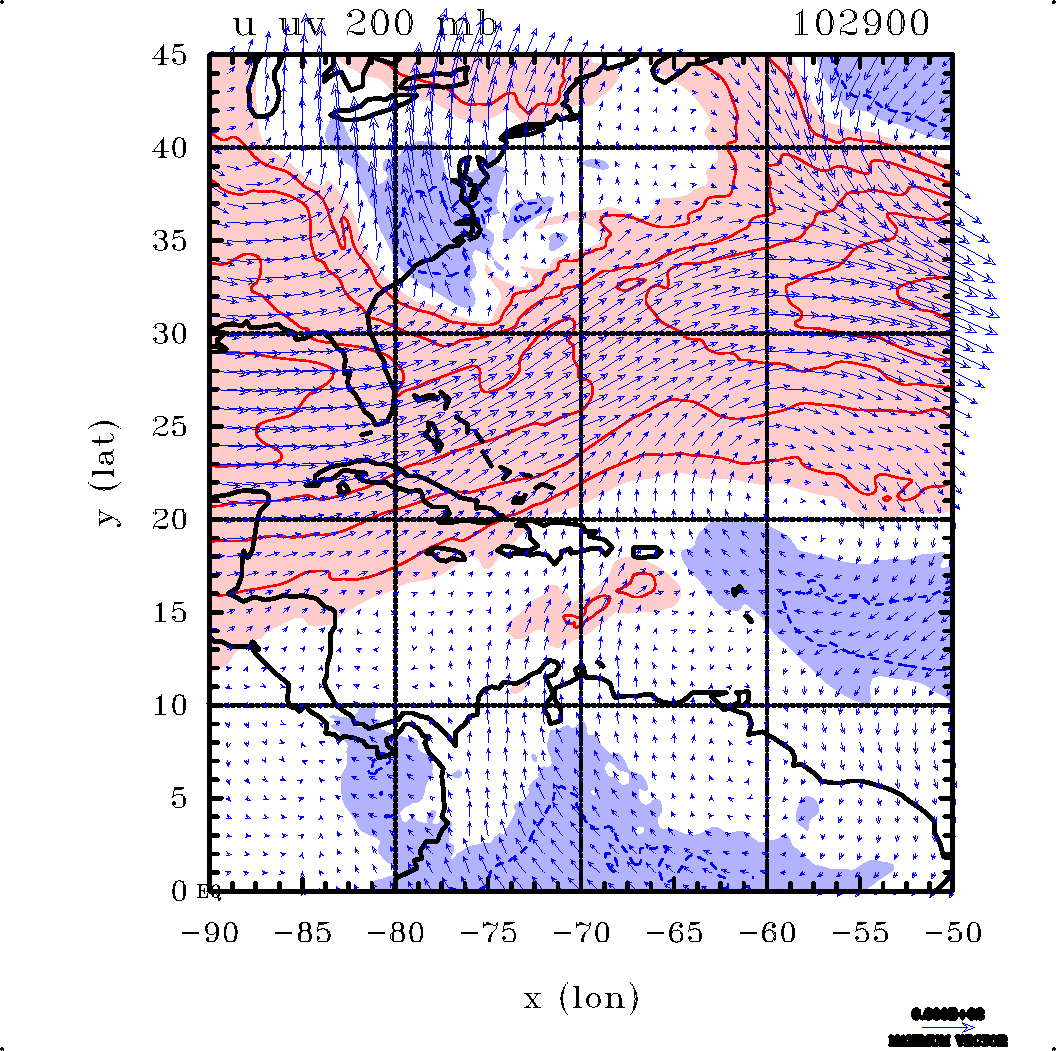
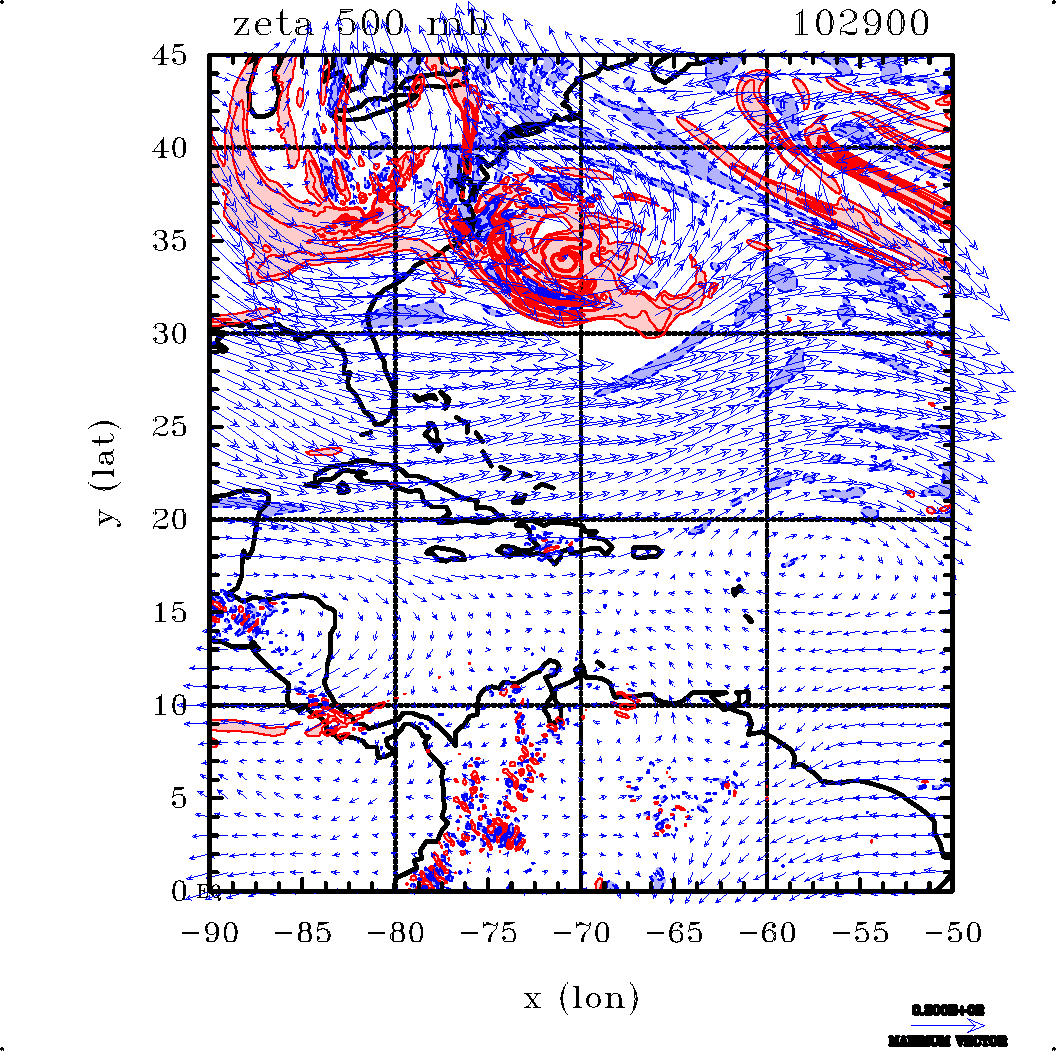
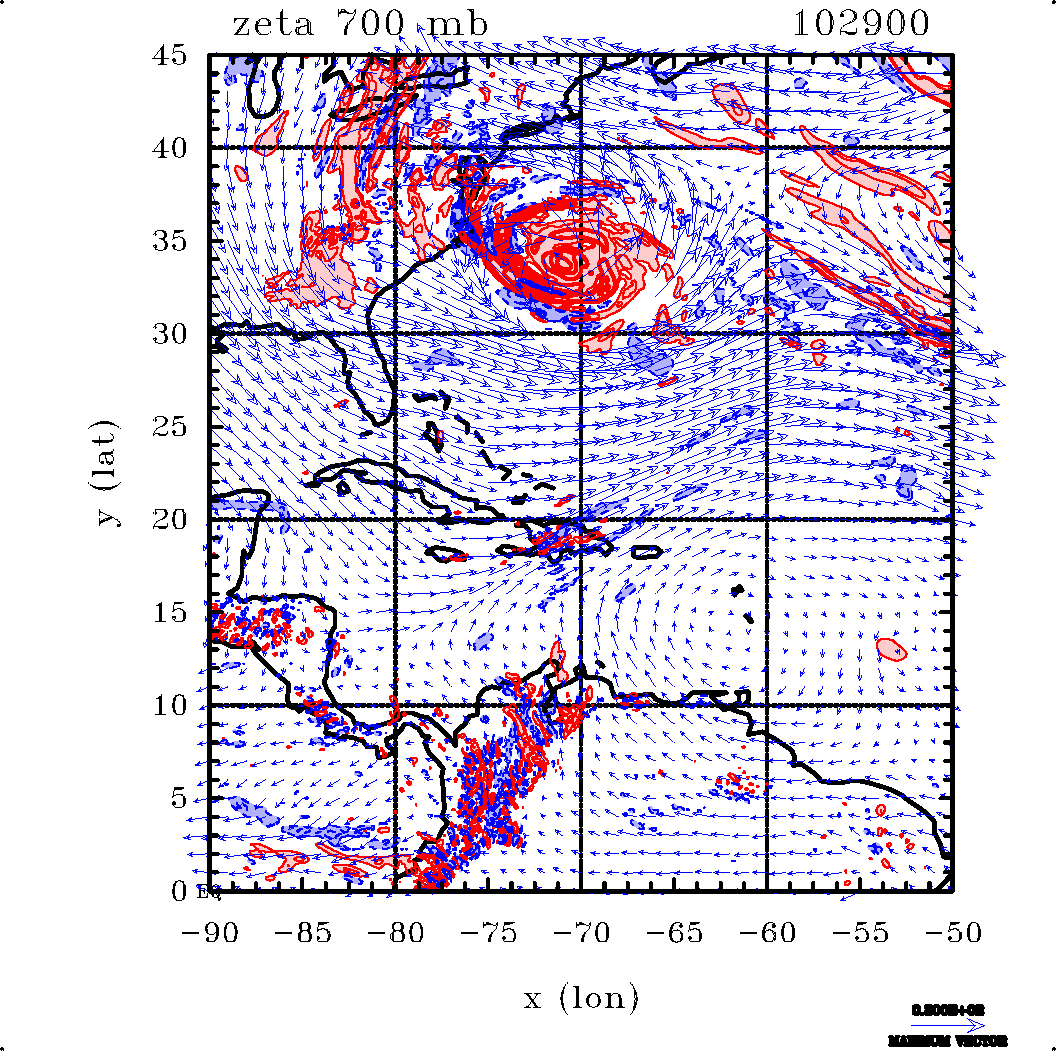
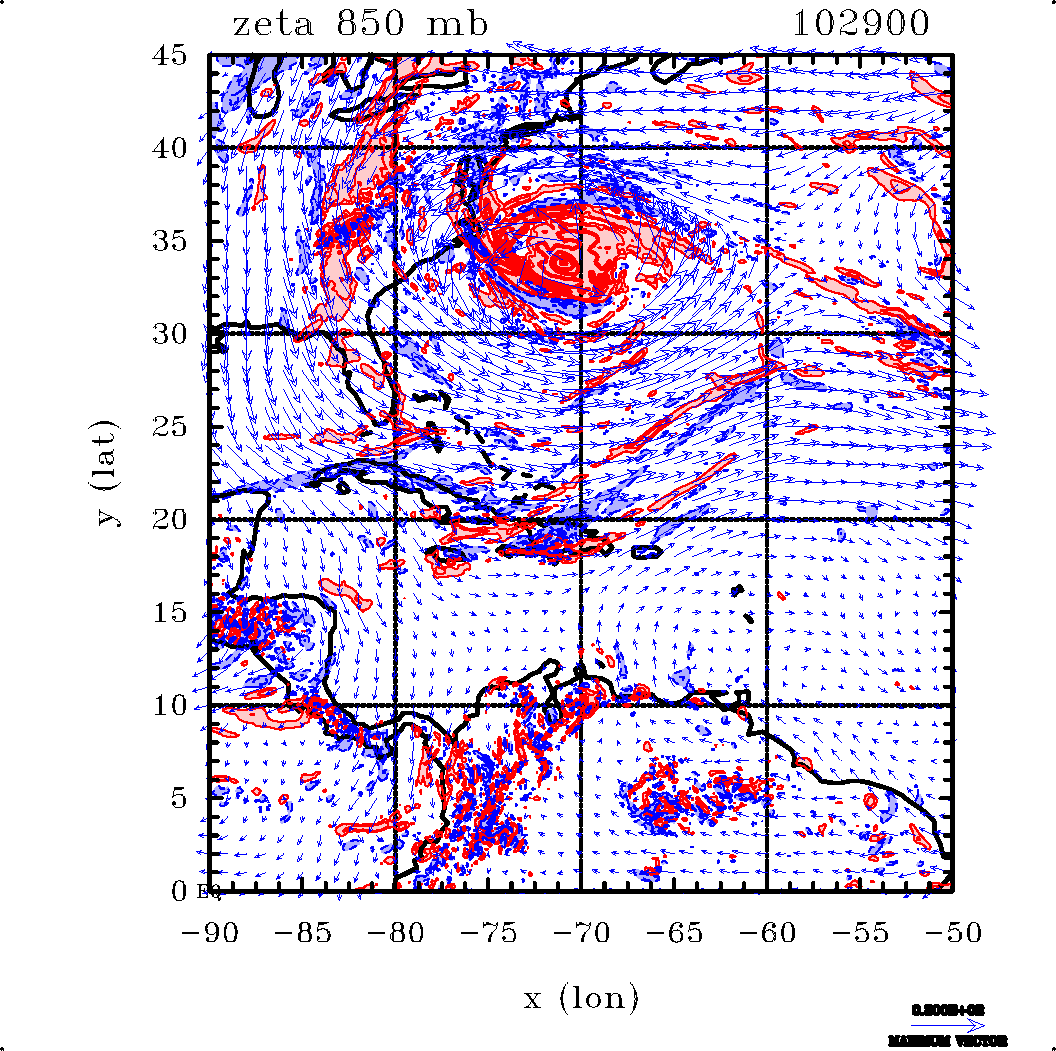
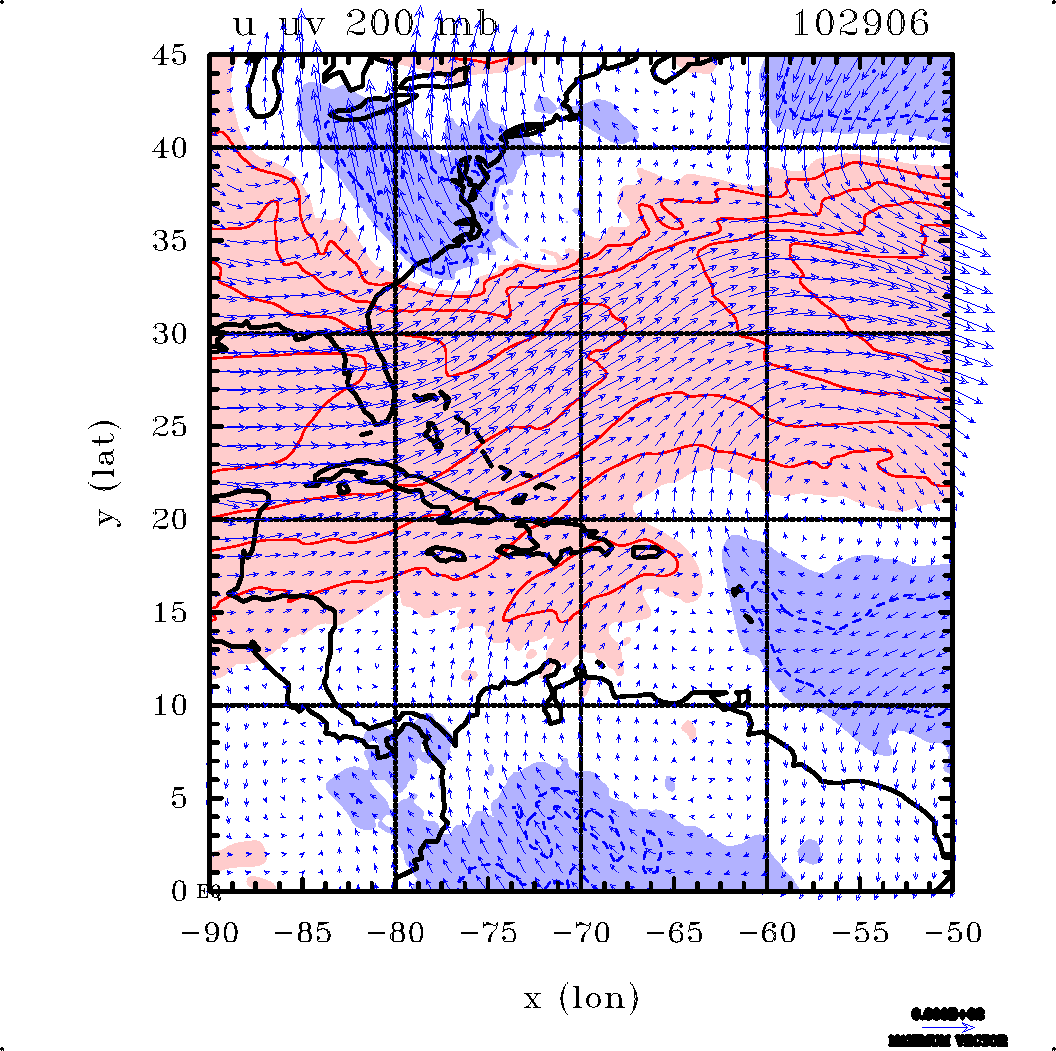
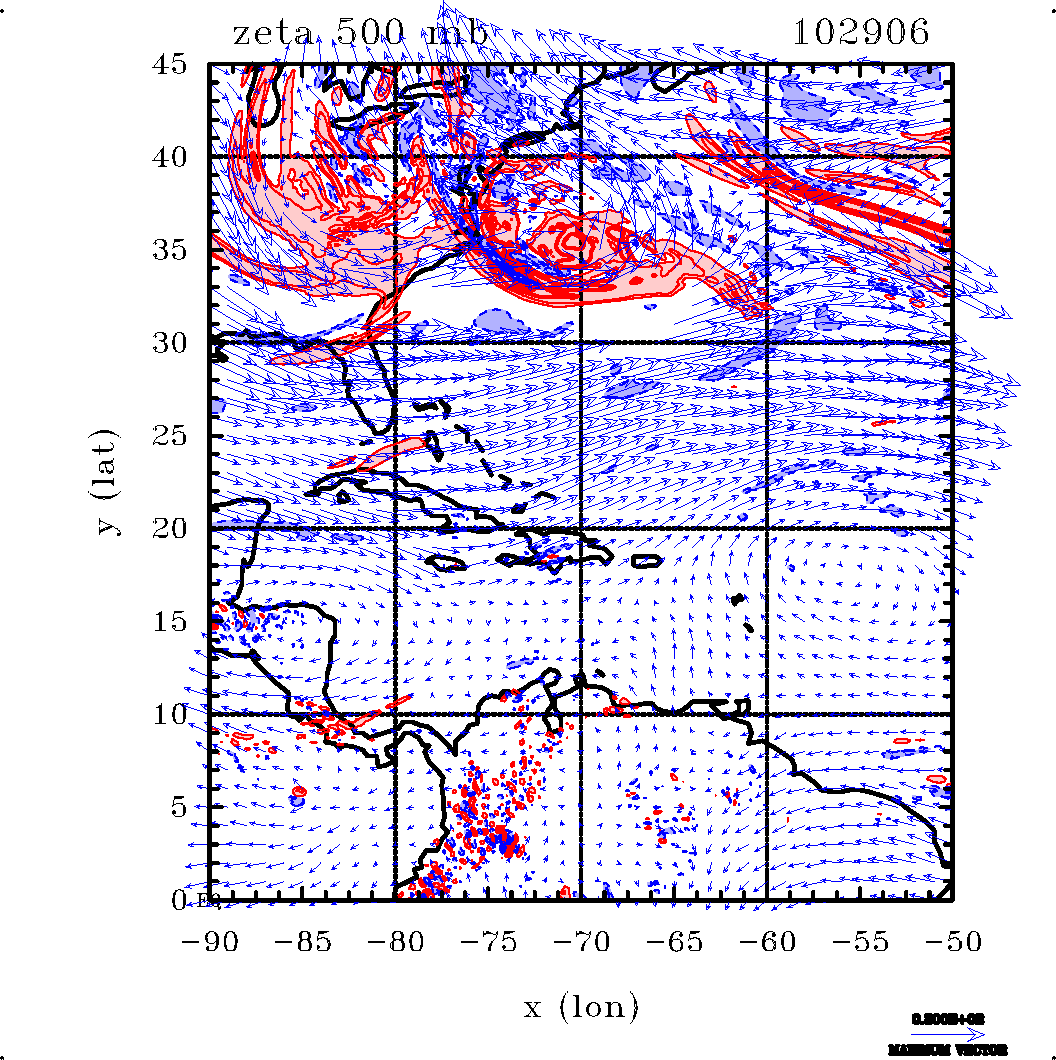
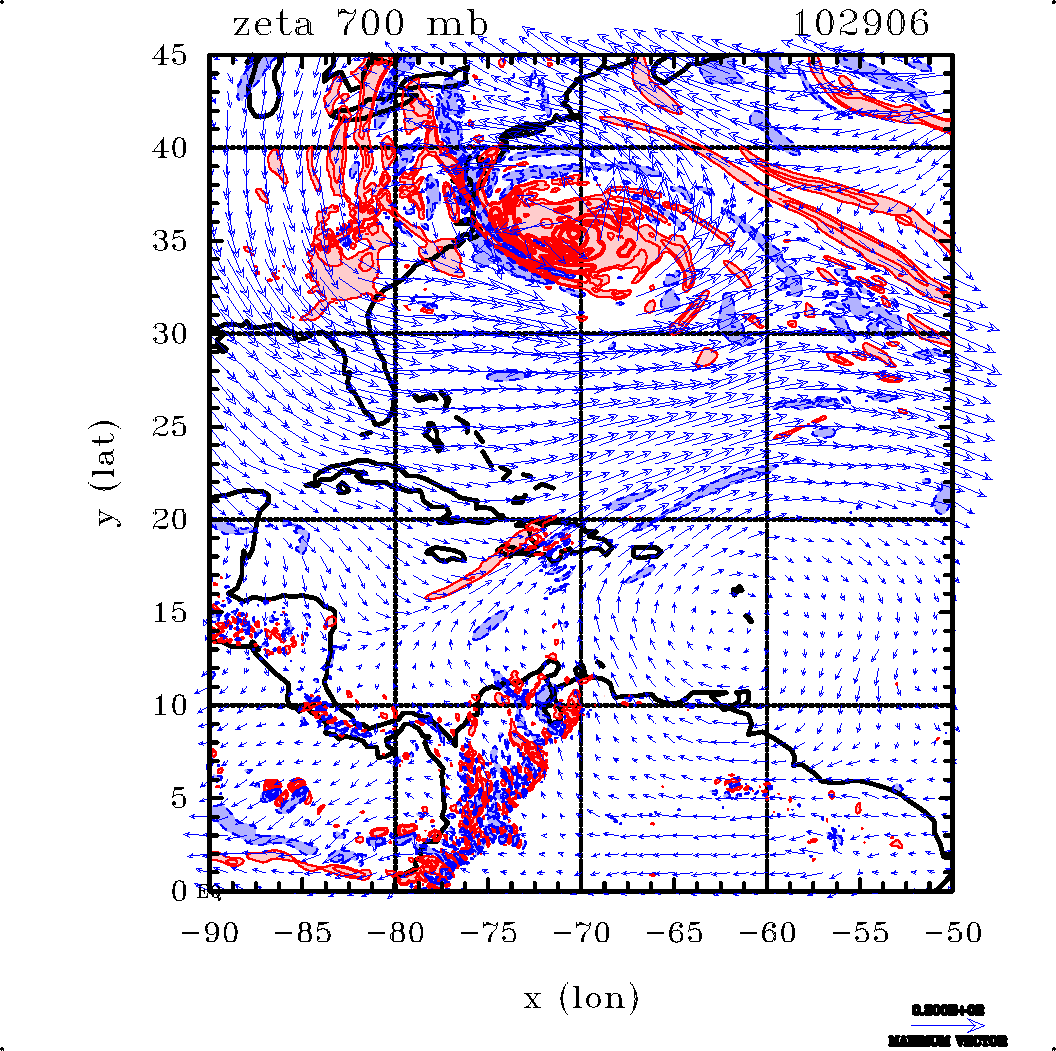
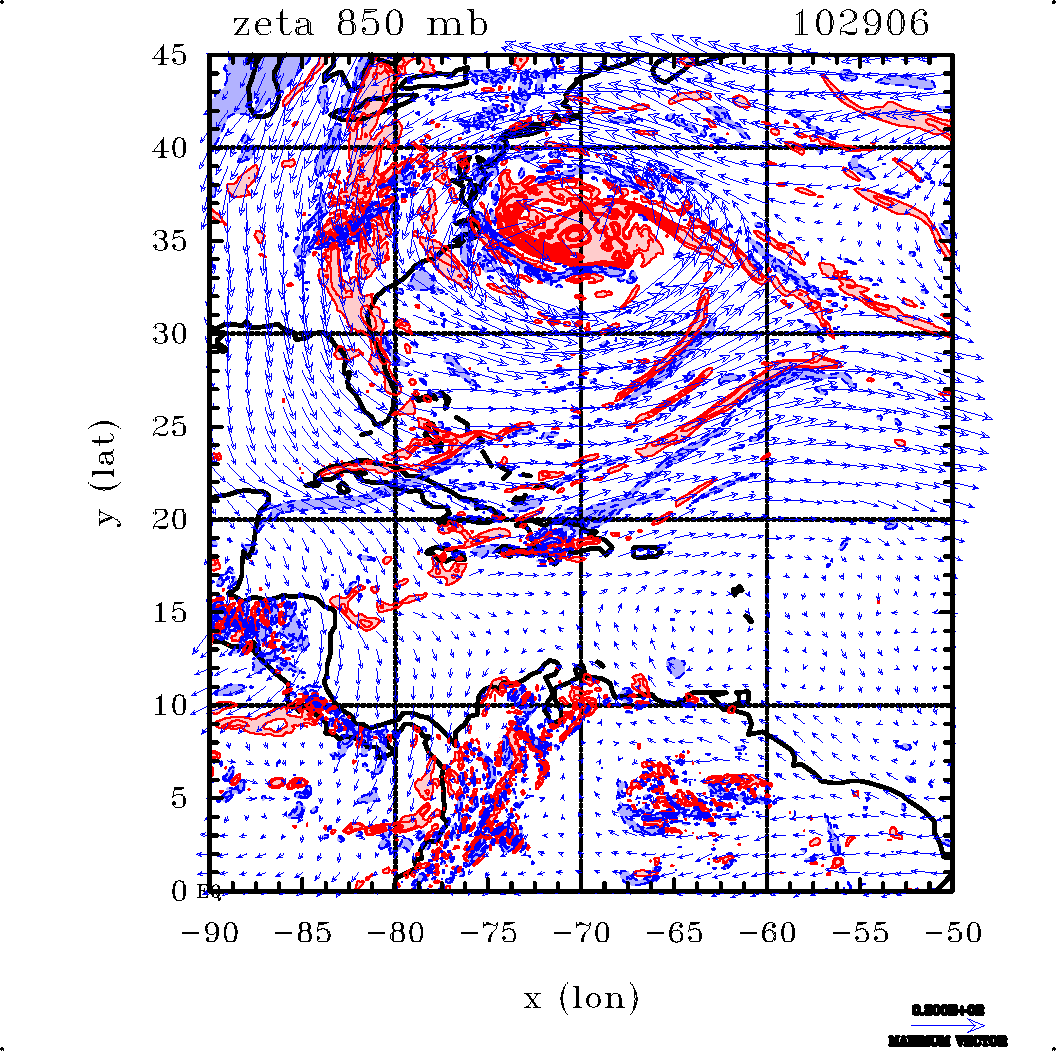
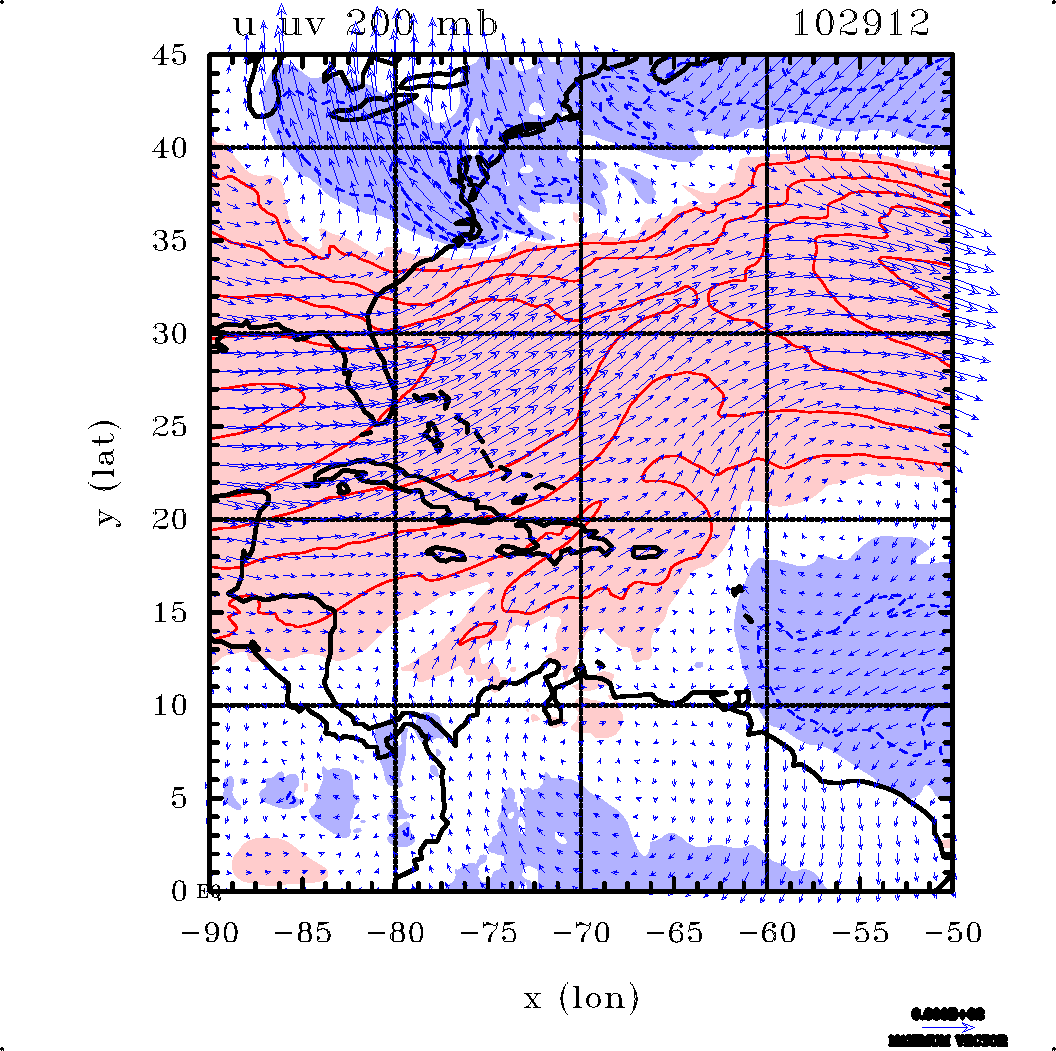
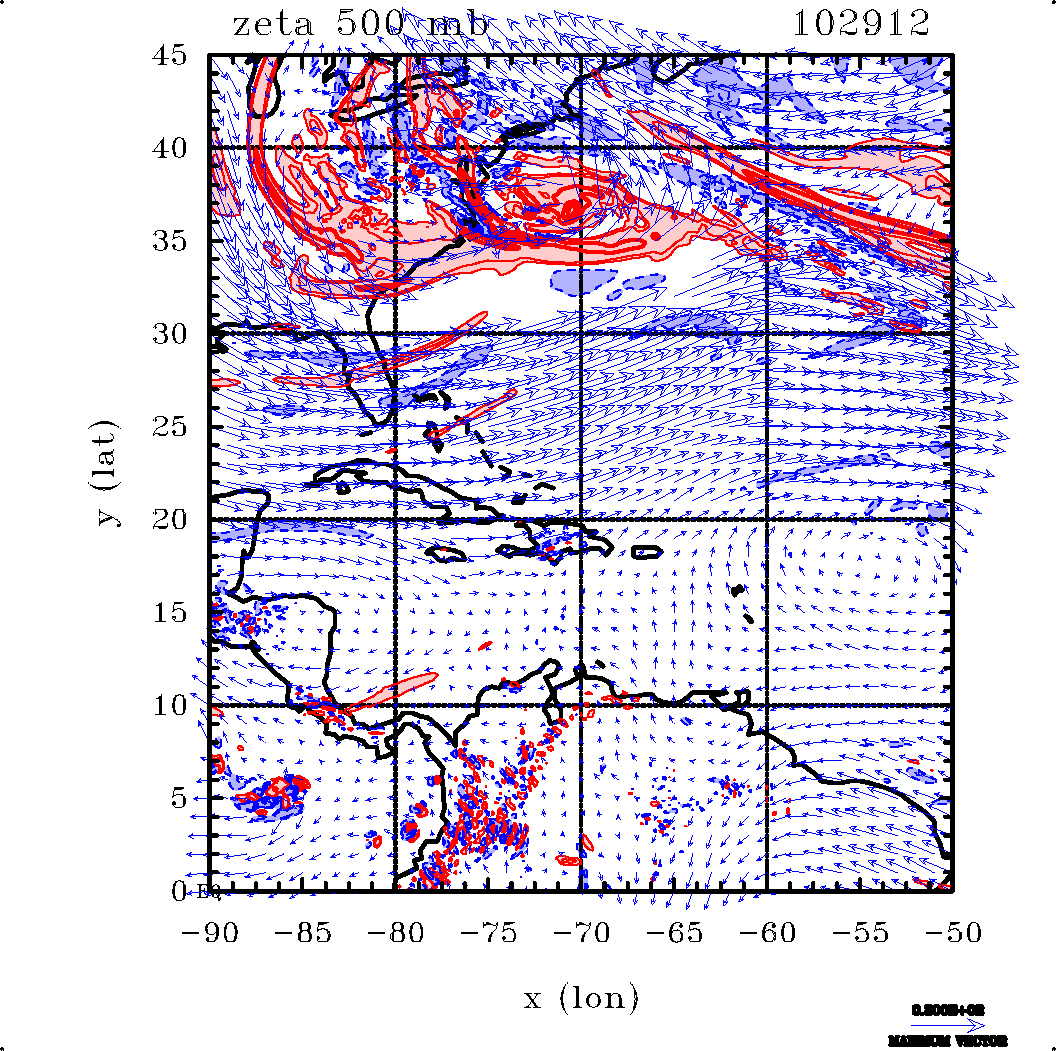
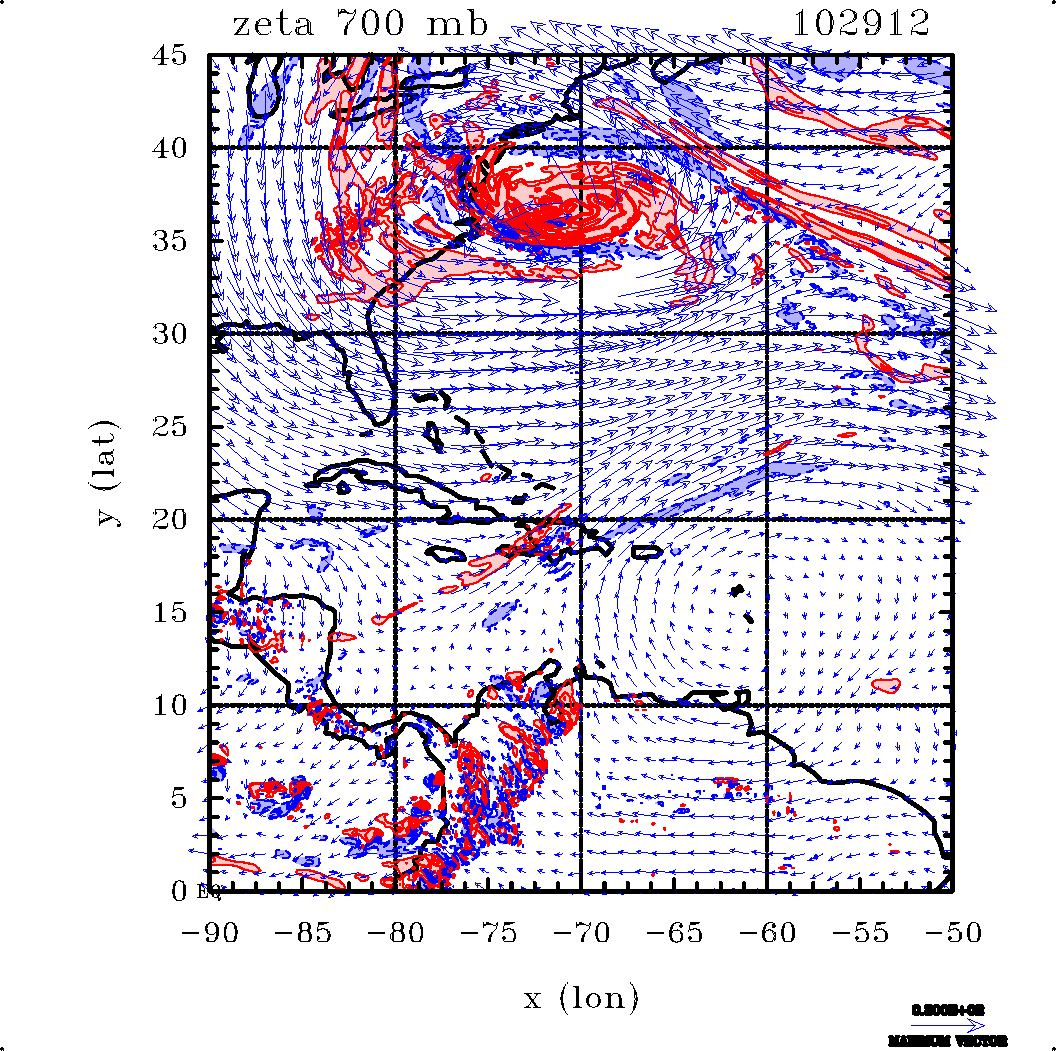
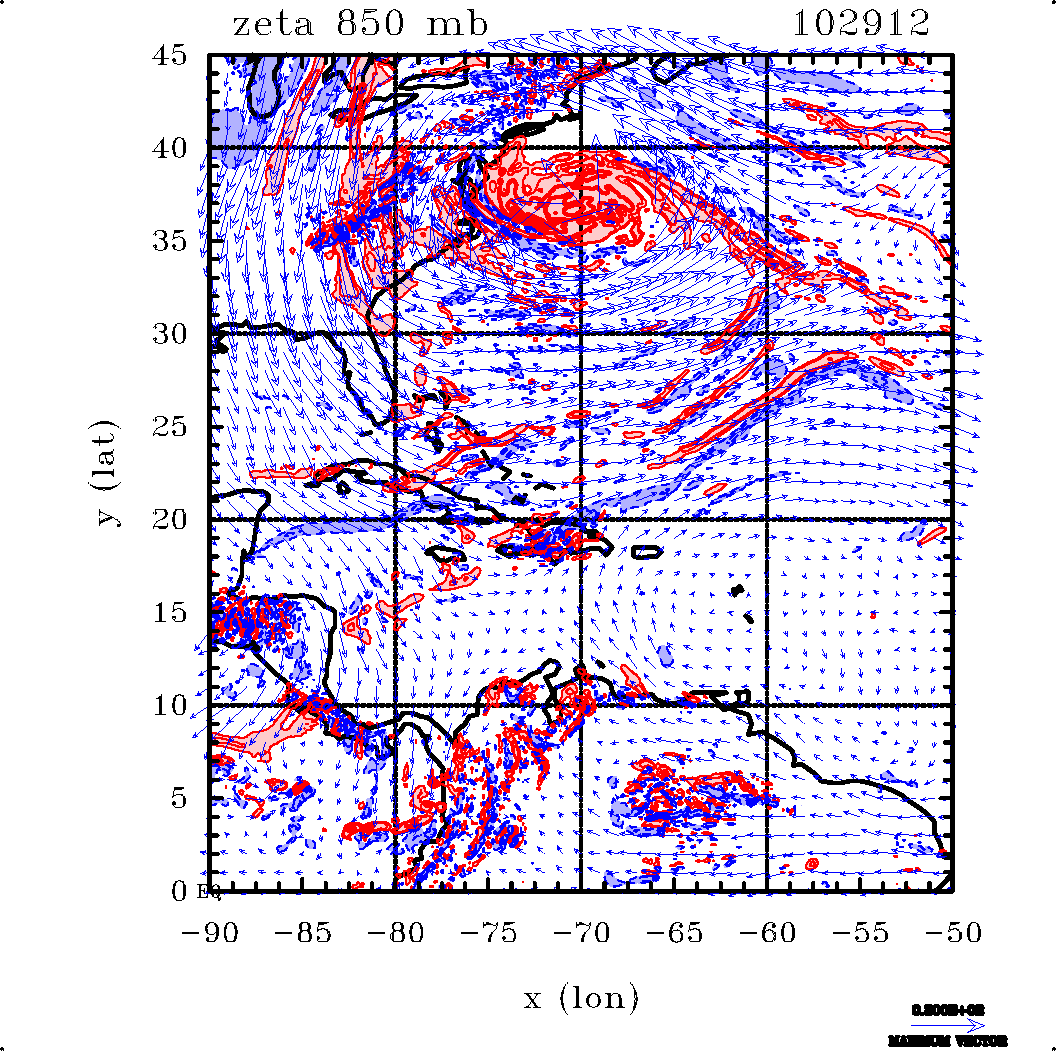
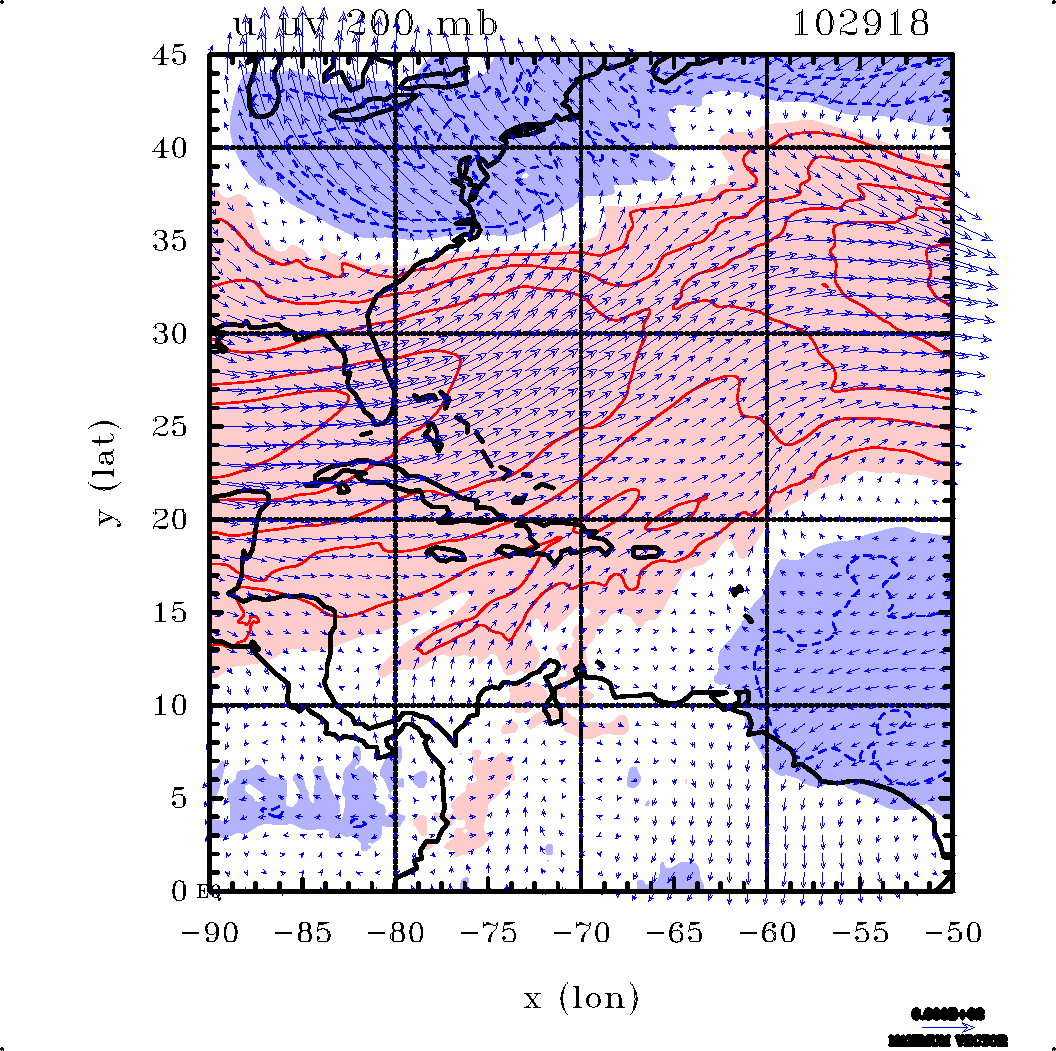
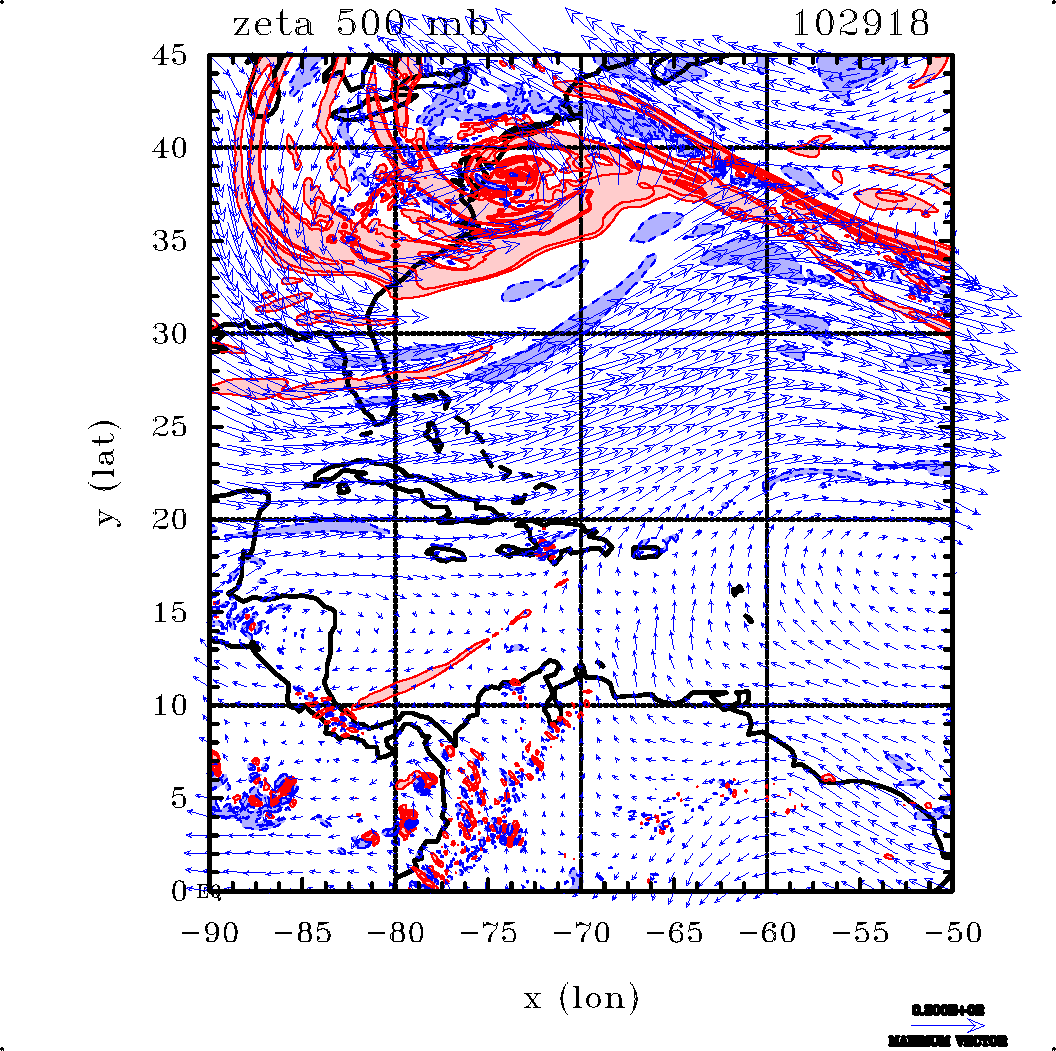
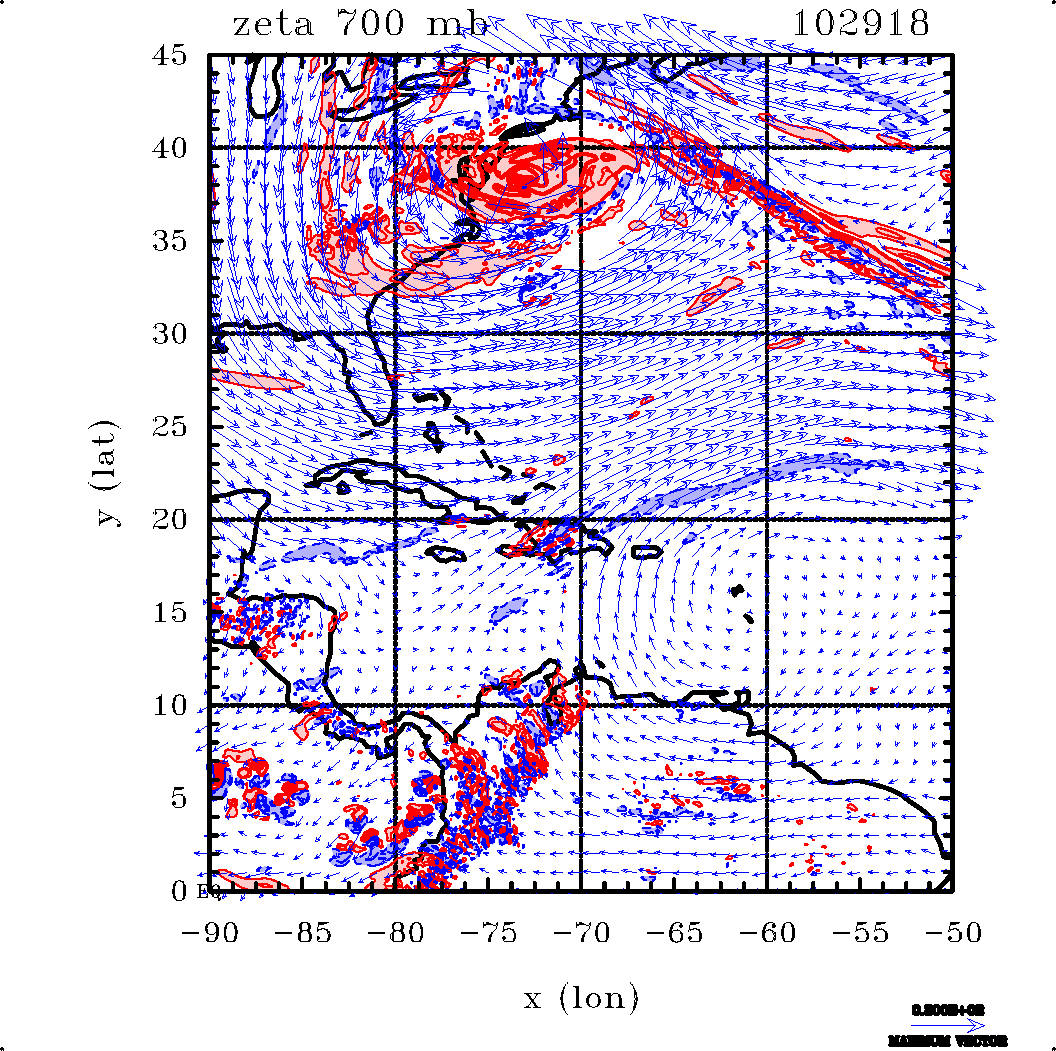
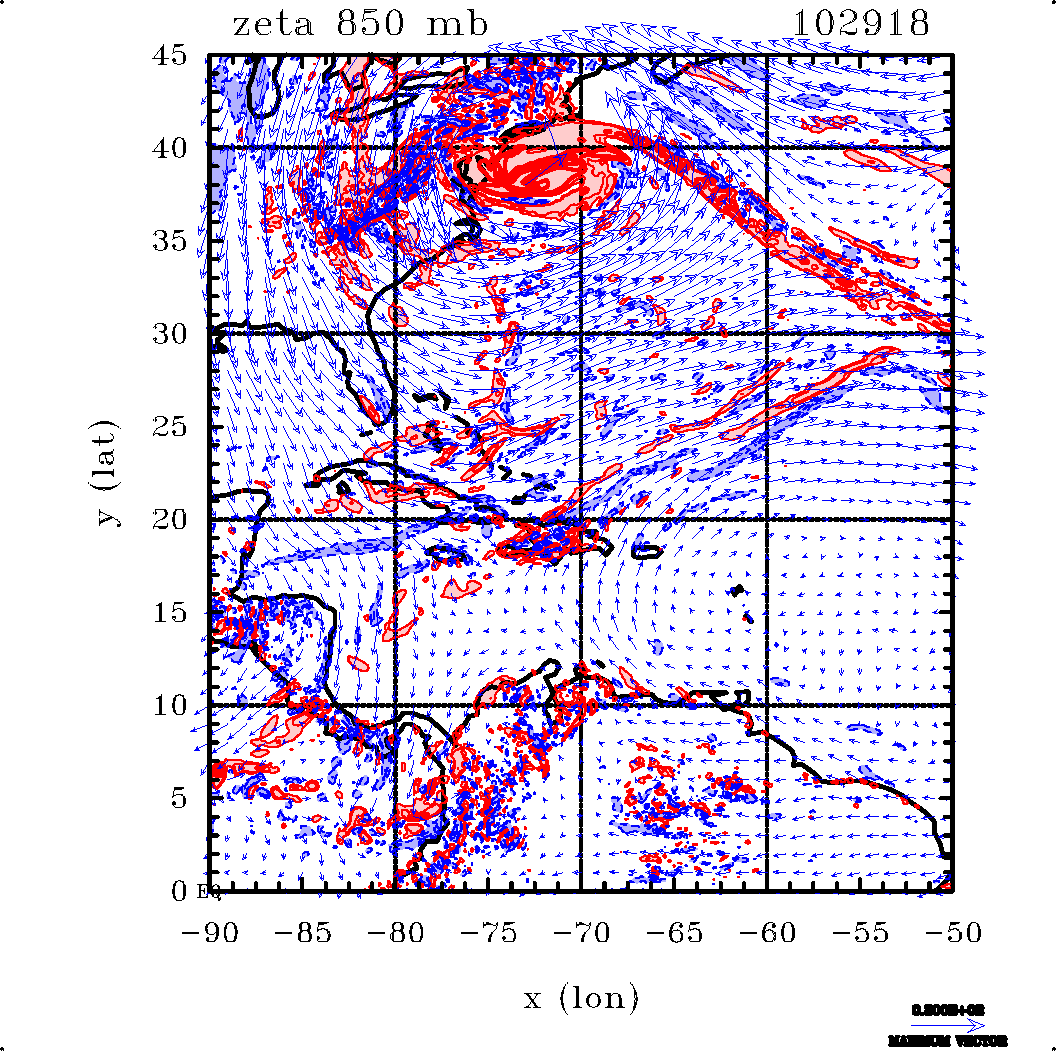
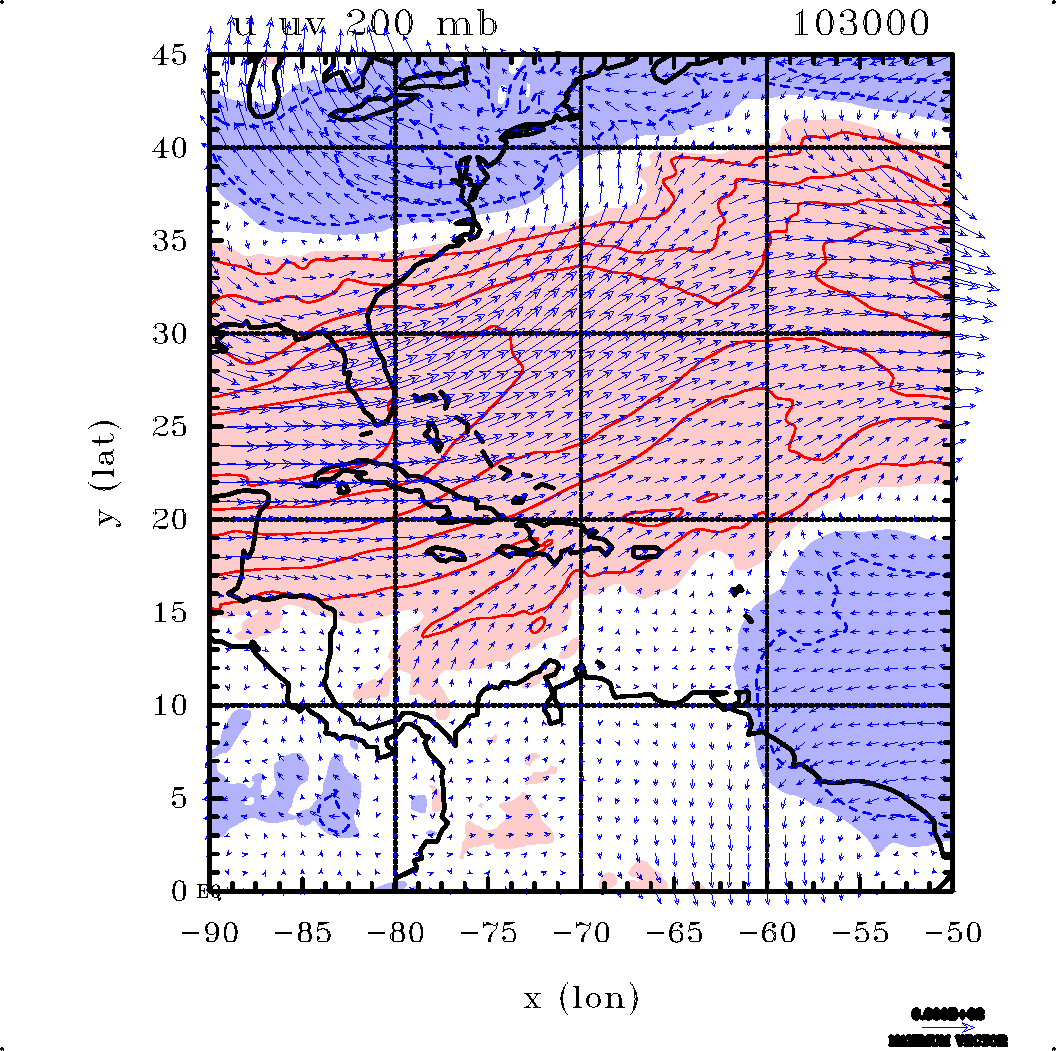
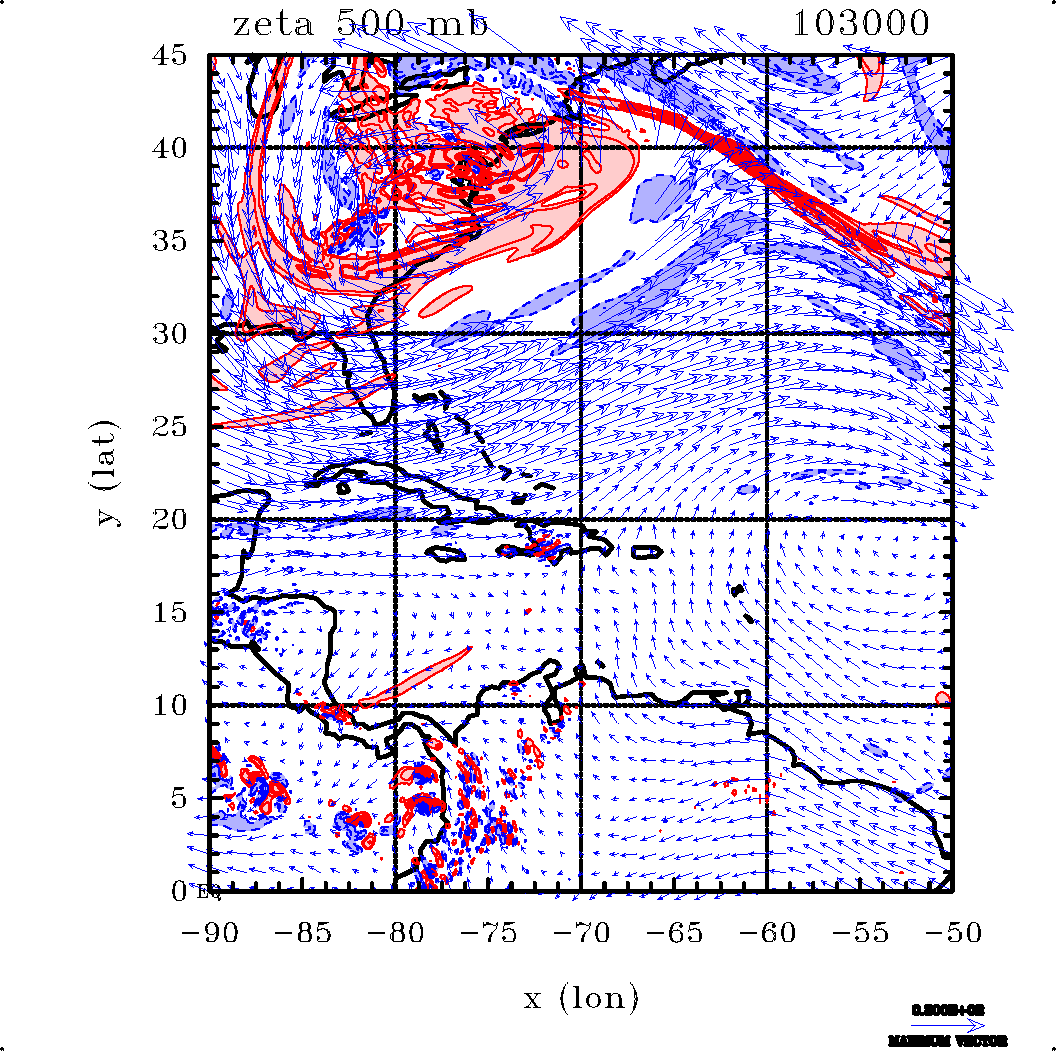
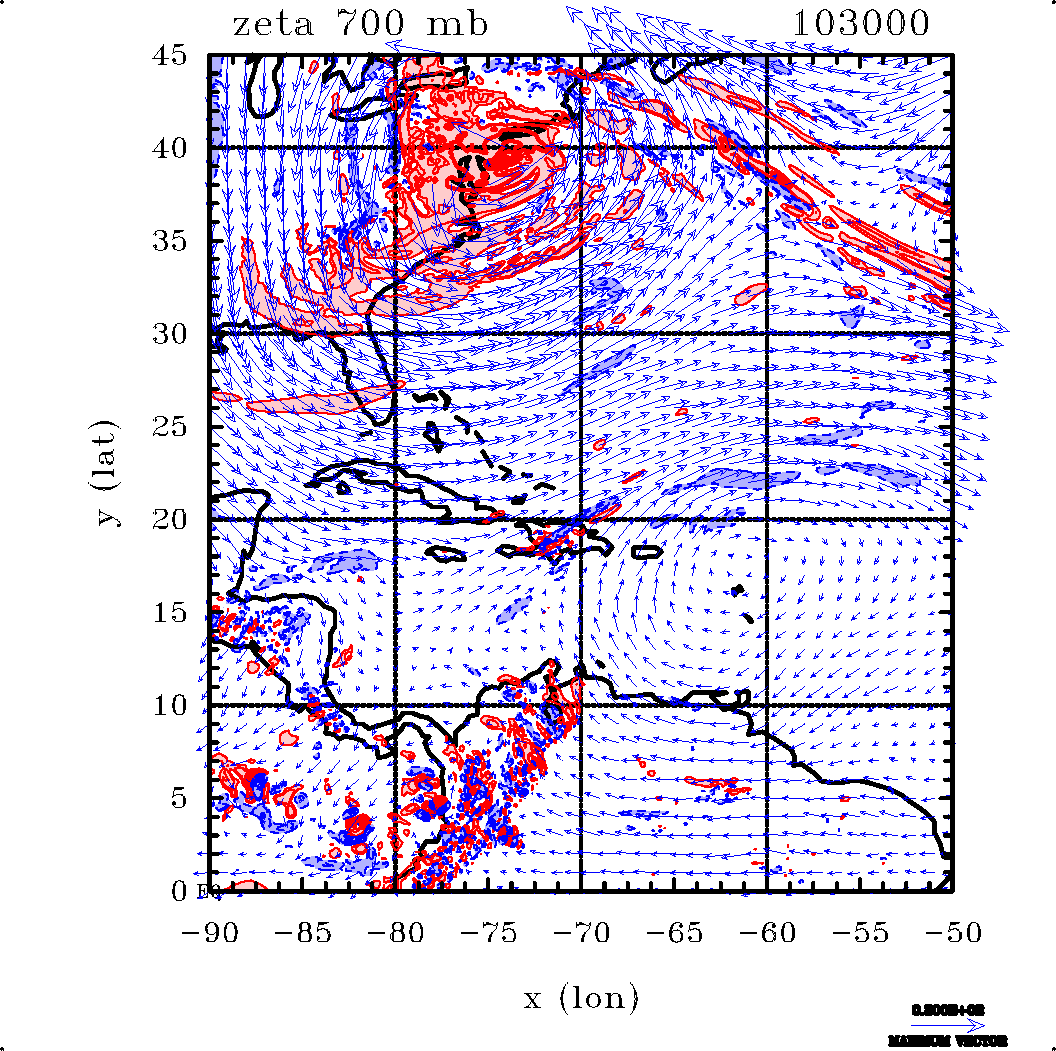
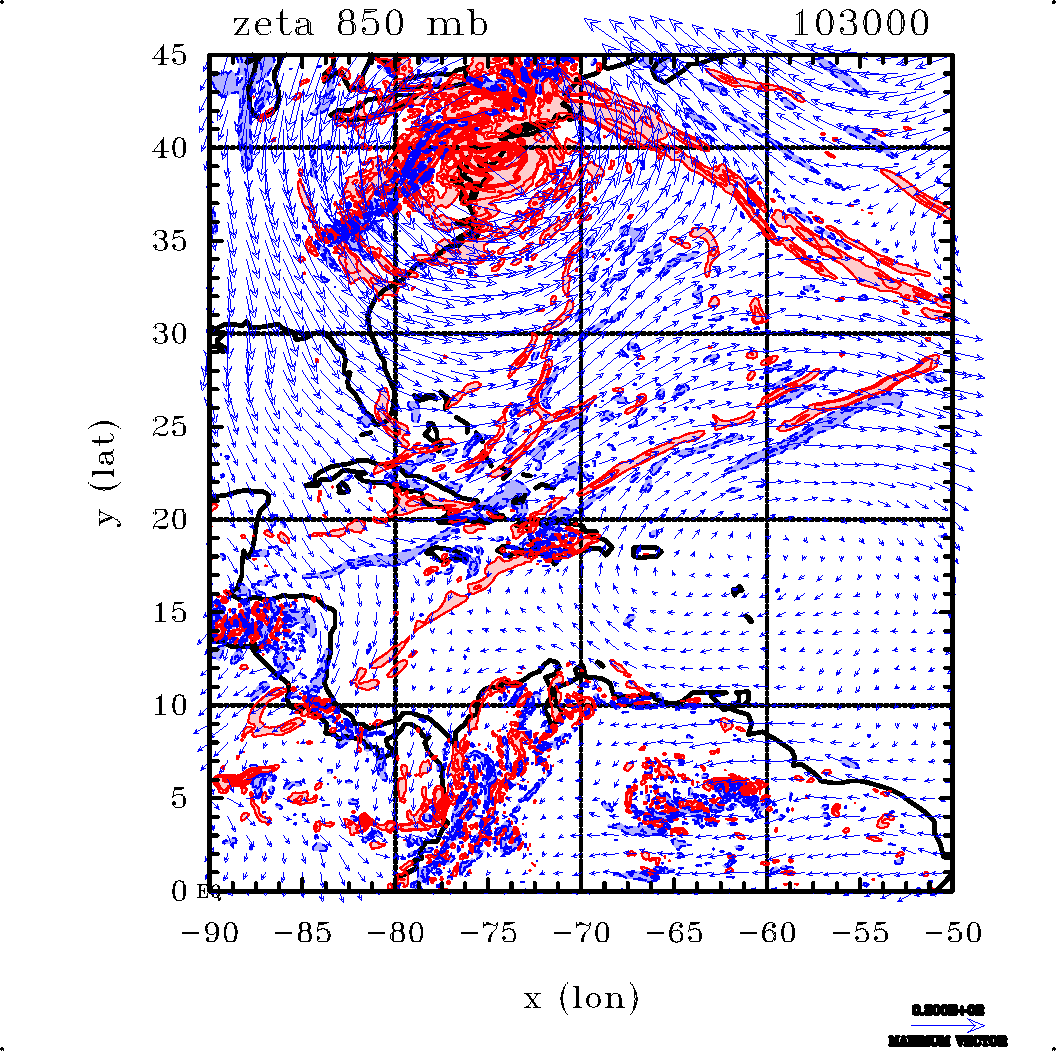
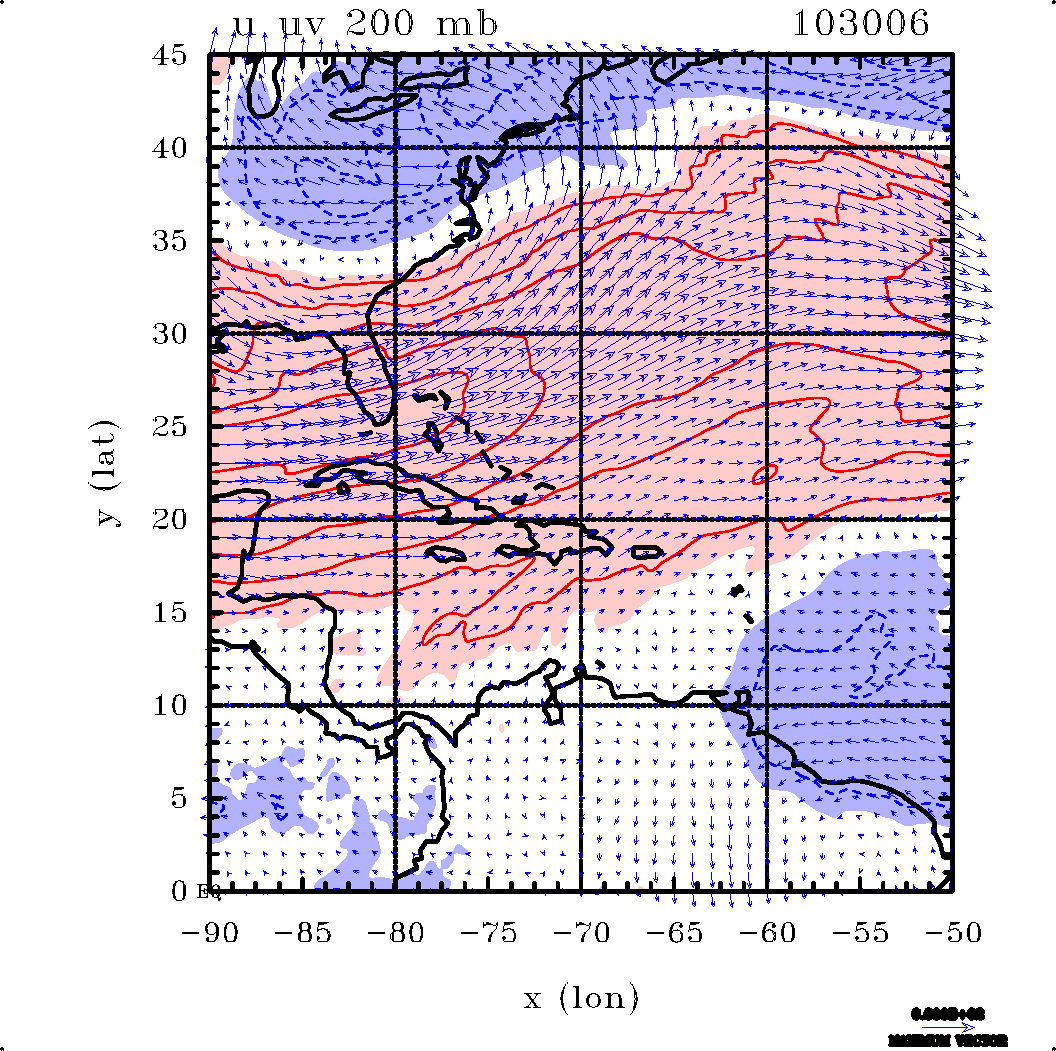
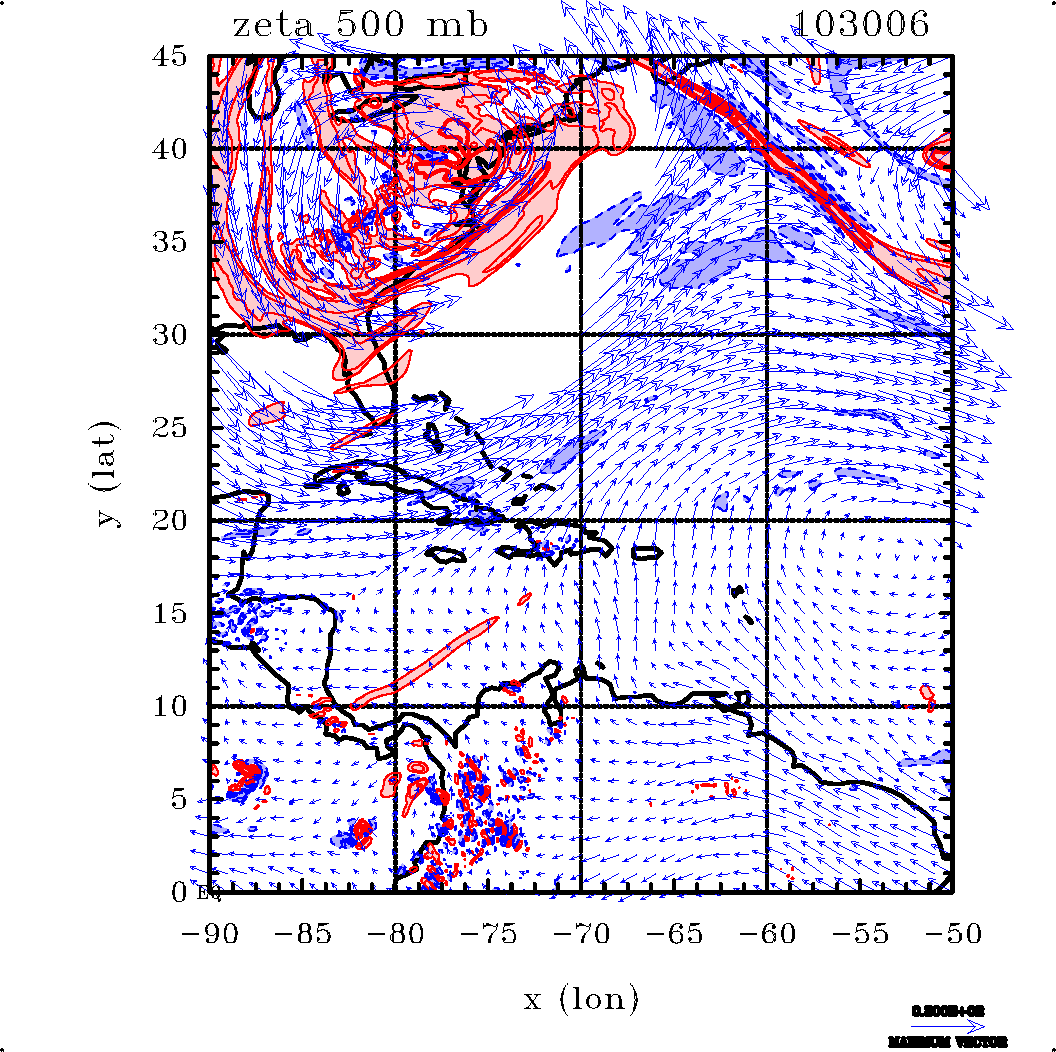
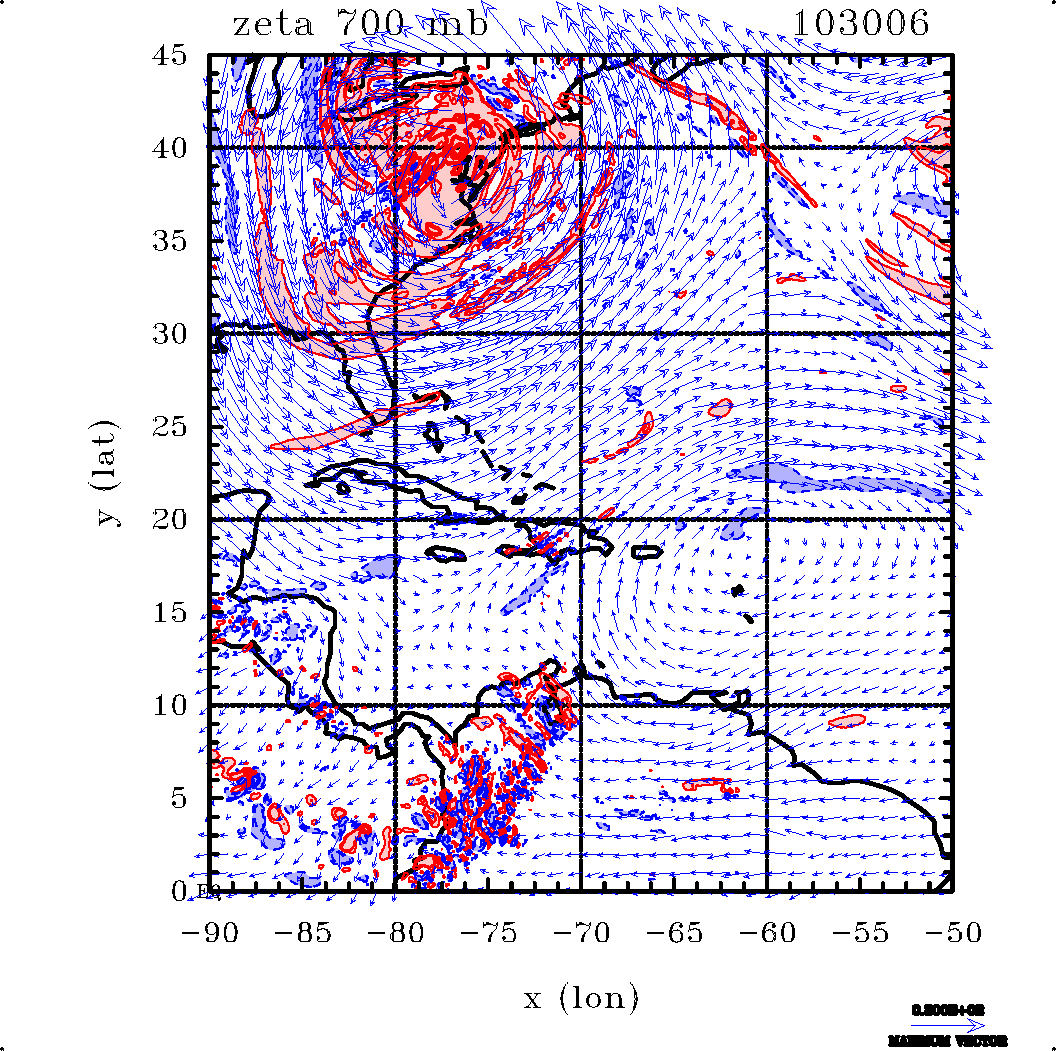
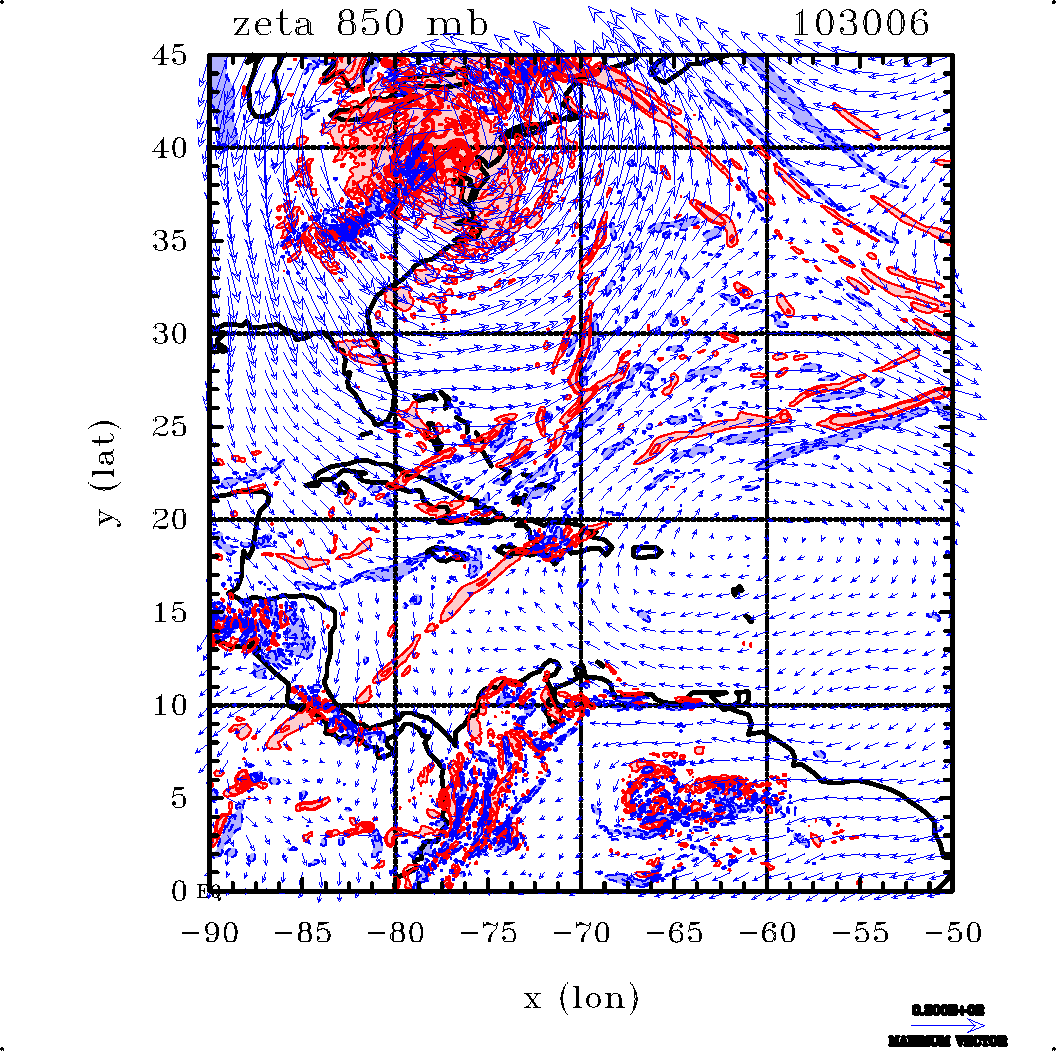
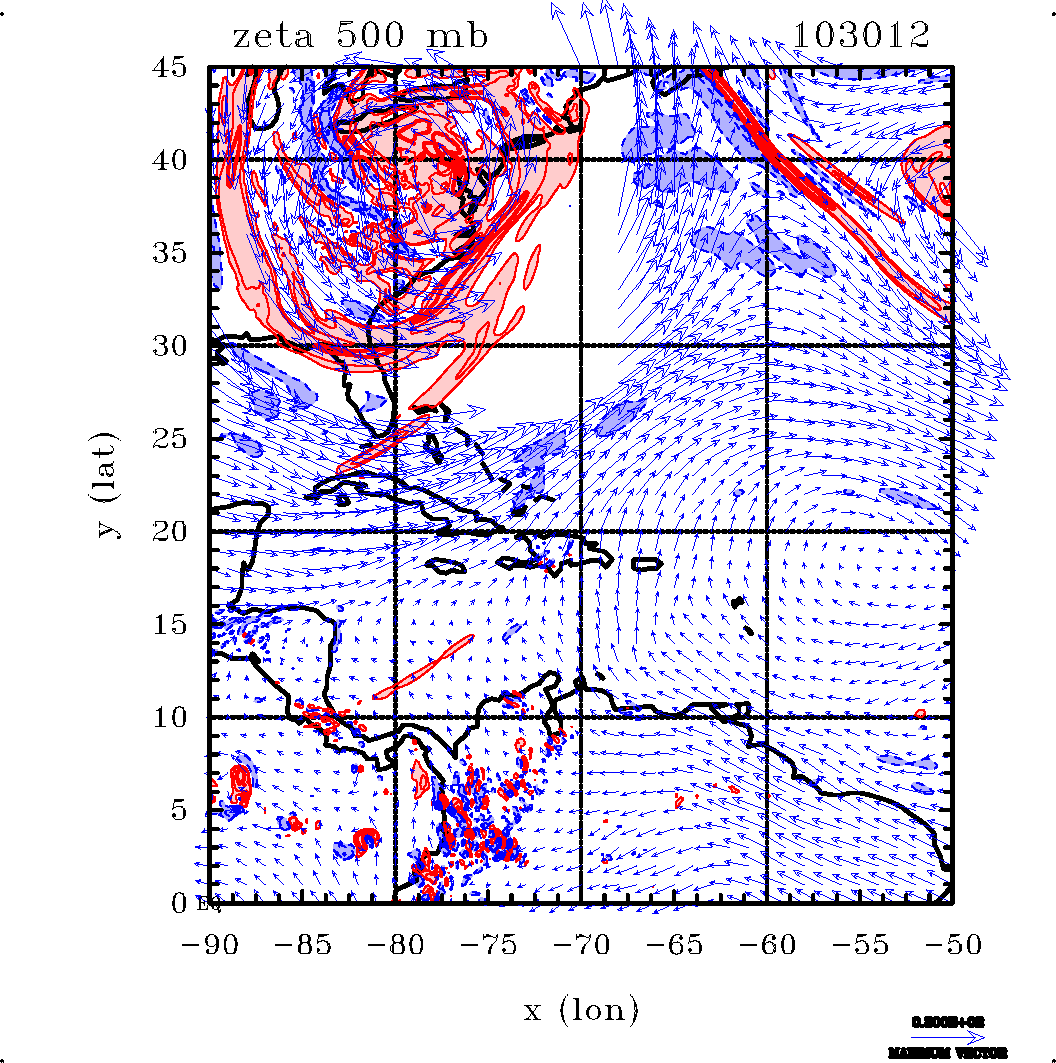
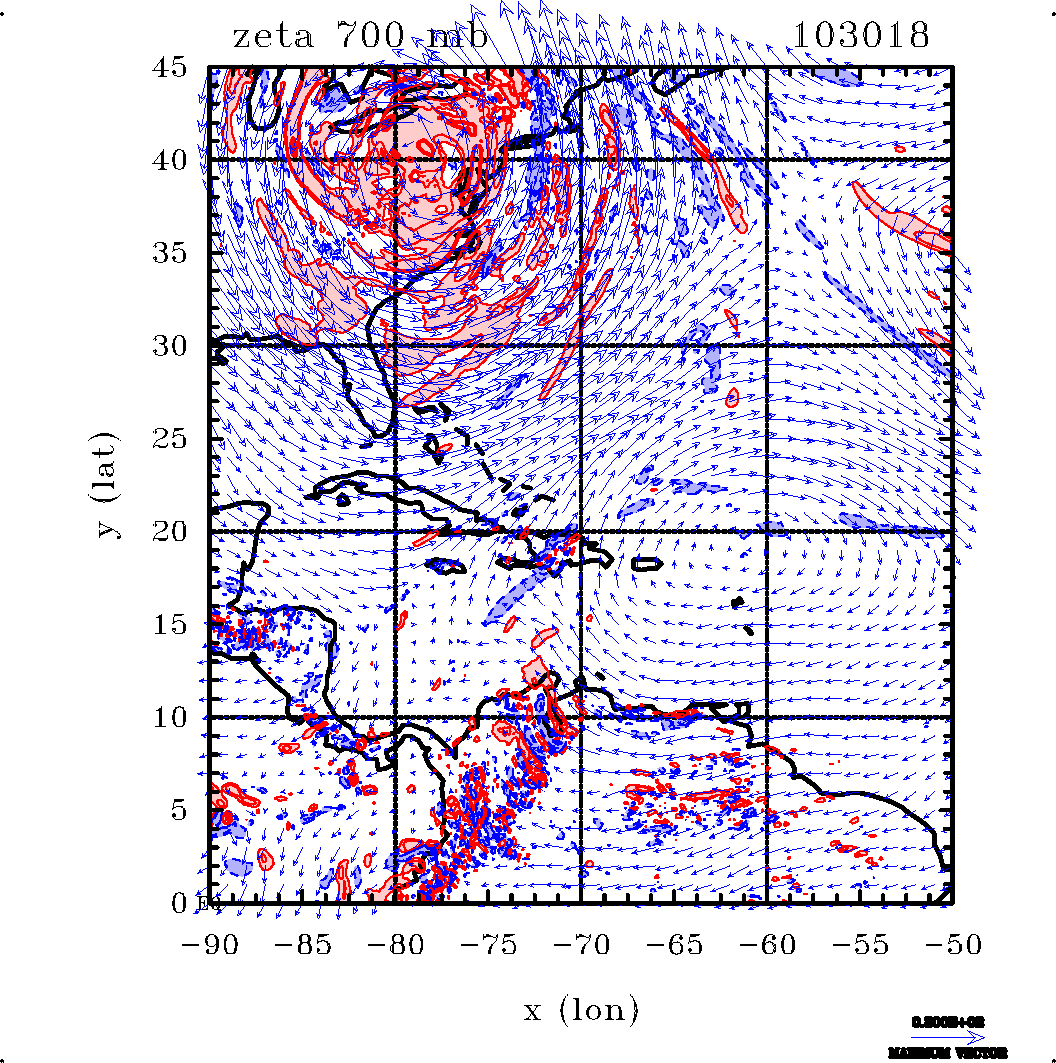
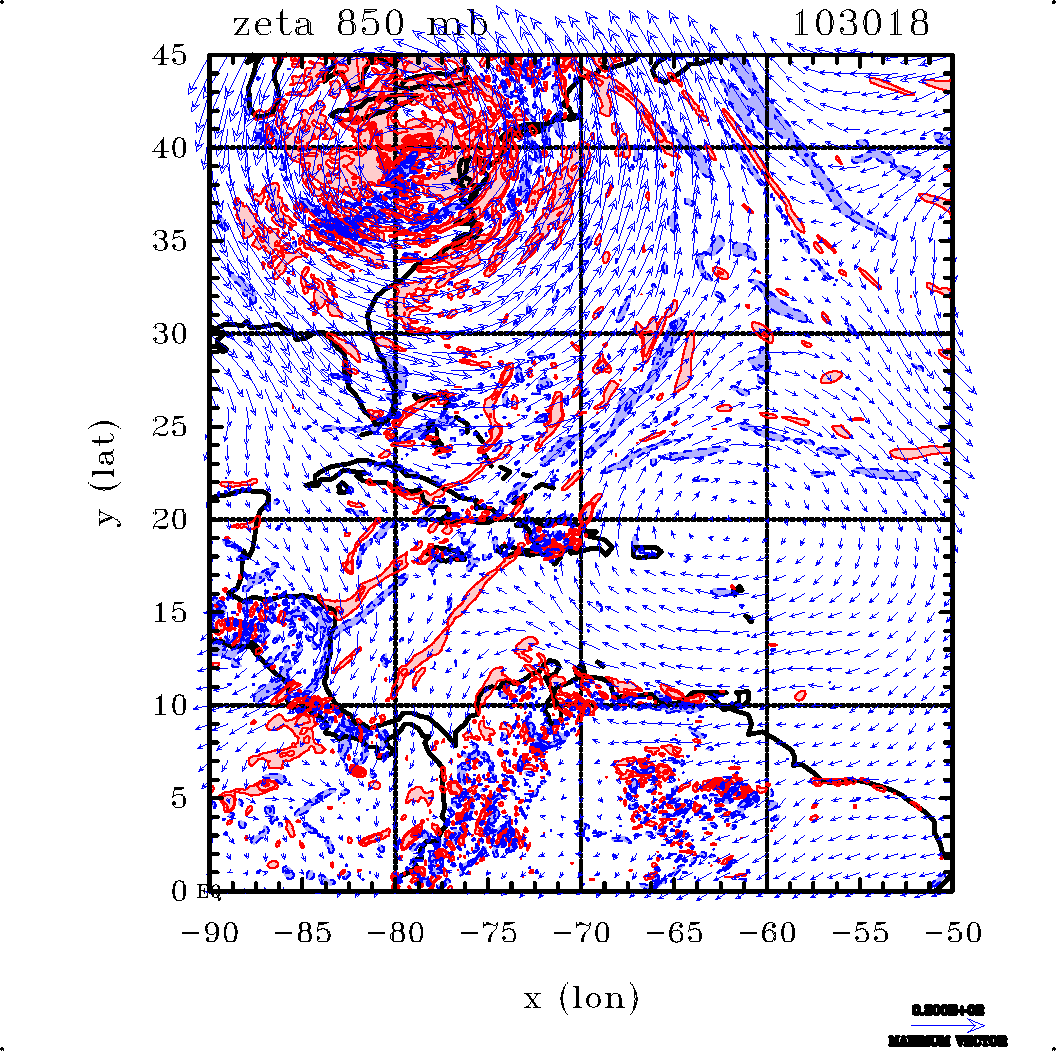
Wind vectors and contours of the vertical component of relatiove vorticity at selected pressure levels
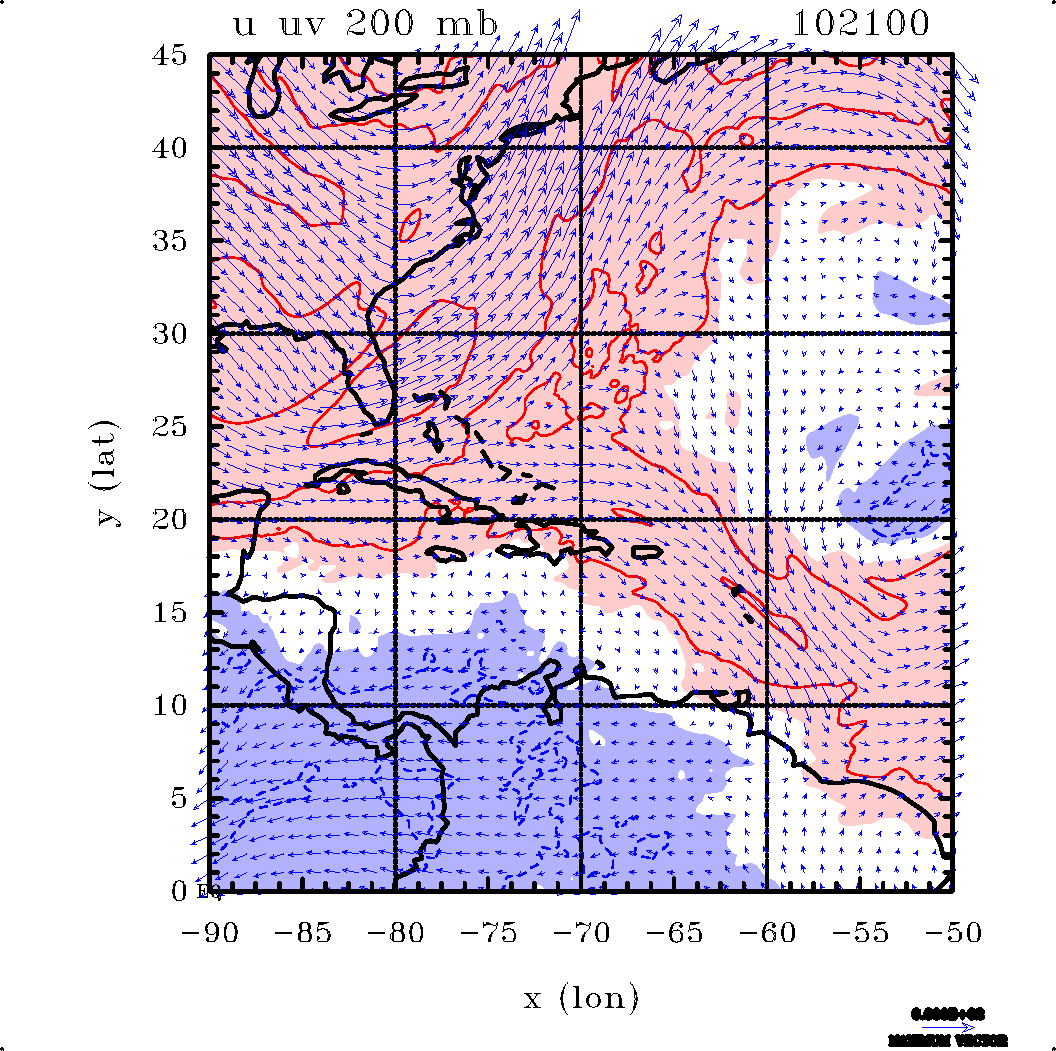
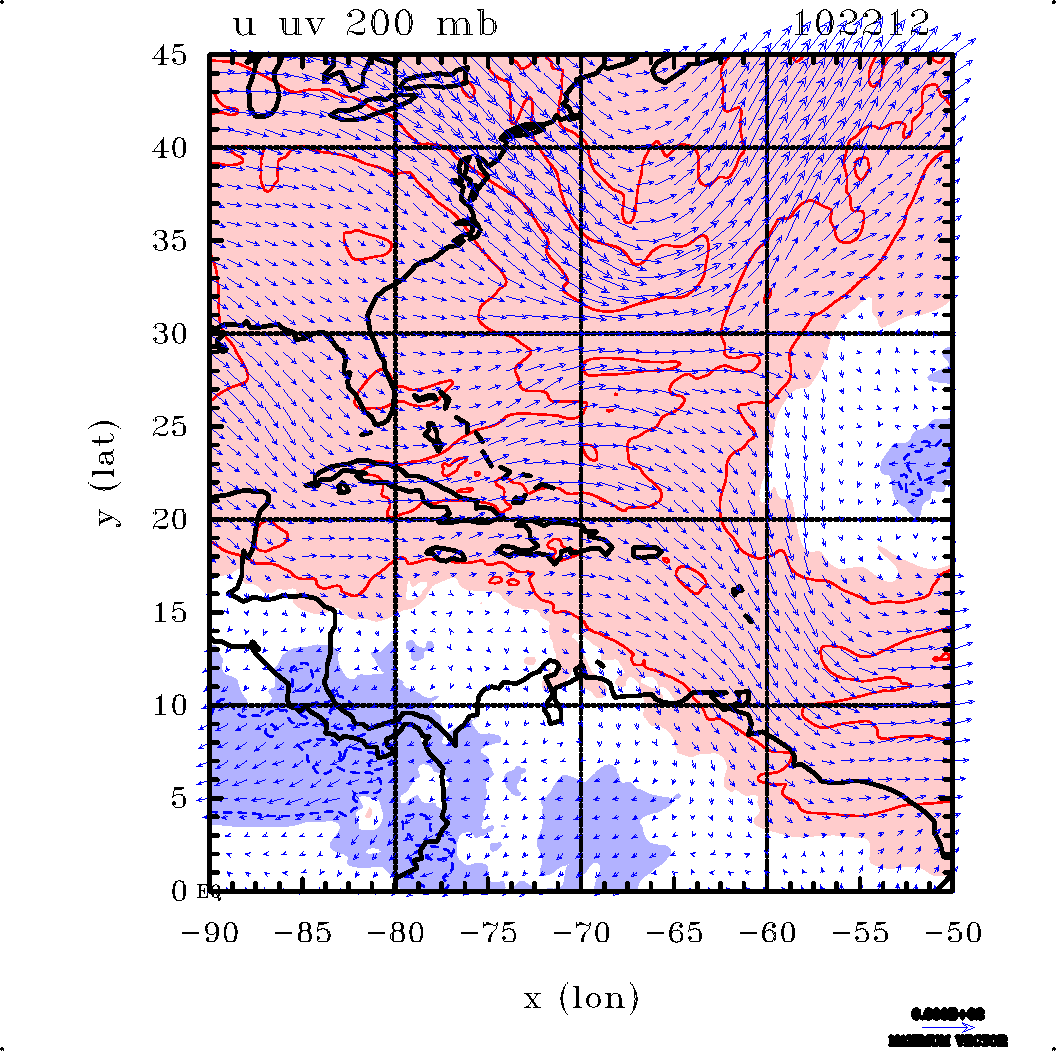
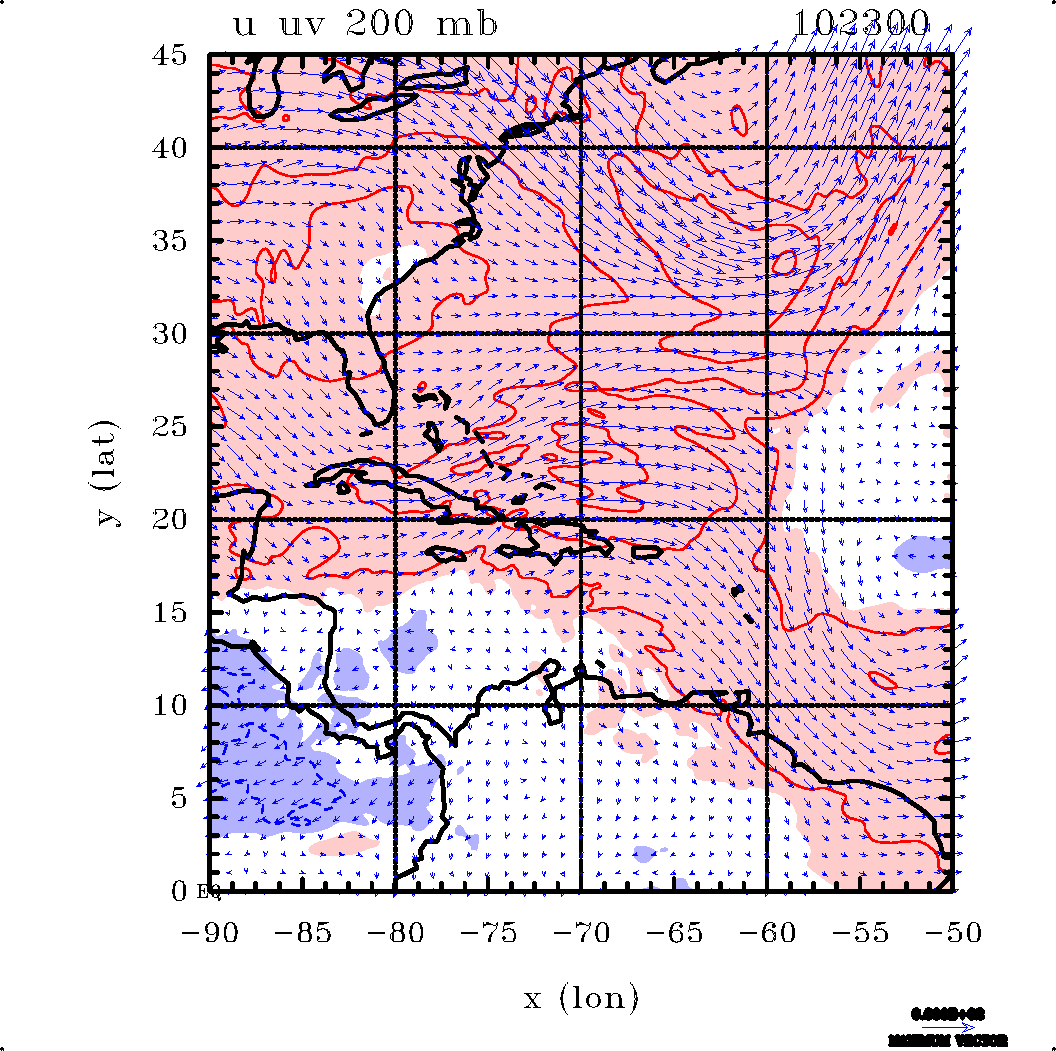
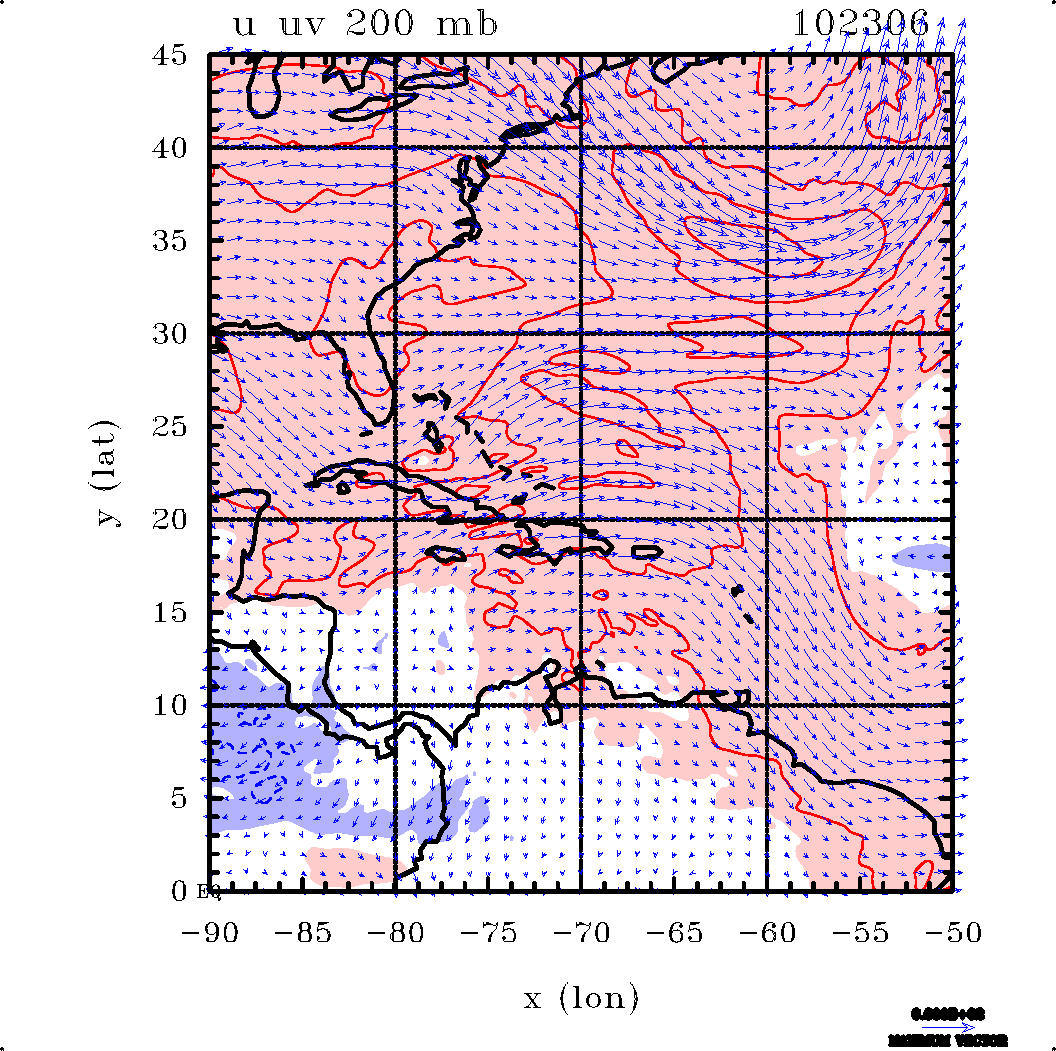
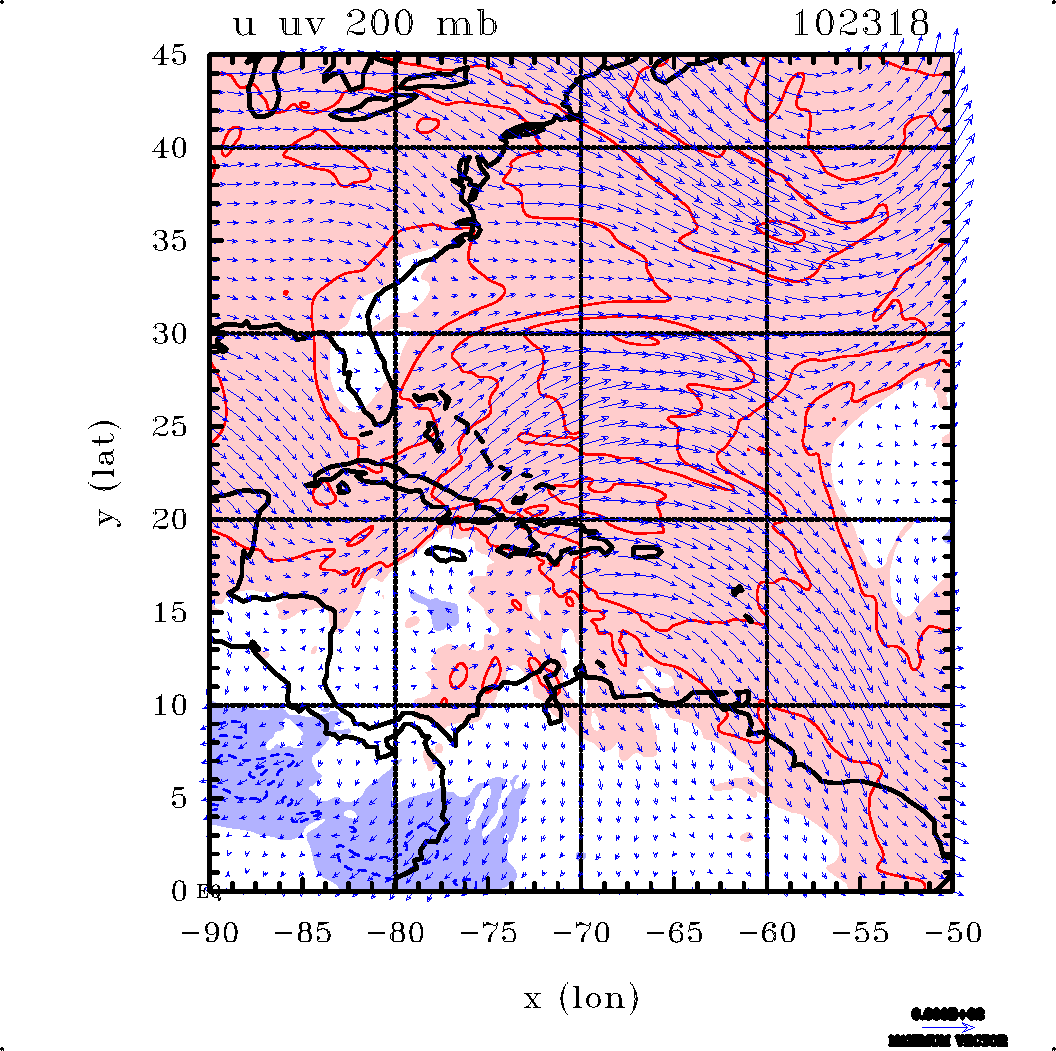
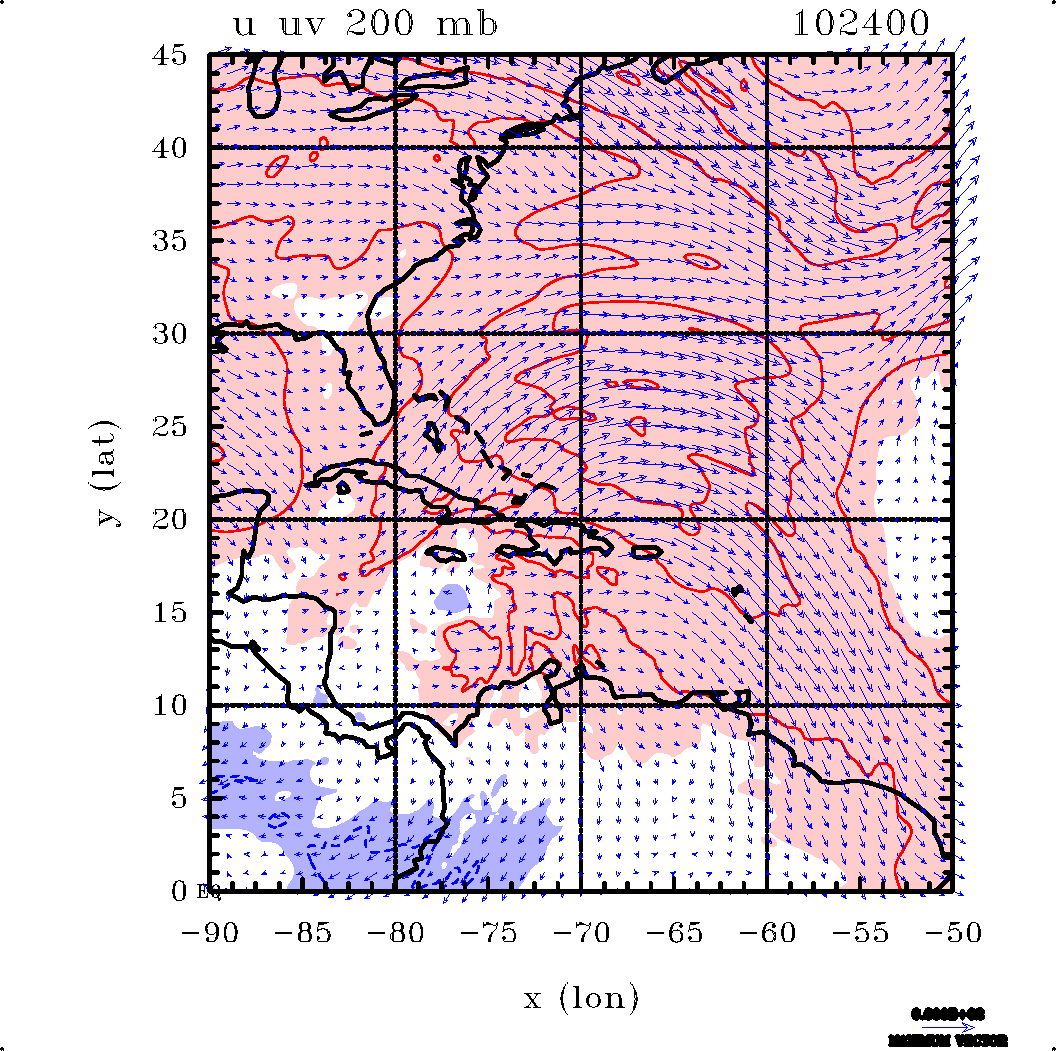
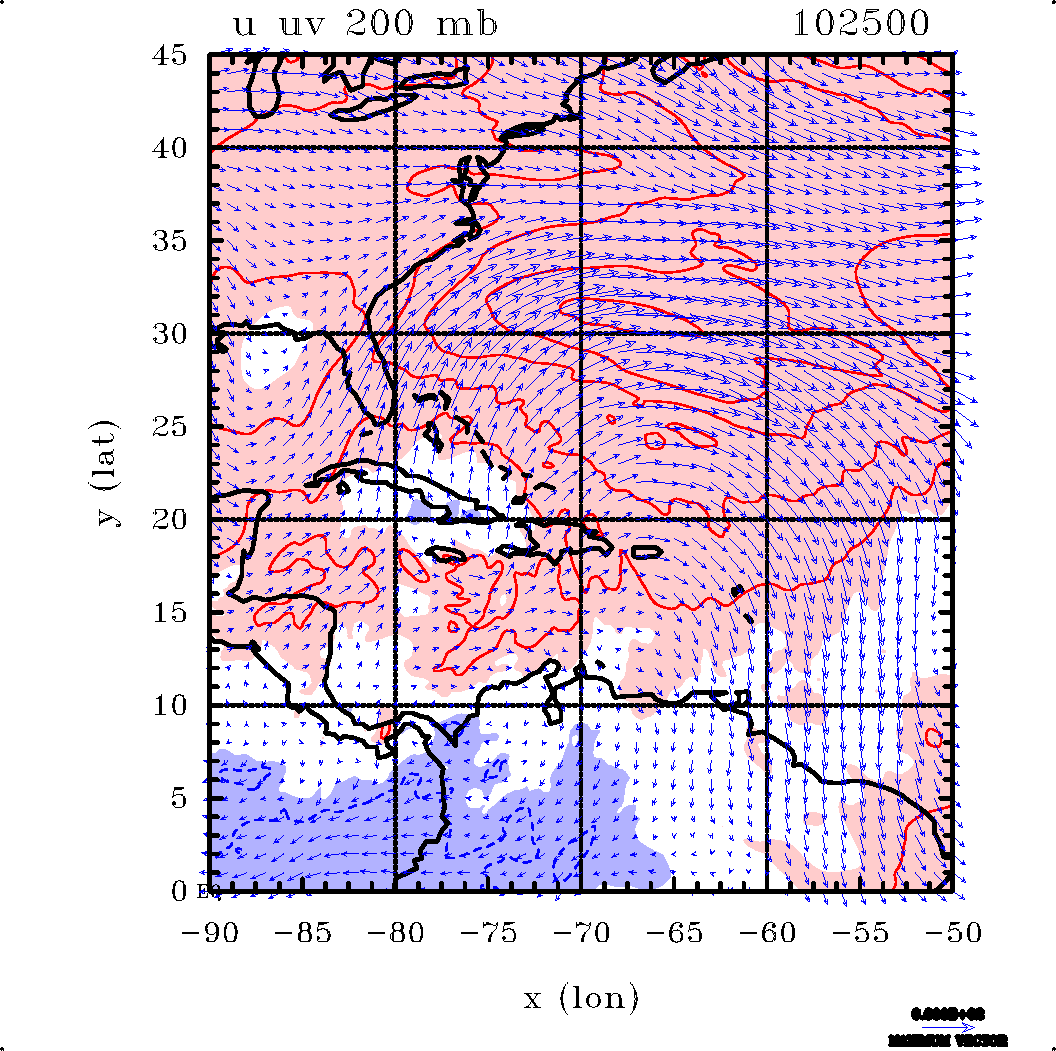
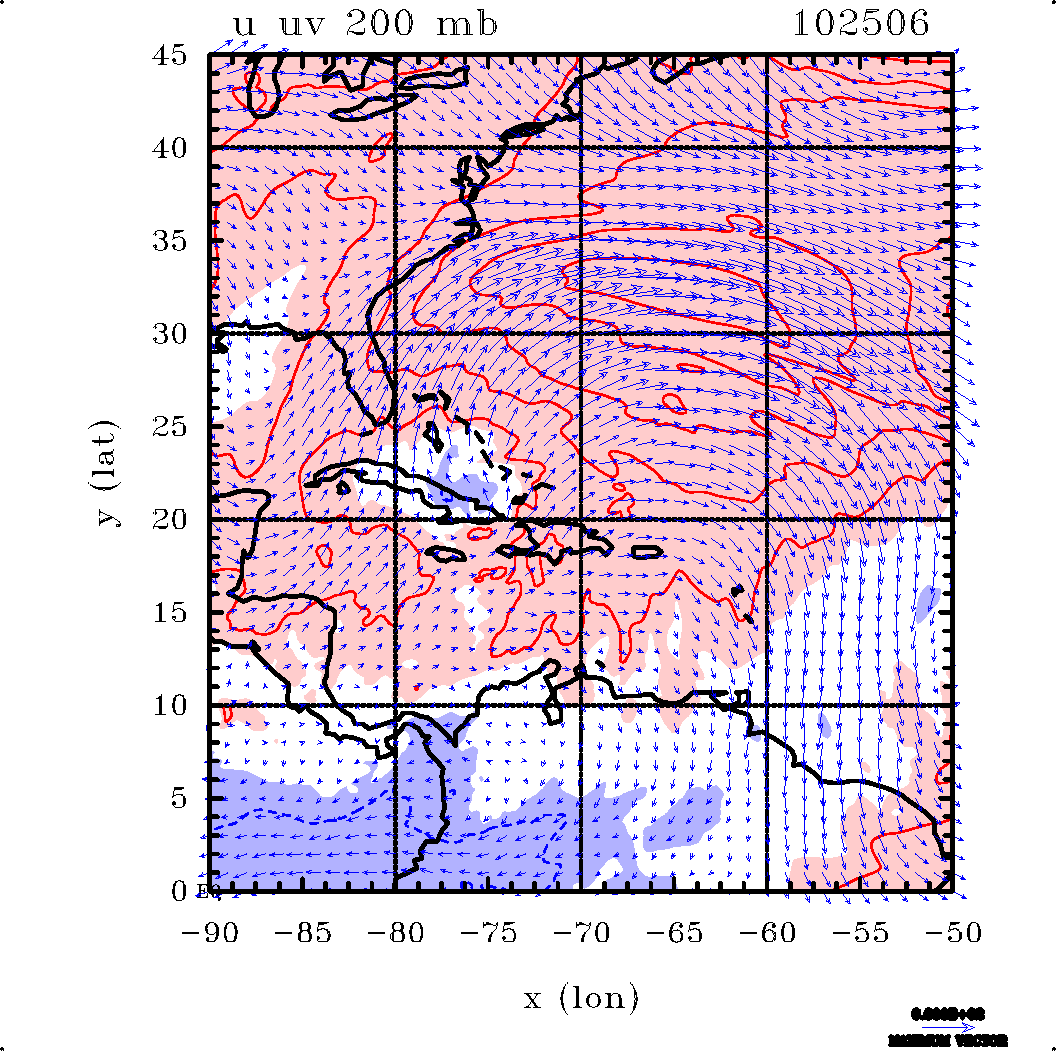
The following plots are in a four panel group. All panels show wind vectors. The top right shows wind vectors at 200 mb with contours of the zonal velocity component included. Contour levels for the zonal wind are 10 m s-1. Regions of westerly zonal wind speed > 5 m s-1 are shaded pink; regions of easterly zonal wind speed < -5 m s-1 shaded light blue. Negative contours blue/dashed. The top right panel shows the wind vectors at 500 mb with contours of the vertical component of relative vorticity superimposed. Contours of relative vorticity: thin contours 2 × 10 -5 s-1 (twice the value of the Coriolis parameter at 20oN), and 1 × 10 m s-4 s-1, thick contours 5 × 10 m s-4 s-1 and 1 × 10 m s-3 s-1. Positive values red/solid, negative values blue/dashed. Regions with values larger than 2 × 10 -5 s-1 are shaded pink, those with values larger than 2 × 10 -5 s-1 are shaded light blue. The lower panels show the corresponding fields at 700 mb and 850 mb as indicated.
 |  |
 |  |
 |  |
 |  |
 |  |
 |  |
 |  |
 |  |
 |  |
 |  |
 |  |
 |  |
 |  |
 |  |
 |  |
 |  |
 |  |
 |  |
 |  |
 |  |
 |  |
 |  |
 |  |
 |  |
 |  |
 |  |
|  |
 |  |
 |  |
 |  |
 |  |
 |  |
 |  |
 |  |
 |  |
 |  |
 |  |
 |  |
 |  |
 |  |
 |  |
 |  |
 |  |
 |  |
 |  |
 |  |
 |  |
 |  |
 |  |
 |  |
 |  |
 |  |
 |  |
 |  |
 |  |
 |  |
 |  |
 |  |
 |  |
 |  |
 |  |
 |  |
 |  |
 |  |
 |  |
 |  |
 |  |
 |  |
 |  |
 |  |
 |  |
 |  |
 |  |
 |  |
 |  |
 |  |
 |  |
 |  |
 |  |
 |  |
 |  |
 |  |
 |  |
 |  |
 |  |
 |  |
 |  |
 |  |
 |  |
 |  |
 |  |
 |  |
 |  |
 |  |
 |  |
 |  |
 |  |
 |  |
 |  |
 |  |
 |  |
 |  |
 |  |
 |  |
 |  |
 |  |
 |  |
 |  |
 |  |
 |  |
 |  |
 |  |
 |  |
 |  |
 |  |
 |  |
 |  |
 |  |
 |  |
 |  |
 |  |
 |  |
 |  |
 |  |
 |  |
| |
Copyright © Roger Smith