Continental cold fronts in the subtropics and tropics
Cold fronts in the Australian region
The classical models for cold and warm fronts developed in the 1920's by the Bergen School of meteorologists have survived as important components of a model for the evolution of synoptic-scale low pressure systems in the middle latitudes. However, the reluctance of Australian meteorologists to analyze warm fronts over the Australian continent and unusual features of summertime cold fronts in southeastern Australia (some of them can be virtually cloud free) cast doubt on the utility of the Norwegian model for extratropical cyclones over the Australian continent. Indeed, Lammert (1932) noted that cold fronts in the Australian region tended to have much larger temperature contrasts to those in Europe, especially in summer time, and he attributed this feature to the large temperature contrast between the hot continent and the maritime environment to the south that was dominated by the presence of Antarctica.
Recognition of the deficiencies of the classical model of cold fronts in the region led to the instigation of a Cold Fronts Research Programme in Australia in the late 70's and early 80's (Smith et al. 1982). A special focus was on the summertime "cool change", a kind of cold front that that brings relief to communities in the southern part of the continent after sometimes many days of scorching hot northerly winds from the continent. Three field experiments were organized as part of the research programme and these, together with theoretical and numerical studies that the programme stimulated, produced a new conceptual model of the cool change which differed considerably in detail from the classical Norwegian model. Unlike the classical cold front, many summertime cool changes were shallow and completely dry and it was evident that deep turbulent mixing over the strongly heated continent had an important role in the structure of these fronts. A review of the summertime cool change and a comprehensive list of references thereon is given by Reeder and Smith (1998).
Despite progress in understanding the structure of the summertime cold front, there was still a reluctance by forecasters to analyse cold fronts very far into the interior of the continent, even though the front may be connected to a parent low over the Southern Ocean. Rather, the equatorwards portion of the surface cold front was analysed as an inland trough line, sometimes extending as far north as the southern part of the Gulf of Carpentaria. Even so, Lammert (1932) was aware that, on occasion, the cooler air may extend well into the tropics, even reaching the gulf (see his Fig. 5).
An interest in cold fronts at subtropical and even tropical latitudes was awakened by attemts to determine the origin of southerly morning glory cloud lines, the existence of which was suggested in data from arrays of microbarometers deployed in the region by Dr. Doug. Christie and colleagues from the Australian National University (Christie et al. 1979) and confirmed on the last day of the first major field experiment to study the morning glory (Smith and Goodfield 1981, Clarke et al. 1981). Like their more frequent northeasterly counterparts, southerly morning glories are now known to be an example par excellence of undular bore-wave disturbances in the lower atmosphere; they are the atmospheric equivalent of undular bores that occur on some tidal rivers. A summary of southerly morning glories observed during field experiments in the early 80's and an analysis of synoptic conditions for each event pointed to the likely role of the inland heat trough as a ridge of high pressure extended eastwards across the continent (Smith et al. 1986).
Field experiments
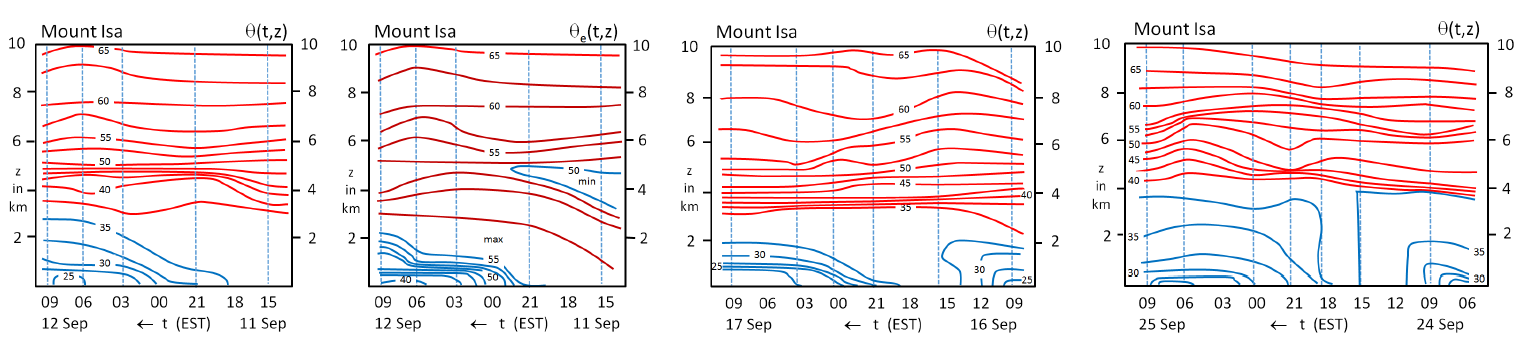
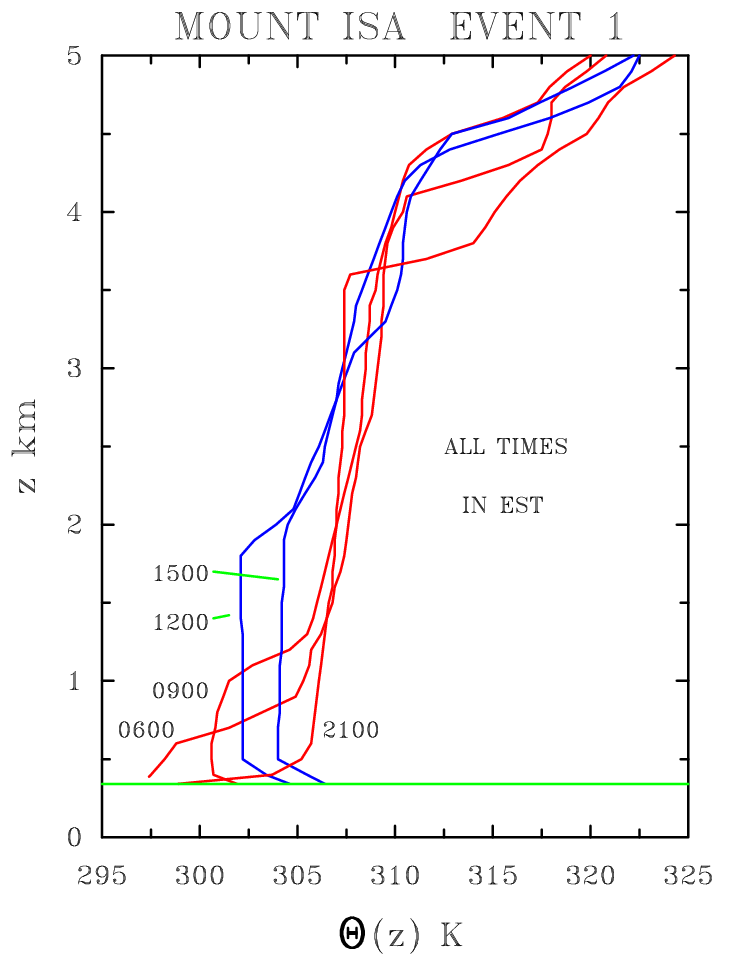
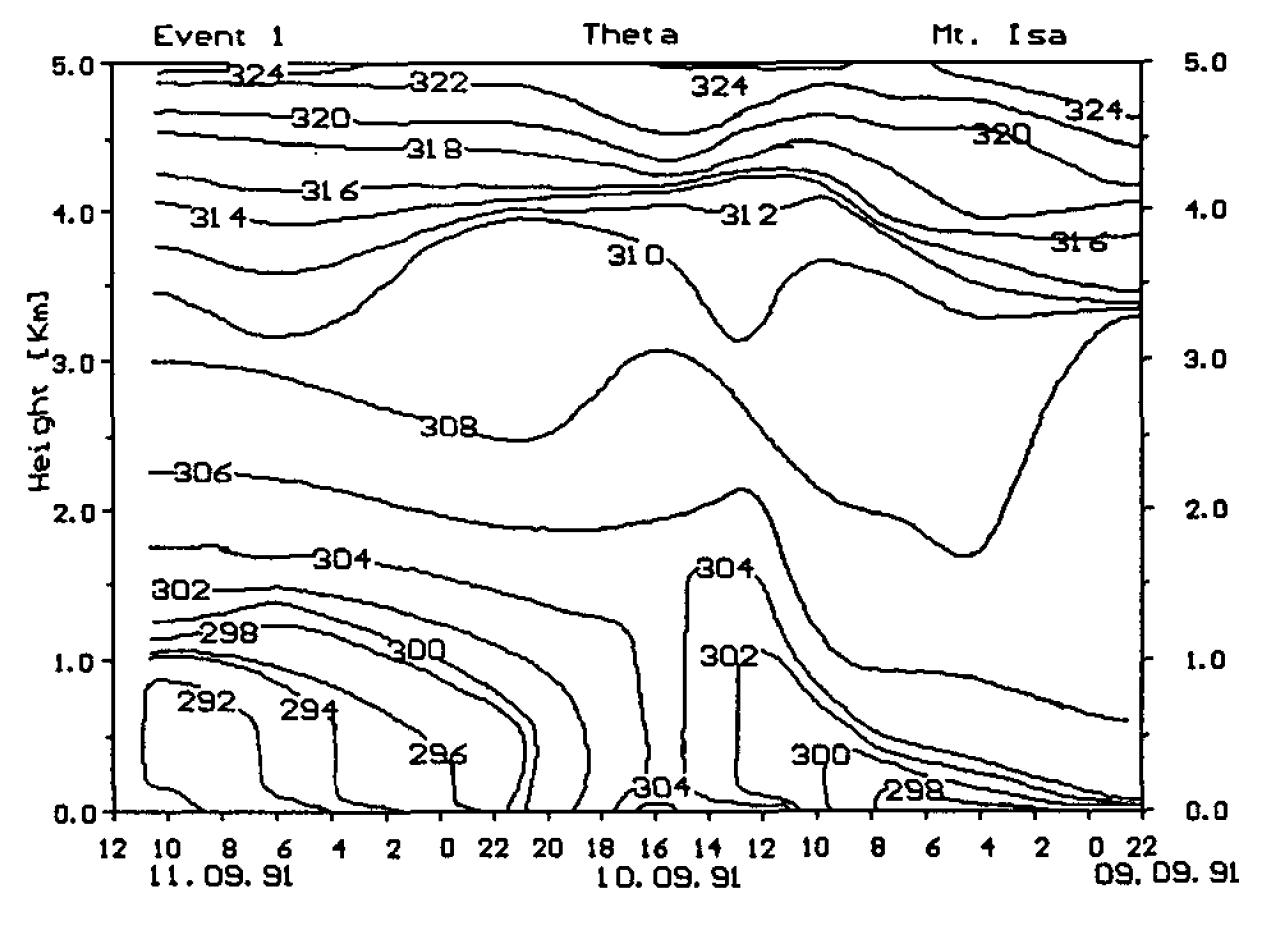
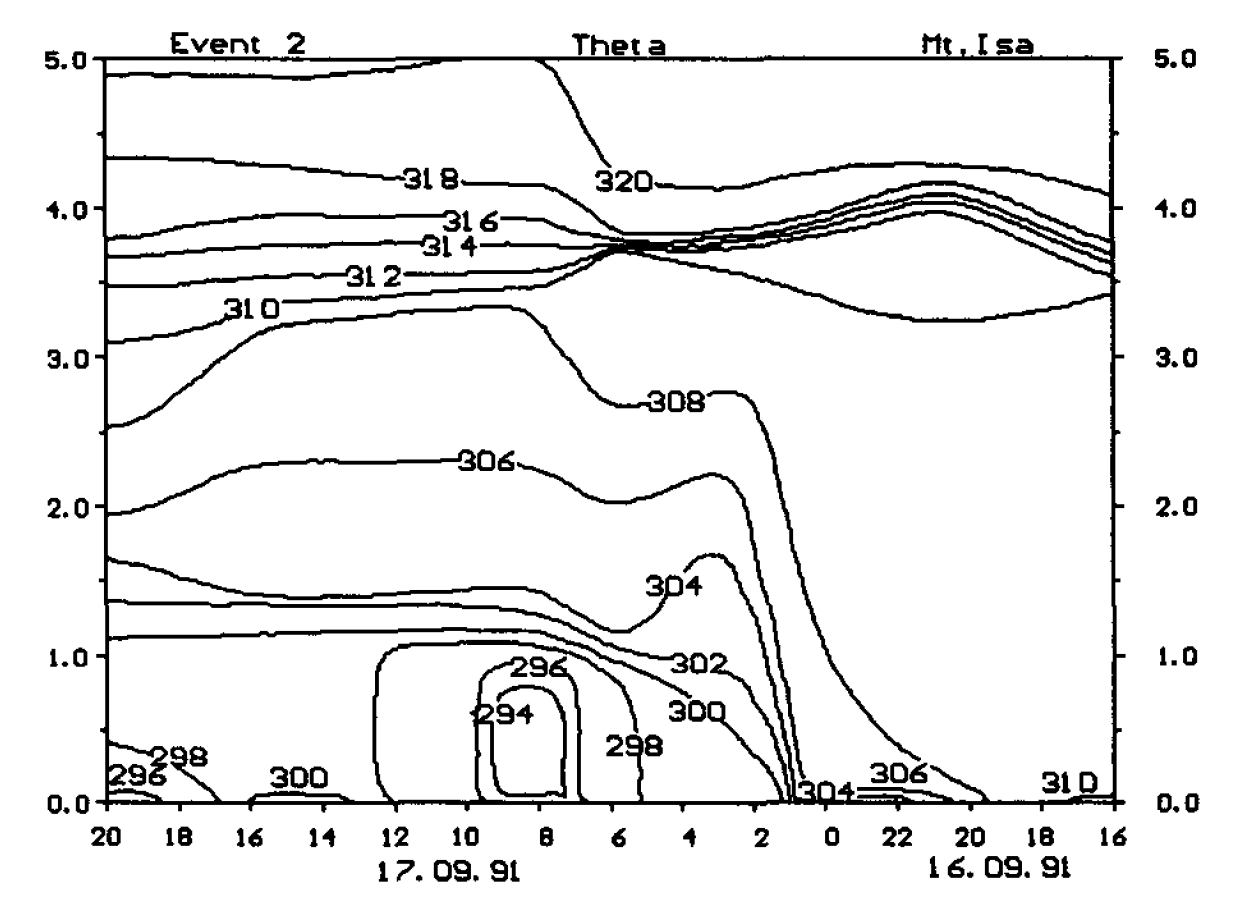
The findings of Smith et al. (1986) raised fundamental questions concerning the structure and dynamics of the inland trough, the structure and dynamics of subtropical cold fronts, and the mechanism of interaction between an advancing frontal trough and the inland trough. These are important questions vis-á-vis the meteorology of the Australian subtropics, but up to the late 80`sthey had received relatively little study, partly because the routine data base was totally inadequate for this purpose. Thus, to help answer these questions, a small pilot field experiment was organized in September 1988 to obtain data on the inland heat trough in central and northern Australia (Smith and Ridley 1990). The vertical structure of three fronts was investigated as they passed over Mount Isa (21S, 139E), which in each case lay near the northern limit of a synoptic cold front and the southern limit of a semi-permanent pressure trough to the northwest. Figure 1 shows height-time cross-sections of potential temperature, θ, and equivalent potential temperature, θe, at Mount lsa for the first event and θ for the two other events.
|
The three cold fronts had some very similar characteristics. The front and trough were originally completely separate features, but the approach of the front from the west appeared to result in the gradual amalgamation of the two in the vicinity of Mount Isa. This front/trough system was contained in all cases between a ridge of high pressure along the Queensland coast and an intensifying ridge across central Australia. The predominant characteristics are consistent with observations of the synoptic conditions conducive to the formation of southerly morning glories in the gulf area (Smith et al. 1986).
The Central Australian Fronts Experiment 1991
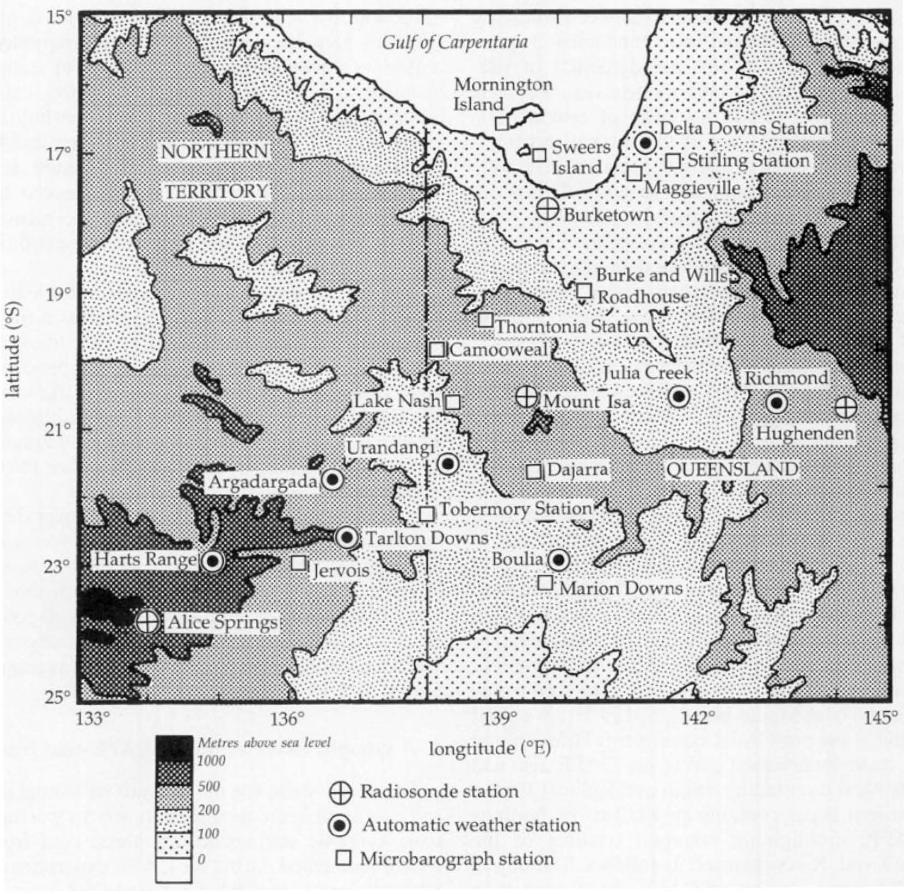
The Central Australian Fronts Experiment (CAFE) was organized to provide a more comprehensive data set on subtropical cold fronts that could be used to answer some of the basic questions about frontal structure and behaviour and to help confirm or reject predictions obtained from model simulations. The experiment ran from 7 September until 4 October 1991 and documented three cold fronts over central and northeastern Australia in unprecedented detail, with data obtained from a greatly enhanced surface observing network, a boundary-layer wind profiler as well as serial upper-air soundings (a map of the observational network is shown in Fig. 2). Data on the surface energy balance were obtained also. The findings of the experiment are reported by Smith et al. (1995).
|
The structure of dry subtropical cold fronts
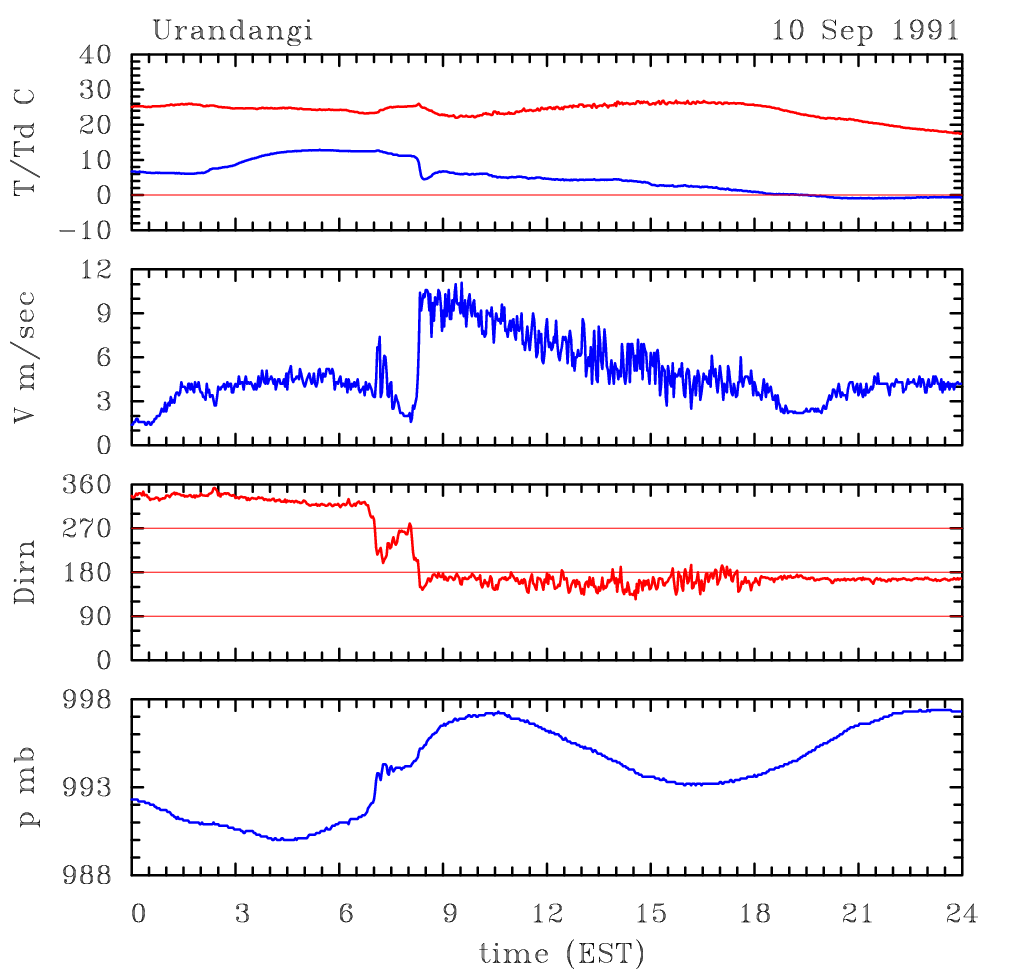
A common feature of all six fronts documented during CAFE and of the pilot experiment (pre-CAFE) was that they were dry, shallow (~1 km deep), and moved into a deep (~4 km) convectively-well-mixed boundary layer. During the night, the well-mixed layer was terminated below by a strong, but shallow radiation inversion. One of the fronts initiated major dust storms across central Australia.
The synoptic environment of these fronts was similar to that of the summertime "cool-change" of southeastern Australia with frontogenesis occurring in the col region between the two subtropical anticyclones, relatively far from the centre of the parent cyclone (Reeder and Smith 1992, Fig. 3 below). A unique feature of the region is the presence of a heat trough over northeastern Queensland with which the frontal trough eventually merges. Generally, the frontal passage is followed by strong ridging from the west.
|
The data obtained during the CAFE experiment highlighted the large diurnal variation of frontal structure associated with diabatic
processes. The fronts were difficult to locate during the late morning and afternoon when dry convective mixing was at its peak, but
developed strong surface signatures in the evening as the convection subsided and a surface-based radiation inversion developed.
Moreover, there appeared to be a ubiquitous tendency in the early morning for the formation of non-linear wave-like or bore-like
structure at the leading edge of the frontal zone as the inversion strengthened. In each case, as the wave/bore developed, it was
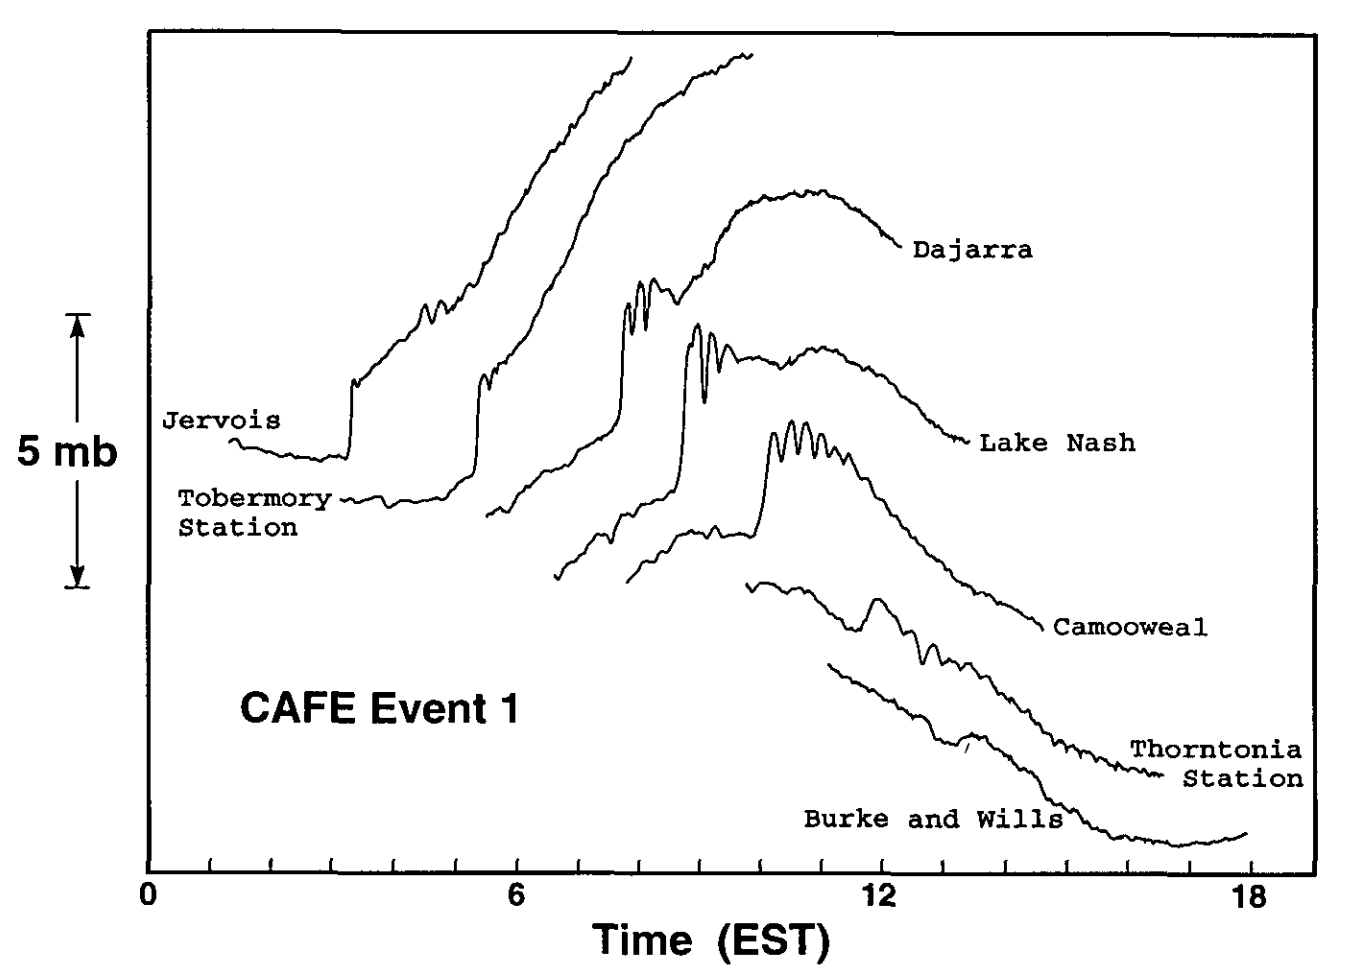
observed to propagate ahead of the air mass change on the pre-existing inversion. Such behaviour was exemplified by the data for
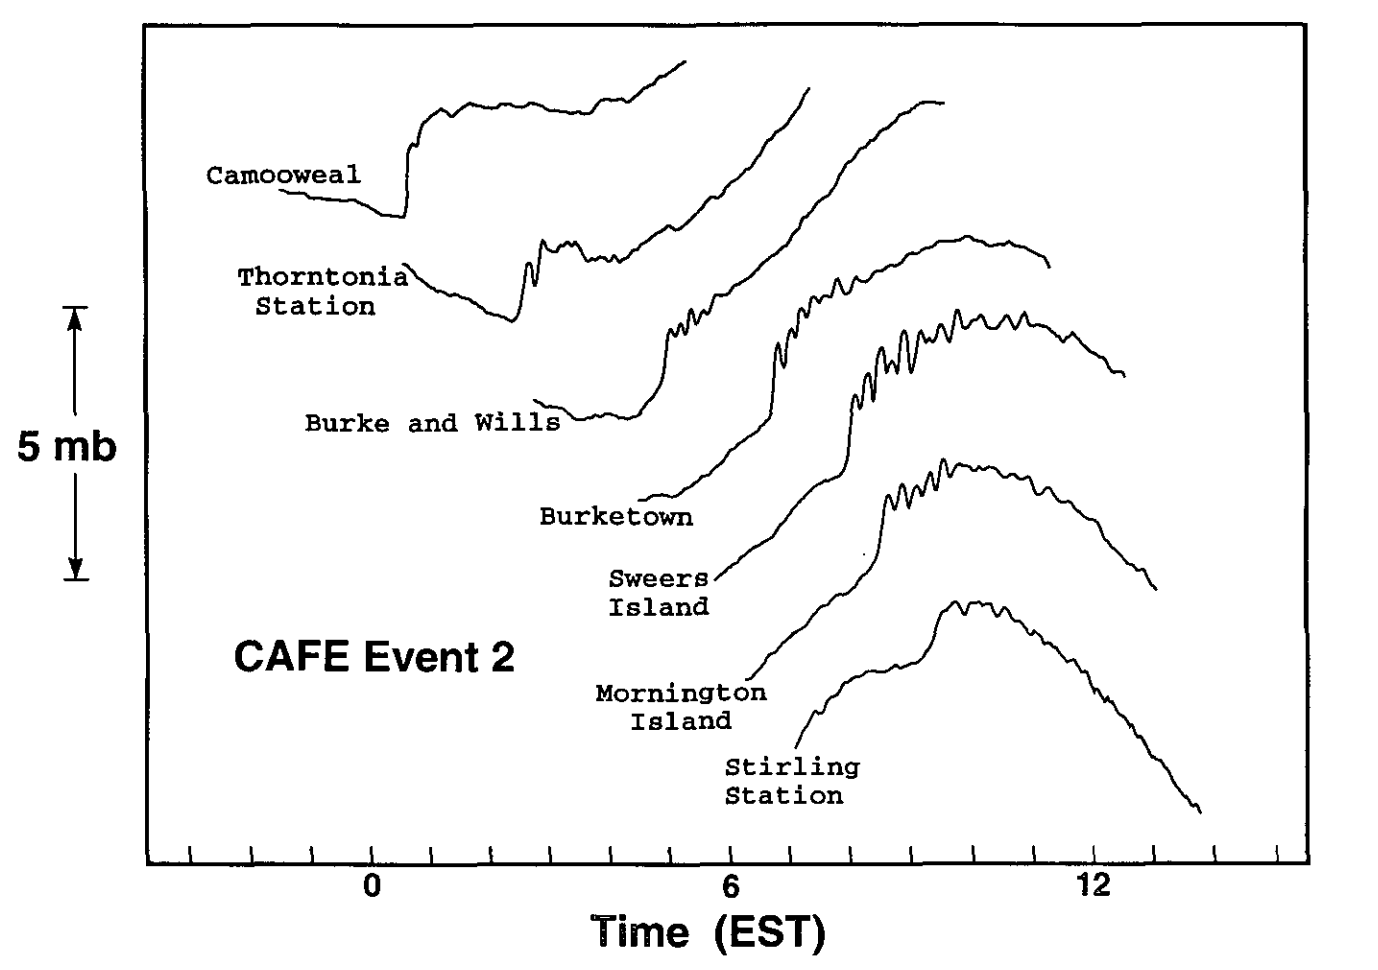
the first two events during CAFE. In the latter case, the data are unique in providing the first clear evidence of the formation
of a southerly morning glory bore-wave in the Gulf of Carpentaria region from a cold front in the south. The passage of a bore
brings a strong, but temporary wind surge at the surface accompanied by a sharp pressure jump. These are followed by a series of
wind and pressure oscillations with a period of 10-15 min, before the steadier post-frontal airflow is established. There is no
air mass change with the passage of the bore, but the vigorous turbulence that accompanies it may lead to a breakdown of any
shallow radiation inversion that exists, often causing a
 (a) (a)
|
 (b) (b)
|
 (a) (a)
|
 (b) (b)
|
 (a) (a)
|
 (b) (b)
|
 (a) (a)
|
 (b) (b)
|
The Central Australian Fronts Experiment 1996 (CAFE96)
The Central Australian Fronts Experiment 1996 (CAFE96) was the third in a series of field experiments designed to document the behaviour of subtropical continental cold fronts during the late dry season. Its central aim was to investigate the structure and dynamics of subtropical cold fronts that affect central Australia and prior to their evolution into bore-like disturbances as they approached the Gulf of Carpentaria region. The experiment was carried out in the region between Giles in Western Australia and Burketown in northwestern Queensland from the end of August until early October 1996. A special network of surface measuring stations was installed in the normally data void region between Yulara and Mount Isa and between Mount Isa and Burketown. These included fourteen AWSs recording wind speed, wind direction, temperature, wet-bulb temperature and pressure, which were deployed along a southwest/northeast oriented line between Giles and the lower Cape York Peninsula. The experiment was organized by Monash University, The Australian National University, the University of New South Wales and the University of Munich, Germany, with collaborative support of the Bureau of Meteorology`s Northern Territory Regional Office.
Seven fronts were documented in detail during CAFE96 and, by and large, they confirmed the conclusions from CAFE91. The results of the experiment are presented in Reeder \etal (2000), which focused principally on three frontal systems: Events 3, 4 and 6. Events 4 and 6 were emphasized because aspects of their structure and evolution were a little different from the previously reported paradigm. For example, of the 14 fronts documented in detail during CAFE96, CAFE91 and pre-CAFE, only these events were detected during the late morning or afternoon. Moreover, Event 6 decayed over central Australia, only to re-intensify two days later over the northeastern part of the continent. Unlike most of the 14 fronts studied, Events 4 and 6 were accompanied by severe weather over eastern Australia. Event 4 re-intensified during late afternoon and subsequently crossed the eastern half of the network. The front continued to intensify overnight, generating a spectacular family of southerly bore waves (or southerly morning glories). By the end of the event, a zone of strong equivalent potential temperature gradient stretched across the whole of northern Australia.
Event 6 developed in a broad, slow-moving, extra-tropical cyclone that advanced across southern Australia. The system had the structure of classical mature extra-tropical cyclone and was accompanied by a cold front and strong warm front. Although rarely analyzed as such, we believe that warm fronts are relatively common in the region. The cold front strengthened and moved northeastwards across central Australia in the early hours of 28 September 1996, arriving at Santa Teresa at 0730 CST and at Alice Springs at 1010 EST (0940 CST). However, as the daytime turbulent mixing increased, the front stalled and retreated back through Alice Springs at 1125 CST, bringing with it northwesterlies and blowing dust. The front retreated through Santa Teresa about 1330 CST. It subsequently weakened and there is little clear evidence that it crossed the network again. While it is probably quite common for the position of subtropical cold fronts to oscillate back and forth in response to the daytime turbulent mixing, Event 6 is the only documented example of which we are aware. It must be emphasized that we do not consider the leading edge of the front to be a material surface being advected back and forth across the centre of the continent. Rather, the leading edge of the front is generally much shallower than the depth of the daytime mixed layer and we envisage that the nose of the front is eroded by turbulent mixing in the vertical. At night, once the (buoyantly-generated) turbulent mixing subsides, the large-scale pattern of deformation acts to re-establish the cross-frontal temperature gradient. The dynamics of fronts like Event 6 is largely unknown and is a topic for further research. As the ridge built across the continent, strong frontogenesis developed over northeastern Australia on 30 September 1996. The surface pressure pattern implied very strong geostrophic deformation over central and northern Queensland with the dilatation axis along the trough axis. Event 6 re-formed locally and crossed the northeastern part of the observational network during the late morning of 30 September.
The structure and evolution of Event 3 was typical of those subtropical fronts reported previously. It strengthened and accelerated during the evening of 11 September 1996, and crossed the observational network during the night and early morning hours. Strong near-surface warming followed the passage of the front. This warming was detected in the enhanced satellite imagery and confirmed by surface measurements.
The Reeder et al. study emphasized the utility of low-level cyclonic relative vorticity in analyzing fronts over continental Australia. Although not commonly used in frontal analysis, low-level cyclonic relative vorticity has proved to be reliable indicator of frontal position even when the front is affected by strong spatial and temporal changes in sensible heating. While the fronts in the Australian subtropics often show little continuity in most fields (such as temperature), they can be traced continuously in the fields of vorticity and equivalent potential temperature.
In general, the results of CAFE96 confirmed the conclusions drawn from the two previous experiments, but they raise a number of theoretical questions concerning the effect of turbulent mixing on the evolution and progression of subtropical cold fronts.
Numerical simulations
Thomsen et al. (2009) investigated the effect of the diurnal cycle on the evolution of cold fronts in the Australian subtropics in two high-resolution numerical simulations. The simulations are made using the Pennsylvania State University/National Center for Atmospheric Research Mesoscale Model (MM5) with the initial and boundary conditions taken from the operational analyses of the European Centre for Medium Range Weather Forecasts. These simulations are compared with the observations of two cold fronts taken during the 1991 CAFE experiment. The simulations showed a number of features that have been suspected, but never confirmed or quantified:
Although the wind field in the boundary layer is frontogenetic, daytime turbulent mixing is strongly frontolytic, which accounts for the weakening and deceleration of the fronts during the late morning and afternoon when convective mixing in the boundary layer is most vigorous.
When the mixing subsides in the early evening, the low-level winds increase along with the deformation and convergence, leading to a strengthening and acceleration of the fronts.
Bore-like disturbances are generated during the early hours of the morning as the nocturnal inversion strengthens.
These bores propagate ahead of the front, developing a series of large-amplitude waves at their leading edge. The results were in support of idealized simulations of gravity currents moving into a surface-based stable layer (Haase and Smith 1989a,b).
References
Haase, S. P., and R. K. Smith, 1989: The numerical simulation of atmospheric gravity currents. Part I. Neutrally-stable environments. Geo. Astro. Fluid Dyn., 46, 1-33.
Haase, S. P., and R. K. Smith, 1989: The numerical simulation of atmospheric gravity currents. Part II. Environments with stable layers. Geo. Astro. Fluid Dyn., 46, 35-51.
Lammert, L., 1932: Frontologische Untersuchungen in Australien. Beitr. Physik der freien Atmos., 19, 203-219.
Reeder, M. J., and R. K. Smith, 1992: Australian spring and summer cold fronts. Aust. Met. Mag., 41, 101-124.
Reeder, M. J., and R. K. Smith, 1998: Mesoscale meteorology in the Southern Hemisphere. Chapter 5 of Meteorology of the Southern Hemisphere. Ed. D. J. Karoly and D. Vincent. American Meteorological Society Monograph, No. 49, 201-241.
Reeder, M. J., R. K. Smith, R. Deslandes, N. J. Tapper and G. A. Mills, 2000: Subtropical fronts observed during the 1996 Central Australian Fronts Experiment. Aust. Meteor. Mag., 49, 181-200.
Smith, R. K., and R. N. Ridley, 1990: Subtropical continental cold fronts. Aust. Met. Mag., 38, 191-200.
Smith, R. K., B. F. Ryan, A. J. Troup, and K. H. Wilson, 1982: Cold Fronts Research: The Australian summertime cool change. Bull. Amer. Met. Soc., 63, 1028-1934.
Smith, R. K., M. J. Reeder, N. J. Tapper and D. R. Christie,1995: Central Australian cold fronts. Mon. Wea. Rev., 123, 16-38.
Thomsen, G. L., M. J. Reeder, and R. K. Smith, 2009: The diurnal evolution of cold fronts in the Australian subtropics . Quart. J. Roy. Met. Soc., 135, 395-411.
Copyright © Roger Smith, Date 06 Feb 2015