Case C 1: Step cloud
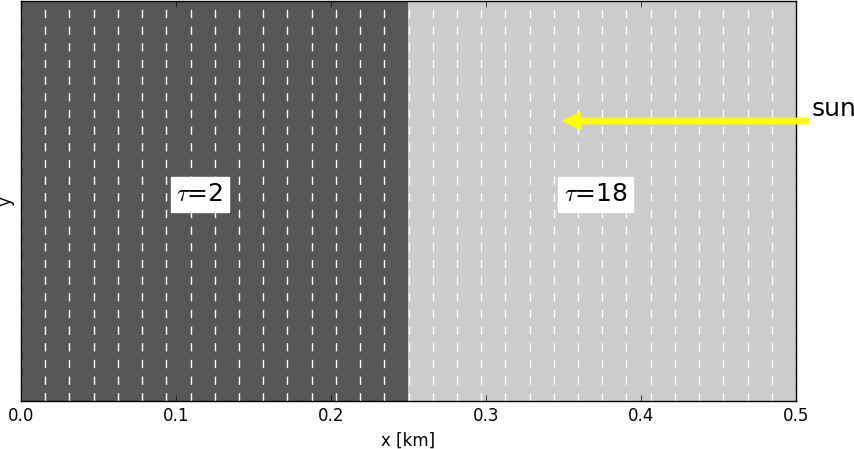
This test case has been adopted from phase 1 of the I3RC project (see http://i3rc.gsfc.nasa.gov/input/step_cloud/README.txt)
Setup:
- simple 1D step cloud
- 32 pixels along the x-direction, first 16 have optical depth of 2, remaining have optical thickness of 18.
- size of field is set to 0.5 km, i.e. all pixels have a width of 0.5/32 km
- geometrical thickness of cloud along z-axis: 0.25 km
- homogeneous extinction coefficient
- infinite extent in y-direction
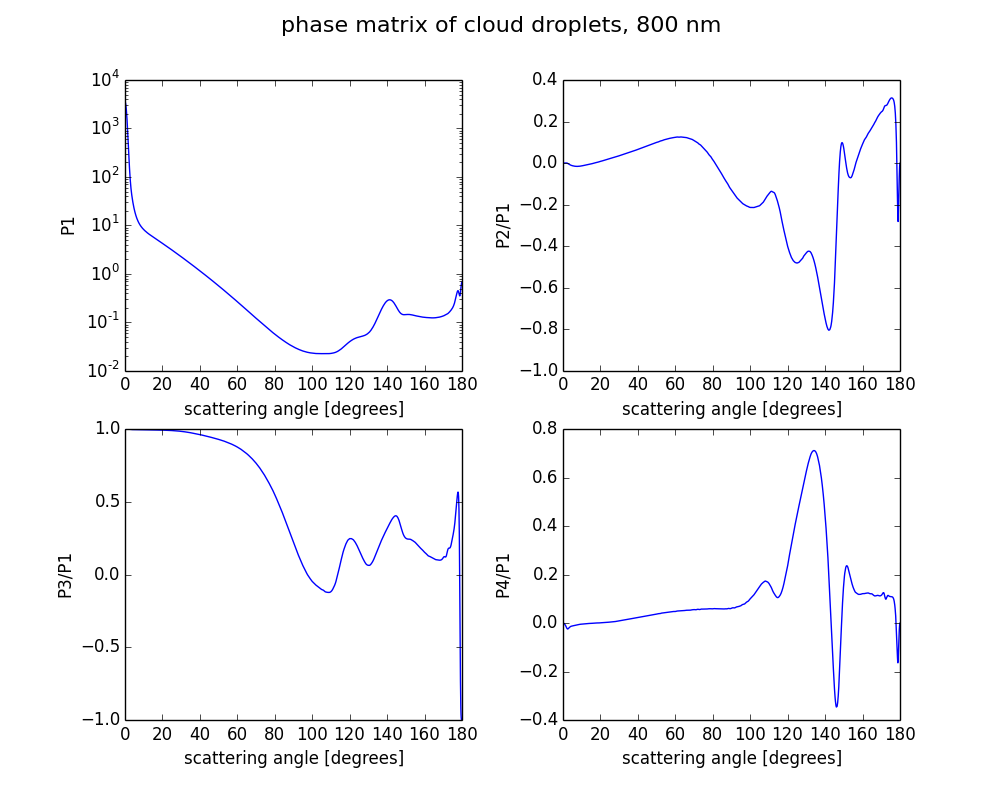
- cloud optical properties as in case A5 (Mie phase matrix for 800 nm wavelength and 10 $\mu$m effective radius): netCDF,ascii
The variable “phase” includes the phase matrix, as a function of the scattering angle (variable “theta”). The 4×4 scattering phase matrix for spherical droplets has four non-zero elements, which are stored in the following order: $ P = \begin{pmatrix} P1 & P2 & 0 & 0 \\ P2 & P1 & 0 & 0 \\ 0 & 0 & P3 & P4 \\ 0 & 0 & -P4 & P3 \end{pmatrix} $
The corresponding Legendre polynomials (“pmom”) and the single scattering albedo (“ssa”) are also included in the file.
- single scattering albedo (ssa): 0.99
- periodic boundary conditions are assumed
- Black surface (albedo=0)
- Solar azimuth angle $\phi_0$: 180$^\circ$ (sun from right)
- Viewing geometries (solar zenith angle $\theta_0$, output altitude $z$, viewing zenith angle $\theta$ and viewing azimuth angle $\phi$):
- number of photons: 1e7 per pixels → 32e7
| # | $\theta_0$ [$^\circ$] | $z$ [km] | $\theta$ [$^\circ$] | $\phi$ [$^\circ$] |
|---|---|---|---|---|
| 1 | 0 | 0 | 60 | 0 |
| 2 | 60 | 0 | 0 | 0 |
| 3 | 60 | 0 | 30 | 0 |
| 4 | 60 | 0 | 30 | 180 |
| 5 | 0 | 0.25 | 180 | 0 |
| 6 | 0 | 0.25 | 140 | 0 |
| 7 | 0 | 0.25 | 120 | 0 |
| 8 | 60 | 0.25 | 180 | 0 |
| 9 | 60 | 0.25 | 120 | 0 |
| 10 | 20 | 0.25 | 120 | 135 |
Output format:
The output should be provided in an ascii file containing the following columns:
ssa theta_0 z theta phi i_x I Q U V Istd Qstd Ustd Vstd
i_x denotes the pixel number in x-direction (starting with 1).
I,Q,U,V denote the Stokes vector.
Istd Qstd Ustd Vstd are standard deviations of the Stokes vector components which should be provided for Monte Carlo models. If error estimates can not be provided, these columns may be omitted.
The result filename should be 'iprt_case_c1_MODEL.dat' and it should include the following header:
# IPRT case C1 - Step cloud
# RT model: MODEL_NAME
# ssa theta_0 z theta phi i_x I Q U V Istd Qstd Ustd Vstd
Results
Data of model results
Results of MYSTIC model (10$^8$ photons per pixel).
Results of all models (MYSTIC, SHDOM, SPARTA, 3DMCPOL, MSCART).
Results for up-looking directions (cases 1-4)
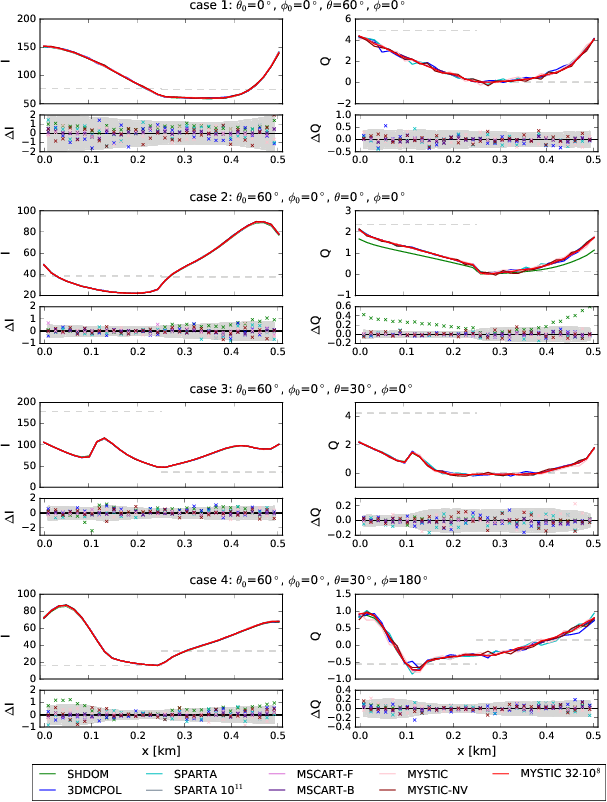
Stokes vector components I (left) and Q (right) for the step cloud
scenario C1. Here the observer is placed at the top of the cloud layer
at position x and it looks downwards and its viewing direction is
given by ($\theta$,$\phi$). The solar zenith angle is 0$^\circ$ for
cases 5–7 and 60$^\circ$ for cases 8–9. The solar azimuth angle is
0$^\circ$ for all cases. The small panels show the absolute
differences between various models (see legend) and accurate MYSTIC
simulations obtained with 10$^8$ photons/pixel (MYSTIC
32$\cdot$10$^8$). The grey range corresponds to 2$\sigma$ of MYSTIC
simulations without variance reduction methods and with 10$^7$ photons
(MYSTIC-NV). The Stokes vector components are normalized to
1000/E$_0$. All cases are in the solar principal plane where the
Stokes components $U$ and $V$ are exactly 0 and, therefore, not
shown. The grey dashed lines show 1D independent pixel calculations.
Results for down-looking directions (cases 5-9)
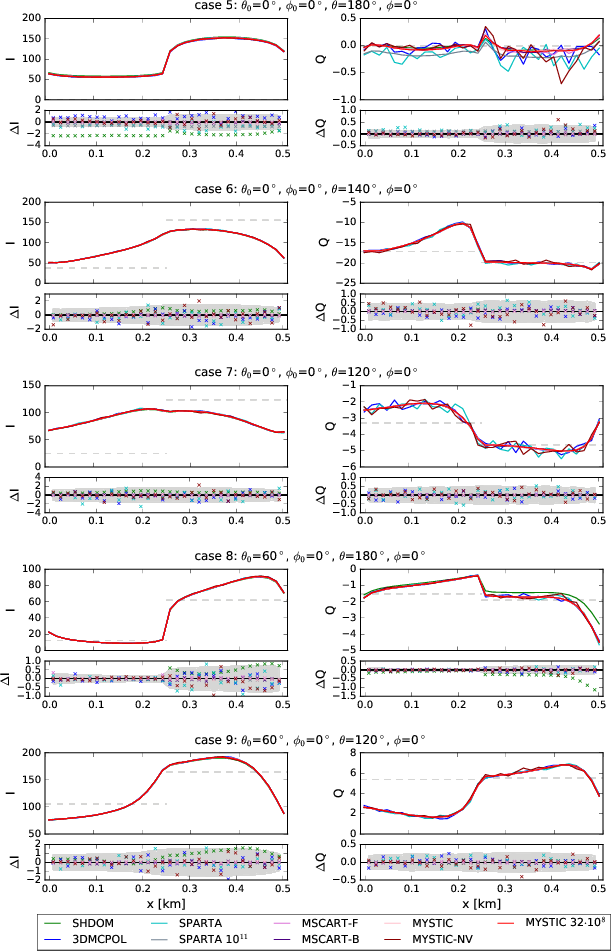
Stokes vector components I (left) and Q (right) for the step cloud
scenario C1. Here the observer is placed at the top of the cloud layer
at position x and it looks downwards and its viewing direction is
given by ($\theta$,$\phi$). The solar zenith angle is 0$^\circ$ for
cases 5–7 and 60$^\circ$ for cases 8–9. The solar azimuth angle is
0$^\circ$ for all cases. The small panels show the absolute
differences between various models (see legend) and accurate MYSTIC
simulations obtained with 10$^8$ photons/pixel (MYSTIC
32$\cdot$10$^8$). The grey range corresponds to 2$\sigma$ of MYSTIC
simulations without variance reduction methods and with 10$^7$ photons
(MYSTIC-NV). The Stokes vector components are normalized to
1000/E$_0$. All cases are in the solar principal plane where the
Stokes components $U$ and $V$ are exactly 0 and, therefore, not
shown. The grey dashed lines show 1D independent pixel calculations.
Case 10: Out of principal plane, non-zero U and V.
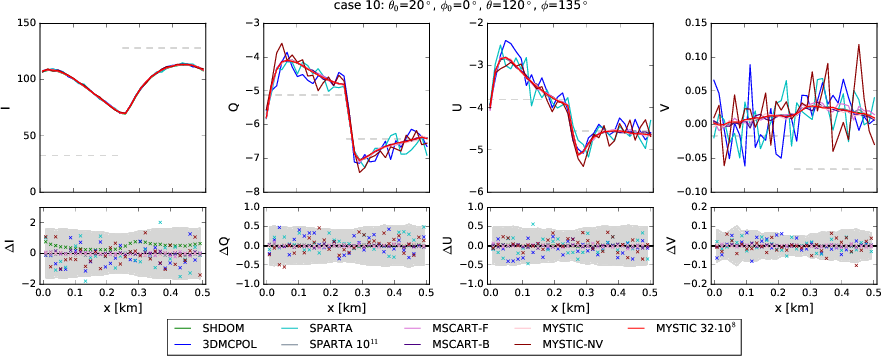
Stokes vector components I, Q, U, and V for the step cloud scenario
C1. Here, the observer is placed at the top of the cloud layer at
position x and it looks downwards and its viewing direction is given
by ($\theta$=120$^\circ$,$\phi$=135$^\circ$). The solar zenith angle
is $\theta_0$=20$^\circ$ and the solar azimuth angle is
$\phi_0$=0$^\circ$. This sun-observer geometry is outside the solar
principal plane and, hence, non-zero values for $U$ and $V$ are
expected. The small panels show the absolute differences between
various models (see legend) and accurate MYSTIC simulations obtained
with 10$^8$ photons/pixel (MYSTIC 32$\cdot$10$^8$). The grey range
corresponds to 2$\sigma$ of MYSTIC simulations without variance
reduction methods and with 10$^7$ photons (MYSTIC-NV). The Stokes
vector components are normalized to 1000/E$_0$. The grey dashed lines
show 1D independent pixel calculations.
Statistics
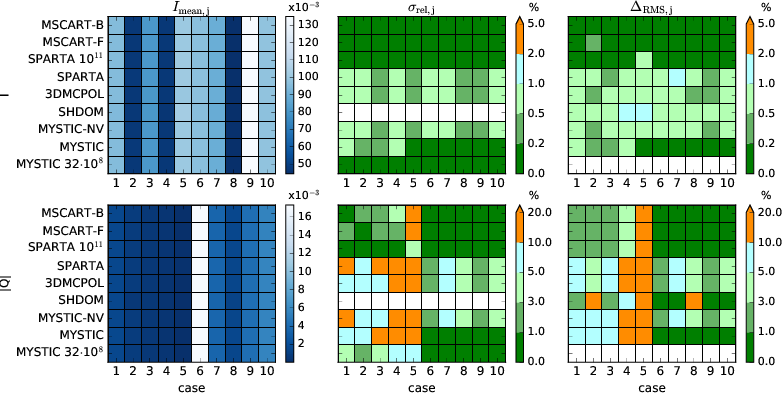 Statistics of Stokes vector components I and Q for the step cloud
scenario C1. The left panels show the mean radiance (for Q the mean of
the absolute values) for all models and all 10 cases. The middle
panels show the standard deviations and the right panels show the root
mean square differences $\Delta_{\rm RMS}$ in per cent. U and V are
not shown here because they are 0 except for case 10.
Notes:
- Generally a very good agreement between all models. A quantitative comparison is difficult because we have only 32 pixels for each case (not sufficient to state, whether models agree withing standard deviation).
- Most problematic seems to be case 5 ($\theta_0$=0$^\circ$, z=0.25, $\theta$=180$^\circ$, $\phi$=0$^\circ$), here the models SHDOM, 3DMCPOL, and SPARTA show a bias for I, SPARTA and SHDOM also for Q. For SPARTA this becomes obvious when we look at the accurate model run with 1e11 photons (see line plots of results and match fraction).
- We have decided that all Monte Carlo models should use the same number of photons (32e7). The model runs without variance reduction (mystic_nv, 3DMCPOL, SPARTA) show exactly the same mean standard deviations.
- Variance reduction works well for all cases in MSCART, standard deviation is reduced by approximately one order of magnitude.
- MYSTIC variance reduction does not work well for cases 1–4 (up-looking), for cases 5–10 the standard deviation is similar to MSCART
- SHDOM: explicit model, hence no statistical noise. Shows small systematic deviations from MC models, most obvious in Q for cases 2 and 8
- For case 10, V agrees for models with variance reduction or high number of photons (SPARTA 1e11). Results are also very similar to SHDOM.
- RMS only meaningful when mean radiance is non-zero, for U and V therefore only for case 10. For case 5, Q is very small therefore RMS large for all models.
