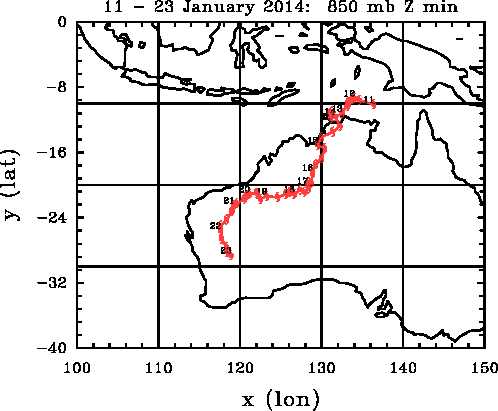
Tropical depression NT1 Jan 2014
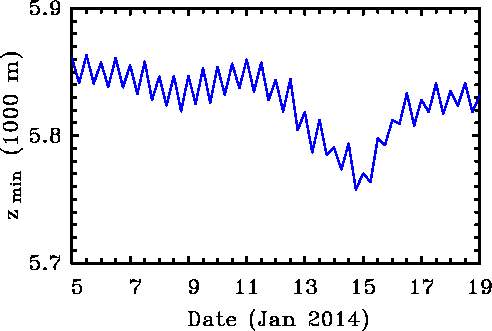
Track (min geopotential at 850mb)
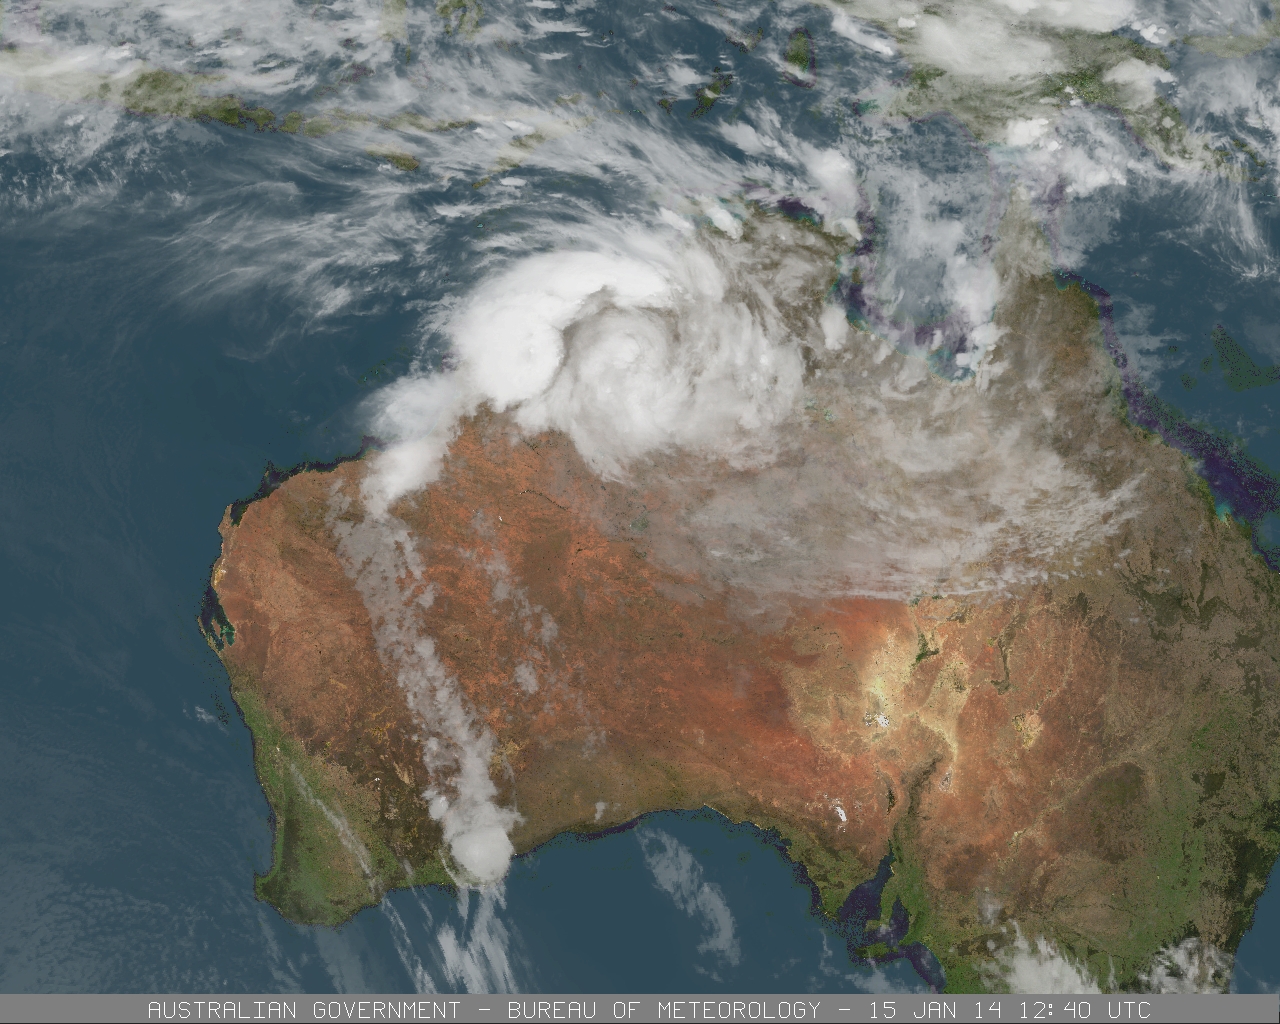
Satellite image (15th of January, 2014 at 12:40 UTC)
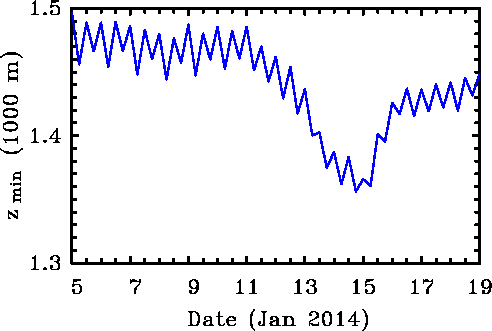
Intensity 850 mb
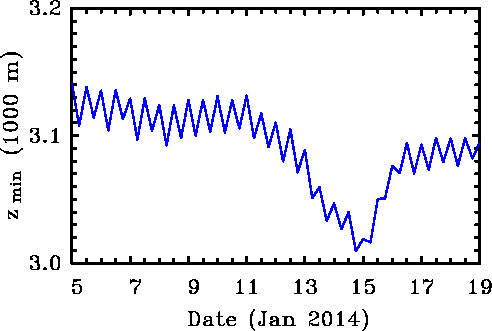
Intensity 700 mb
Intensity 500 mb
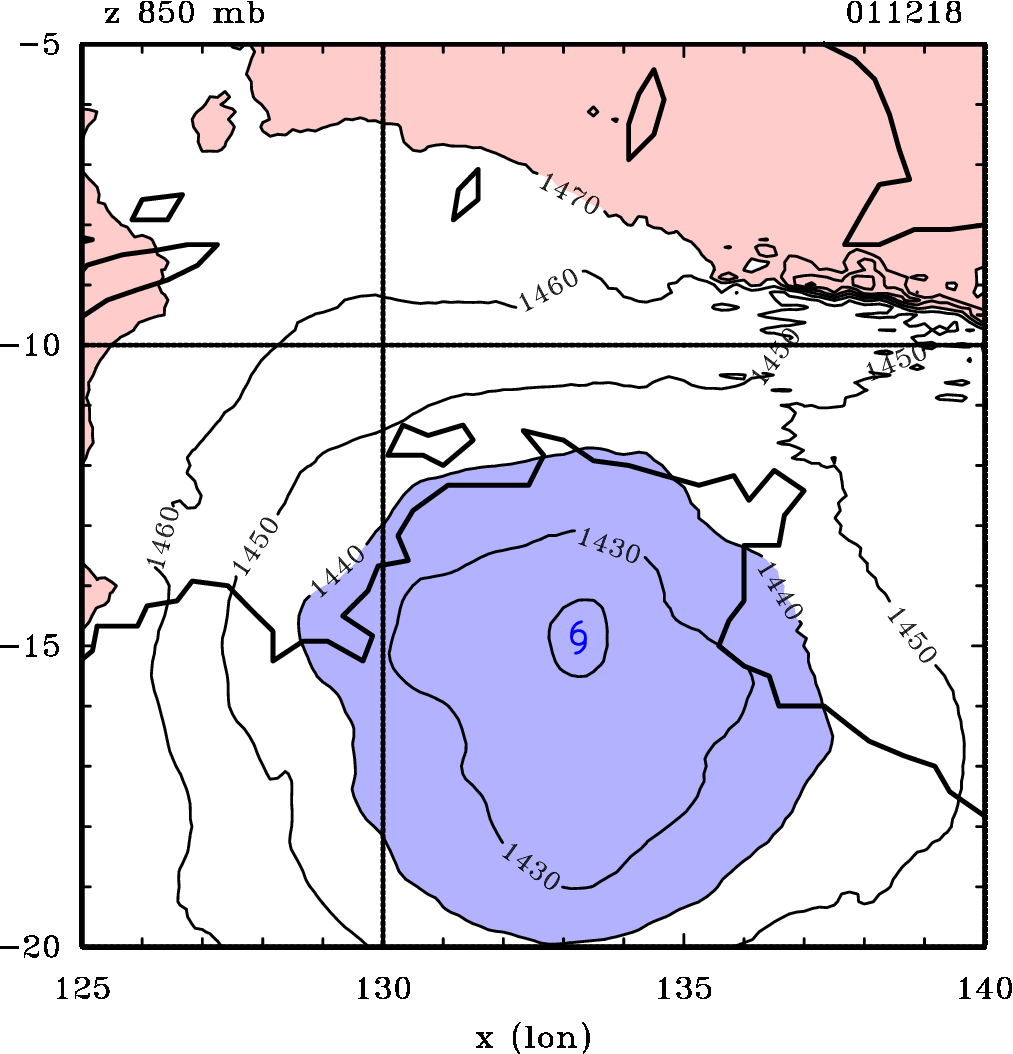
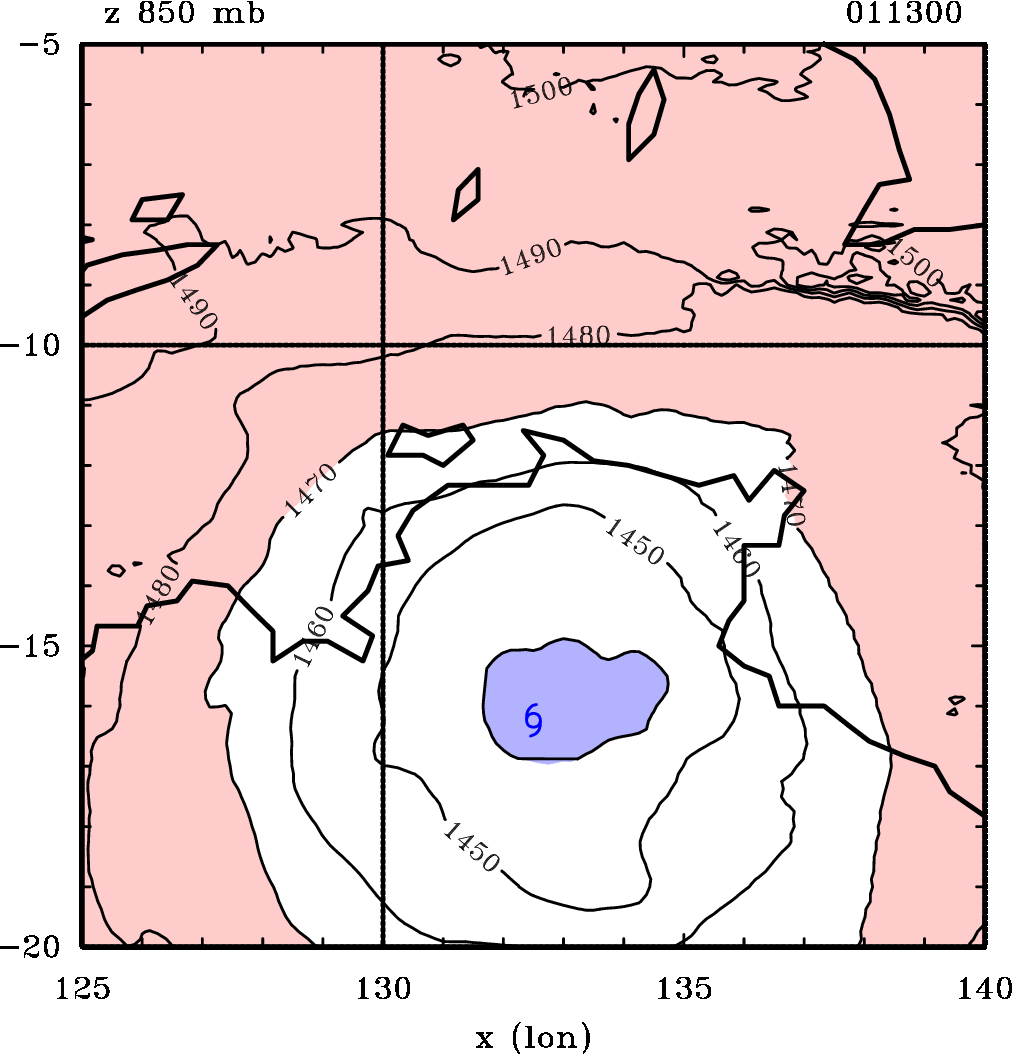
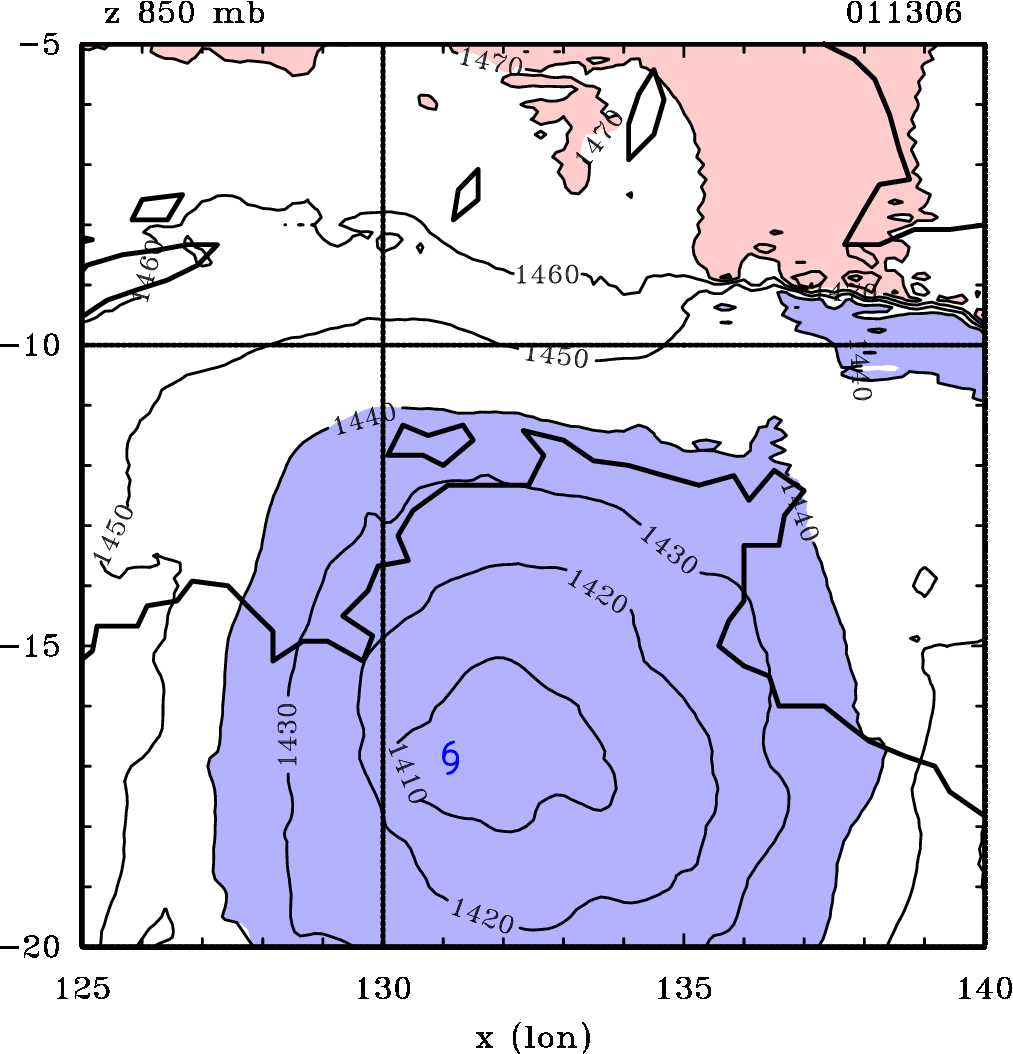
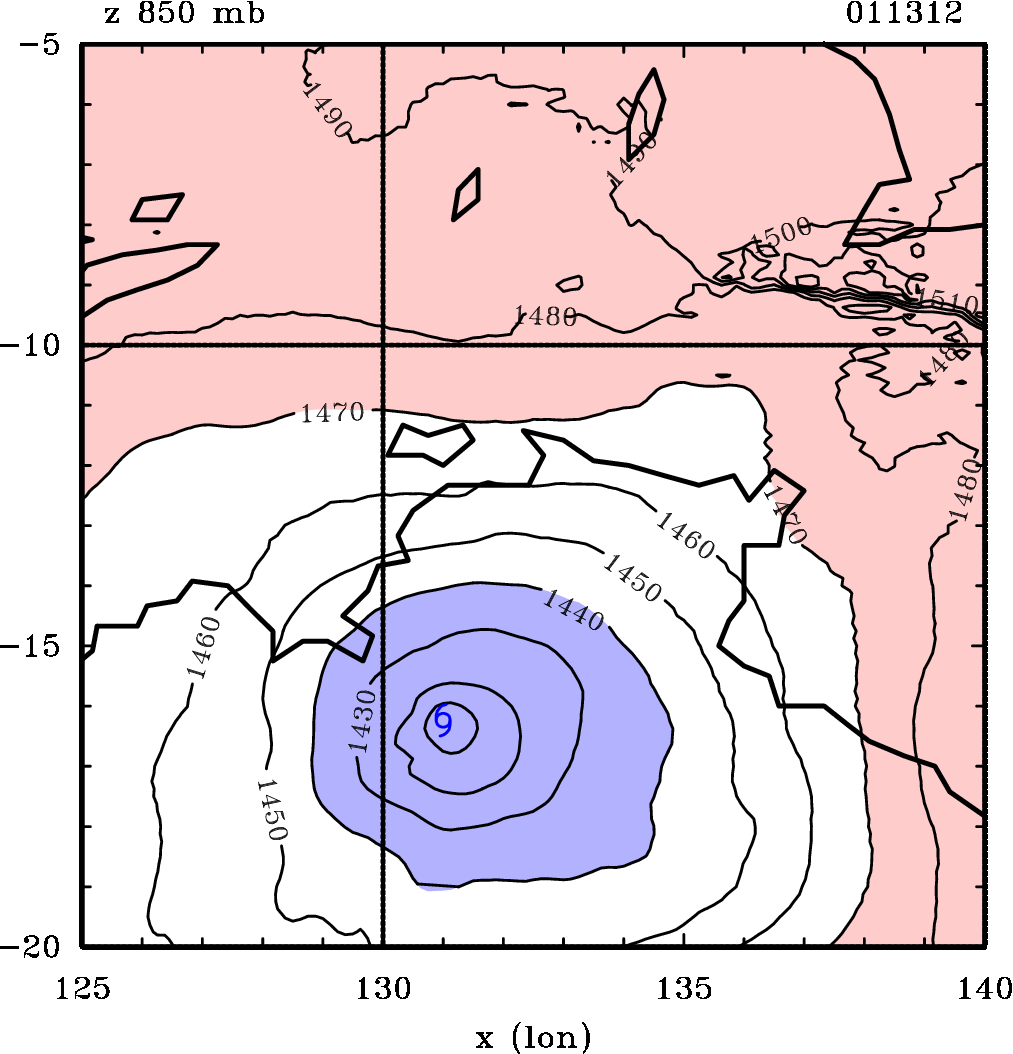
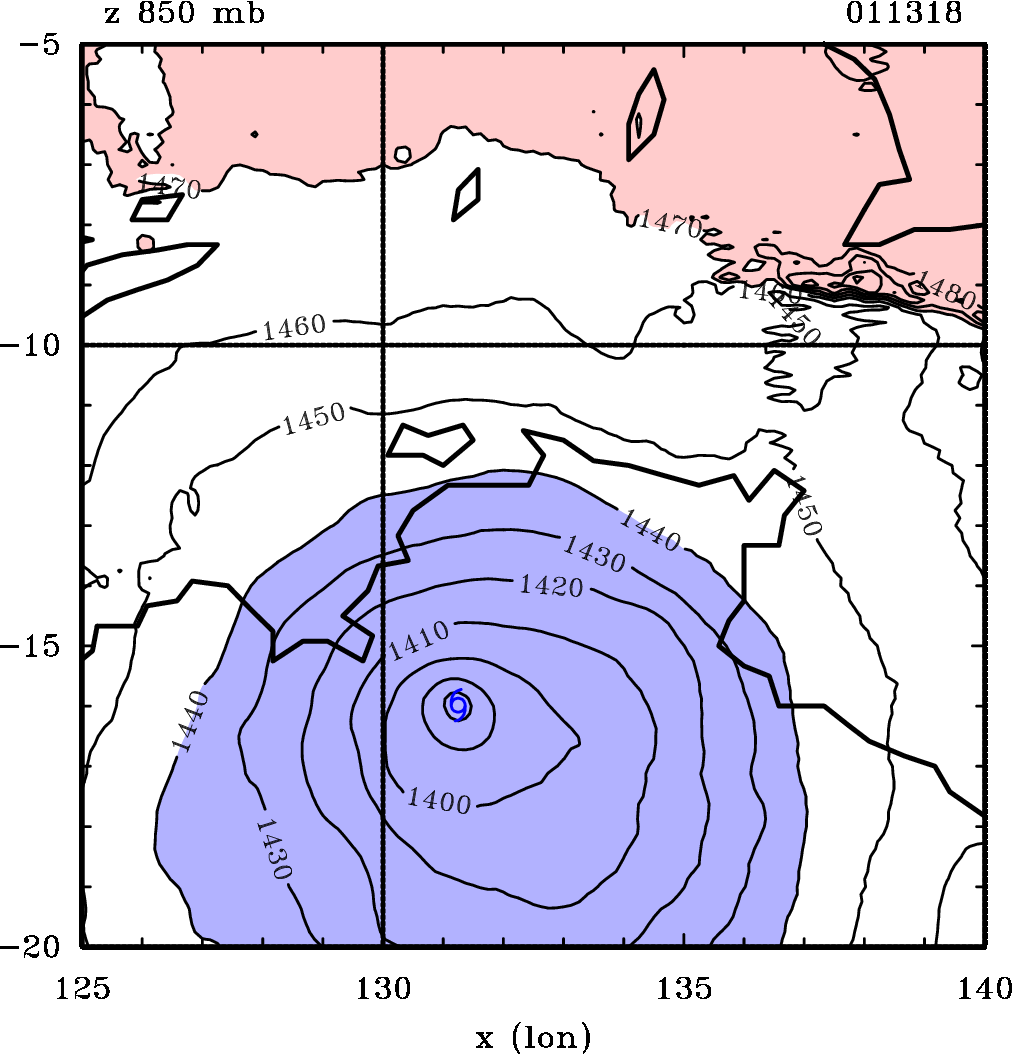
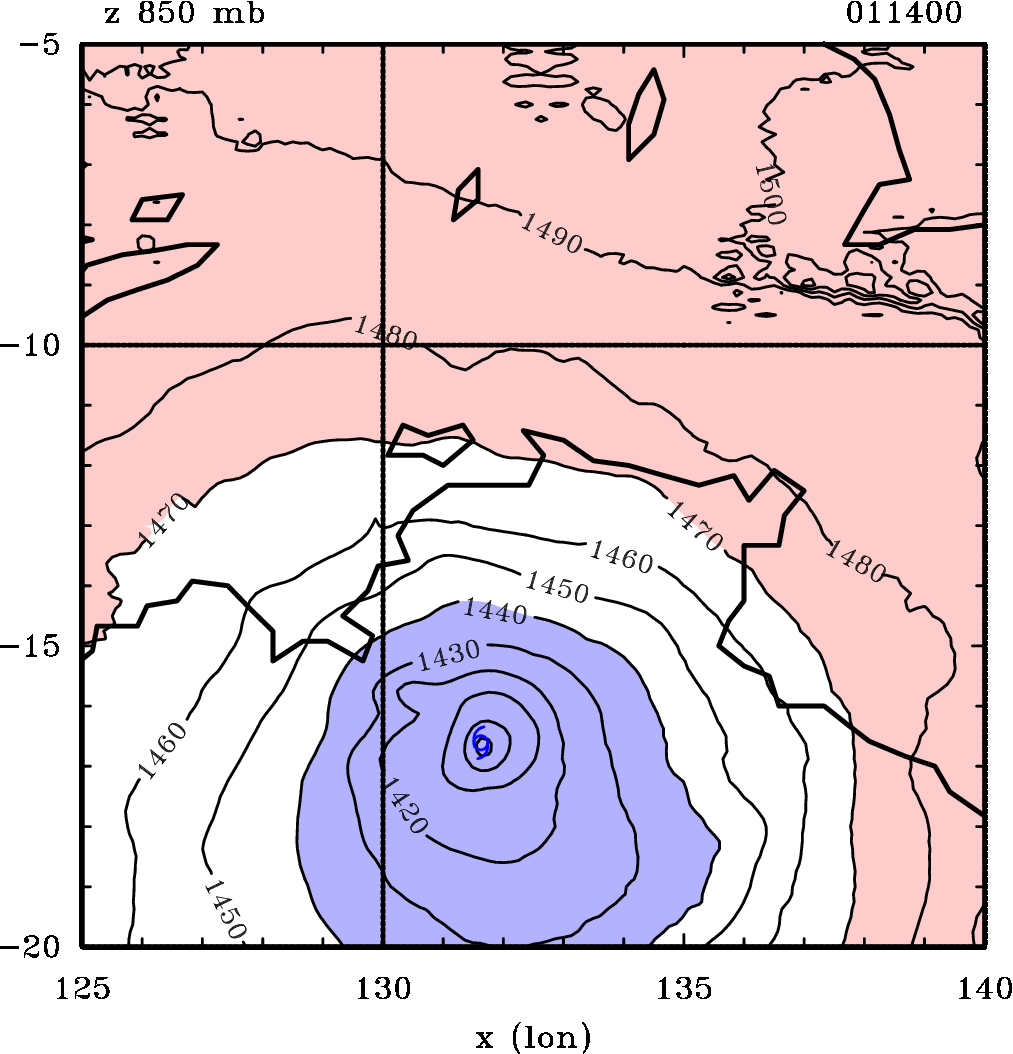
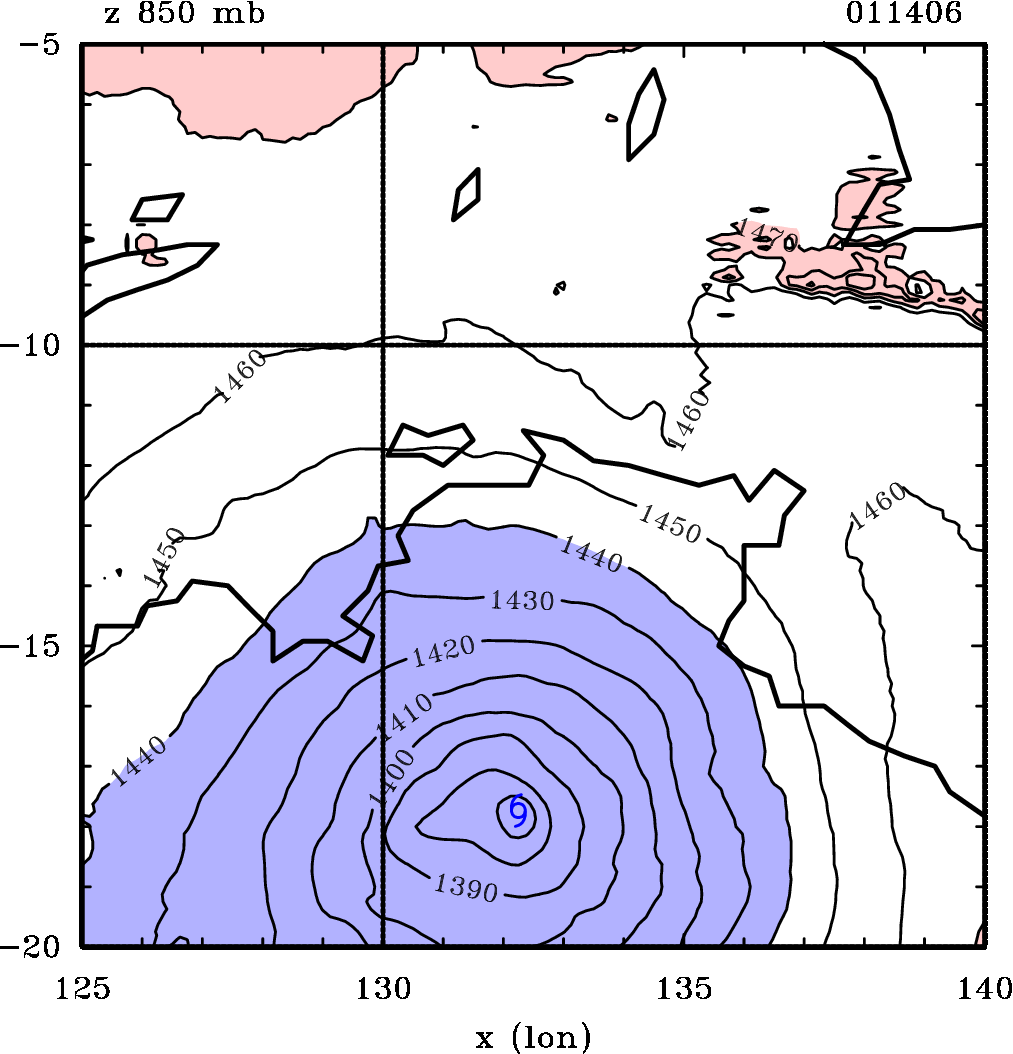
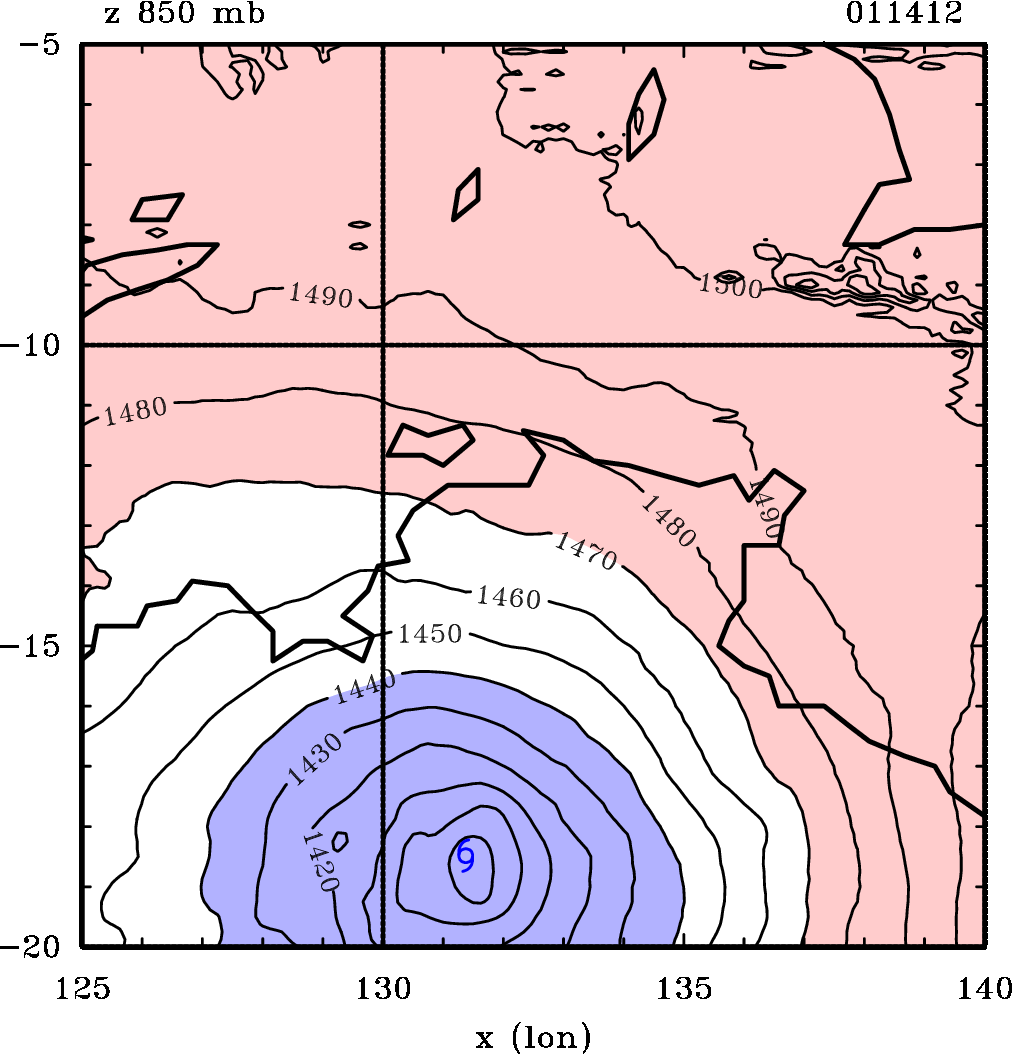
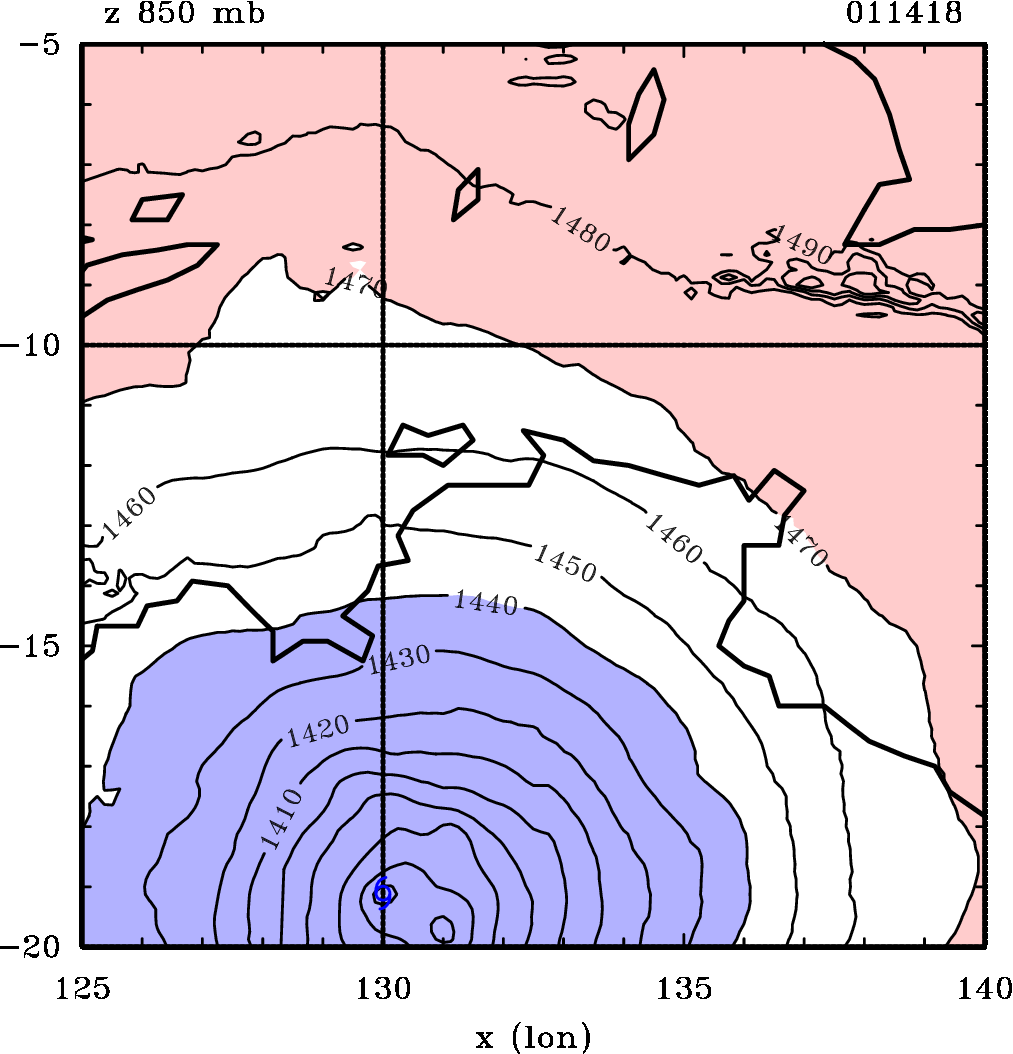
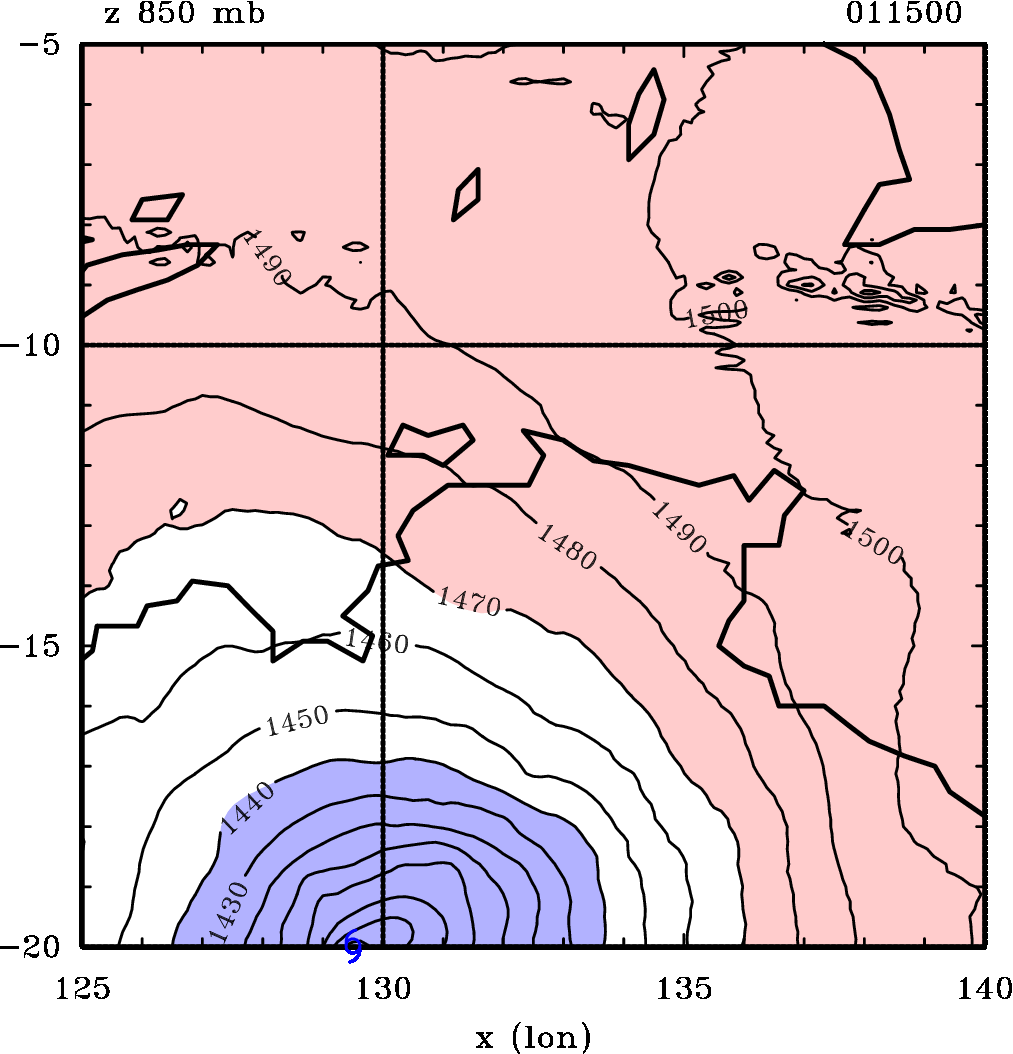
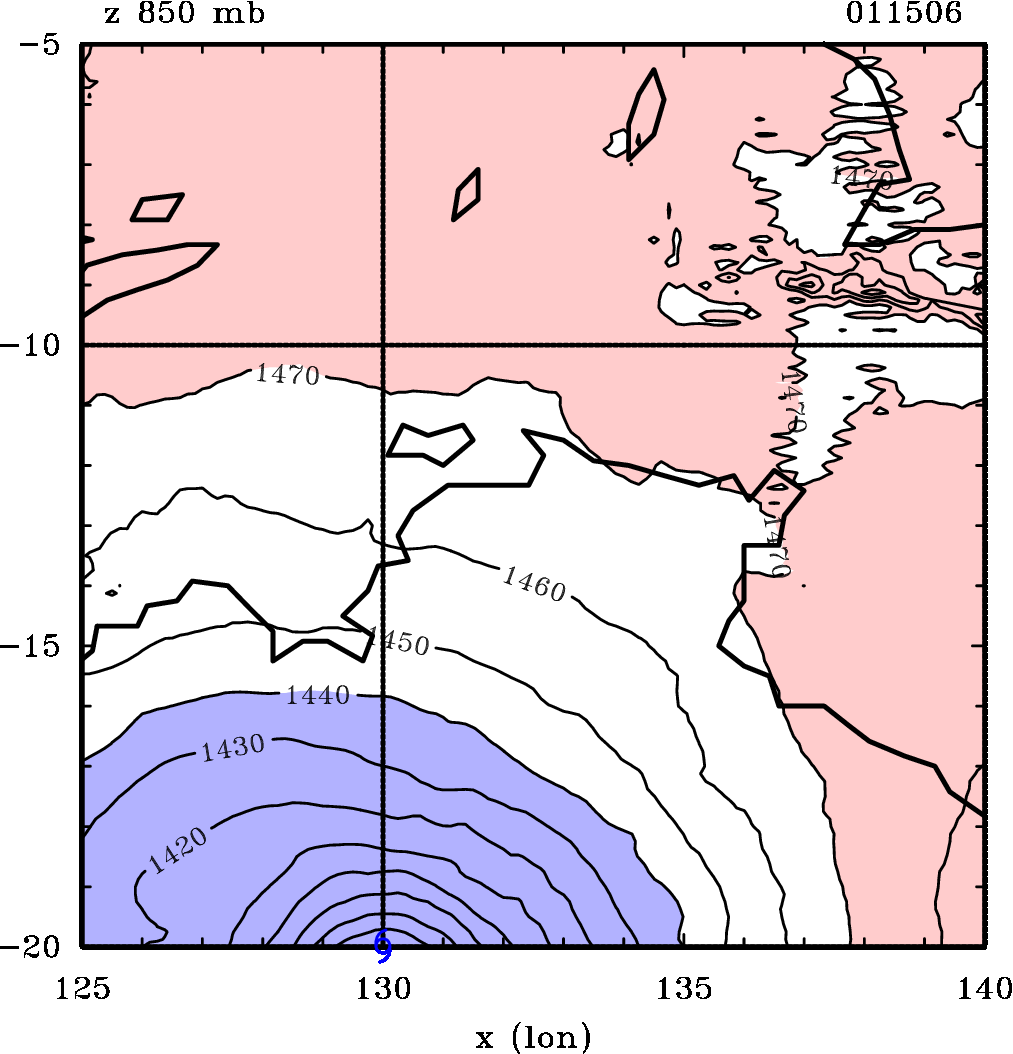
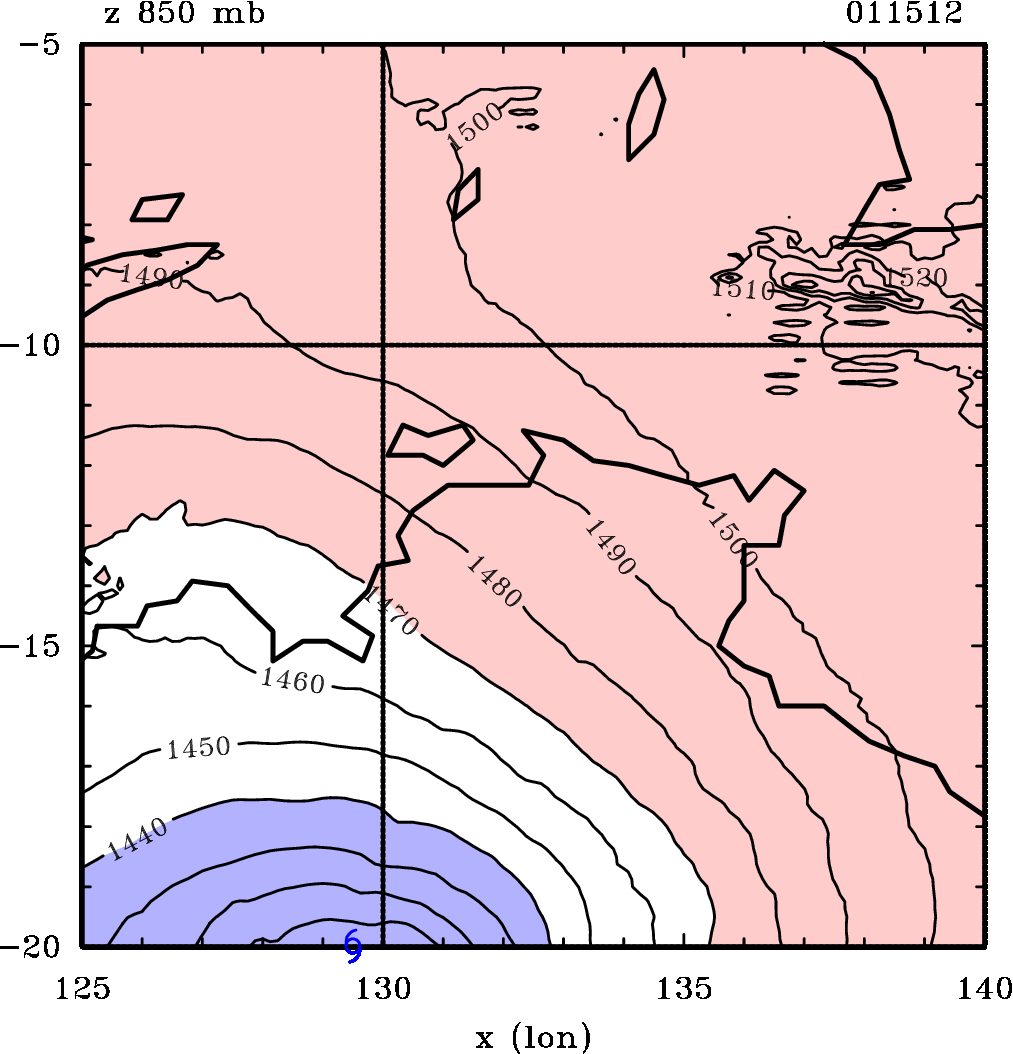
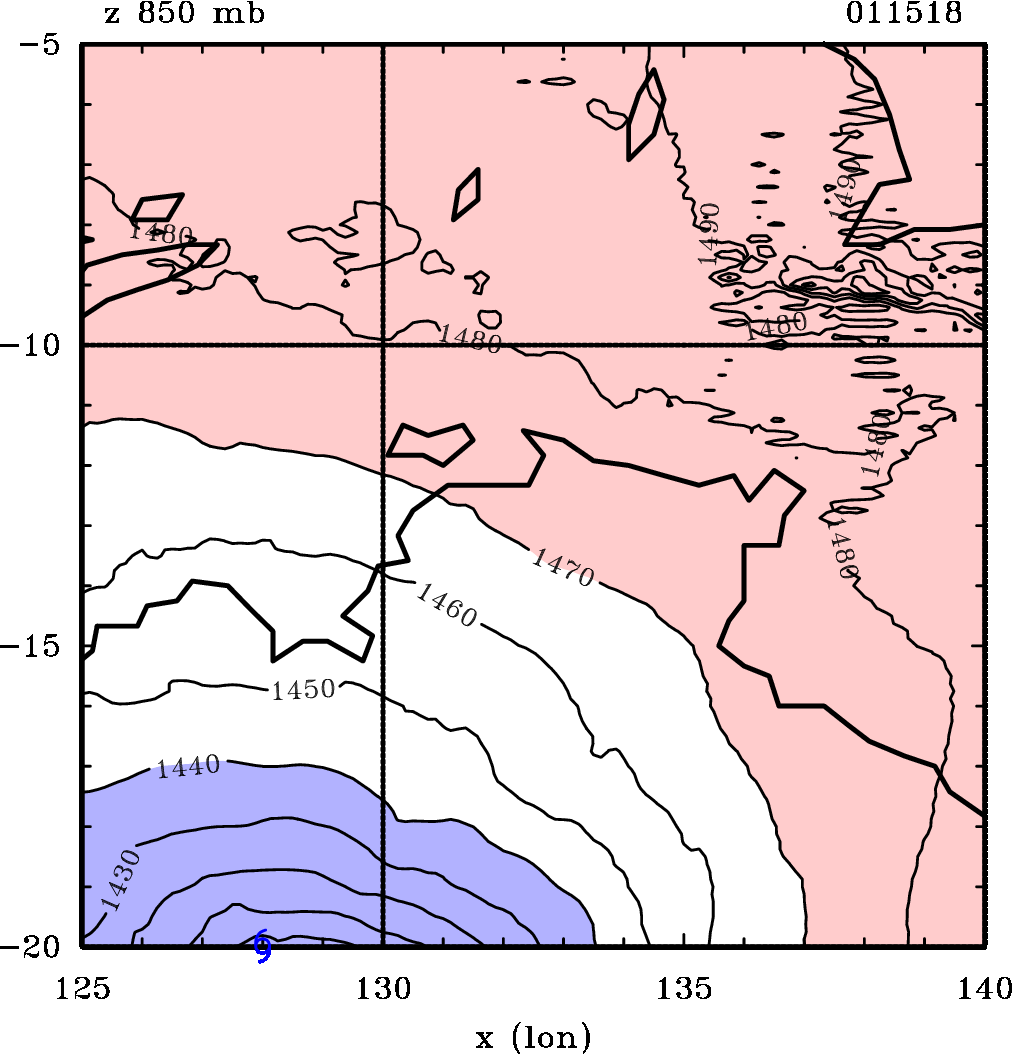
Geopotential heights at 850 mb
The following plots show contours of geopotential minimum during the genesis and mature stage of the disturbances. In each plot, the contours of geopotential are shown, as is the location of the minimum geopotential (denoted by the cyclone symbol).
12 Jan 00Z | 12 Jan 06Z |
|---|---|
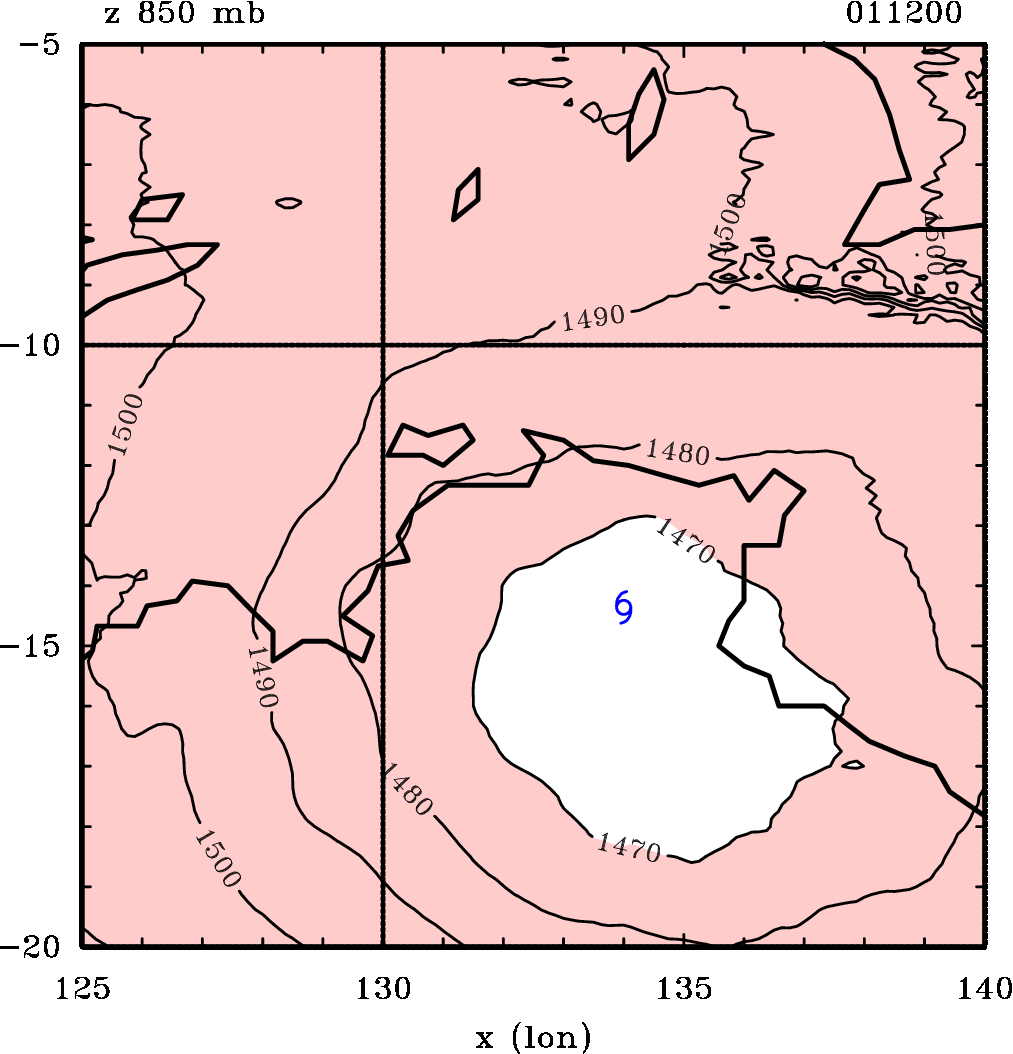 | 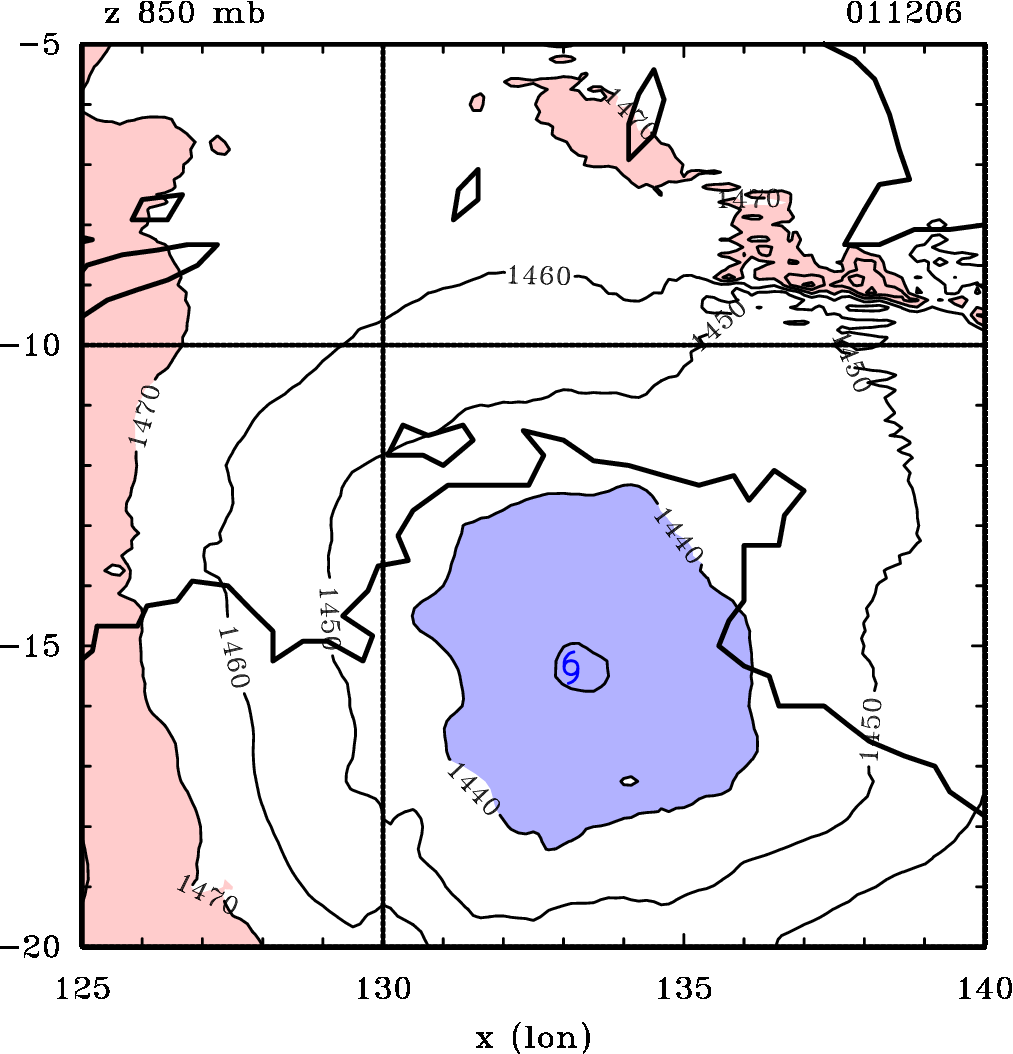 |
12 Jan 12Z | 12 Jan 18Z |
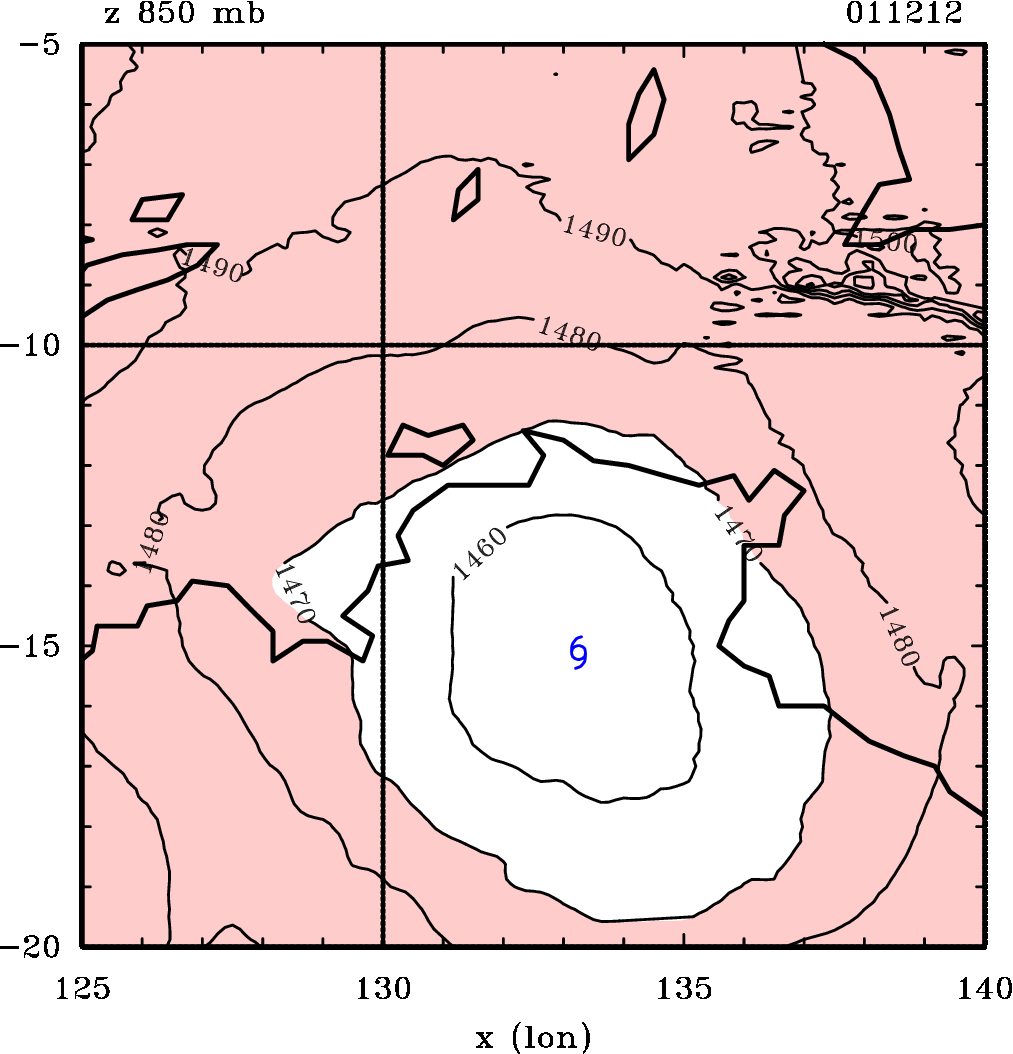 |  |
13 Jan 00Z | 13 Jan 06Z |
 |  |
13 Jan 12Z | 13 Jan 18Z |
 |  |
14 Jan 00Z | 14 Jan 06Z |
 |  |
14 Jan 12Z | 14 Jan 18Z |
 |  |
15 Jan 00Z | 15 Jan 06Z |
 |  |
15 Jan 12Z | 15 Jan 18Z |
 |  |
Copyright © Gerard Kilroy