Sidebar
teaching:radiative_transfer:uv_irrad
Impact of various parameters on UV irradiance
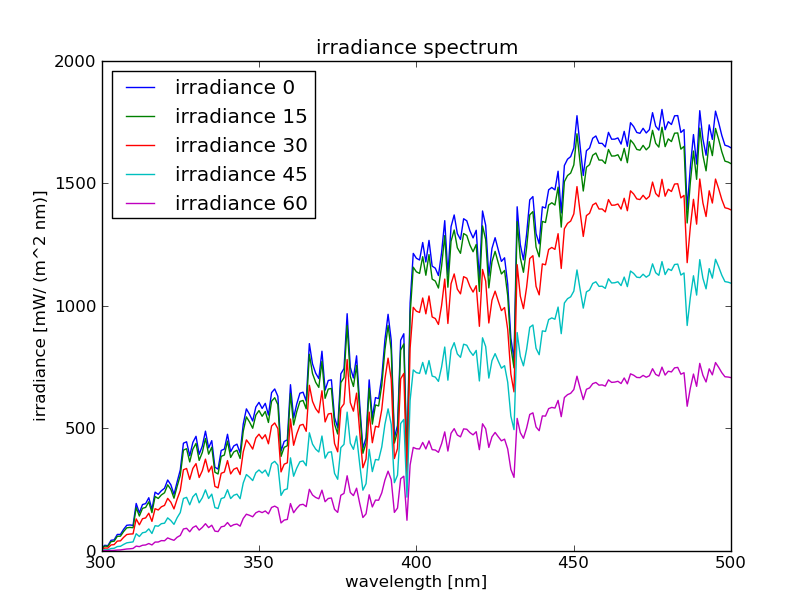
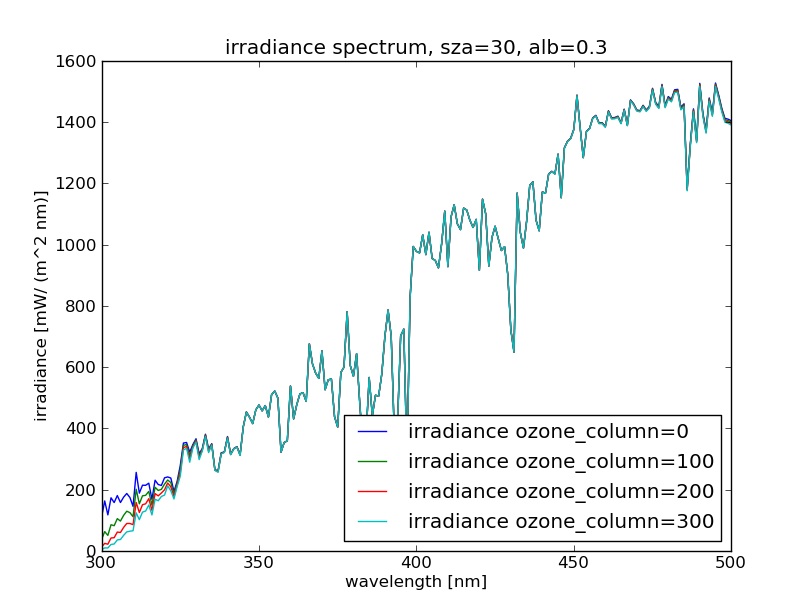
Task: In the spectral range from 300 nm to 500 nm investigate the influence of the following parameters on the irradiance spectrum: solar zenith angle, surface albedo, ozone column.
- uv.sh
libradtran_path='/local/libRadtran-1.5-beta/bin'


for var in 0 15 30 45 60 ; do
 sed 's/SSS/'$var'/' < uv-zenith.inp > uv-$var.inp | $libradtran_path/uvspec -i uv-$var.inp > tmp/uv$var.out
done
- solar_irradiance_spectrum.py
from pylab import *
from matplotlib import pyplot


solar_spectrum=loadtxt('/local/libRadtran-1.5-beta/data/solar_flux/kurudz_1.0nm.dat')

# irradiance from 300 to 500 nm
sw_spectrum=loadtxt('tmp/uv0.out')

pyplot.plot(sw_spectrum[:,0], sw_spectrum[:,1], label='irradiance 0') # change 1 to desired variable

pyplot.title('irradiance spectrum')
pyplot.xlabel('wavelength [nm]')
pyplot.ylabel('irradiance [mW/ (m^2 nm)]')
pyplot.legend(loc=2)


sw_spectrum=loadtxt('tmp/uv15.out')
pyplot.plot(sw_spectrum[:,0], sw_spectrum[:,1], label='irradiance 15') # change 1 to desired variable

pyplot.title('irradiance spectrum')
pyplot.xlabel('wavelength [nm]')
pyplot.ylabel('irradiance [mW/ (m^2 nm)]')
pyplot.legend(loc=2)

sw_spectrum=loadtxt('tmp/uv30.out')
pyplot.plot(sw_spectrum[:,0], sw_spectrum[:,1], label='irradiance 30') # change 1 to desired variable

pyplot.title('irradiance spectrum')
pyplot.xlabel('wavelength [nm]')
pyplot.ylabel('irradiance [mW/ (m^2 nm)]')
pyplot.legend(loc=2)

sw_spectrum=loadtxt('tmp/uv45.out')
pyplot.plot(sw_spectrum[:,0], sw_spectrum[:,1], label='irradiance 45') # change 1 to desired variable

pyplot.title('irradiance spectrum')
pyplot.xlabel('wavelength [nm]')
pyplot.ylabel('irradiance [mW/ (m^2 nm)]')
pyplot.legend(loc=2)
{{:teaching:radiative_transfer:uv-spectrum1.png|}}
sw_spectrum=loadtxt('tmp/uv60.out')
pyplot.plot(sw_spectrum[:,0], sw_spectrum[:,1], label='irradiance 60') # change 1 to desired variable

pyplot.title('irradiance spectrum')
pyplot.xlabel('wavelength [nm]')
pyplot.ylabel('irradiance [mW/ (m^2 nm)]')
pyplot.legend(loc=2)


pyplot.show()
pyplot.savefig('solar_irrad_uv.png')
- exe.inp
data_files_path /local/libRadtran-1.5-beta/data

                # Location of atmospheric profile file.
atmosphere_file         us-standard

mol_abs_param             lowtran
                         # Location of the extraterrestrial spectrum
source solar              kurudz_1.0nm.dat

albedo 0.3

sza 30.0

ozone_column  SSS

rte_solver disort2  #Radiance transfer solver

wavelength 300.0 500.0   # Wavelength range [nm]

zout sur
- uv_o.sh
libradtran_path='/local/libRadtran-1.5-beta/bin'


for var in 0. 100. 200. 300. ; do
 sed 's/SSS/'$var'/' < exe.inp > uv-$var.inp | $libradtran_path/uvspec -i uv-$var.inp > tmp_ozone/uv$var.out
done
- solar_irradiance_spectrum_ozone.py
from pylab import *
from matplotlib import pyplot


solar_spectrum=loadtxt('/local/libRadtran-1.5-beta/data/solar_flux/kurudz_1.0nm.dat')

# irradiance from 300 to 500 nm
sw_spectrum=loadtxt('/home/users/lainer/Strahlung/tmp_ozone/uv0..out')
pyplot.plot(sw_spectrum[:,0], sw_spectrum[:,1], label='irradiance ozone_column=0') # change 1 to desired variable

pyplot.title('irradiance spectrum')
pyplot.xlabel('wavelength [nm]')
pyplot.ylabel('irradiance [mW/ (m^2 nm)]')
pyplot.legend(loc=4)

sw_spectrum1=loadtxt('/home/users/lainer/Strahlung/tmp_ozone/uv100..out')
pyplot.plot(sw_spectrum1[:,0], sw_spectrum1[:,1], label='irradiance ozone_column=100') # change 1 to desired variable

pyplot.title('irradiance spectrum, sza=30, alb=0.3')
pyplot.xlabel('wavelength [nm]')
pyplot.ylabel('irradiance [mW/ (m^2 nm)]')
pyplot.legend(loc=4)


sw_spectrum3=loadtxt('/home/users/lainer/Strahlung/tmp_ozone/uv200..out')
pyplot.plot(sw_spectrum3[:,0], sw_spectrum3[:,1], label='irradiance ozone_column=200') # change 1 to desired variable

pyplot.title('irradiance spectrum')
pyplot.xlabel('wavelength [nm]')
pyplot.ylabel('irradiance [mW/ (m^2 nm)]')
pyplot.legend(loc=4)


sw_spectrum5=loadtxt('/home/users/lainer/Strahlung/tmp_ozone/uv300..out')
pyplot.plot(sw_spectrum5[:,0], sw_spectrum5[:,1], label='irradiance ozone_column=300') # change 1 to desired variable

pyplot.title('irradiance spectrum, sza=30, alb=0.3')
pyplot.xlabel('wavelength [nm]')
pyplot.ylabel('irradiance [mW/ (m^2 nm)]')
pyplot.legend(loc=4)


pyplot.savefig('solar_irrad_uv.png')
show()
teaching/radiative_transfer/uv_irrad.txt · Last modified: 2018/05/04 08:40 (external edit)
Except where otherwise noted, content on this wiki is licensed under the following license: GNU Free Documentation License 1.3


