Sidebar
teaching:radiative_transfer:disort_nstr1
Discrete ordinate method: Impact of number of streams on clearsky radiance field at surface
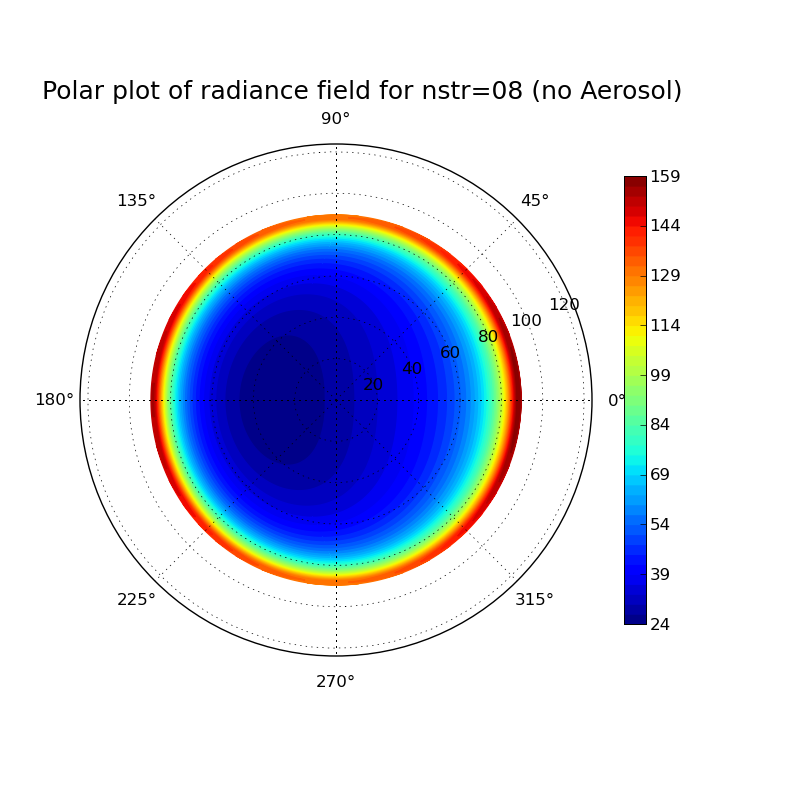
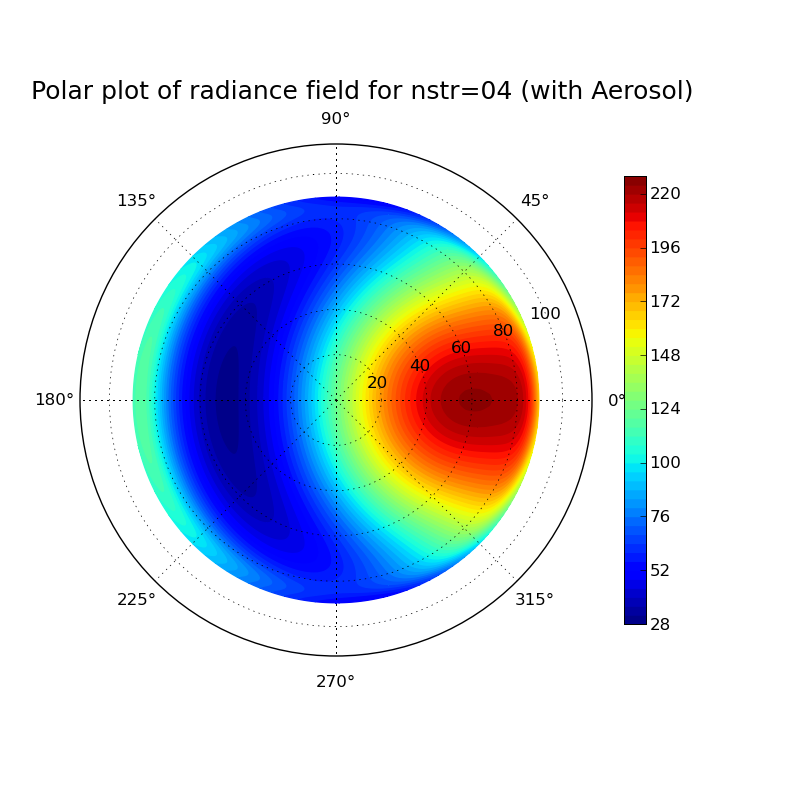
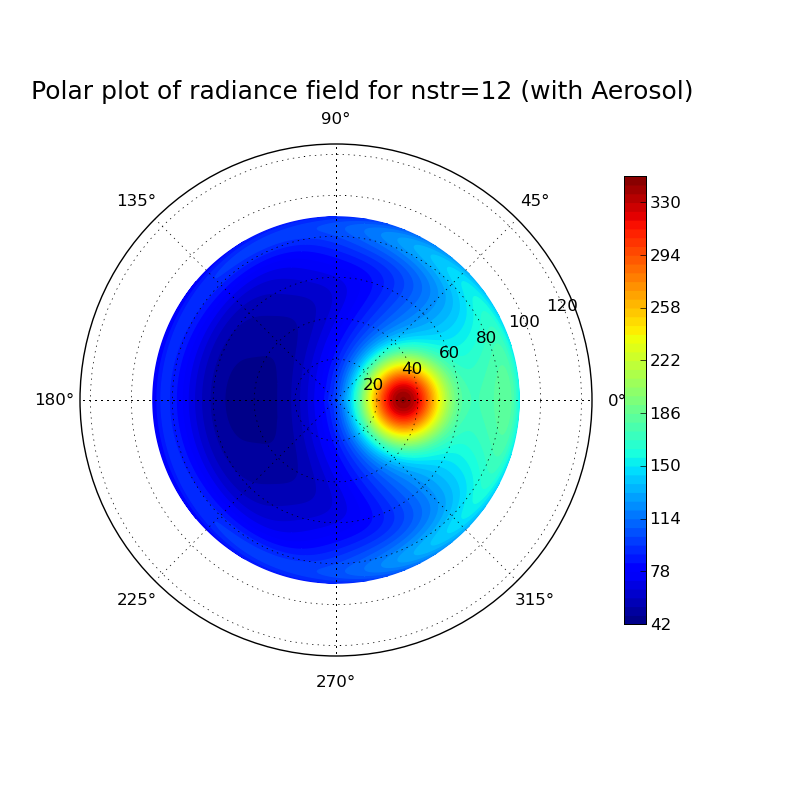
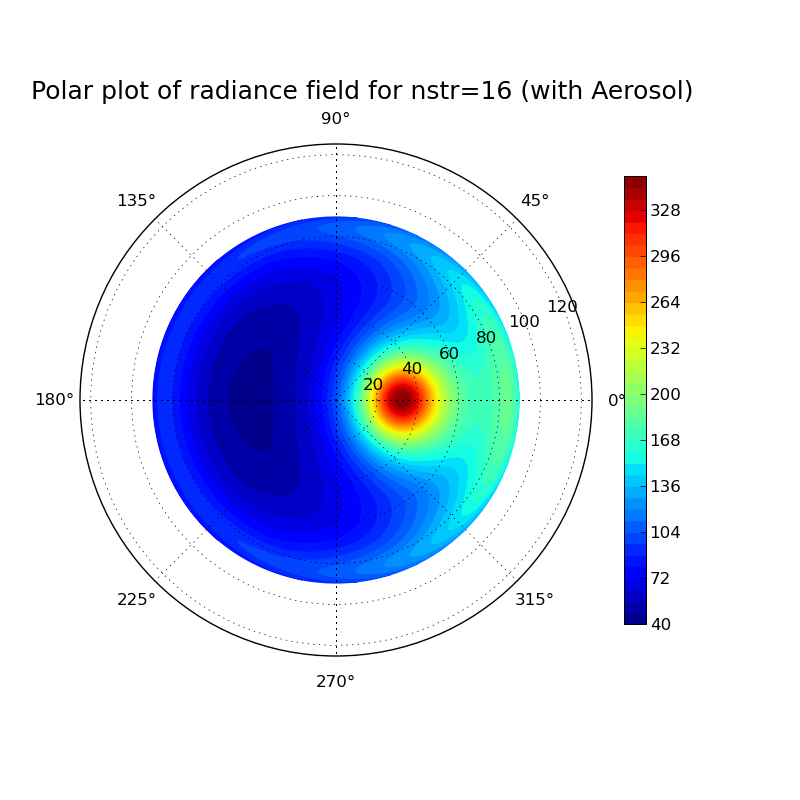
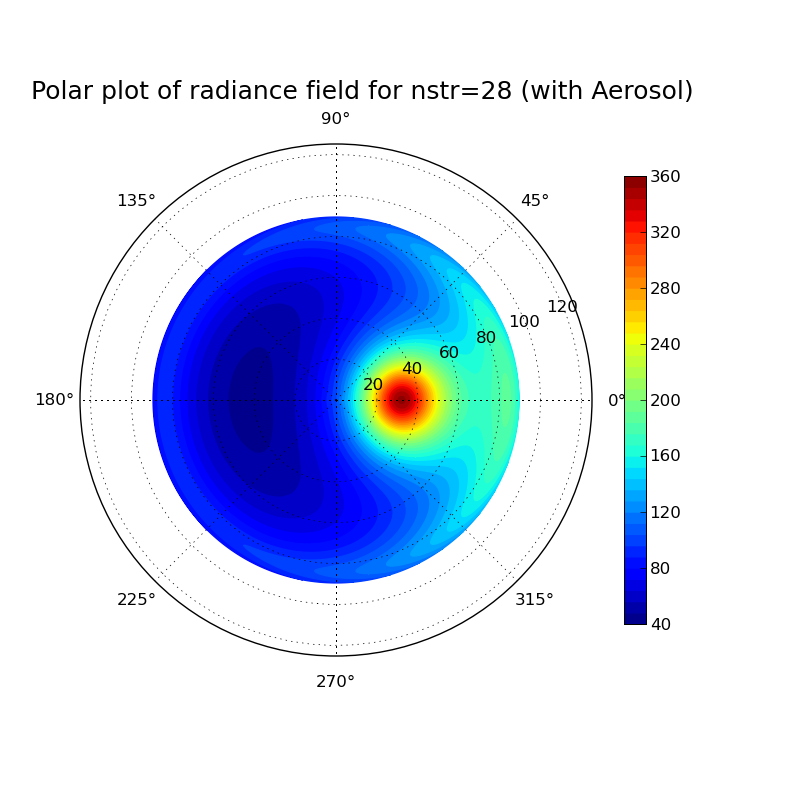
Task: Calculate the radiance field for a clearsky atmosphere at the surface using the DISORT solver (version 1 which includes the DOM solution method which was derived in the lecture). Perform the calculation for a pure Rayleigh atmosphere (only molecular absorption and scattering) and for an atmosphere including aerosol. What changes when you include aeorsol? Investigate the impact of the number of streams used in the discrete ordinate solution for the aerosol case.
- disort1.inp
# libRadtran input file to compute the radiation field at the surface for a
# clearsky atmosphere. Molecular scattering and absorption (and aerosol) is taken
# into account. With "rte_solver disort" and "deltam off" we get the
# solution method which we derived in the radiative transfer lecture.
#
# In order to test the calculation of radiances with less than 16
# streams, please comment out line 6173 in the file src/uvspec_lex.l
# and recompile libRadtran.

                         # specify libRadtran data path
data_files_path          /local/emde/libRadtran/data

sza 30                   # solar zenith angle

                         # extraterrestrial solar radiation
source solar             kurudz_1.0nm.dat

                         # Location of atmospheric profile file.
atmosphere_file          us-standard

albedo 0.0               # Surface albedo

rte_solver disort        # Radiative transfer equation solver
                         # disort2 with intensity correction, disort1 without

deltam off               # disable delta-scaling

nstr 8                  # number of streams used in DISORT

wavelength  500          # Wavelength range [nm]

#aerosol_default          # the simplest way to include aerosol :-)

zout sur

umu  -1 -0.99 -0.98 -0.97 -0.96 -0.95 -0.94 -0.93 -0.92 -0.91 -0.9 -0.89 -0.88 -0.87 -0.86 -0.85 -0.84 -0.83 -0.82 -0.81 -0.8 -0.79 -0.78 -0.77 -0.76 -0.75 -0.74 -0.73 -0.72 -0.71 -0.7 -0.69 -0.68 -0.67 -0.66 -0.65 -0.64 -0.63 -0.62 -0.61 -0.6 -0.59 -0.58 -0.57 -0.56 -0.55 -0.54 -0.53 -0.52 -0.51 -0.5 -0.49 -0.48 -0.47 -0.46 -0.45 -0.44 -0.43 -0.42 -0.41 -0.4 -0.39 -0.38 -0.37 -0.36 -0.35 -0.34 -0.33 -0.32 -0.31 -0.3 -0.29 -0.28 -0.27 -0.26 -0.25 -0.24 -0.23 -0.22 -0.21 -0.2 -0.19 -0.18 -0.17 -0.16 -0.15 -0.14 -0.13 -0.12 -0.11 -0.1 -0.09 -0.08 -0.07 -0.06 -0.05 -0.04 -0.03 -0.02 -0.01

phi 0 2 4 6 8 10 12 14 16 18 20 22 24 26 28 30 32 34 36 38 40 42 44 46 48 50 52 54 56 58 60 62 64 66 68 70 72 74 76 78 80 82 84 86 88 90 92 94 96 98 100 102 104 106 108 110 112 114 116 118 120 122 124 126 128 130 132 134 136 138 140 142 144 146 148 150 152 154 156 158 160 162 164 166 168 170 172 174 176 178 180 182 184 186 188 190 192 194 196 198 200 202 204 206 208 210 212 214 216 218 220 222 224 226 228 230 232 234 236 238 240 242 244 246 248 250 252 254 256 258 260 262 264 266 268 270 272 274 276 278 280 282 284 286 288 290 292 294 296 298 300 302 304 306 308 310 312 314 316 318 320 322 324 326 328 330 332 334 336 338 340 342 344 346 348 350 352 354 356 358 360
- radfield_polar.py
# This file generates a polar plot of the radiation field calculated
# with libRadtran.

from pylab import *

from libradtran import *
# In order to import libradtran functions copy the file libradtran.py
# (available at
# http://www.meteo.physik.uni-muenchen.de/~emde/doku.php?id=python:pylibtran )
# in your working directory

# number of streams
nstr=8

# read uvspec output
(umu, phi, rad_av, rad) = read_librad_radiances('aerosol_nstr%02d.out'
                                                % nstr)

fig = figure(figsize=(8,8))

# Create axes for polar plot
ax = fig.add_axes([0.1, 0.1, 0.8, 0.8], polar=True)

# number of contours
N=50
contourf(phi*pi/180, 180.-arccos(umu)*180/pi, rad, N, cmap=cm.jet)
# see help(colormap) for available color schemes
colorbar(shrink=0.7)
# specify limits for colors if needed
# clim(20,100)

text(0.55, 1.1, 'Polar plot of radiance field for nstr=%02d' %nstr, fontsize=18,
     horizontalalignment='center',
     verticalalignment='center',
     transform = ax.transAxes)

# Save file
savefig('aerosol_nstr%02d.png' % nstr)
- nstr_loop.csh
#Erstellt aus template.inp verschiedene uvspec input und output files,
#anschließend wird mit template.py jedes einzelne output file geplottet.

#!/bin/csh

set template=/athome/hube_is/libRadtran_exercises/Lecture_exercises/6_Impact_of_nstr/uvspec_withAerosol_nstrtemplate.inp

set outdir=/athome/hube_is/libRadtran_exercises/Lecture_exercises/6_Impact_of_nstr

foreach nstr ( 04 12 16 20 28 32 )

    echo ... nstr = $nstr

    gawk -vs=$nstr '{gsub("VARIABLE",s); print}' $template > /athome/hube_is/libRadtran_exercises/Lecture_exercises/6_Impact_of_nstr/uvspec_withAerosol_nstr$nstr.inp

    uvspec <uvspec_withAerosol_nstr$nstr.inp >uvspec_withAerosol_nstr$nstr.out


end

set template=/athome/hube_is/libRadtran_exercises/Lecture_exercises/6_Impact_of_nstr/radfield_polar_nstrtemplate.py

set outdir=/athome/hube_is/libRadtran_exercises/Lecture_exercises/6_Impact_of_nstr

foreach nstr ( 04 12 16 20 28 32 )


    gawk -vs=$nstr '{gsub("VARIABLE",s); print}' $template > /athome/hube_is/libRadtran_exercises/Lecture_exercises/6_Impact_of_nstr/radfield_polar_nstr$nstr.py

    python radfield_polar_nstr$nstr.py


end


exit 0
teaching/radiative_transfer/disort_nstr1.txt · Last modified: 2018/05/04 08:40 (external edit)
Except where otherwise noted, content on this wiki is licensed under the following license: GNU Free Documentation License 1.3

