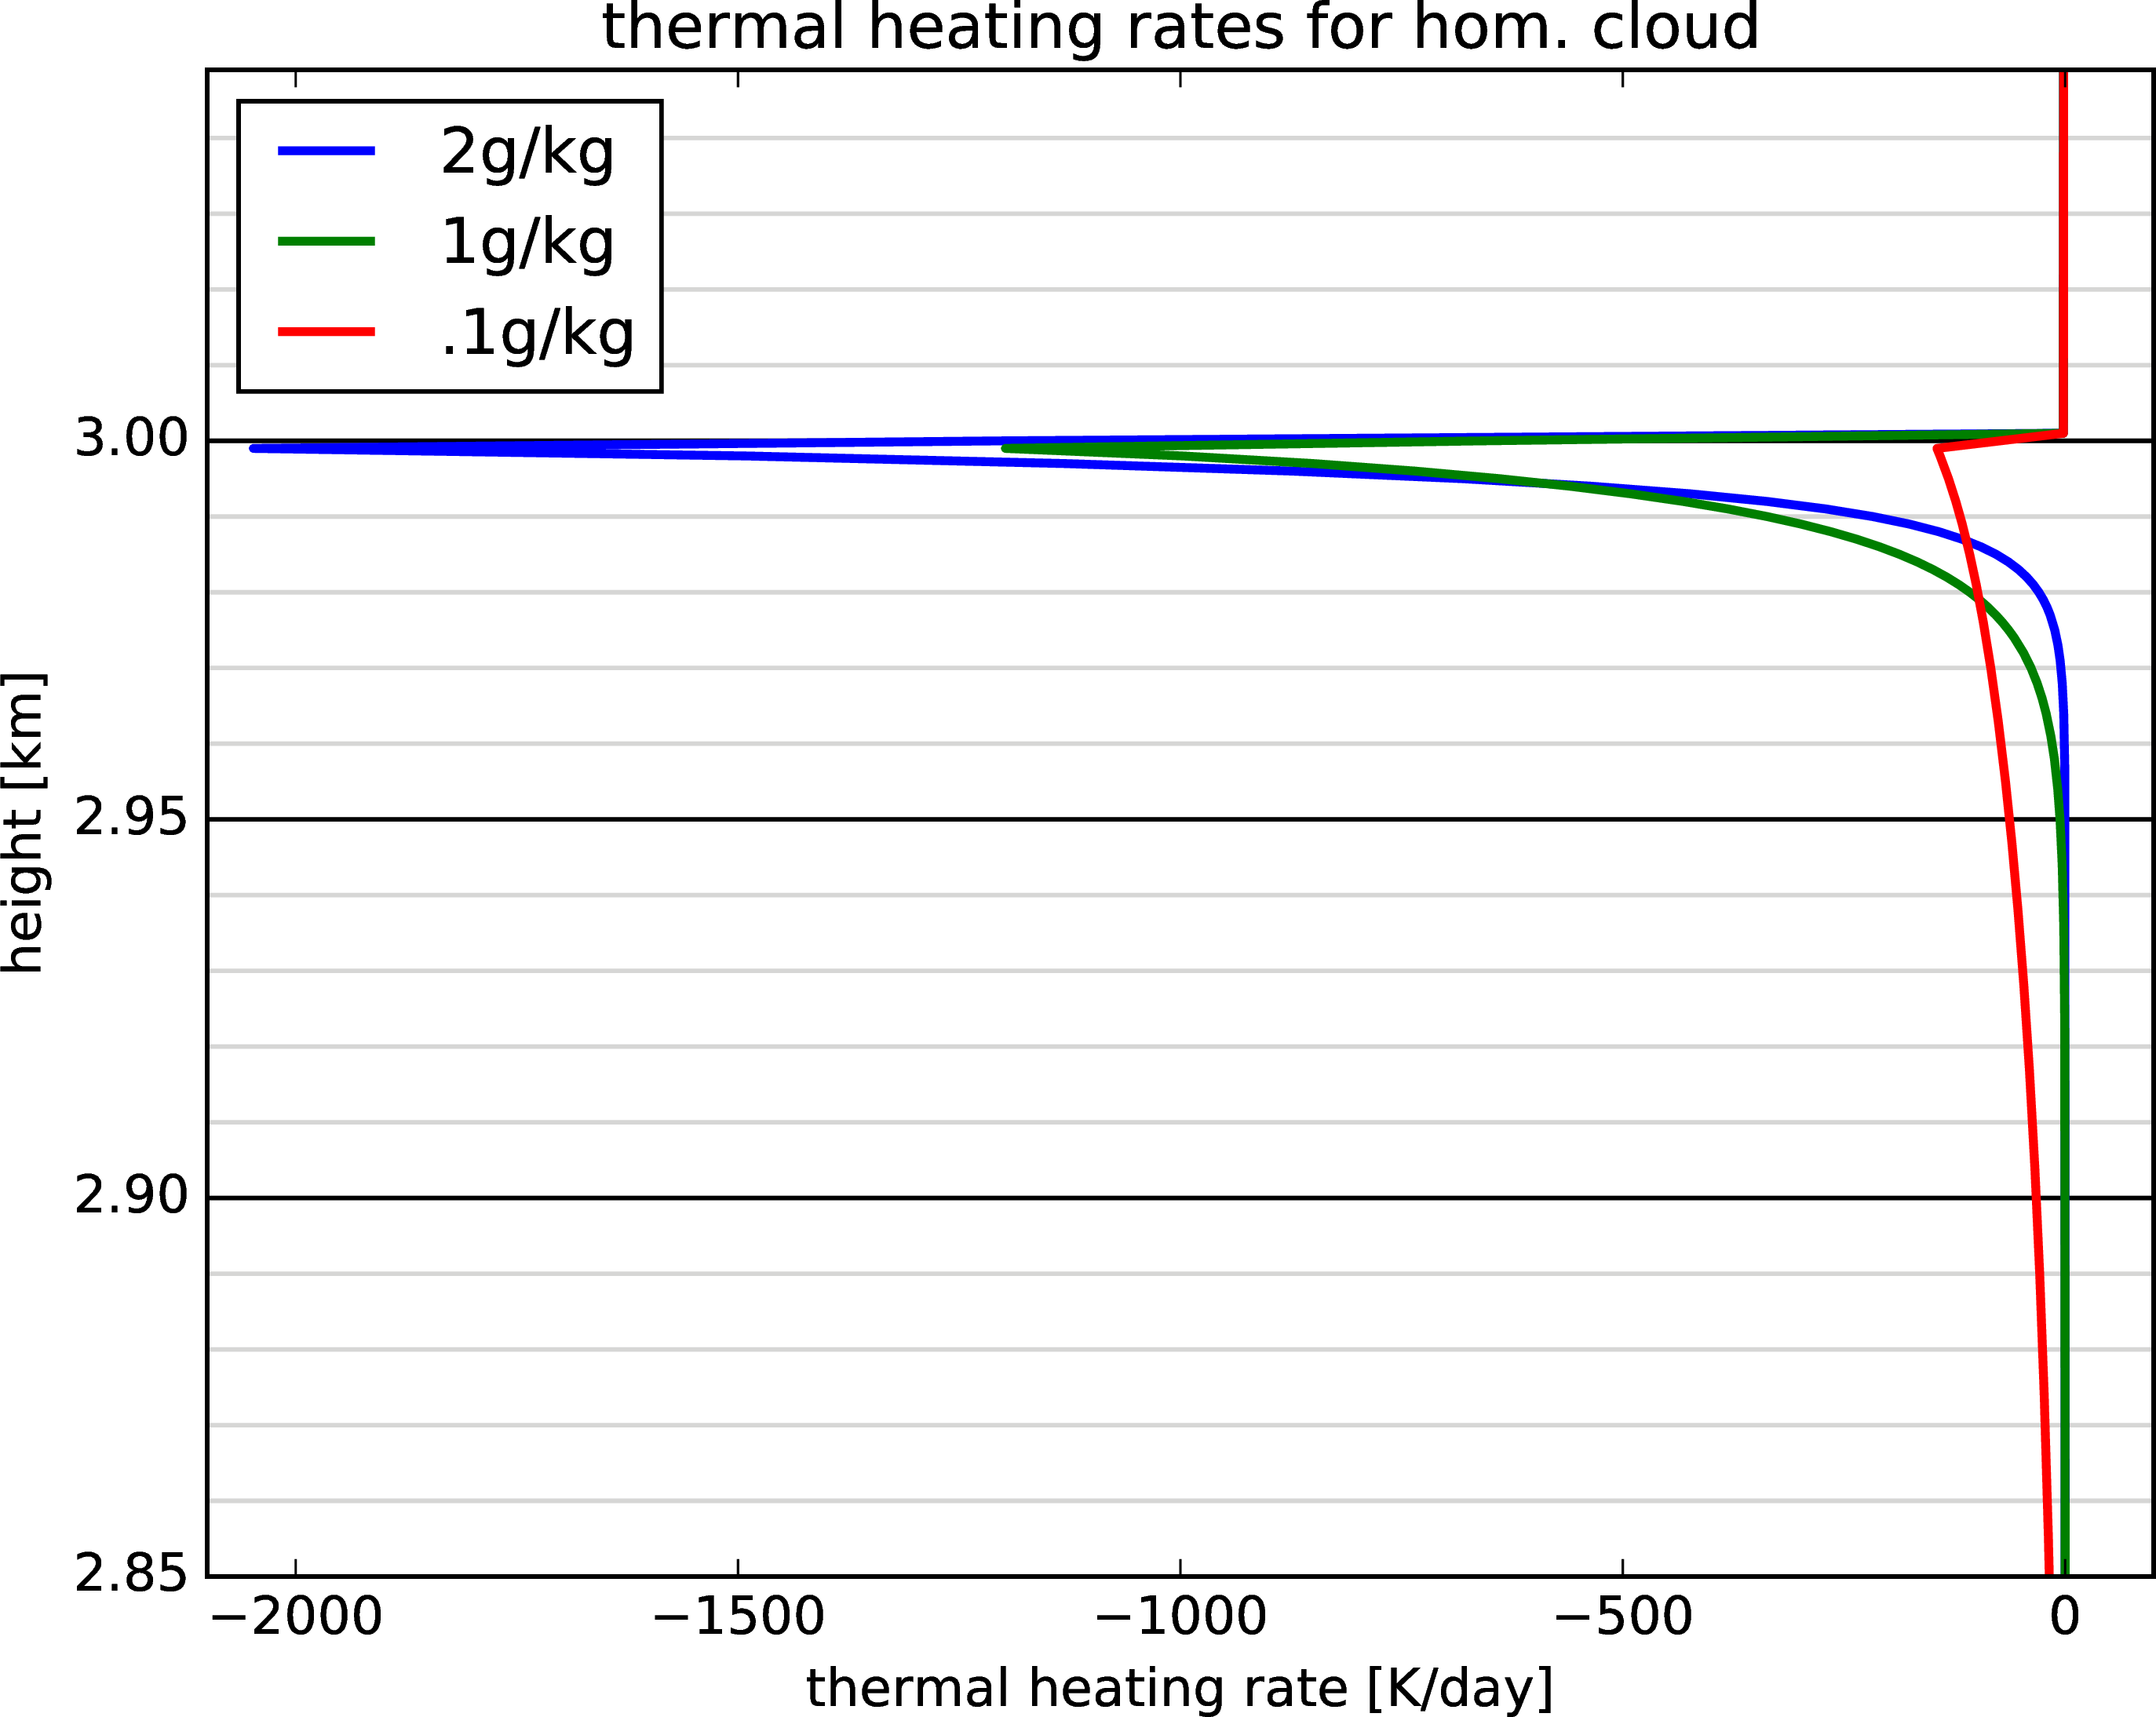
The following graph depicts the thermal cooling rates at the top of a homogeneous cloud with varying liquid water content. Notably, thermal cooling rates can be found up to 100m inside a cloud counting from the top.
However, for thicker clouds the mean penetration depth is more like 25 to 50m.
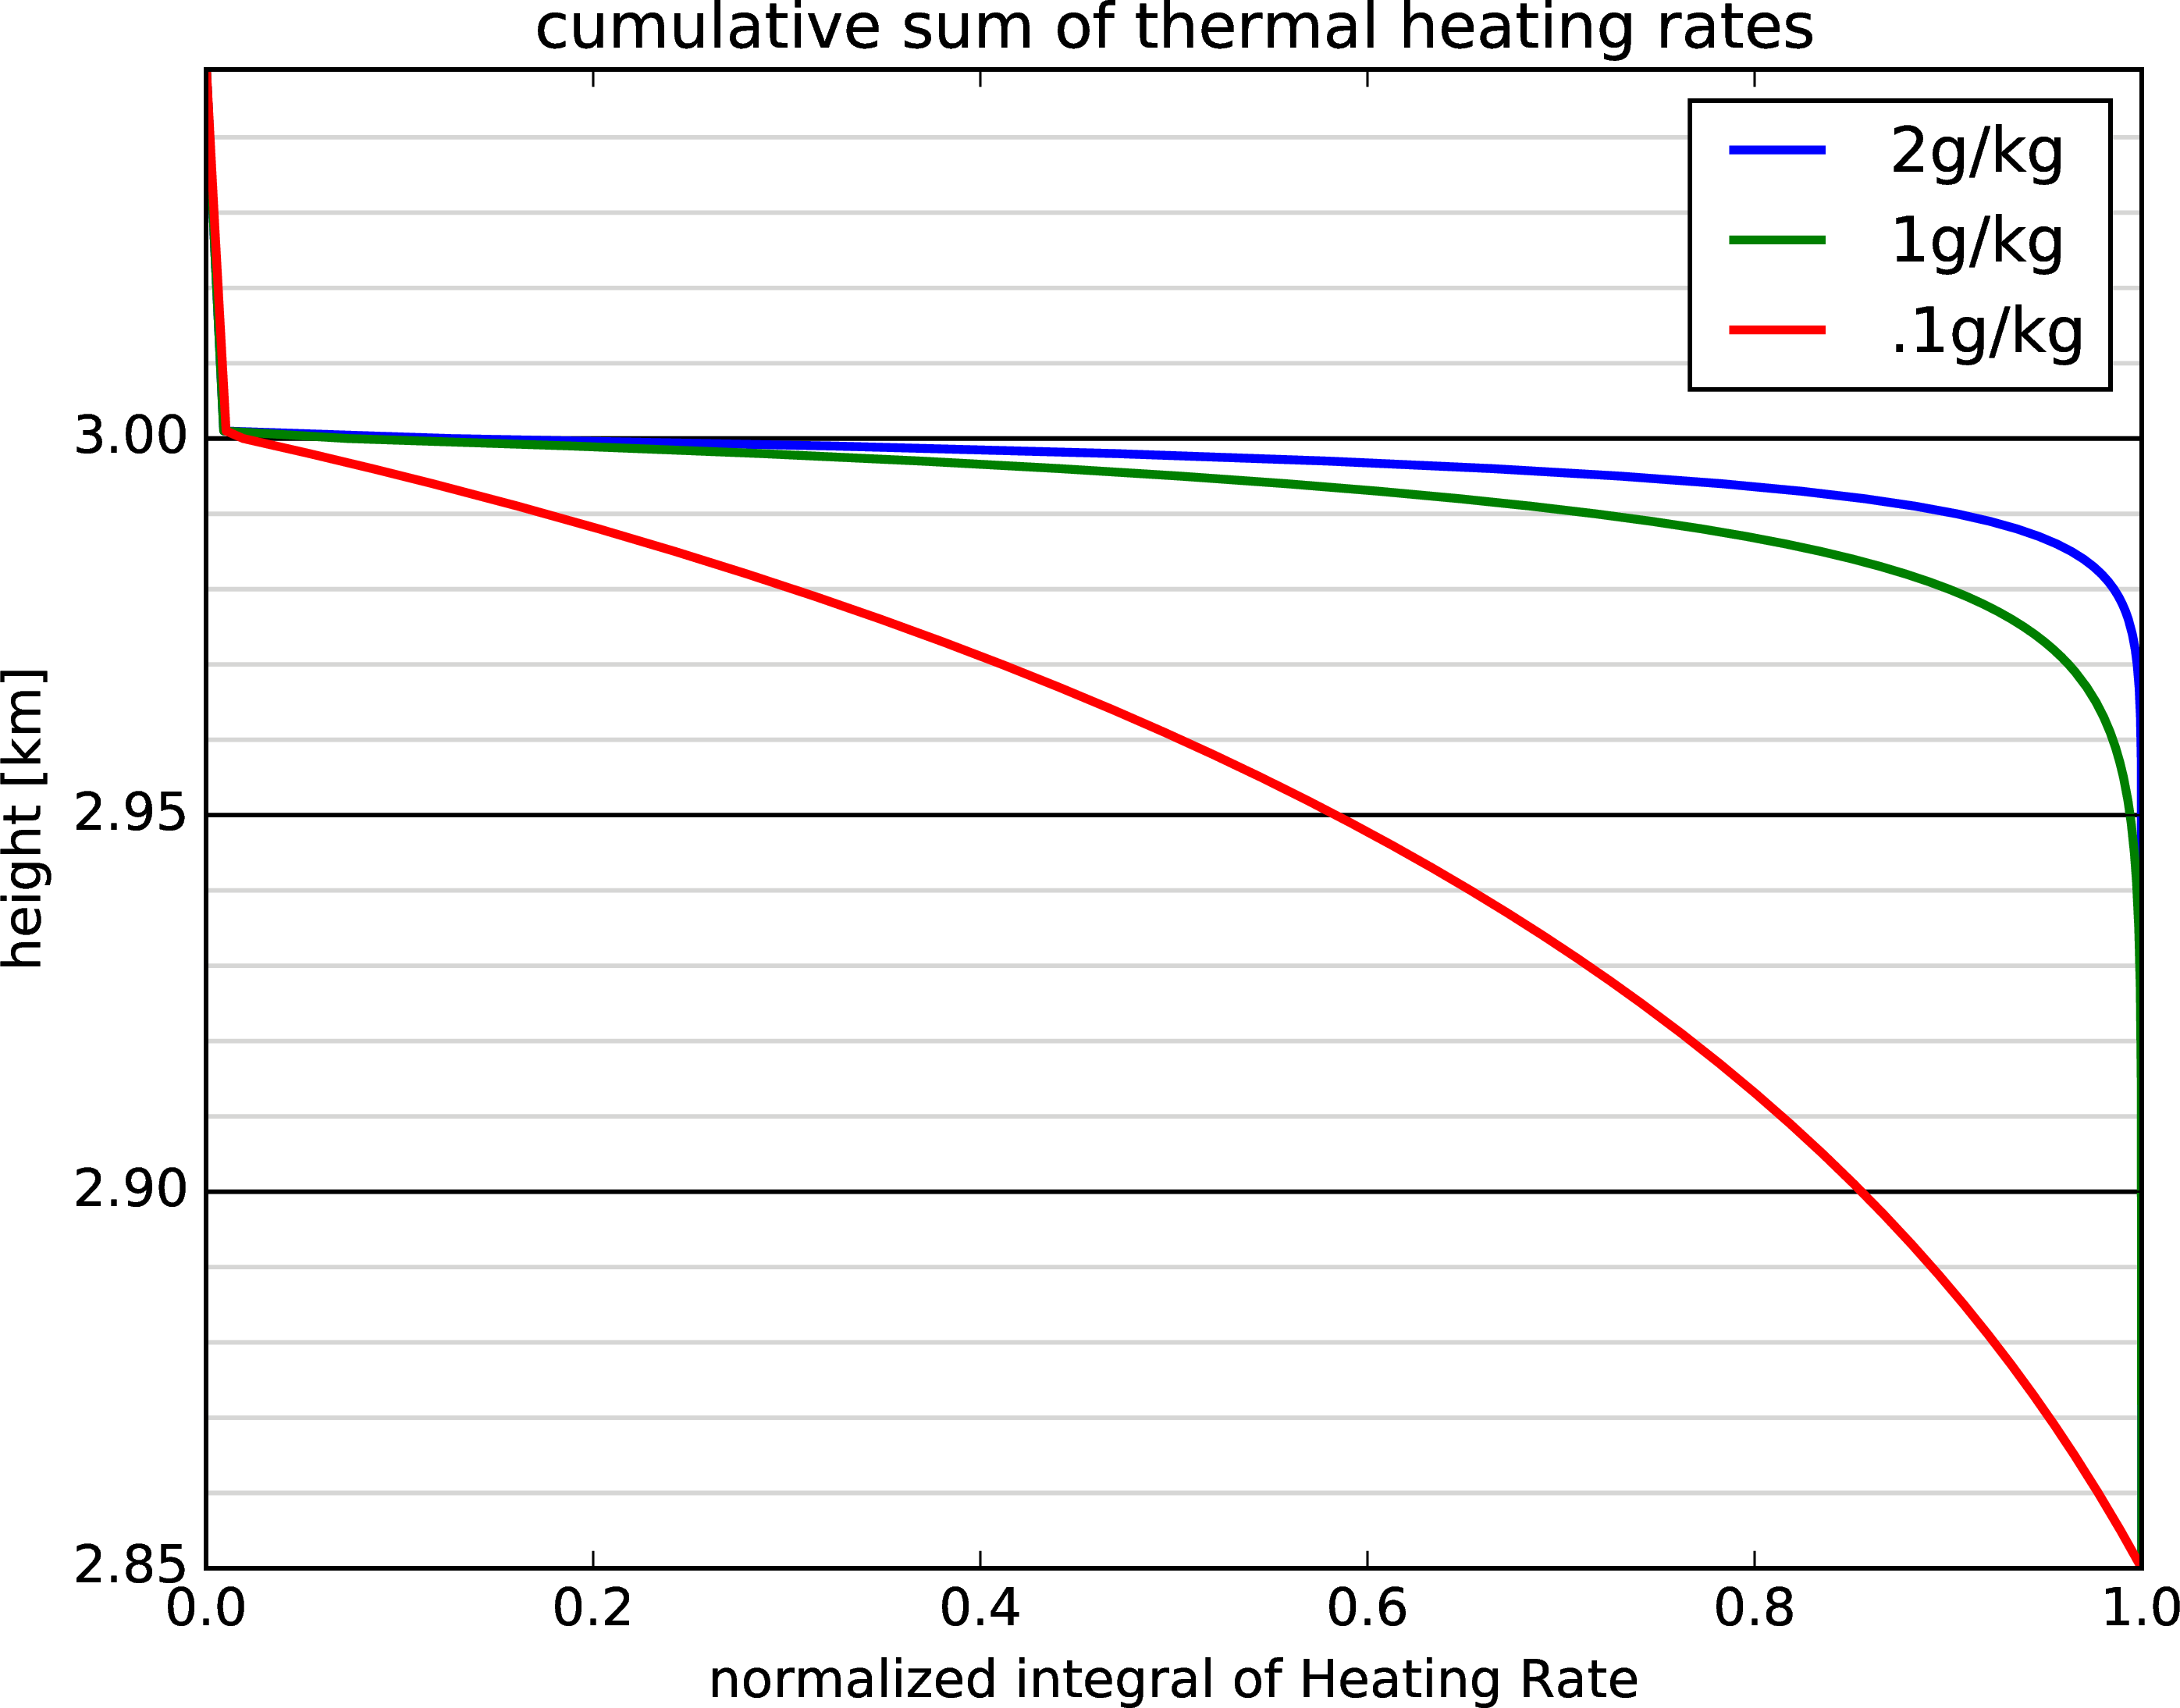
The following graph shows the normalized integral of thermal cooling, i.e. at which depth happened how much cooling.