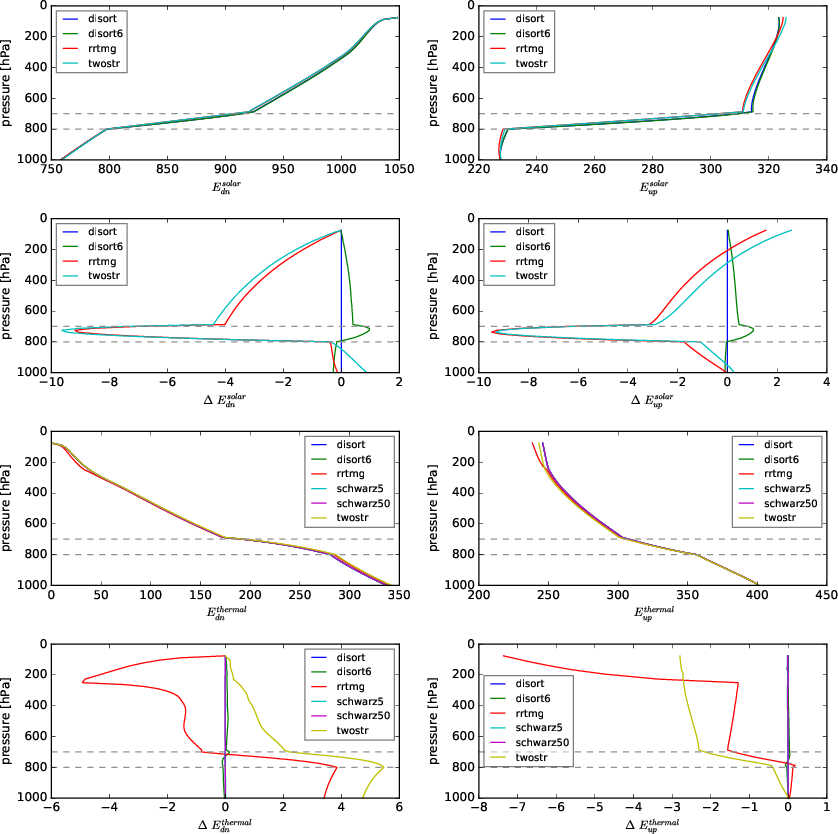
Experiment setup:
We run a small simulations for the solar and thermal spectral range and compare the results to various 1D solvers in the TenStream lib. There is a cloud with LWC=\(0.01\ [g / kg]\) between 800 and 700 hPa. The dynamics grid extends up to 250 hPa and has a temperature gradient of 60K. Above that we use the US standard atmosphere file up to a height of 20km.
The 1D solvers which are used are:
- DISORT — using 32 streams for benchmark computations
- DISORT6 — with 6 streams
- RRTMG — \(\delta\)-four-stream
- TwoStream — \(\delta\)-Eddington
- Schwarzschild — only in the thermal spectral range, the number tells the number of sampling points for polar angles \(\mu\)
The following plot depicts the differences between the various solver routines and uses the DISORT with 32 streams as benchmark results.
Appendix: Scripts to reproduce the plot
The following computations have been done
with Tenstream @ Rev 4fabaa24031ef8602e2a3d8f67f1860ee409ddb2
and the following … script:
make ex_pprts_rrtm_iterations -j || exit
bin/ex_pprts_rrtm_iterations -atm_filename afglus.dat -Nz 60 -thermal no -theta0 40 -twostr_only                        |& tee log.solar.twostr
bin/ex_pprts_rrtm_iterations -atm_filename afglus.dat -Nz 60 -thermal no -theta0 40 -rrtmg_only                         |& tee log.solar.rrtmg
bin/ex_pprts_rrtm_iterations -atm_filename afglus.dat -Nz 60 -thermal no -theta0 40 -disort_only                        |& tee log.solar.disort

bin/ex_pprts_rrtm_iterations -atm_filename afglus.dat -Nz 60 -solar no -twostr_only                                     |& tee log.thermal.twostr
bin/ex_pprts_rrtm_iterations -atm_filename afglus.dat -Nz 60 -solar no -twostr_only -schwarzschild -schwarzschild_Nmu 5 |& tee log.thermal.schwarz
bin/ex_pprts_rrtm_iterations -atm_filename afglus.dat -Nz 60 -solar no -rrtmg_only                                      |& tee log.thermal.rrtmg
bin/ex_pprts_rrtm_iterations -atm_filename afglus.dat -Nz 60 -solar no -disort_only -disort_streams 32                  |& tee log.thermal.disort
Then remove any debug output from the logs
rm log.*.clean
for f in log.*.*
do
  grep 'edn' $f > ${f}.clean
done
Python Plot Script … here