
Dies ist eine alte Version des Dokuments!
| Munich: MIM-ceilometer Lufft CHM15kx (blueYALIS) @ 1064 nm | ||||
 |  | |||
| Munich: MIM-ceilometer Lufft CHM8k (redYALIS) @ 905 nm | ||||
 | ||||
| Munich: MIM-ceilometer Lufft CHM15k @ 1064 nm | ||||
 | ||||
| Munich: MIM-ceilometer Campbell Scientific SkyVUE PRO @ 912 nm | ||||
 | ||||
| Munich: MIM-ceilometer Vaisala CL31 @ 910 nm | ||||
 | ||||
| Munich: MIM-ceilometer Vaisala CL51 @ 910 nm | ||||
 | ||||
| Munich: MIM-ceilometer Vaisala CL61 @ 910 nm Munich: MIM-ceilometer Vaisala CL61 @ 910 nm Range Corrected Signal | ||||
 | ||||
| Volume Linear Depolarization Ratio | ||||
 | ||||
| Schneefernerhaus Zugspitze: UFS-Ceilometer Lufft CHM15kx @ 1064 nm | ||||
 | ||||
Archive: July 2025
| MON | TUE | WED | THU | FRI | SAT | SUN |
| 1 | 2 | 3 | 4 | 5 | 6 | |
| 7 | 8 | 9 | 10 | 11 | 12 |
Change month
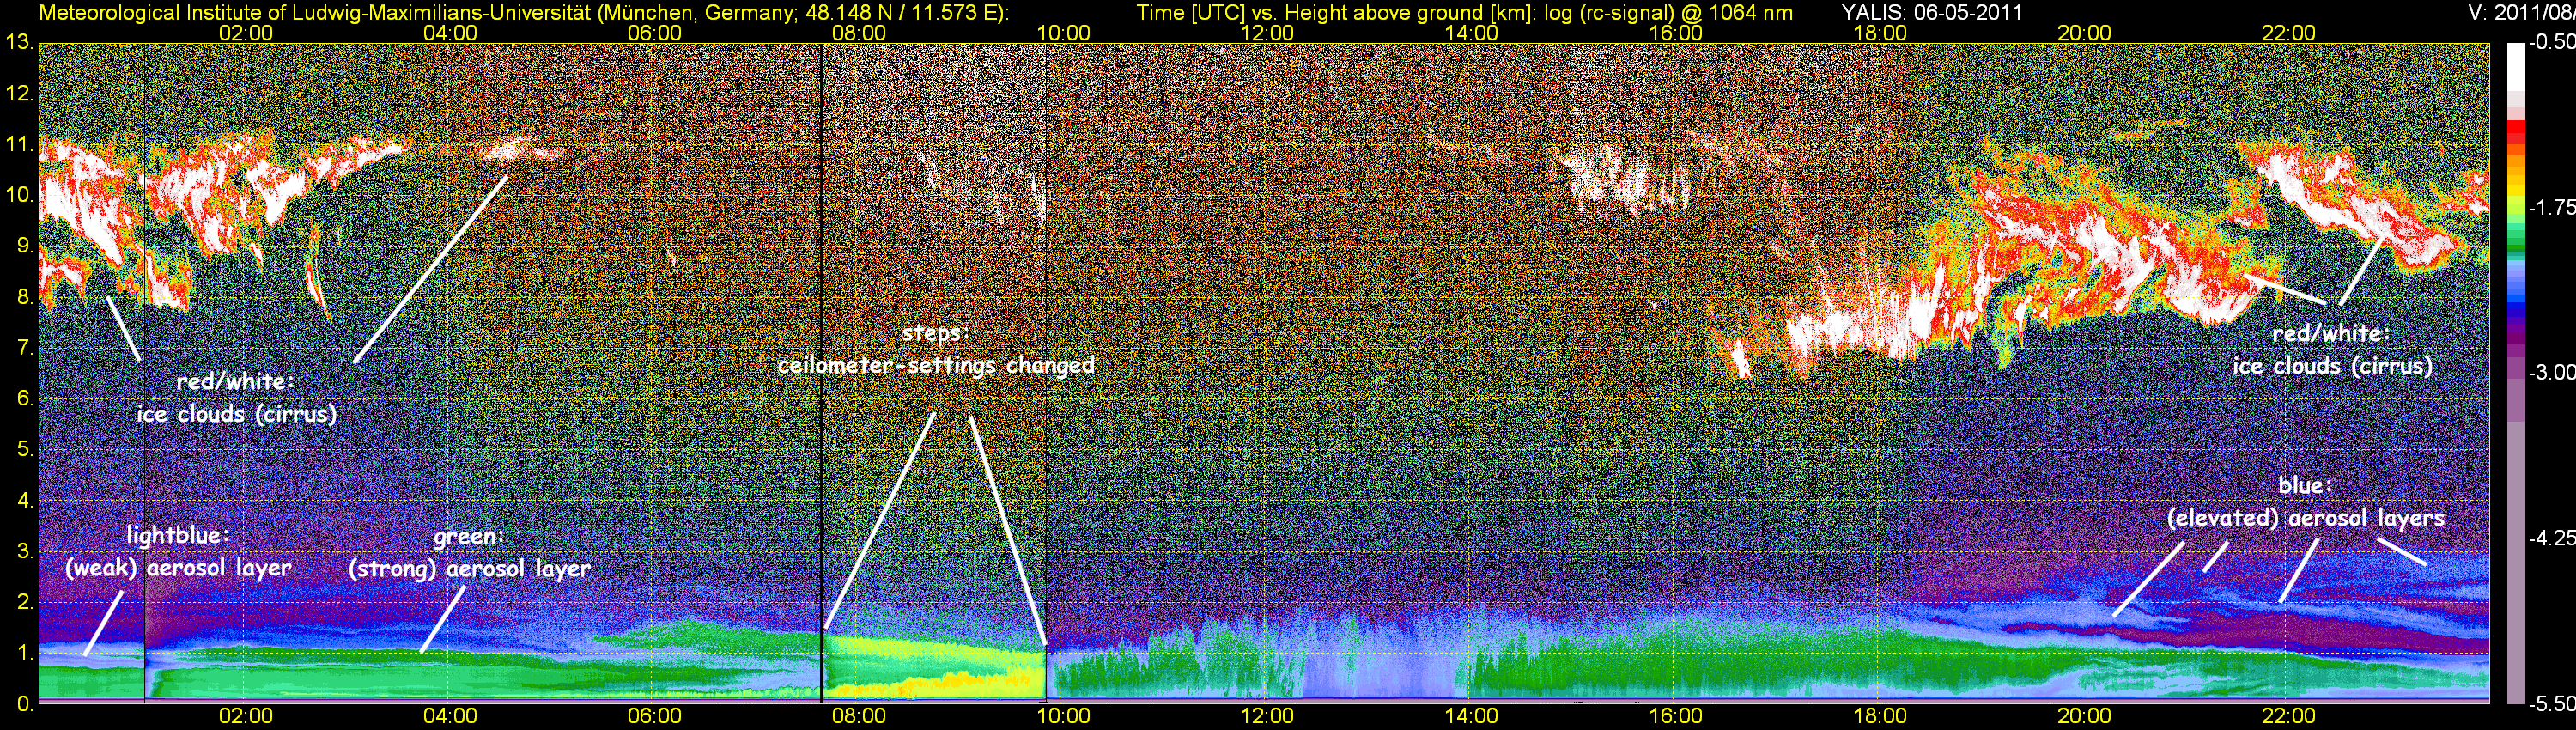
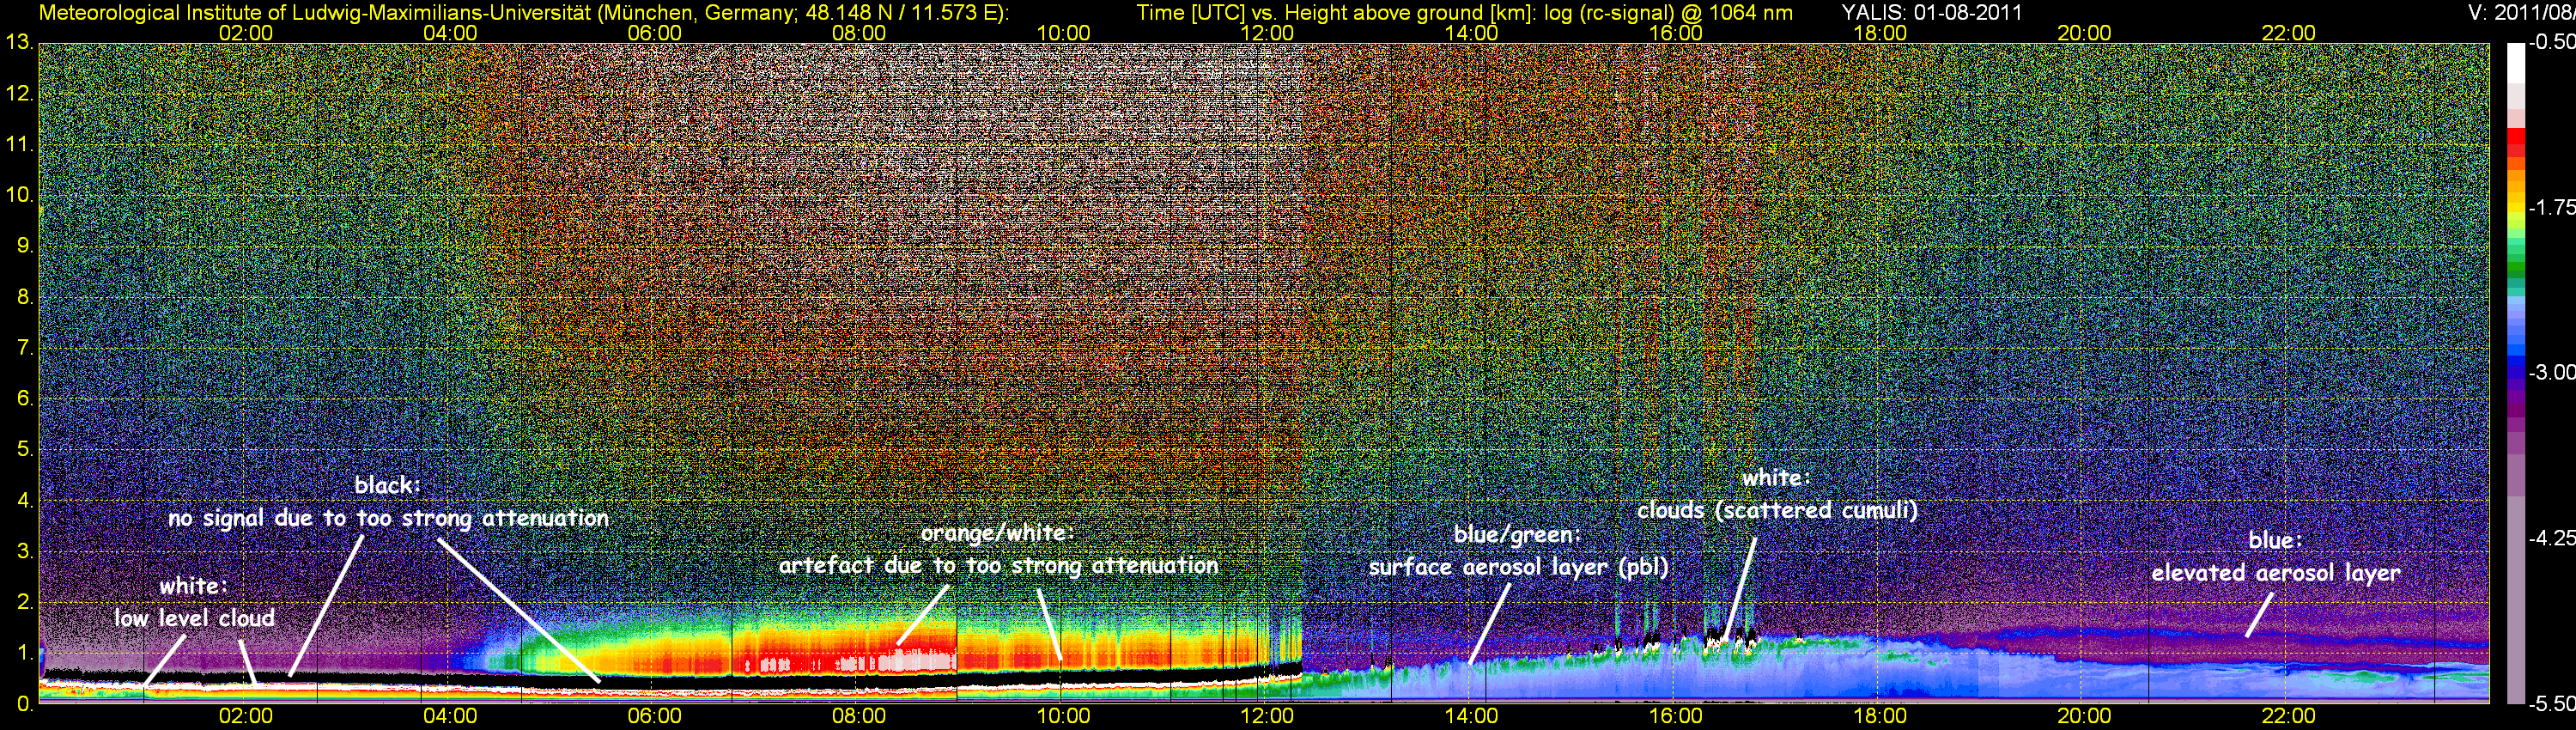
Quicklooks of the „range corrected signal“ at 1064 nm measured by blueYALIS (CHM15kx, Lufft) and at 903 nm from redYALIS (CHM8k, Lufft), both operated by the Meteorological Institute (MIM) of the Ludwig-Maximilians-Universität (48.148 N, 11.573 E, altitude 539 m). From 11 September 2019 redYALIS is located in Garching (48.2611 N, 11.6638 E, altitude 477 m), 12.3 km north of MIM. The signals are not overlap-corrected if not otherwise stated. We are grateful that we are allowed to process the corresponding data (since 1. June 2010) of the CHM15k ceilometer located at the UFS (altitute 2712 m, 93 km south of Munich), owned by the UFS and operated by the German Weather Service for comparison. The temporal resolution is 15 s, the vertical resolution is 15 m (raw data). The quicklooks are smoothed over 5 range bins for blueYALIS and the UFS ceilometer until 12.11.2018. All other signals are not smoothed.
The range corrected signal is proportional to the attenuated backscatter, and in first approximation proportional to the backscatter coefficient of particles. The backscatter coefficient is an indication for the „amount of aerosols“. The signals at 903 nm (redYALIS) are also influenced by water vapor absorption. The images show clouds in white (very strong backscatter signal) and aerosols in green and yellow (medium strong signal). Extended white and red areas down to the ground indicate rain. Note, that „steps“ in the colored areas (visible until 27. October 2014 for the blueYALIS measurements) are due to automatically changed settings of the ceilometer's detection unit.
Examples with explanations are shown here
If yes, please contact Matthias Wiegner