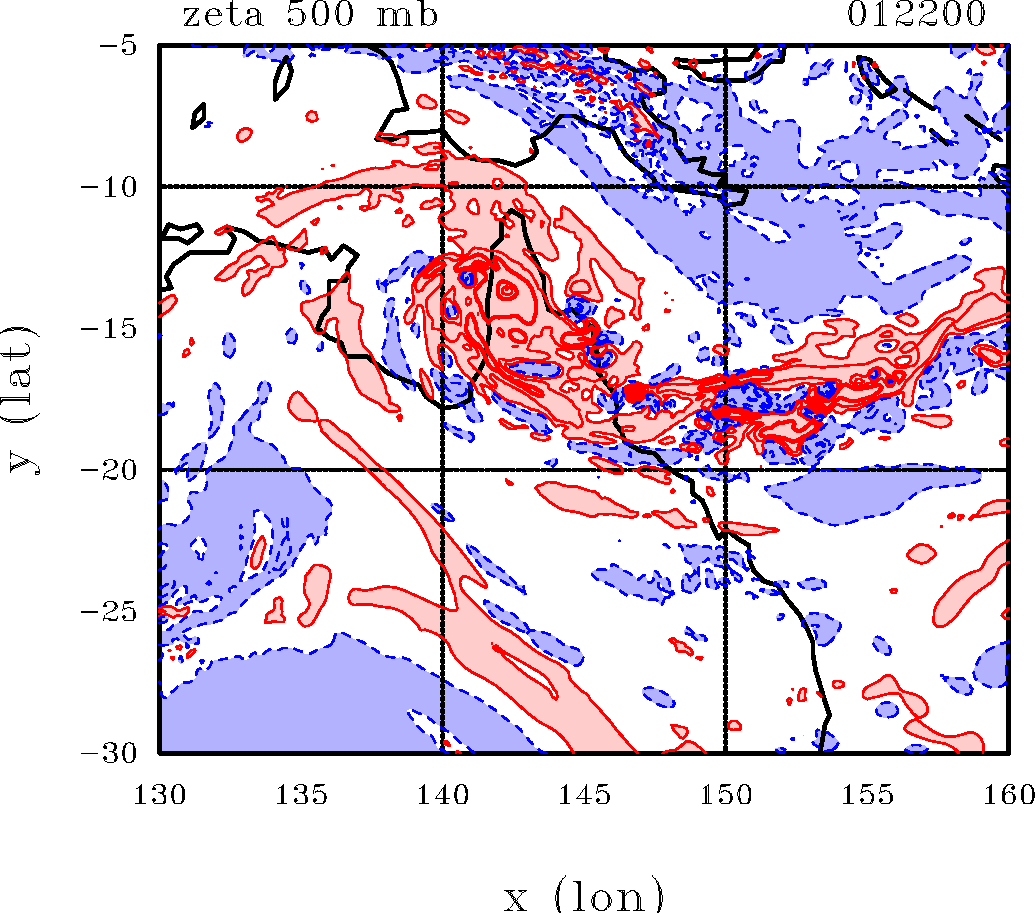
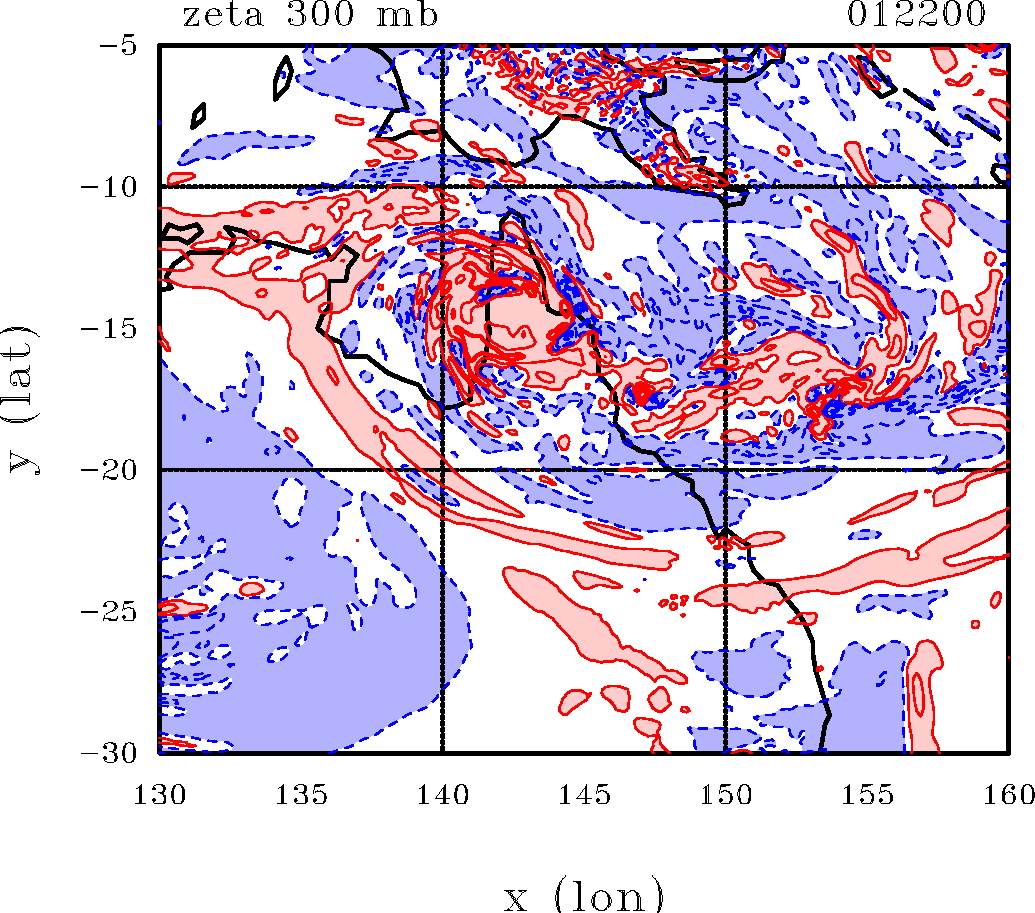
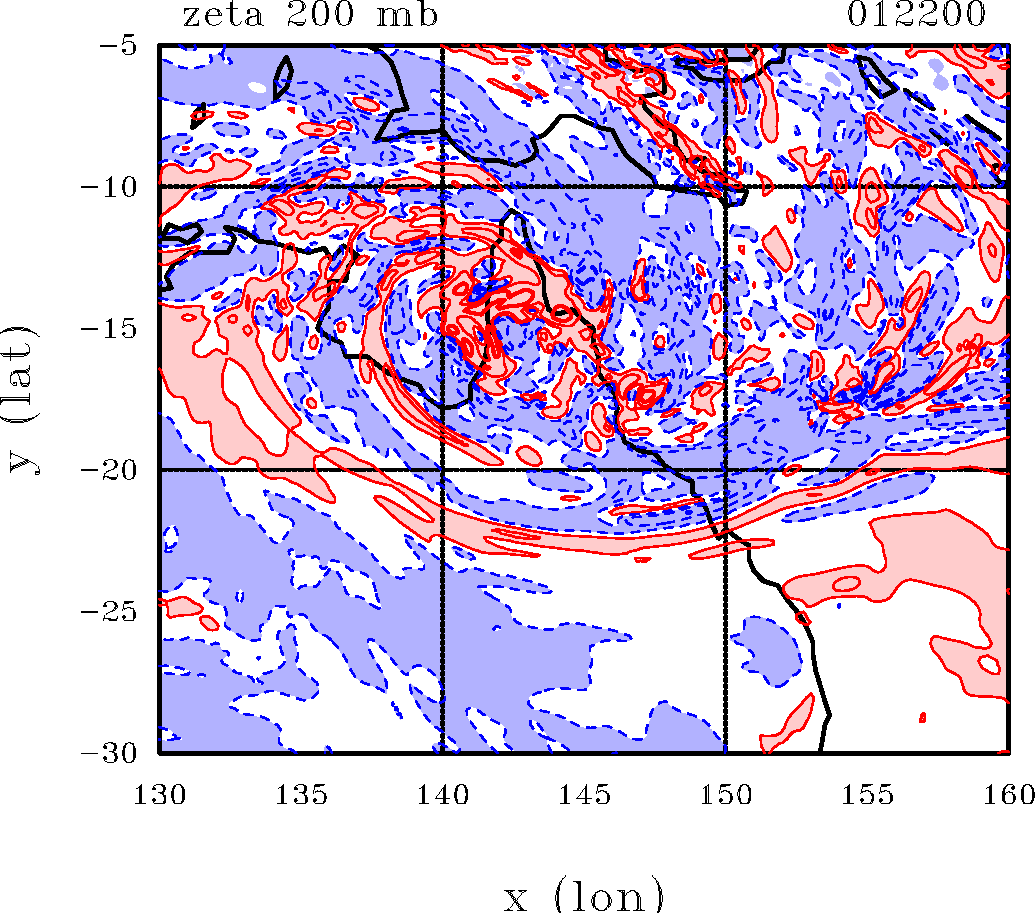
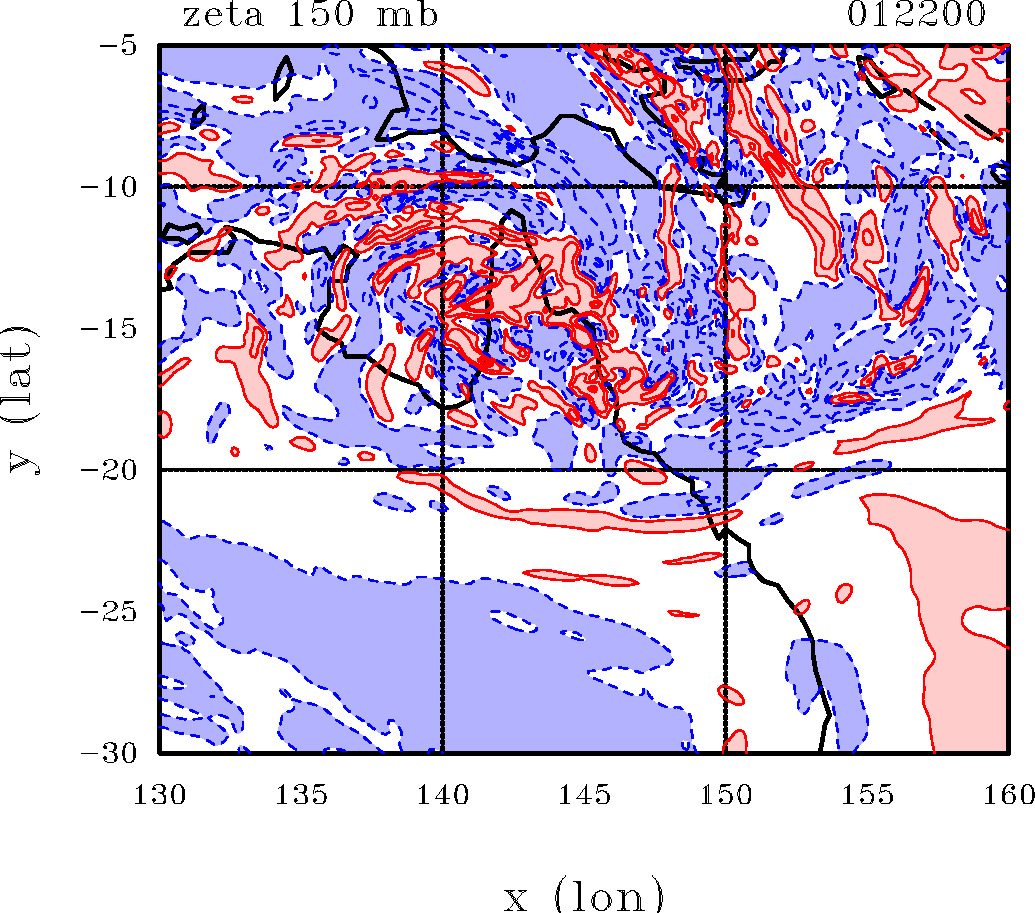
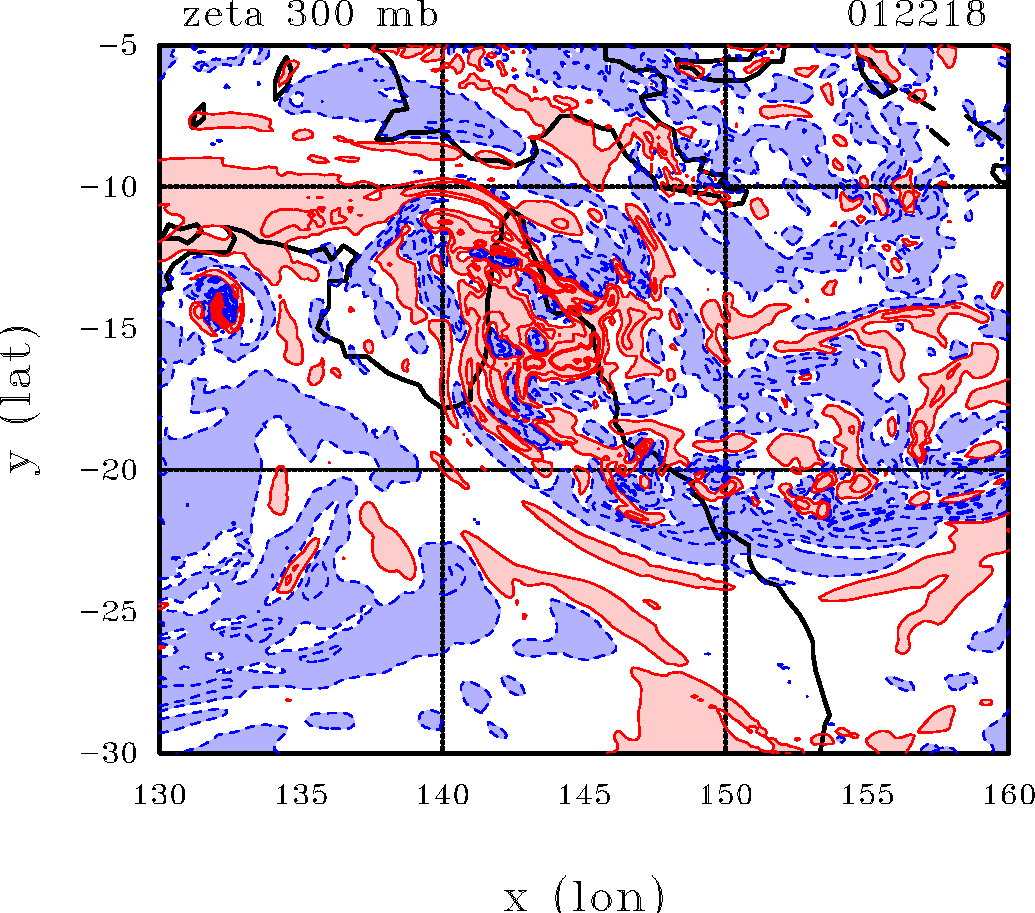
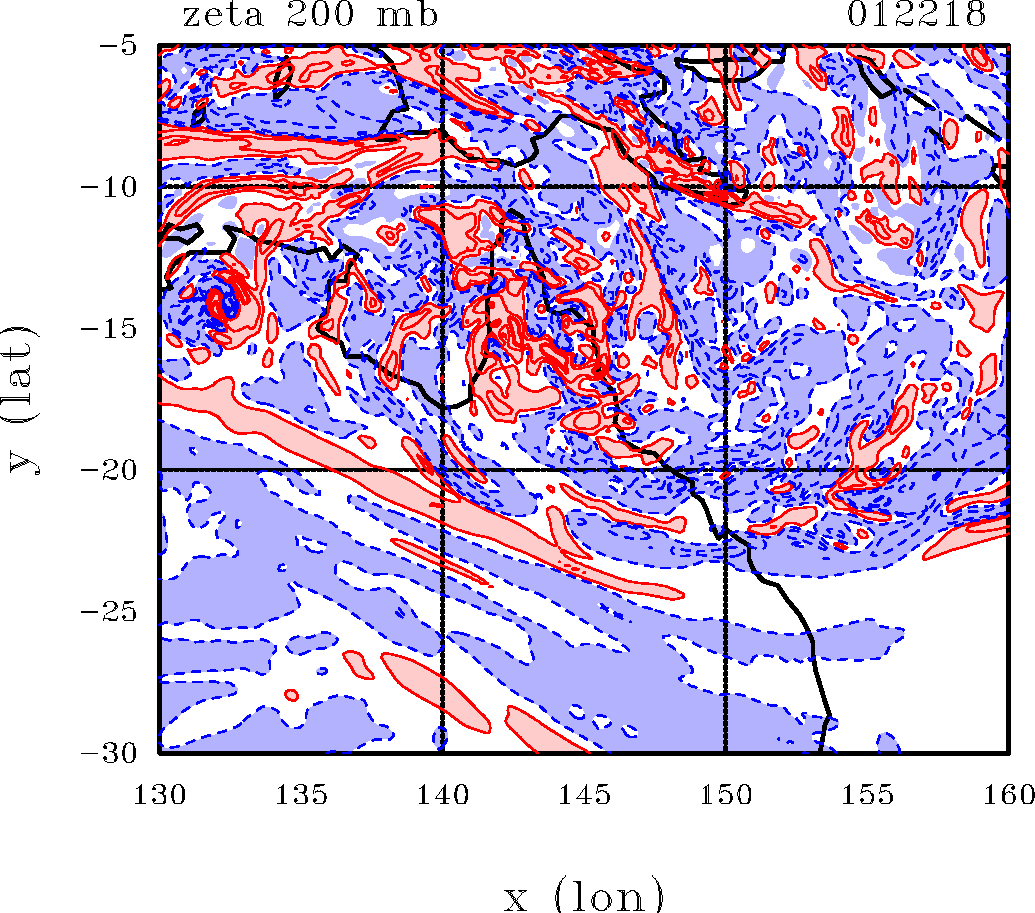
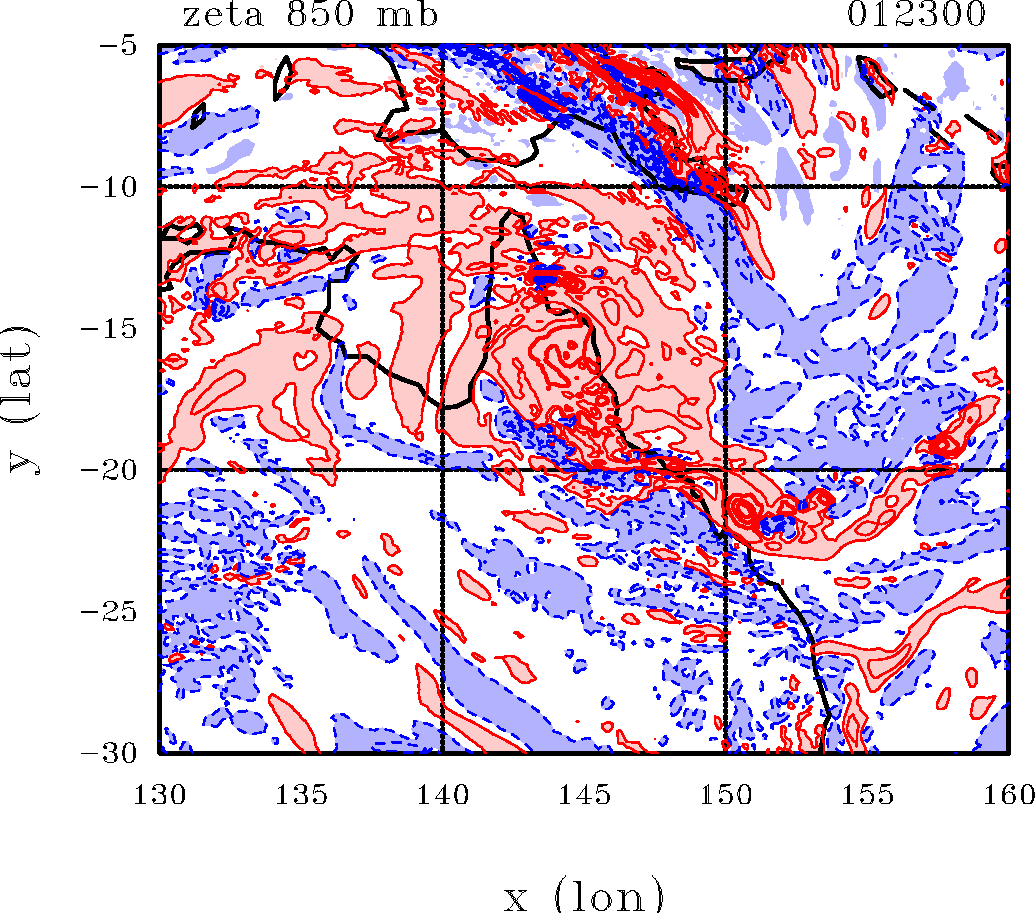
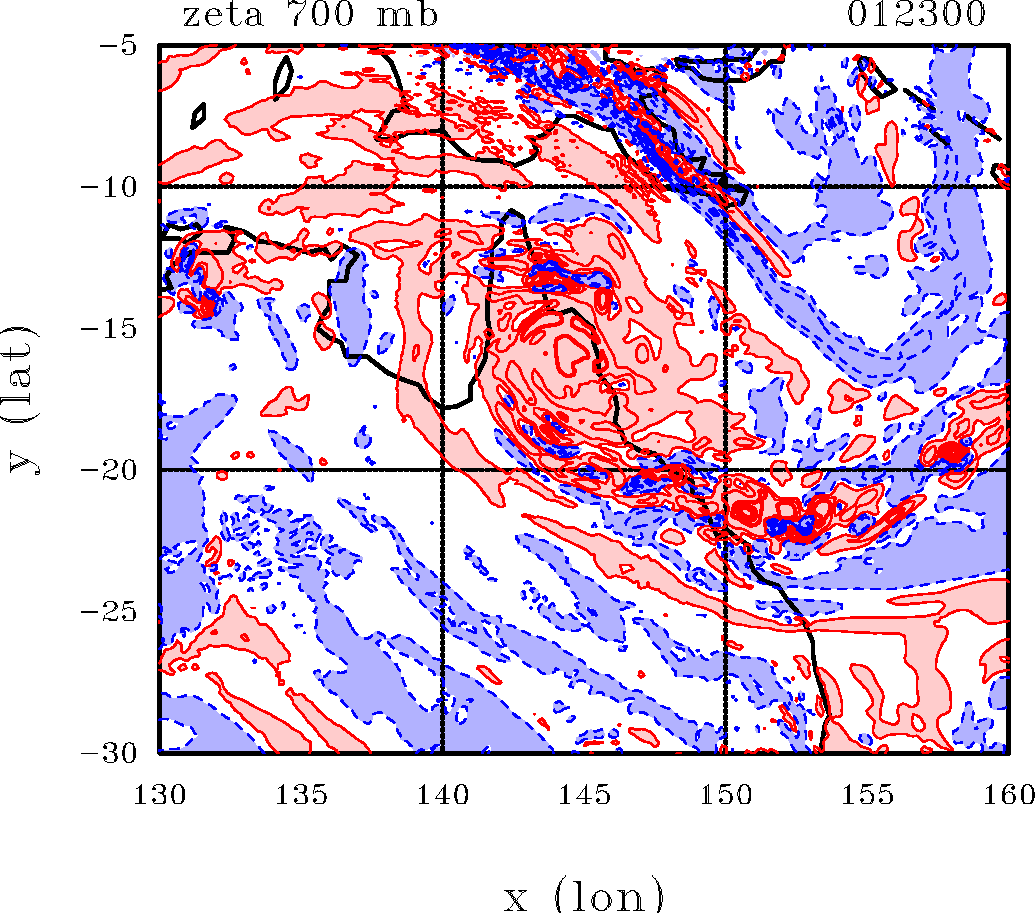
Tropical Cyclone Oswald Jan 2013
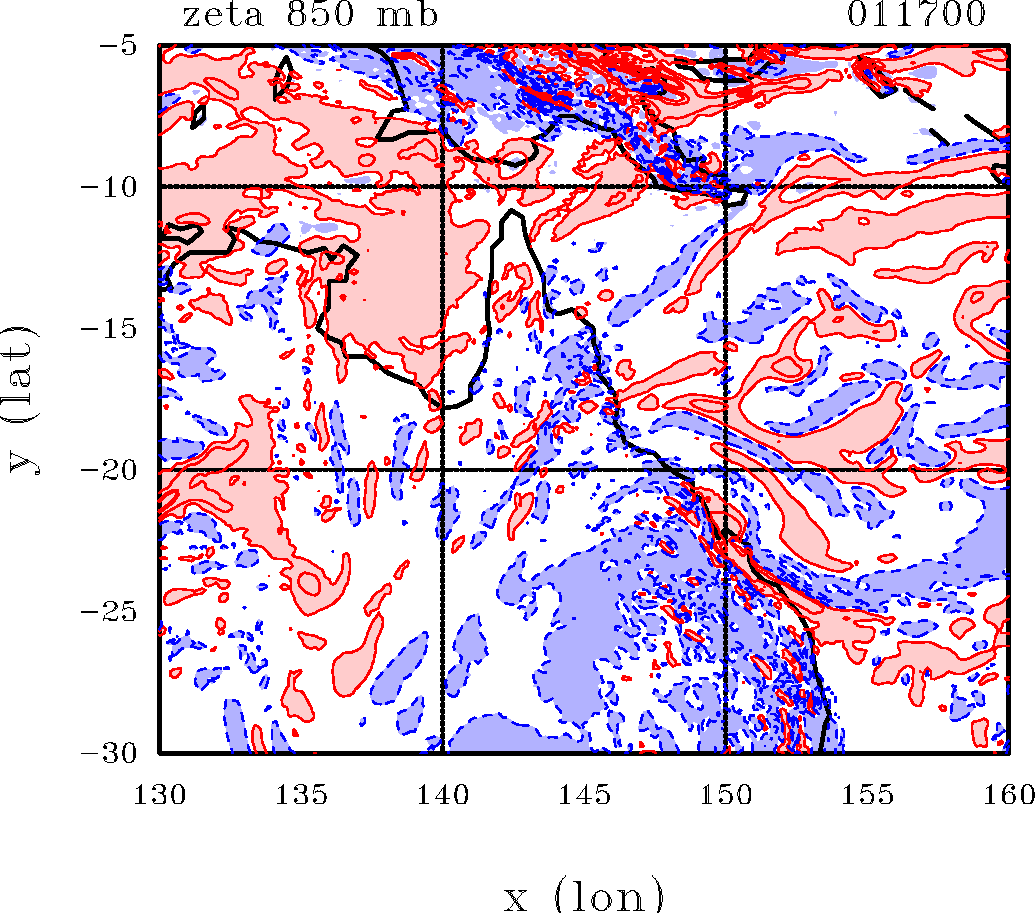
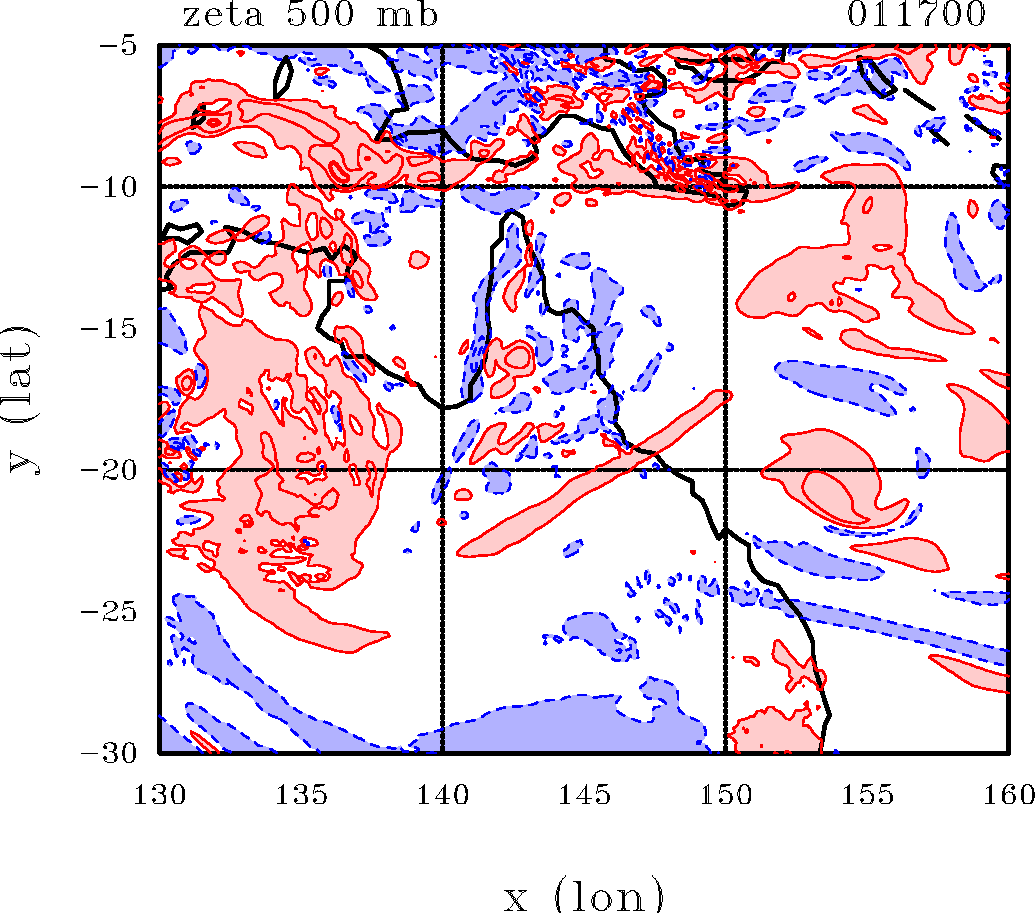
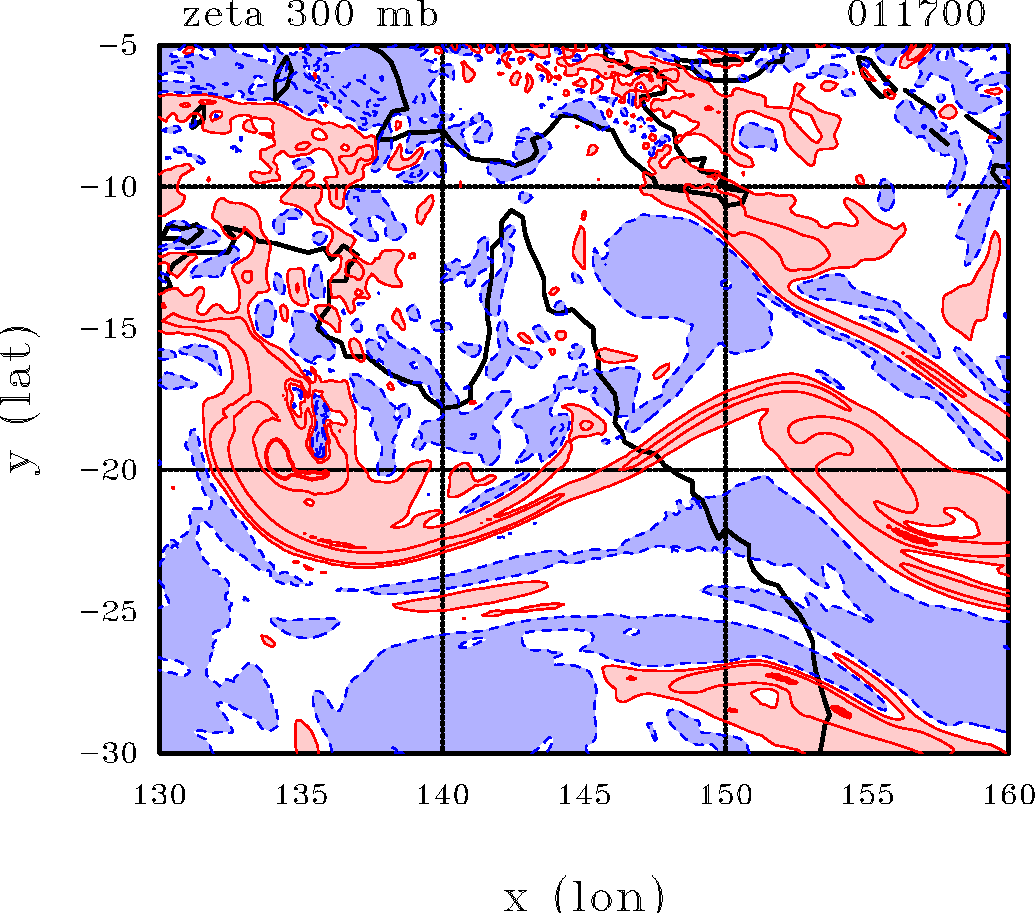
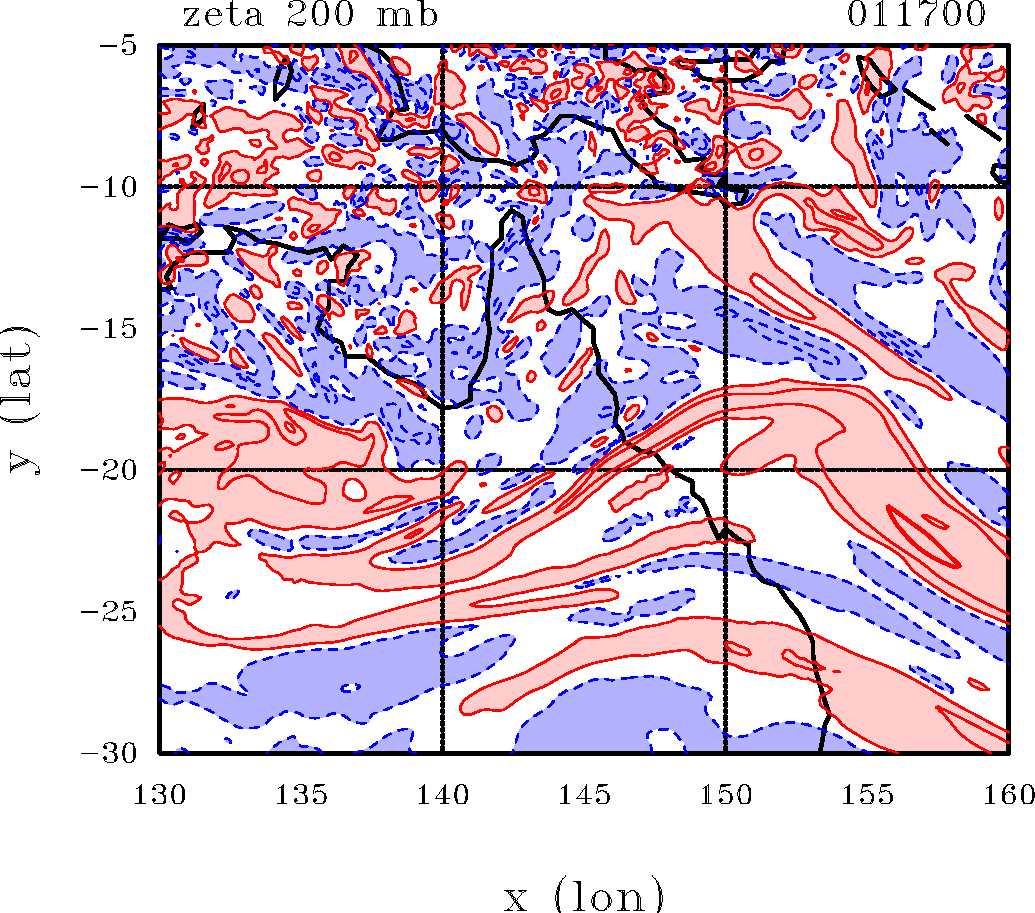
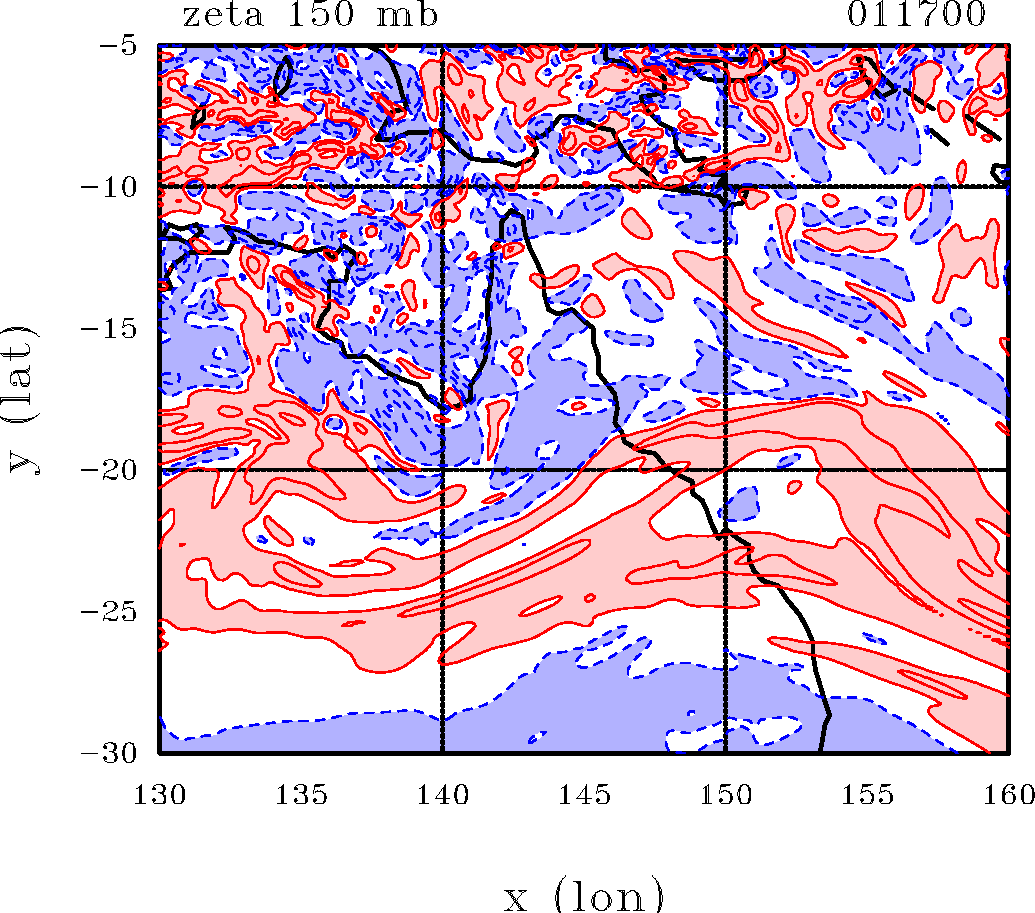
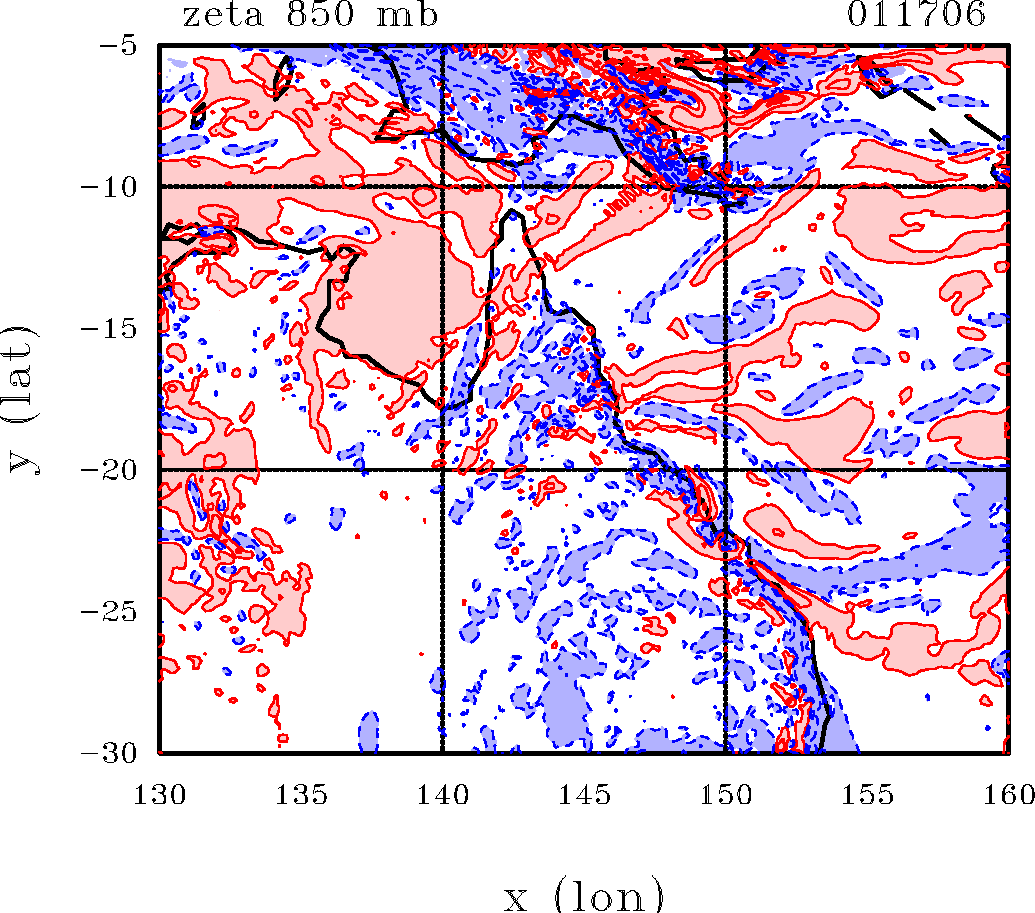
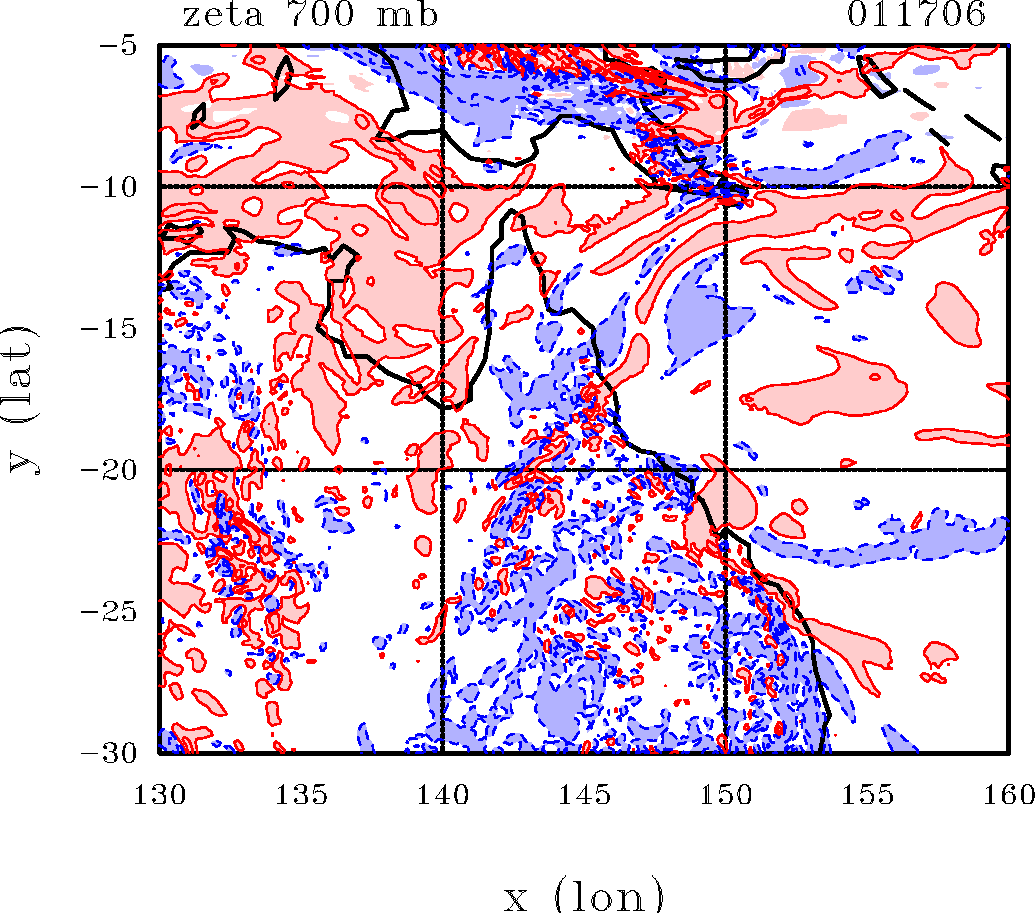
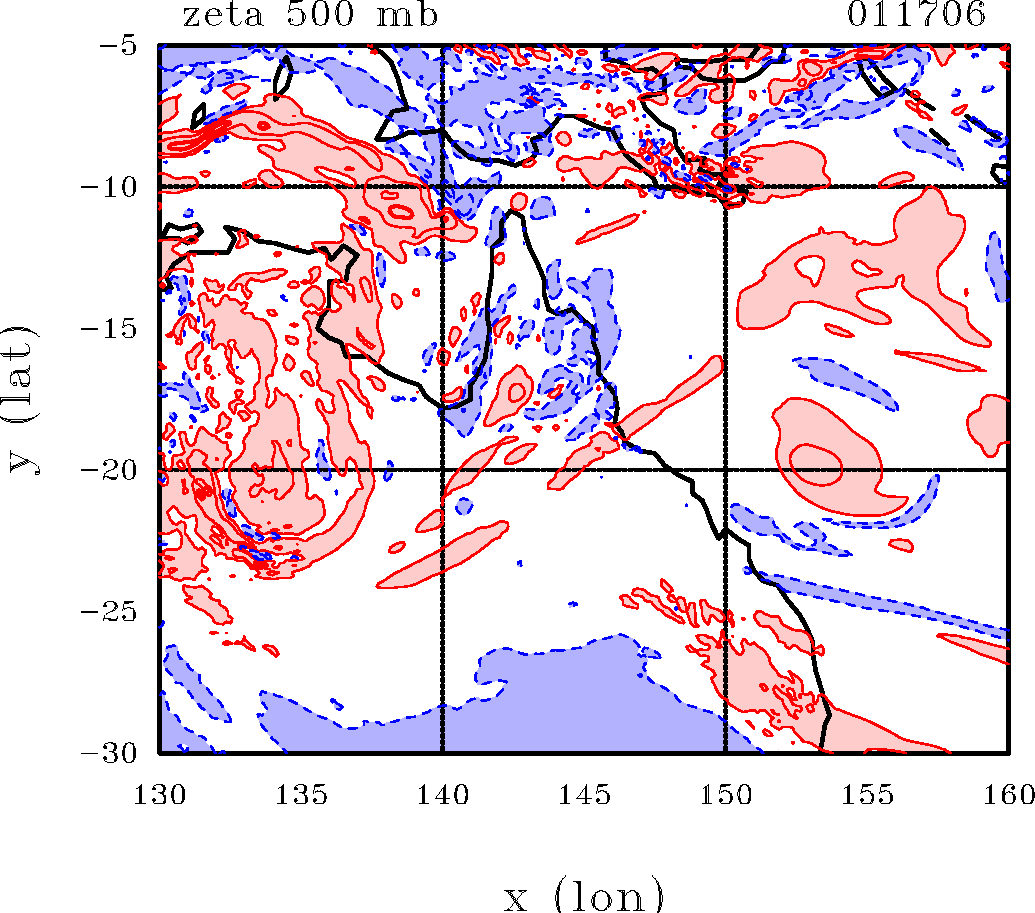
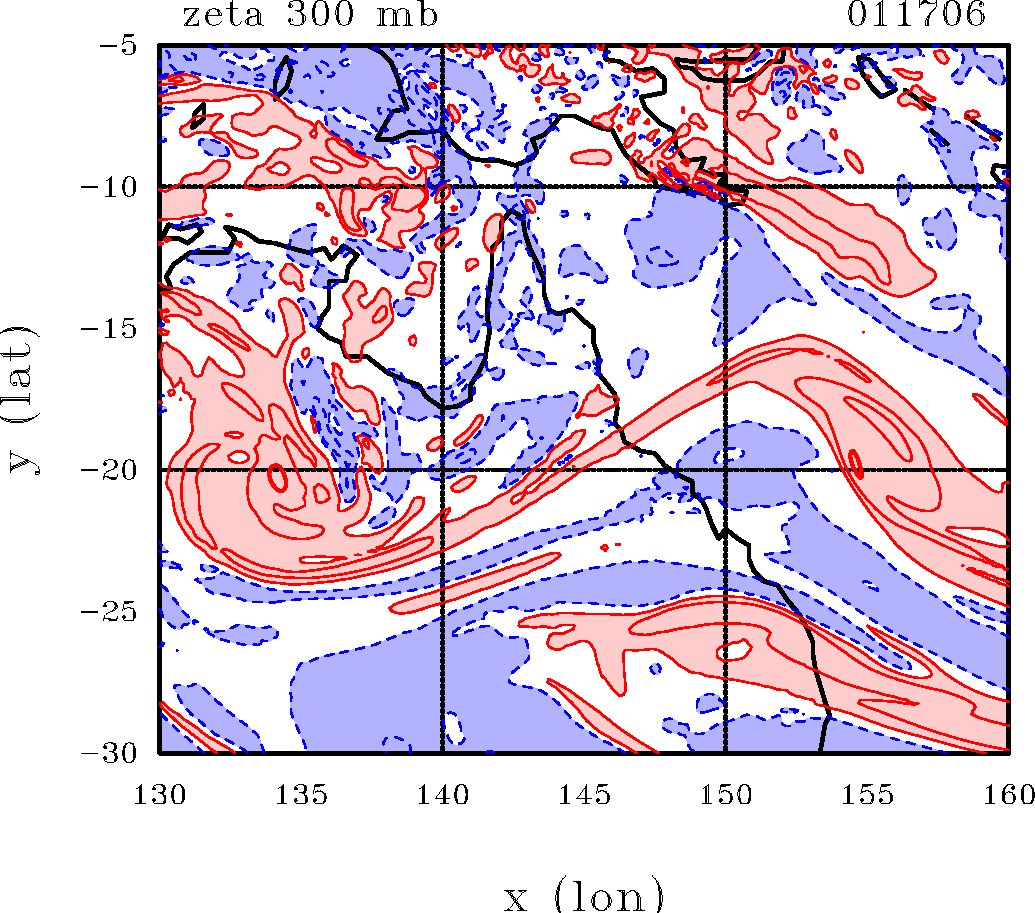
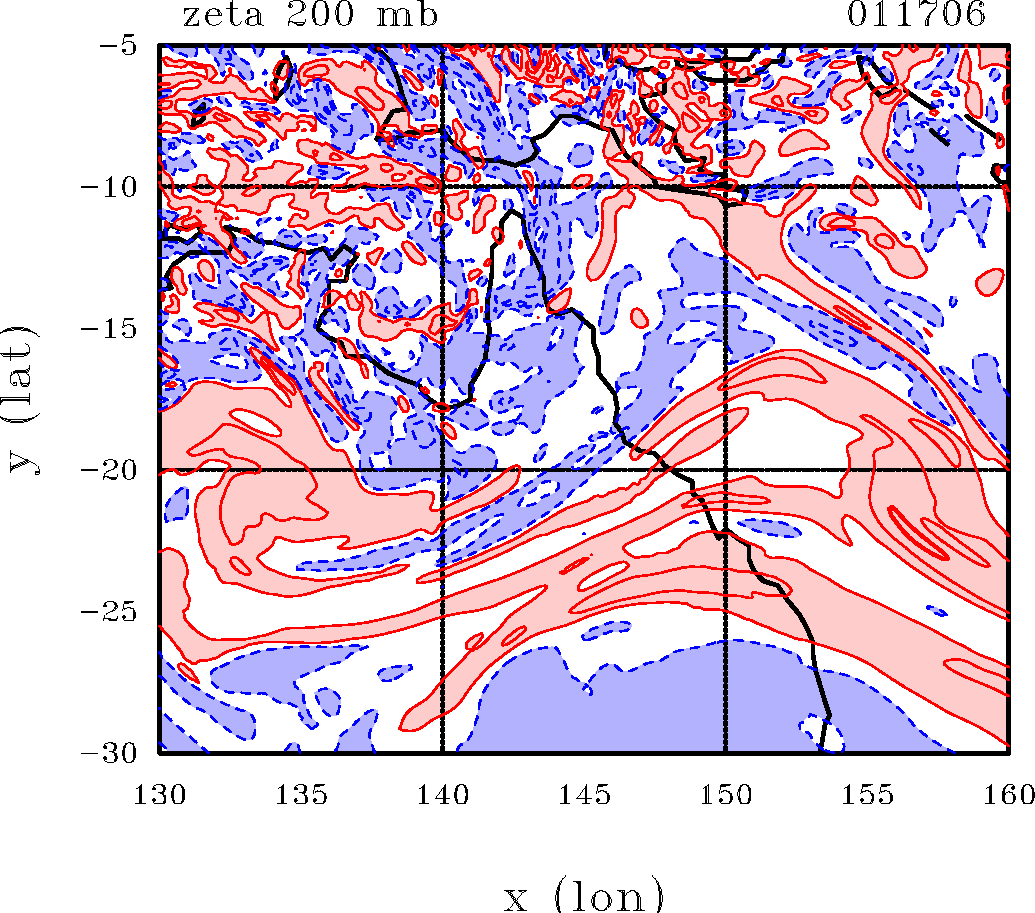
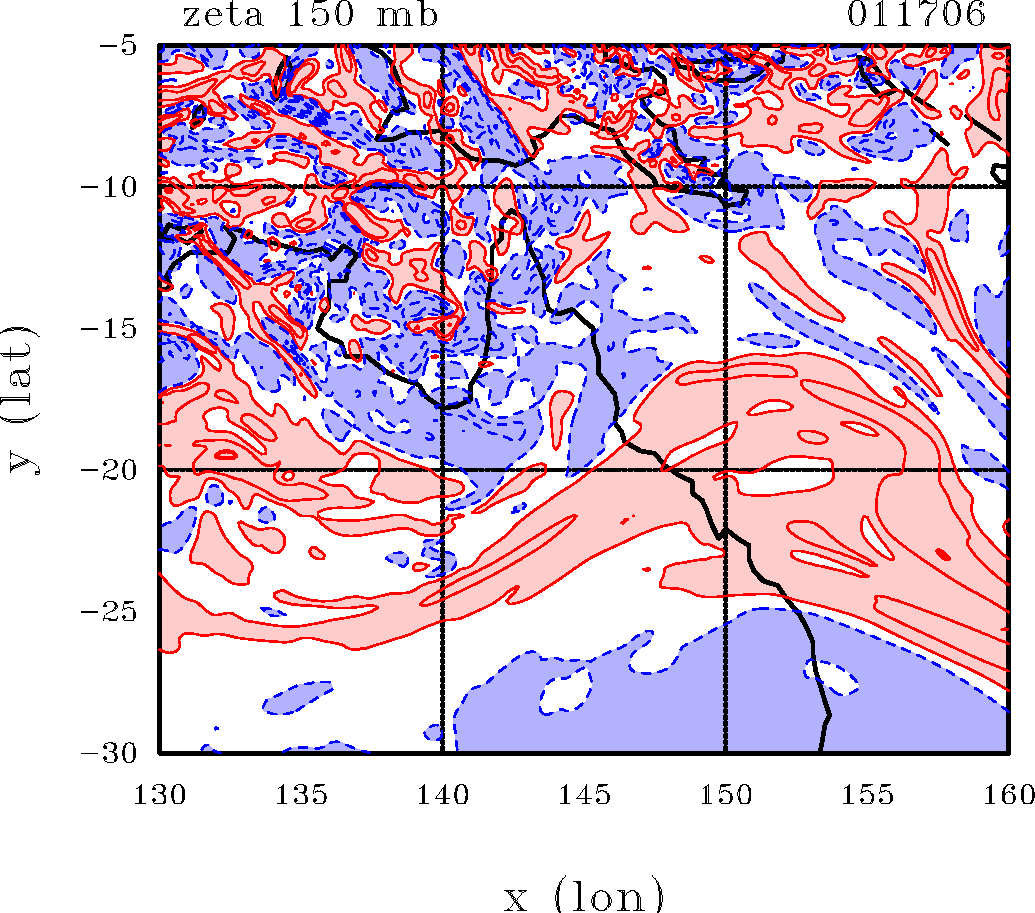
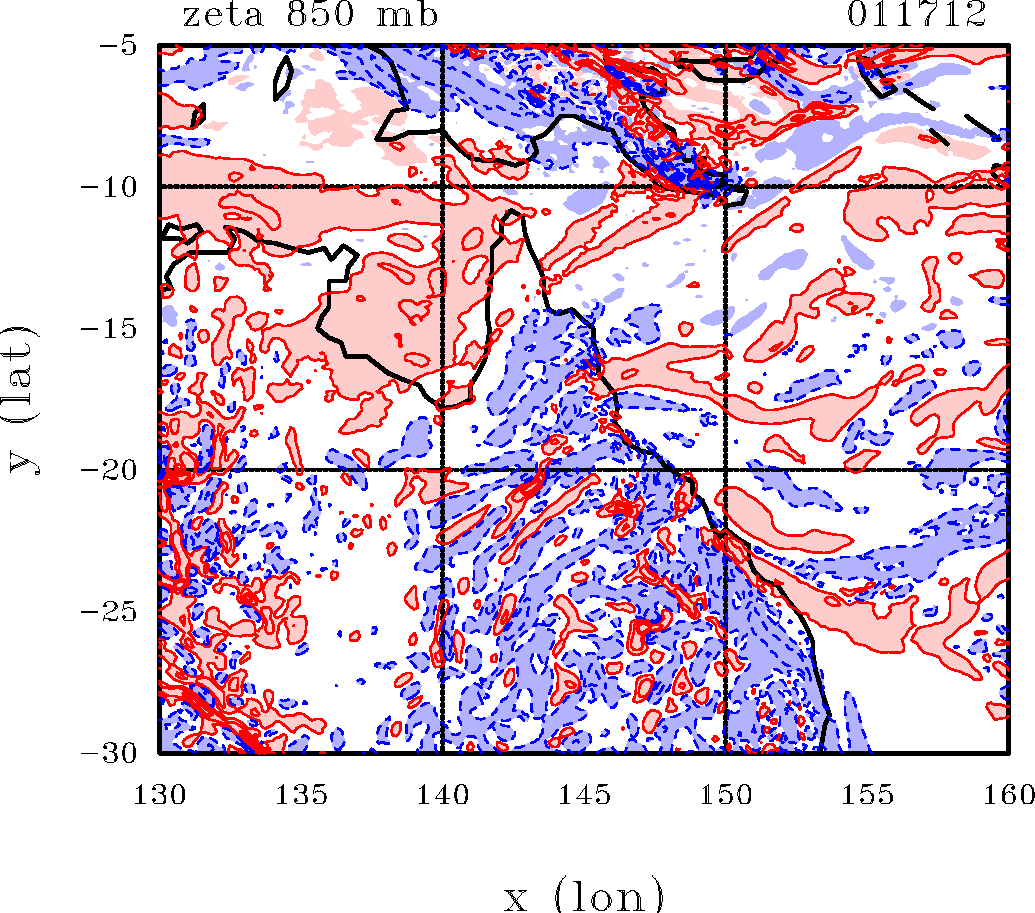
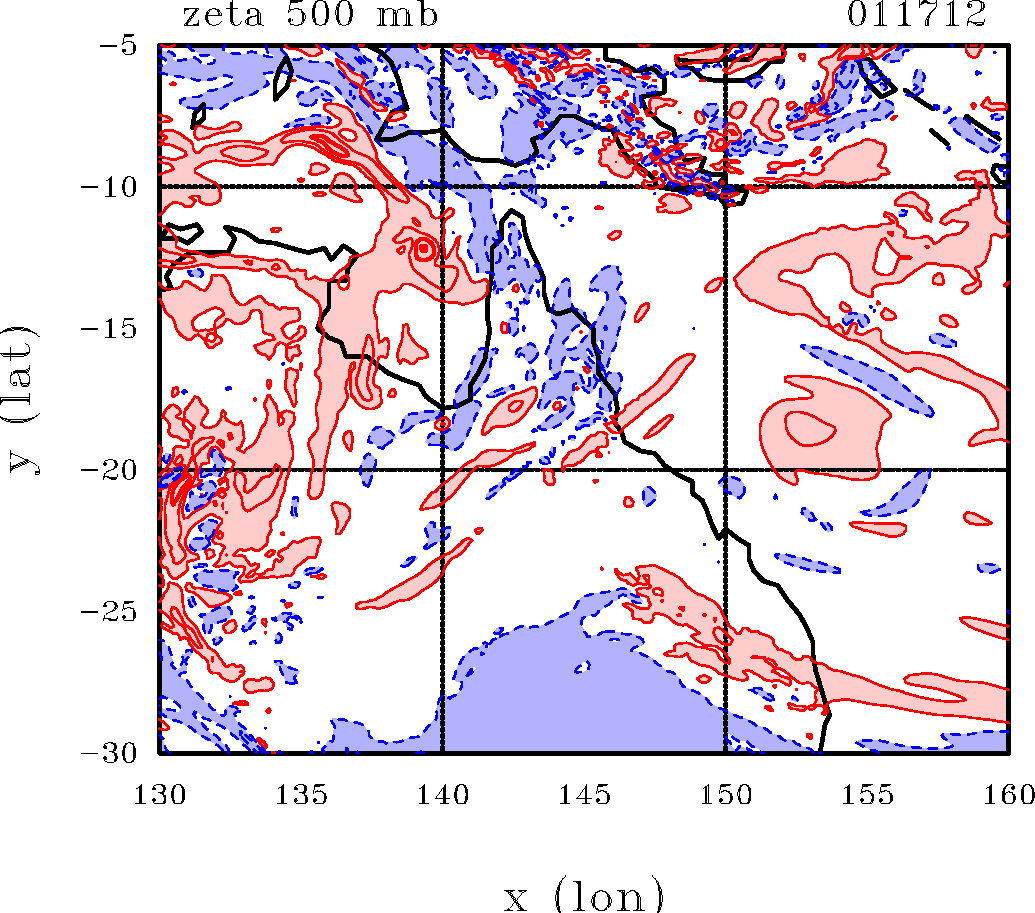
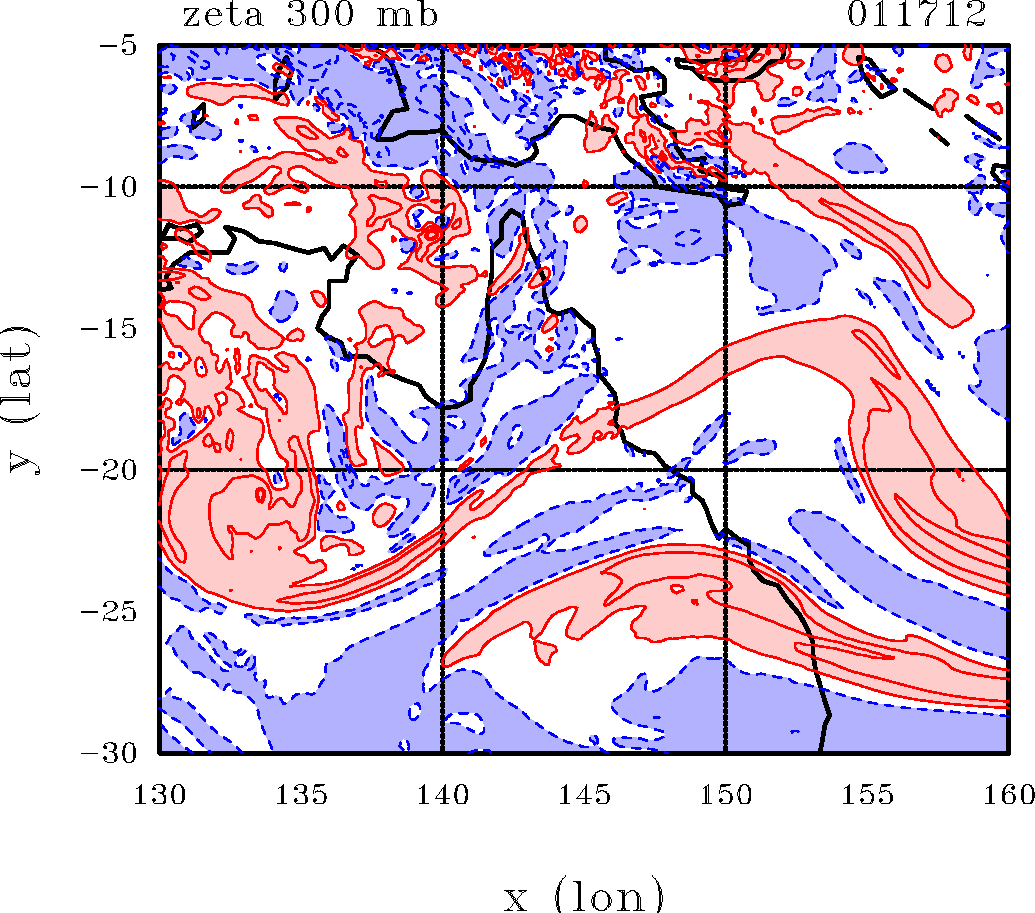
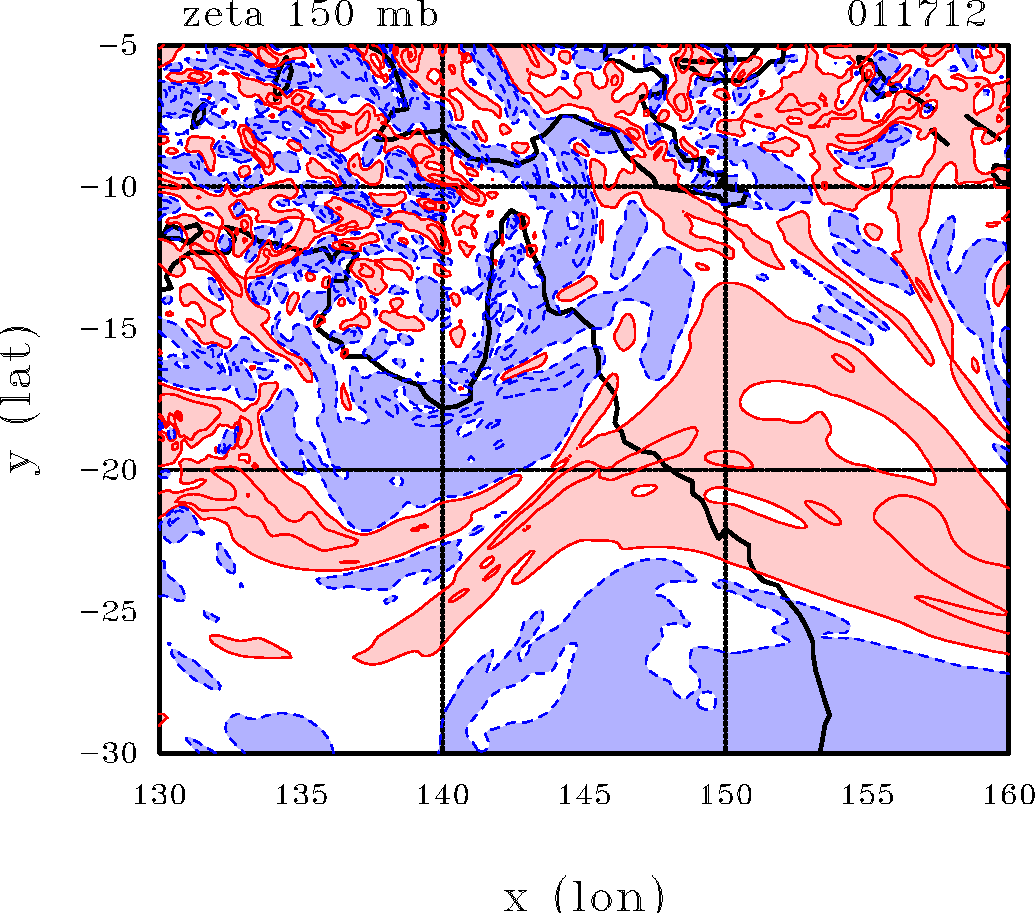
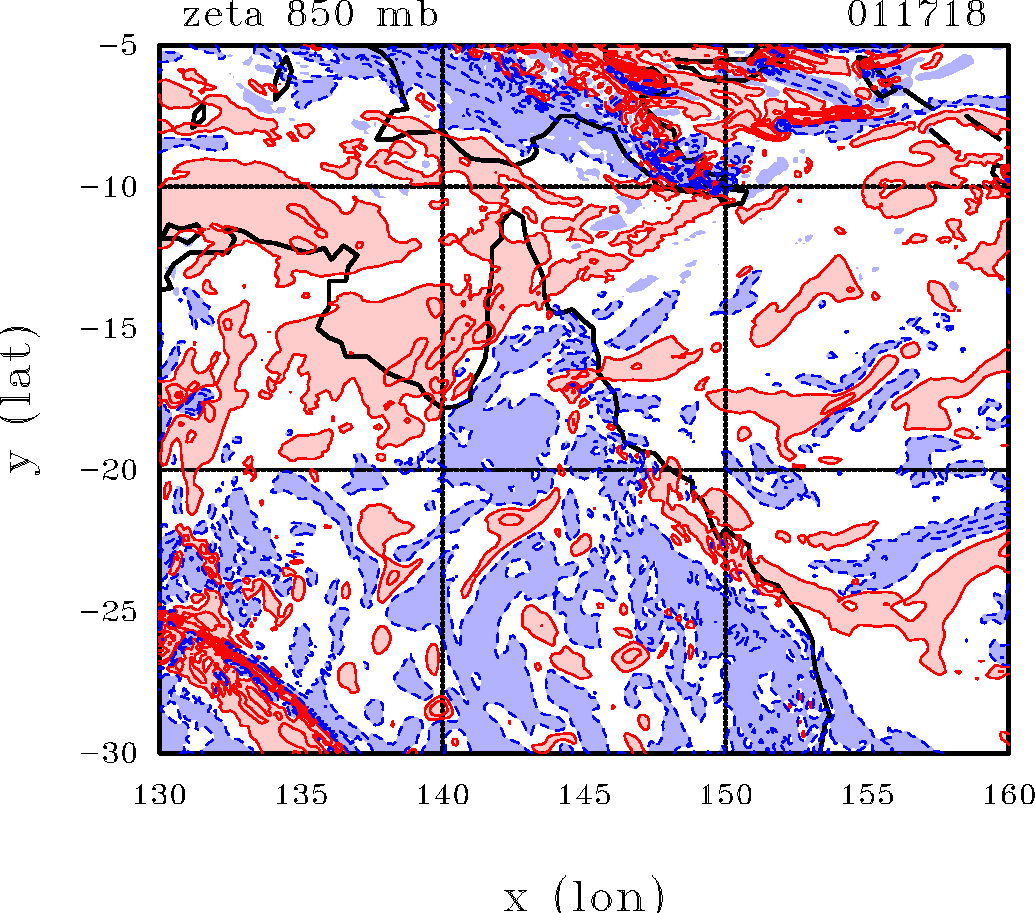
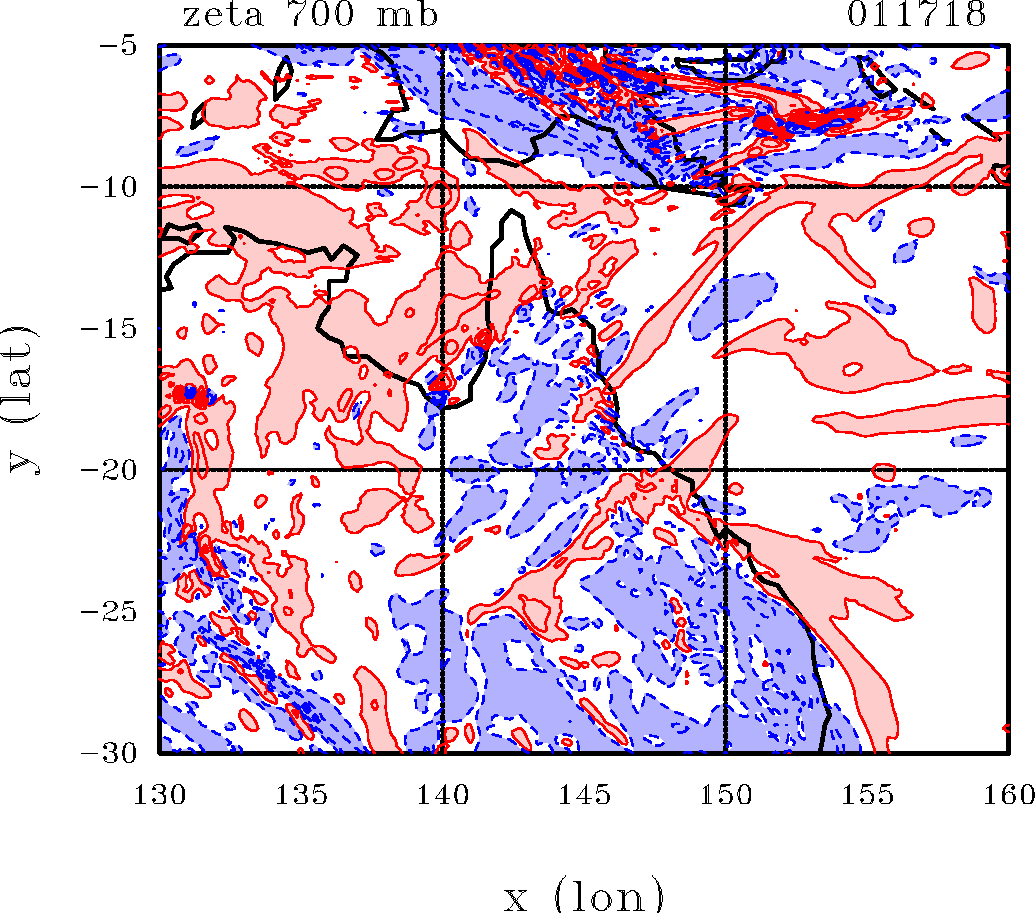
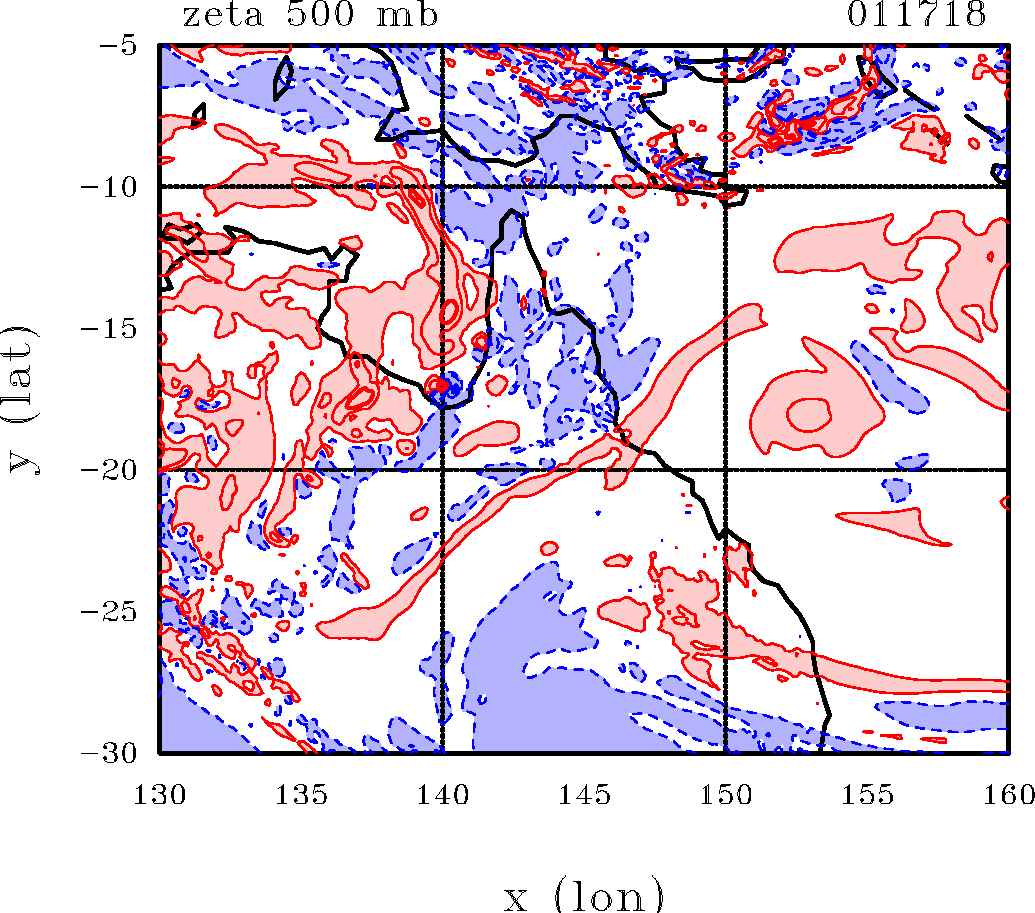
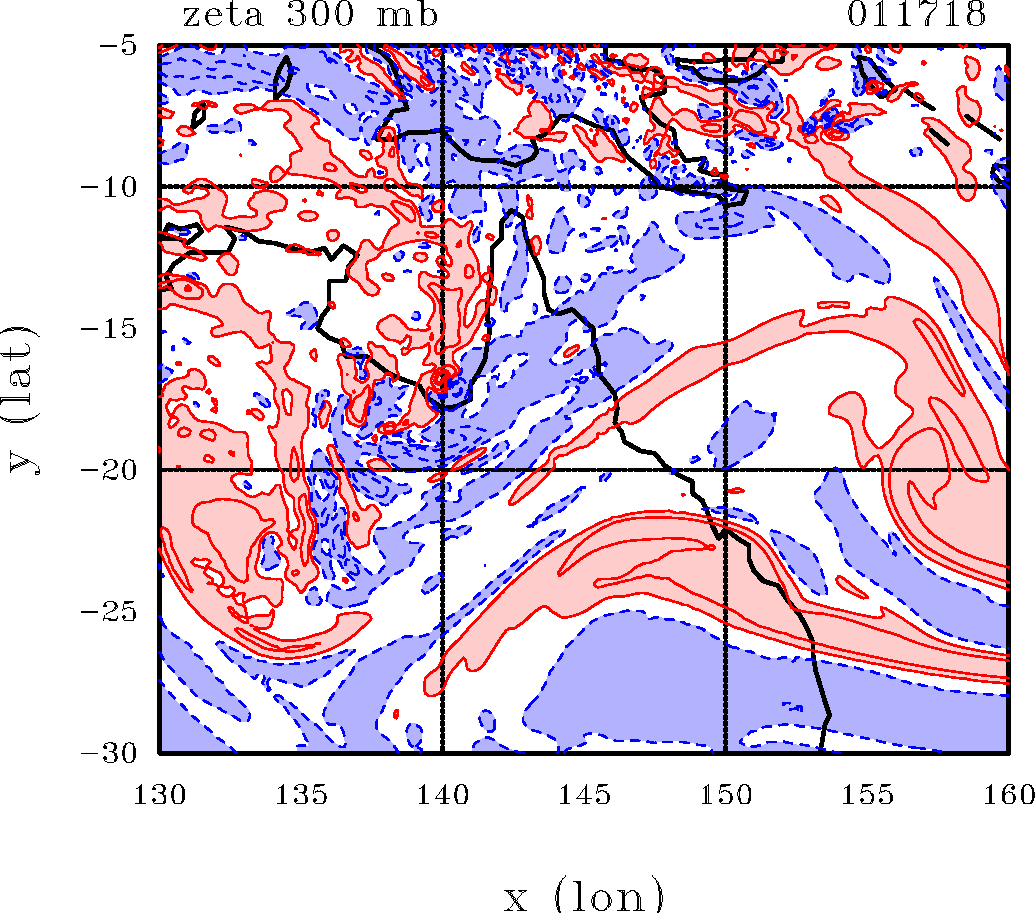
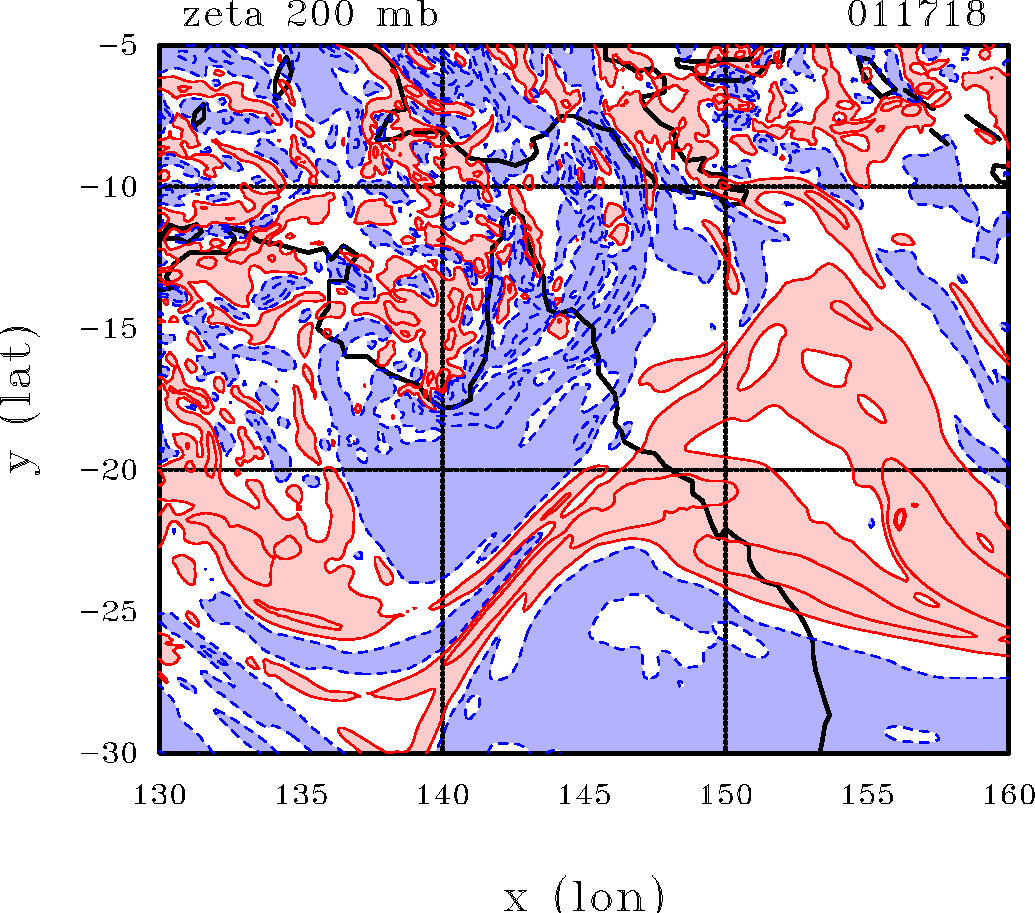
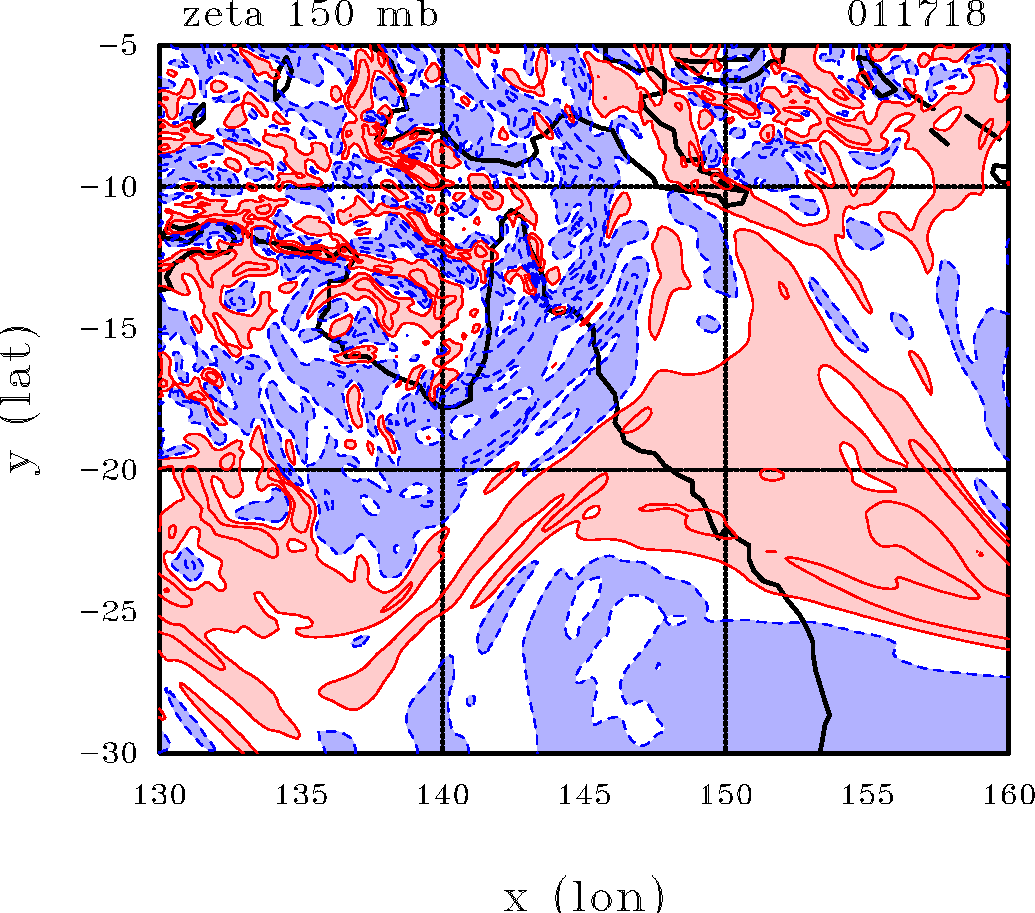
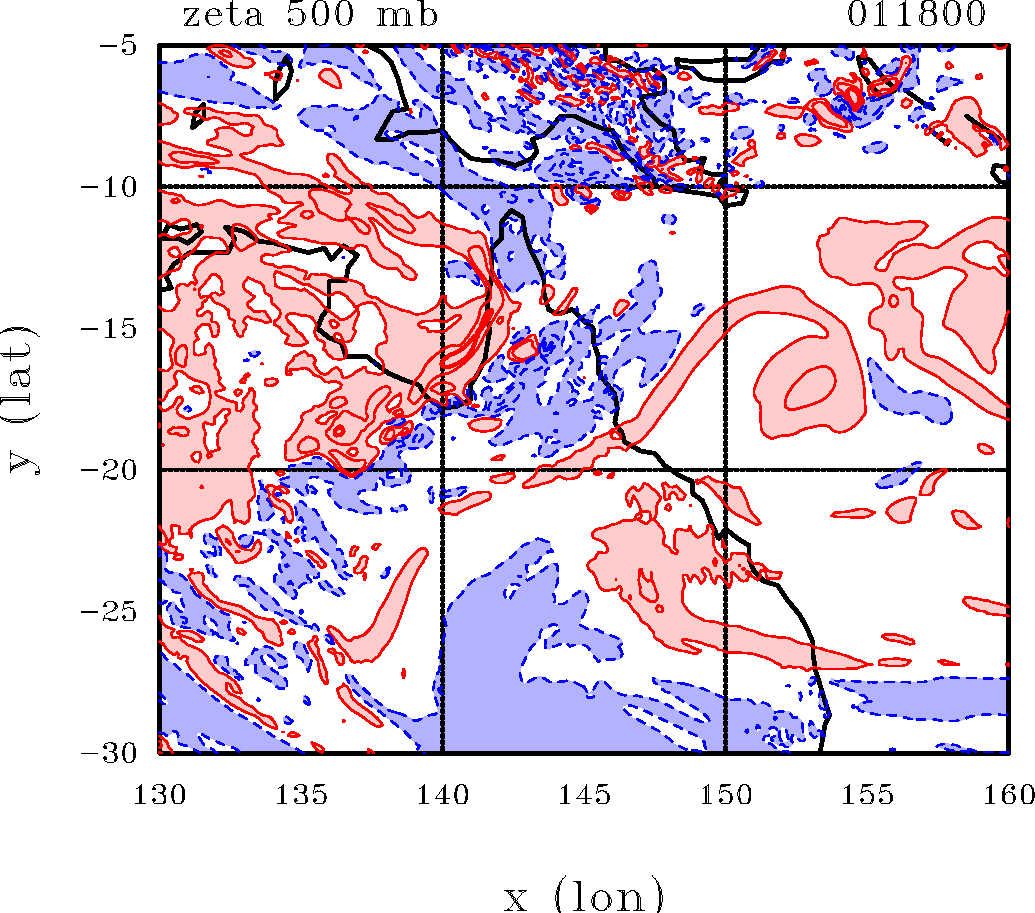
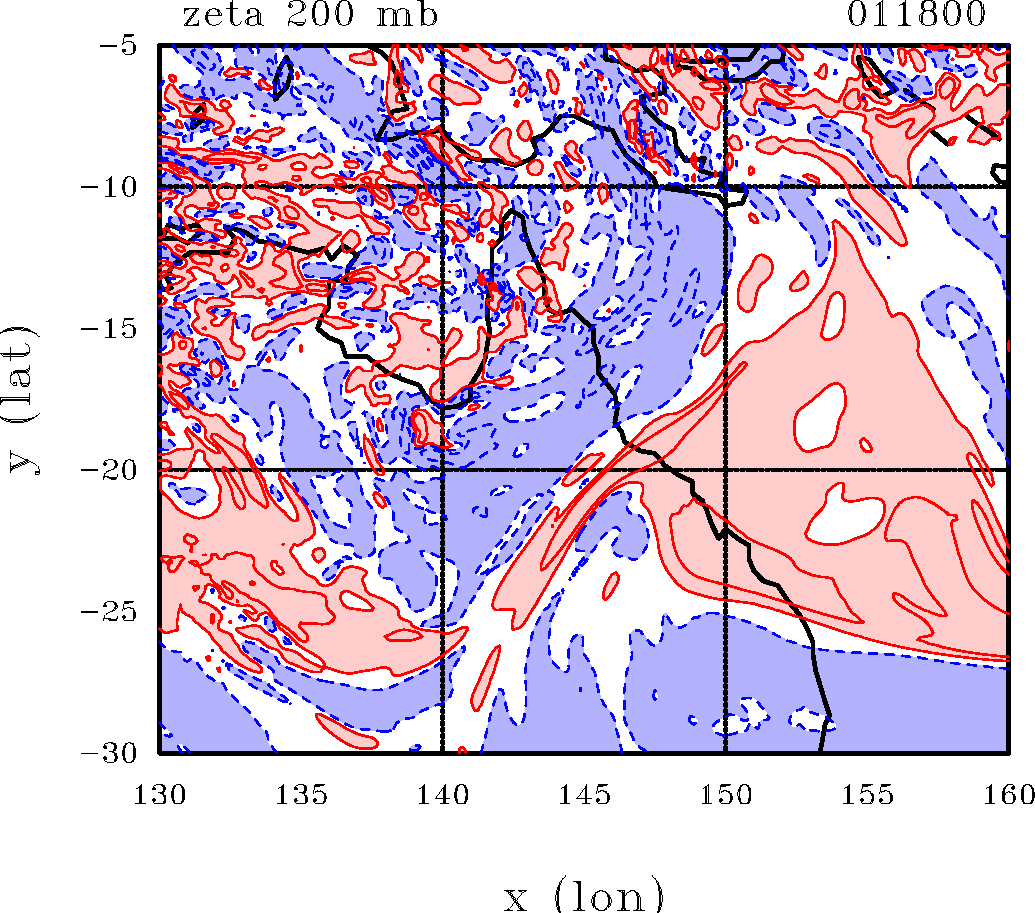
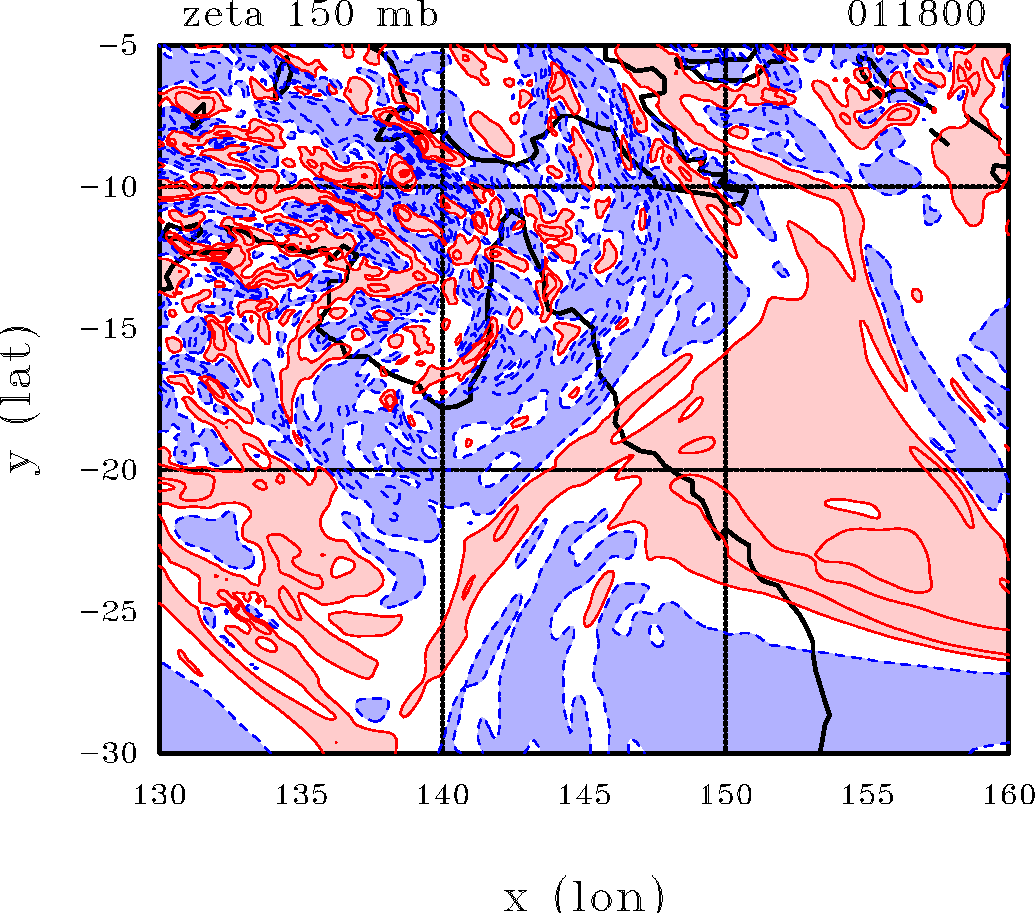
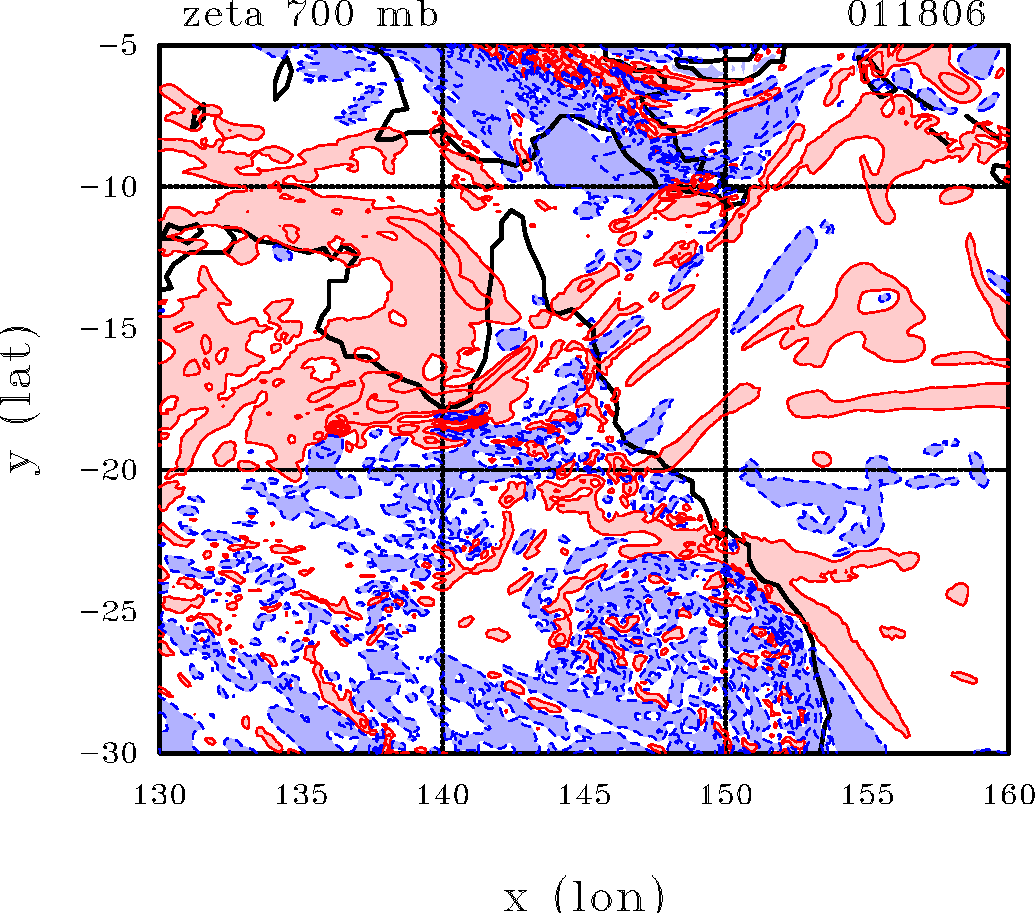
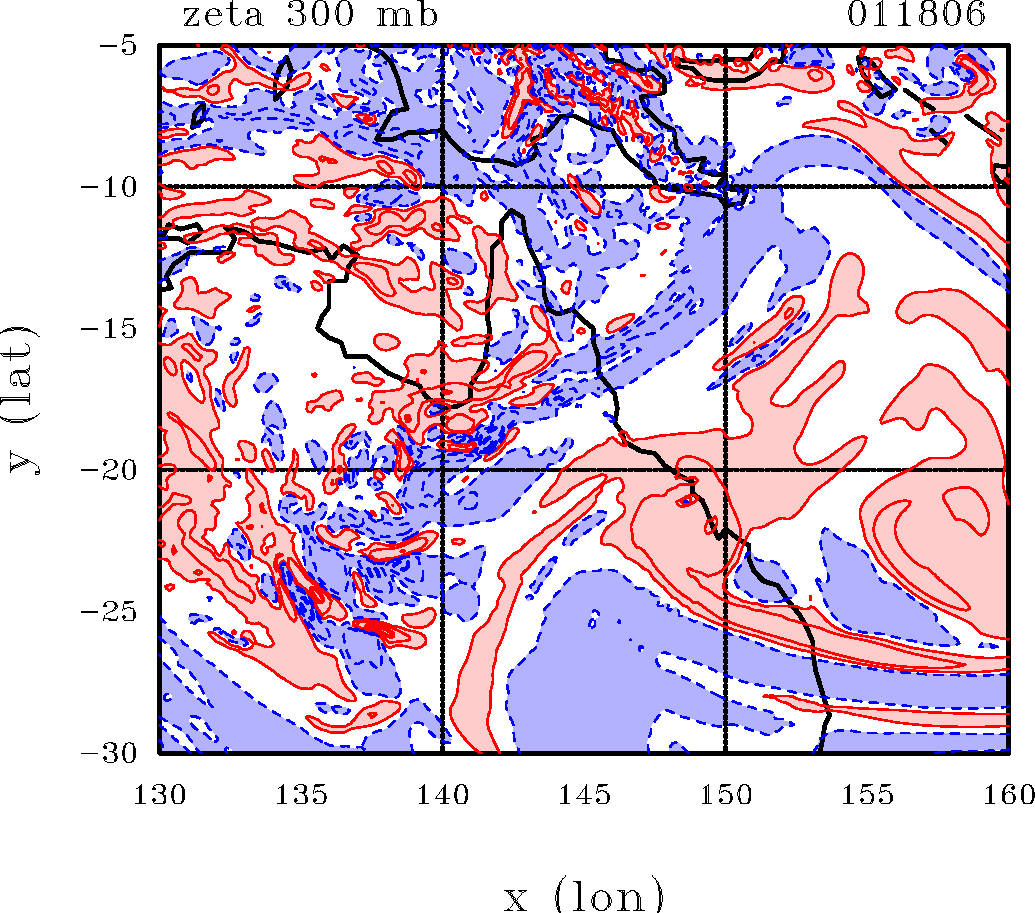
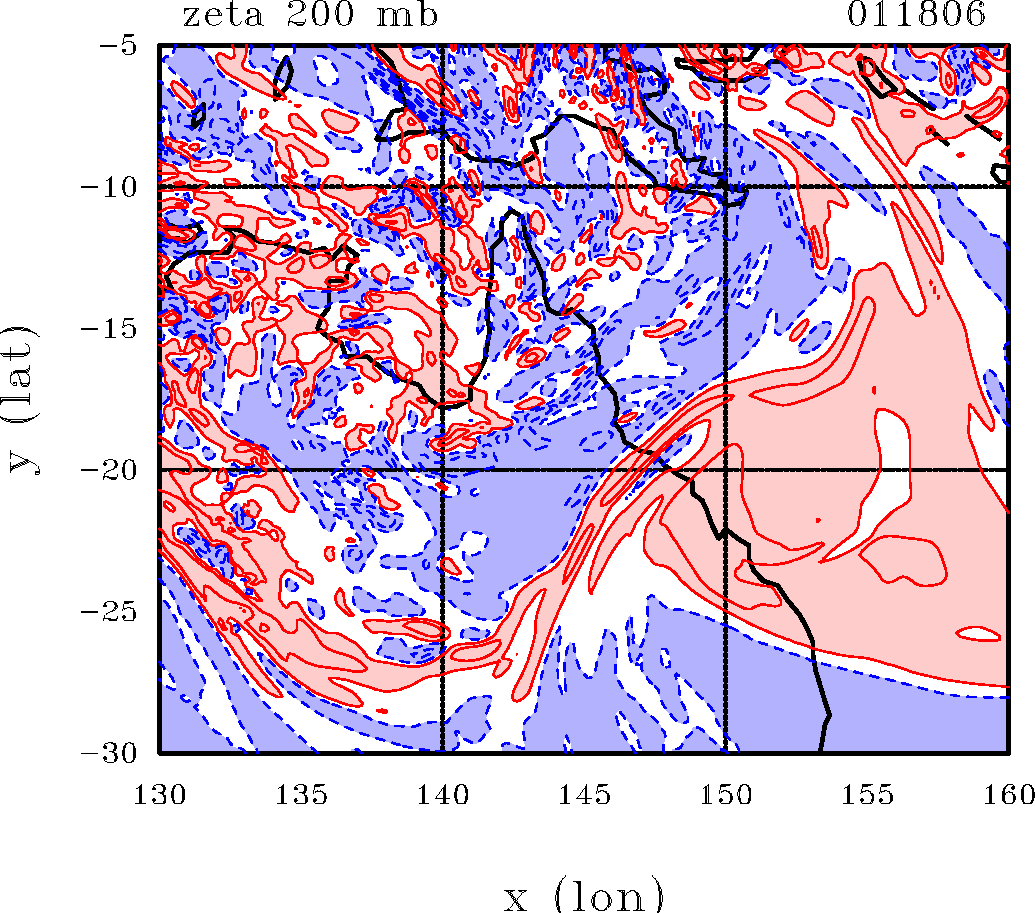
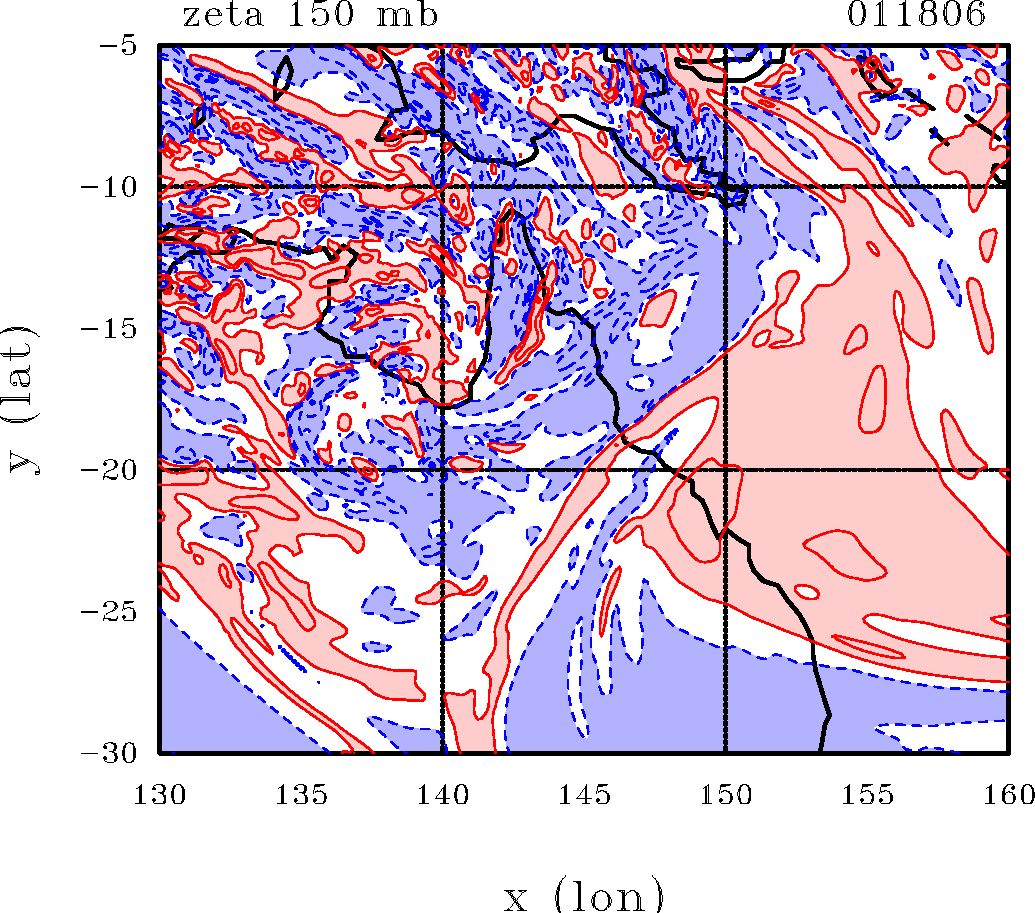
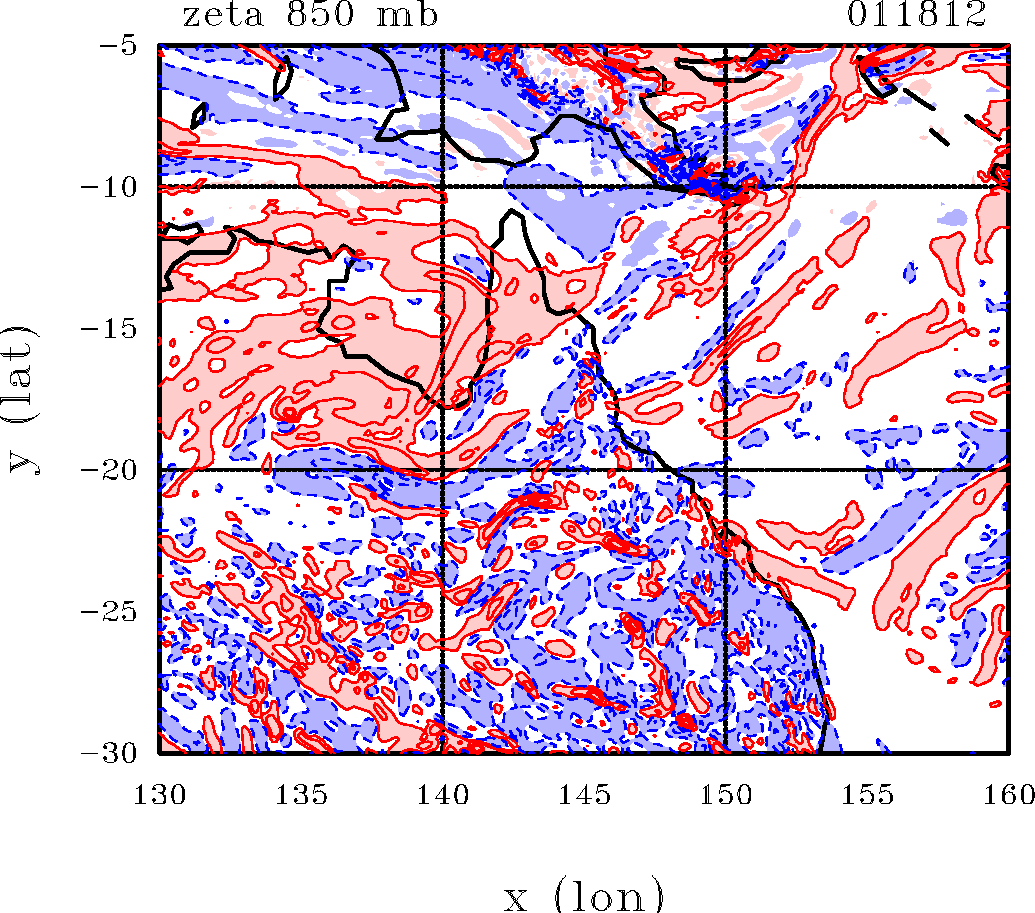
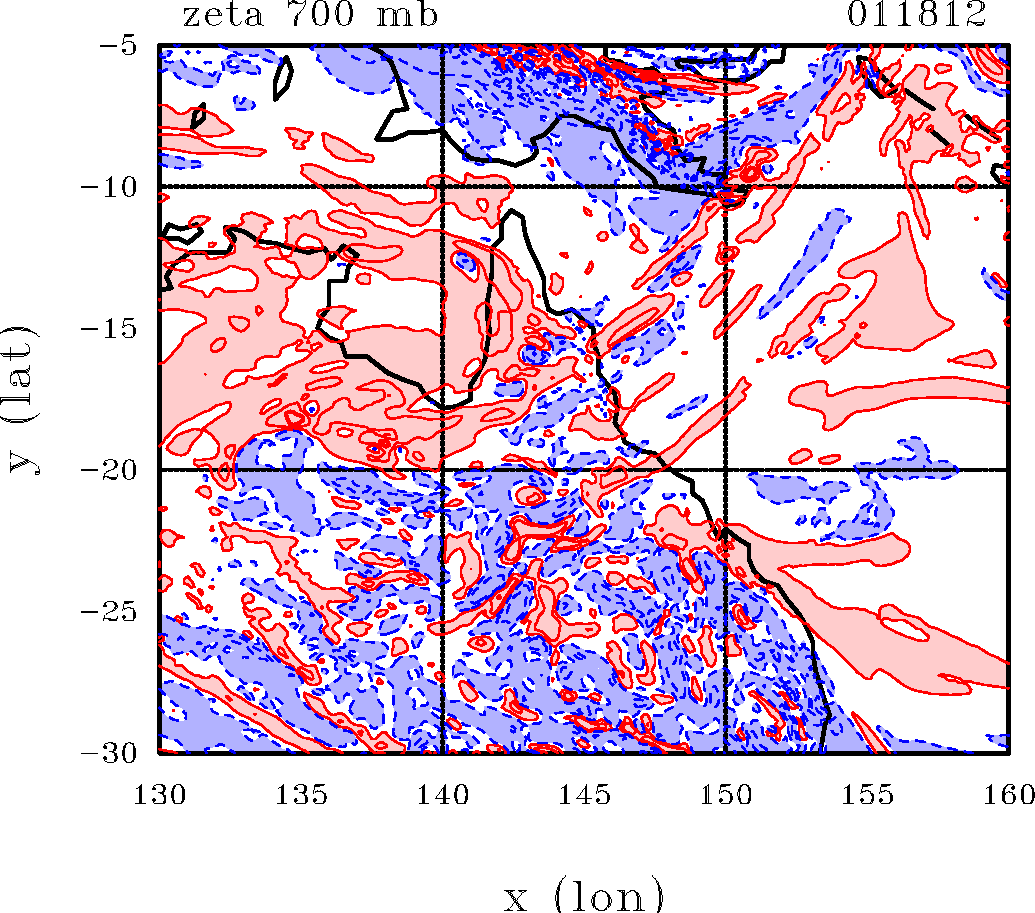
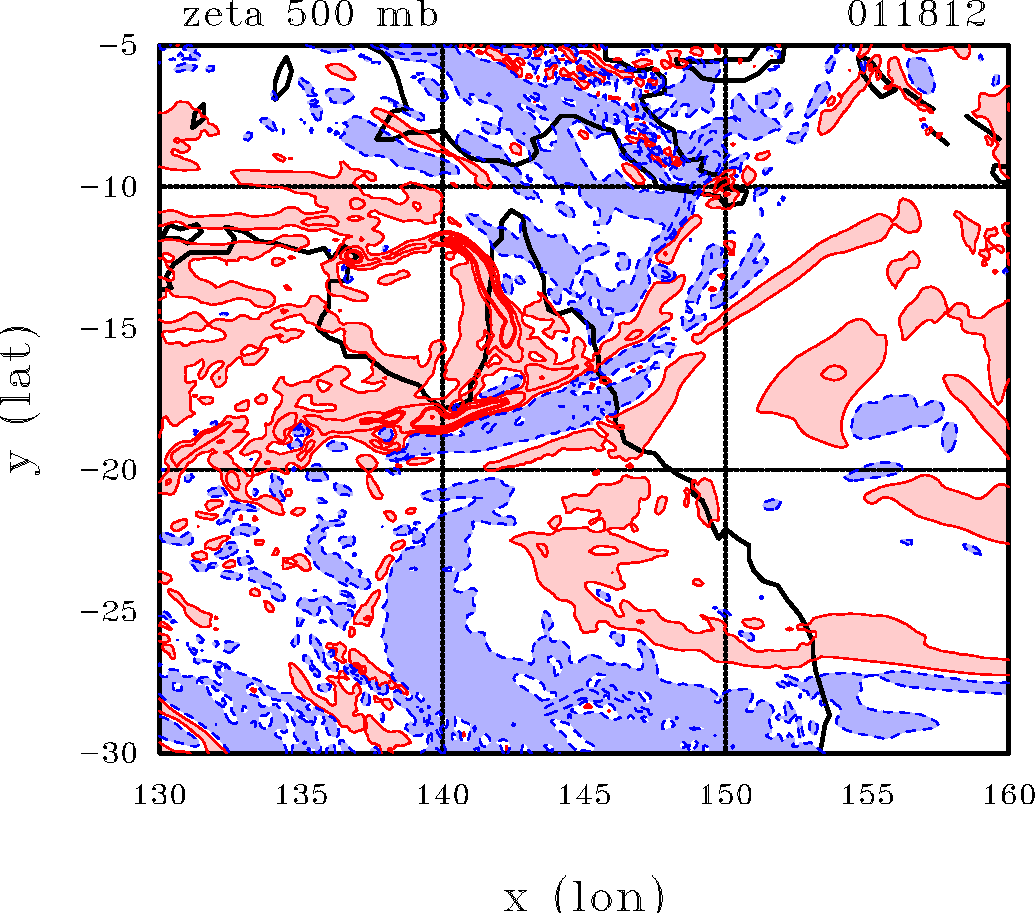
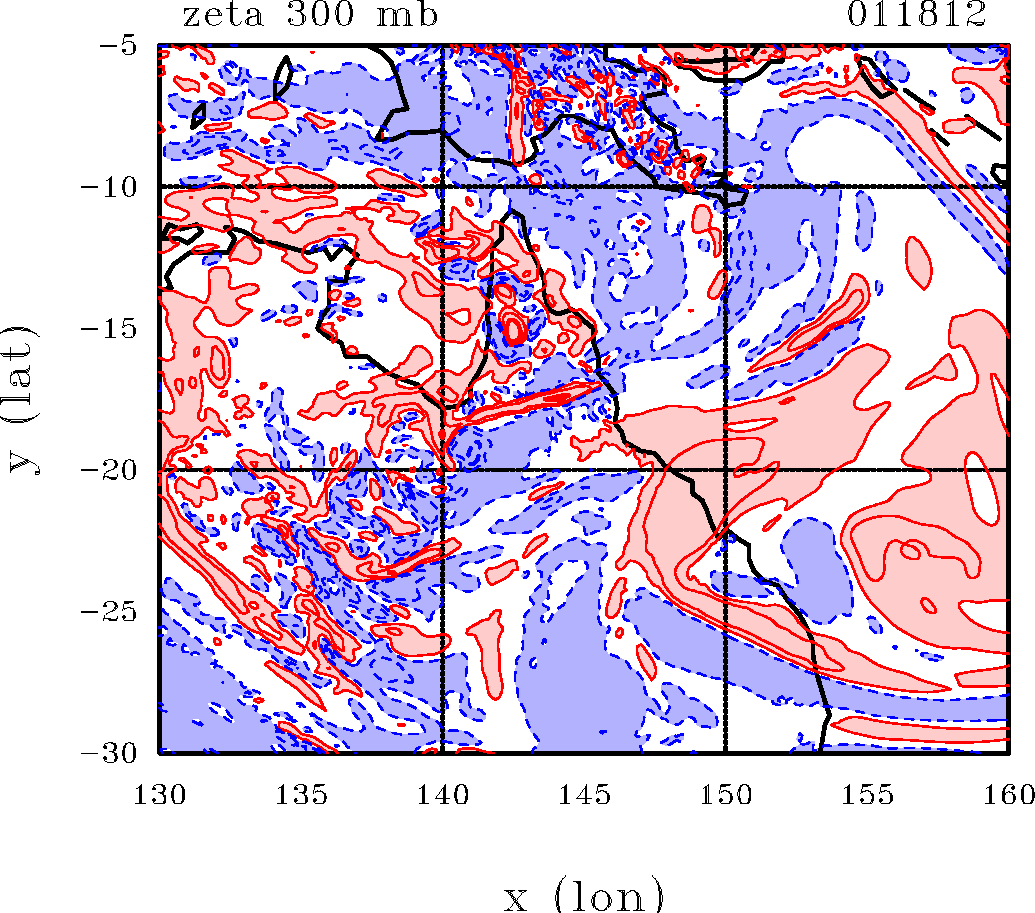
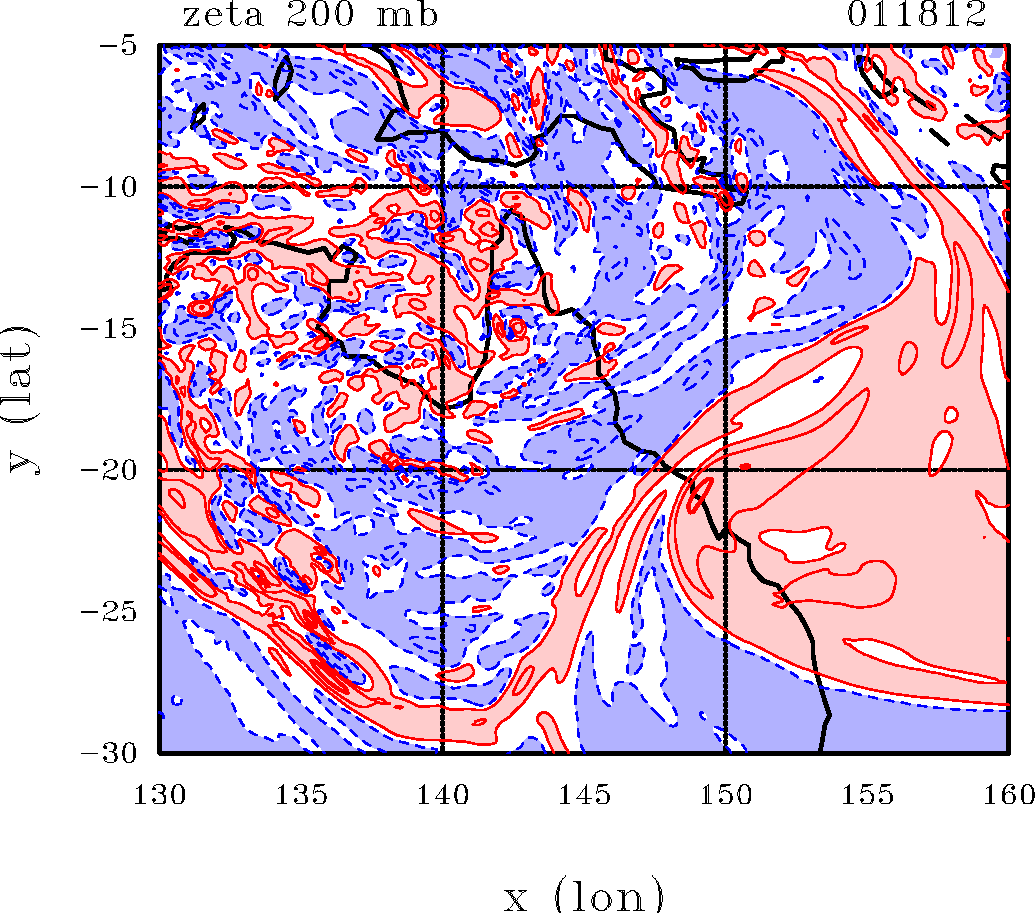
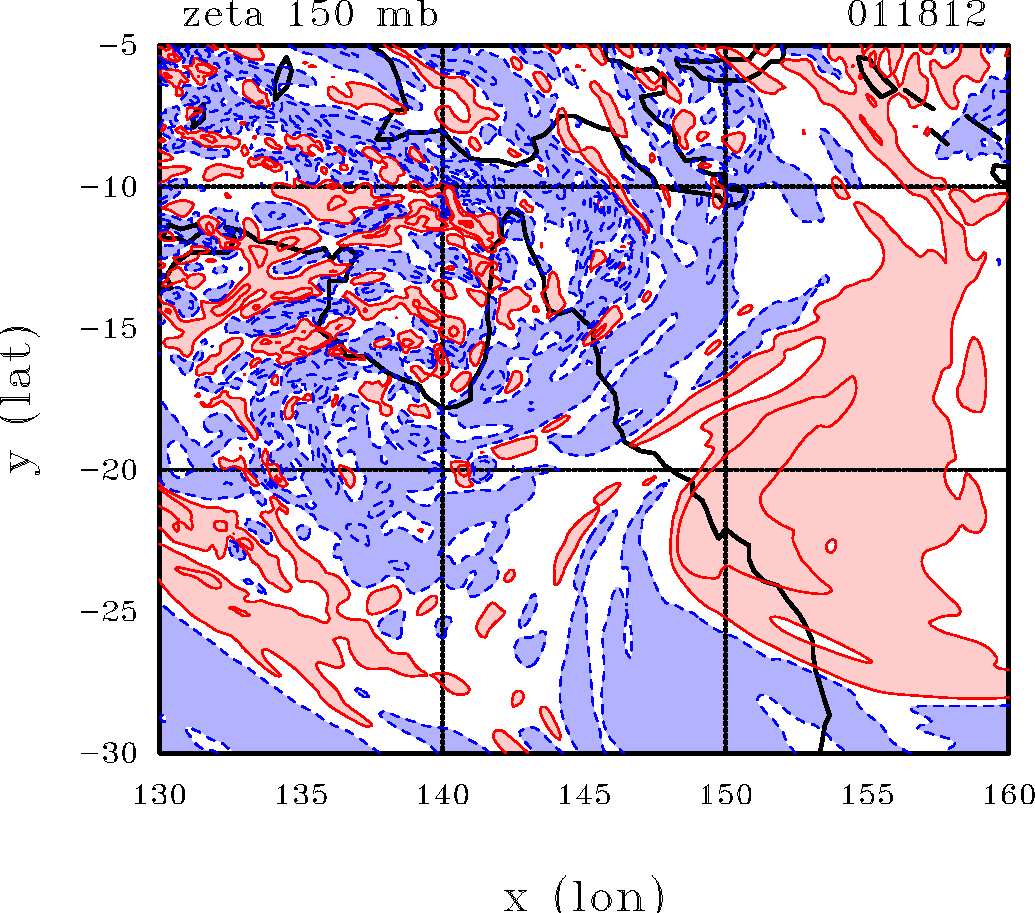
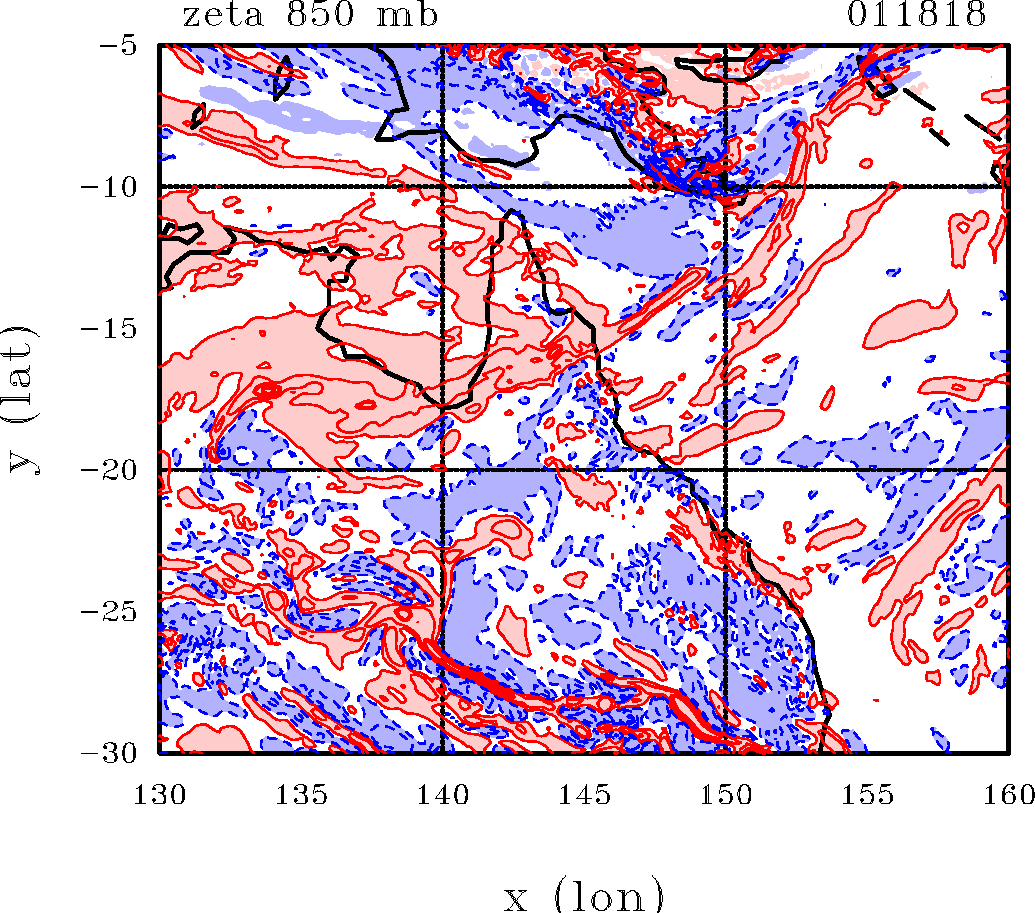
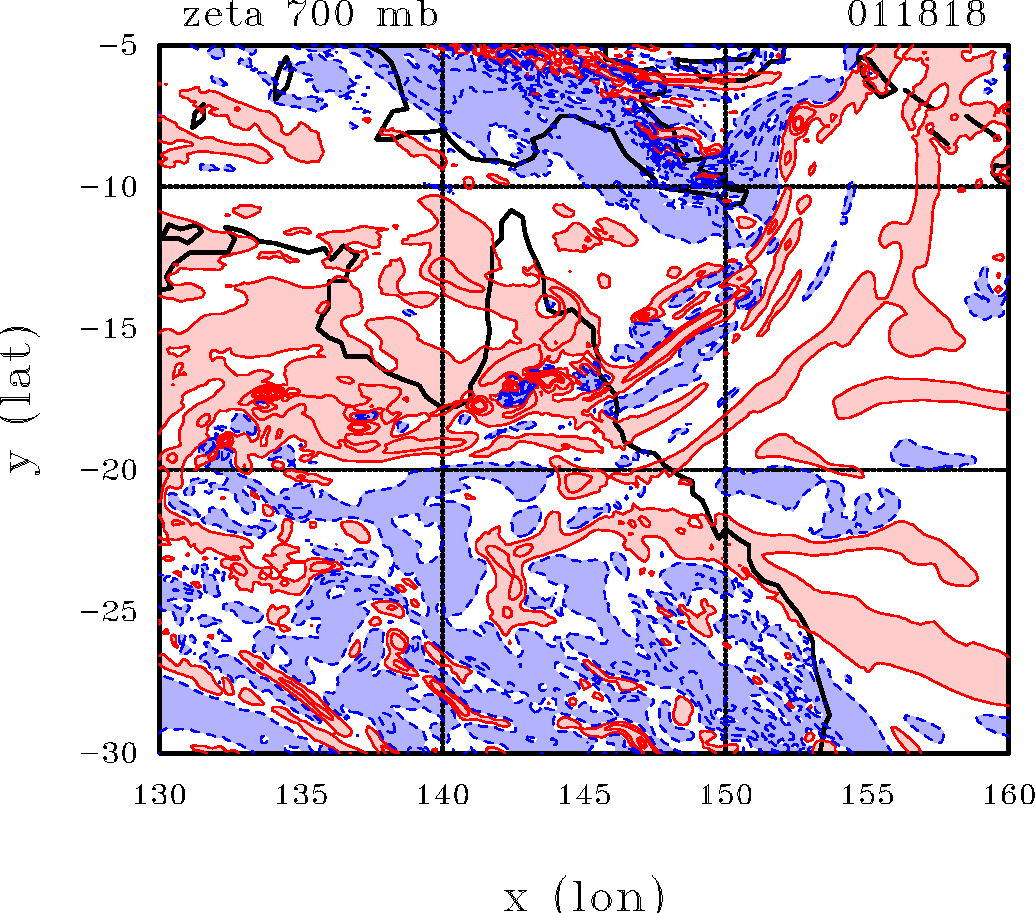
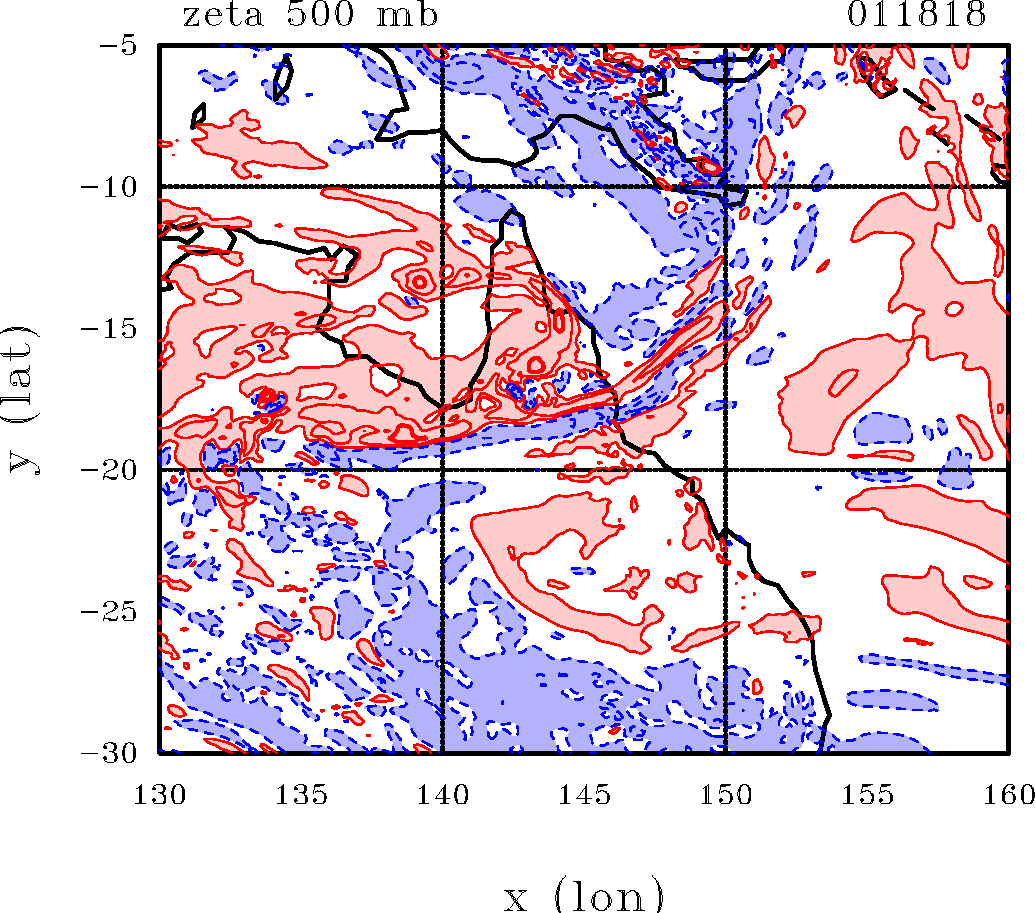
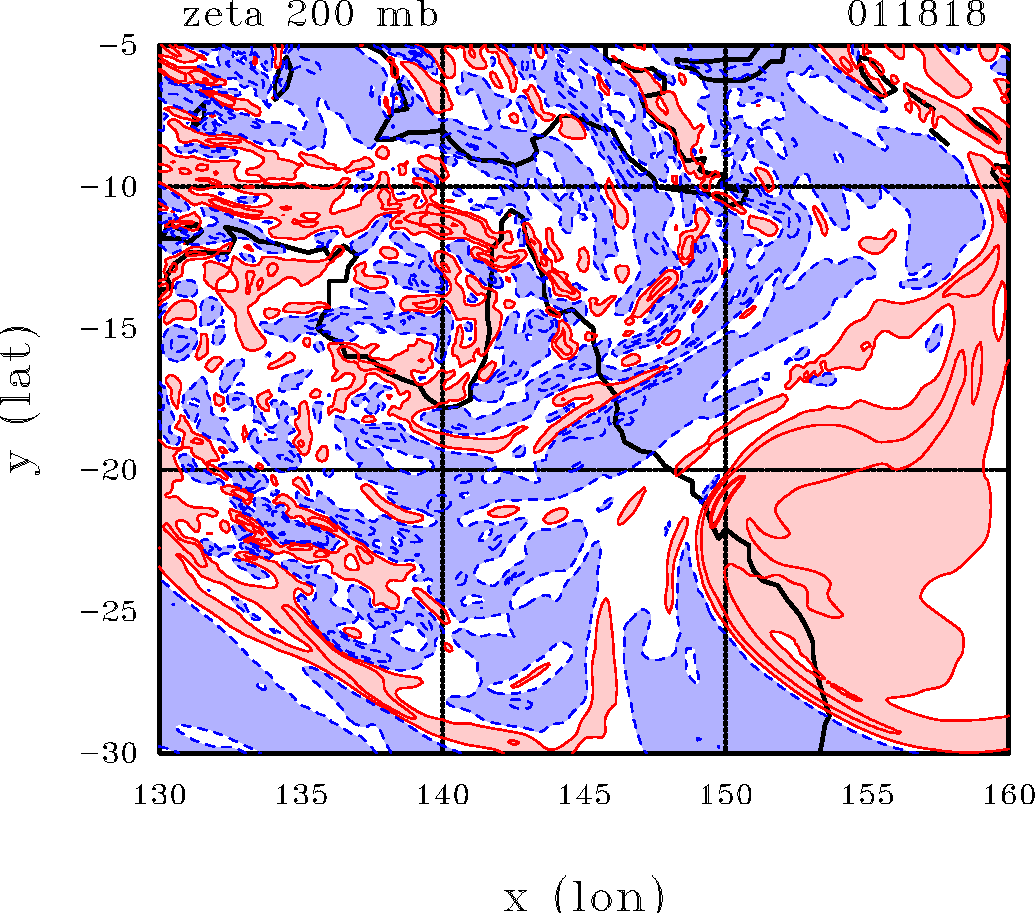
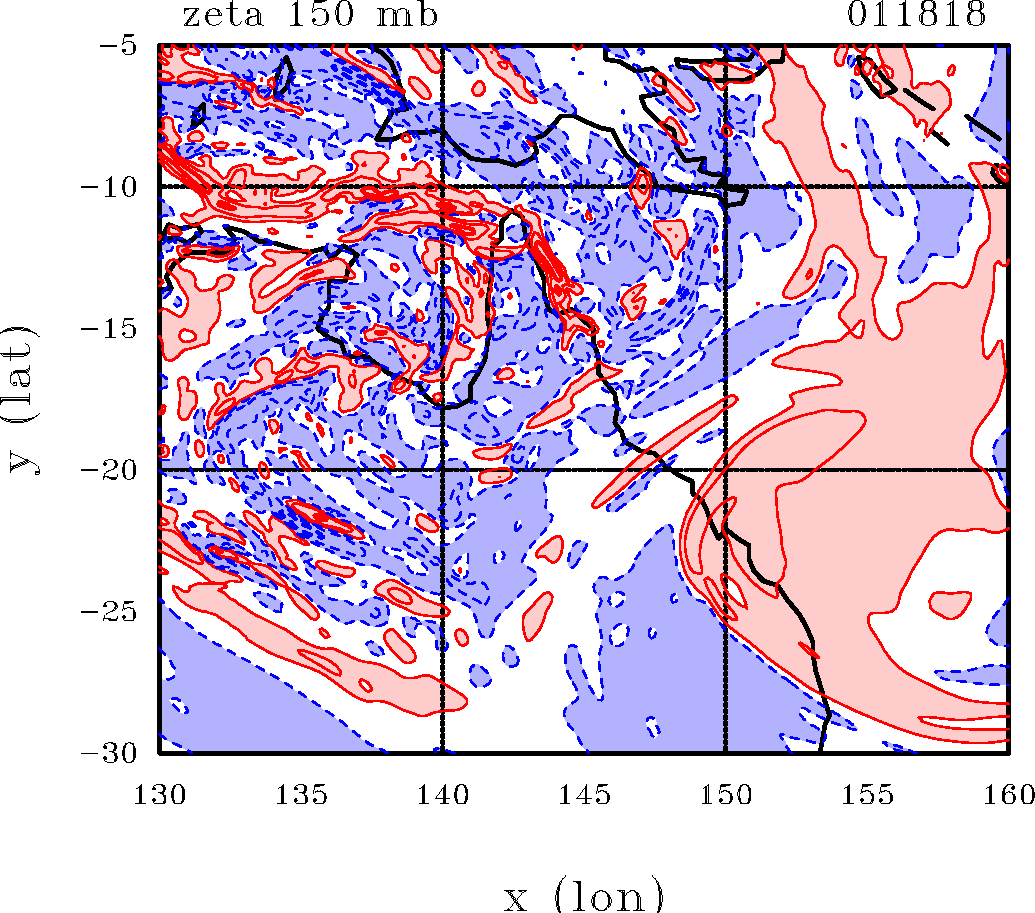
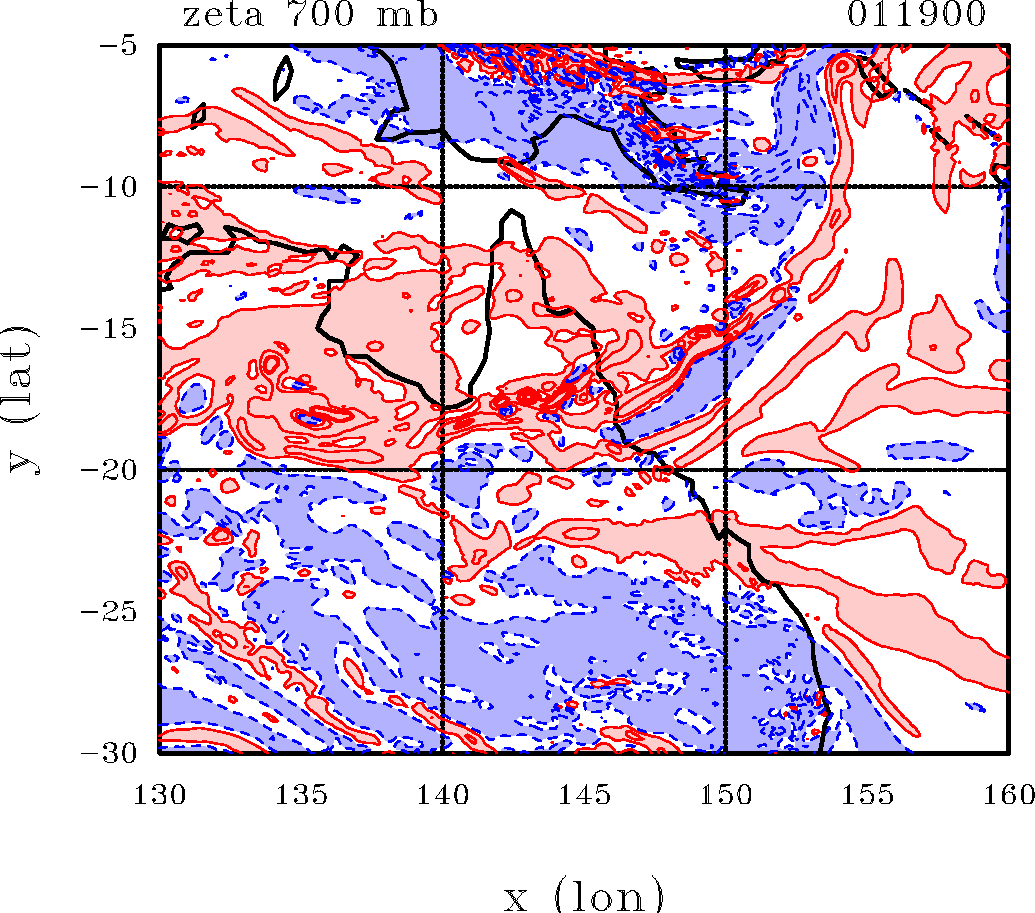
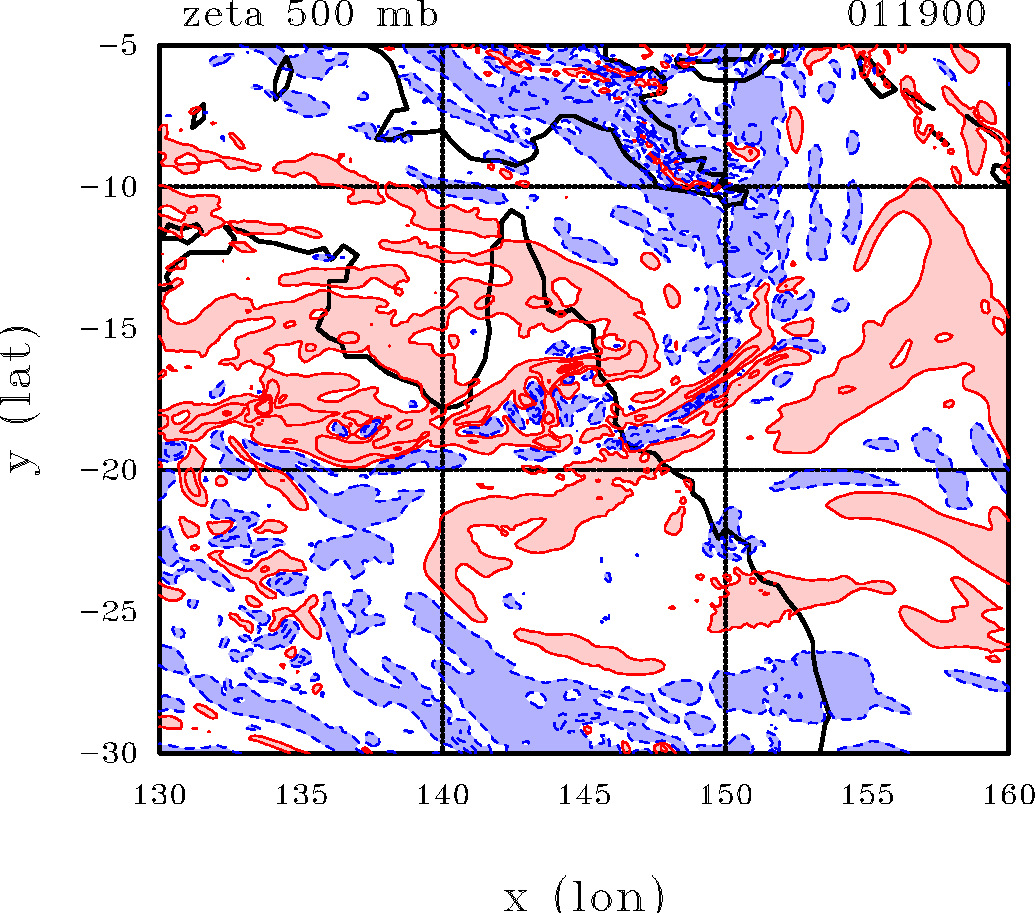
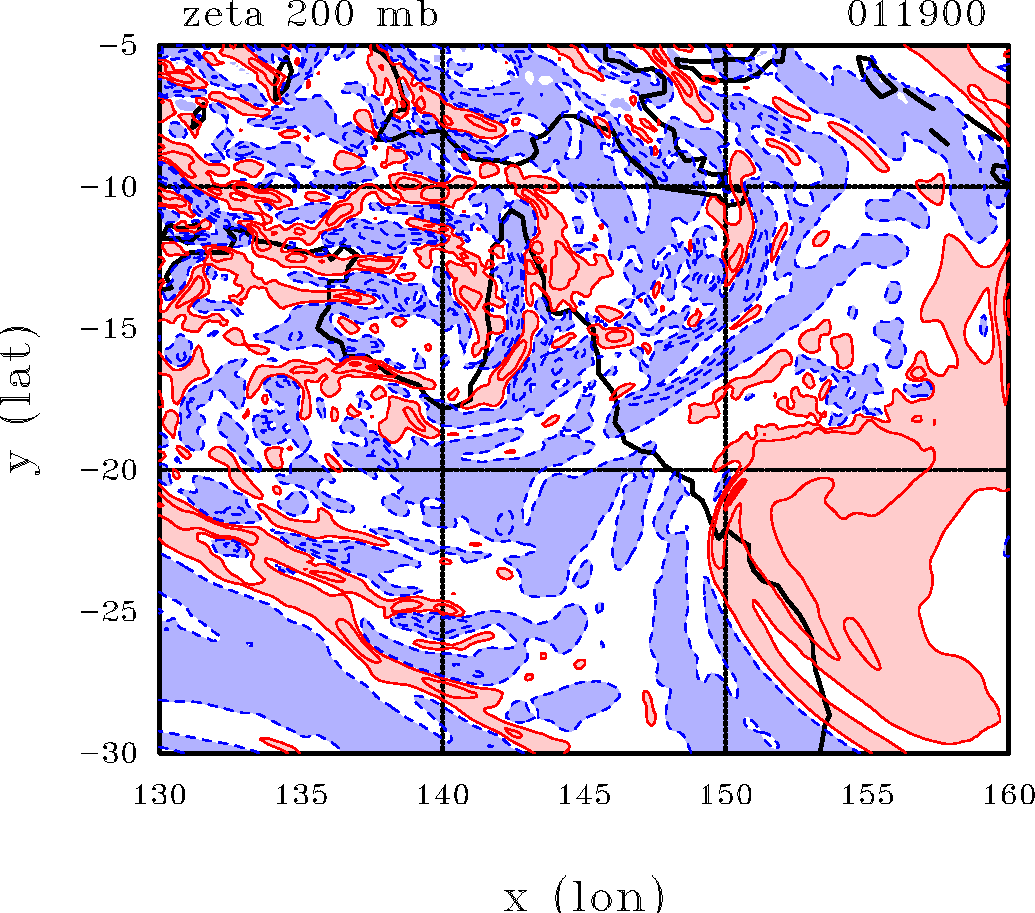
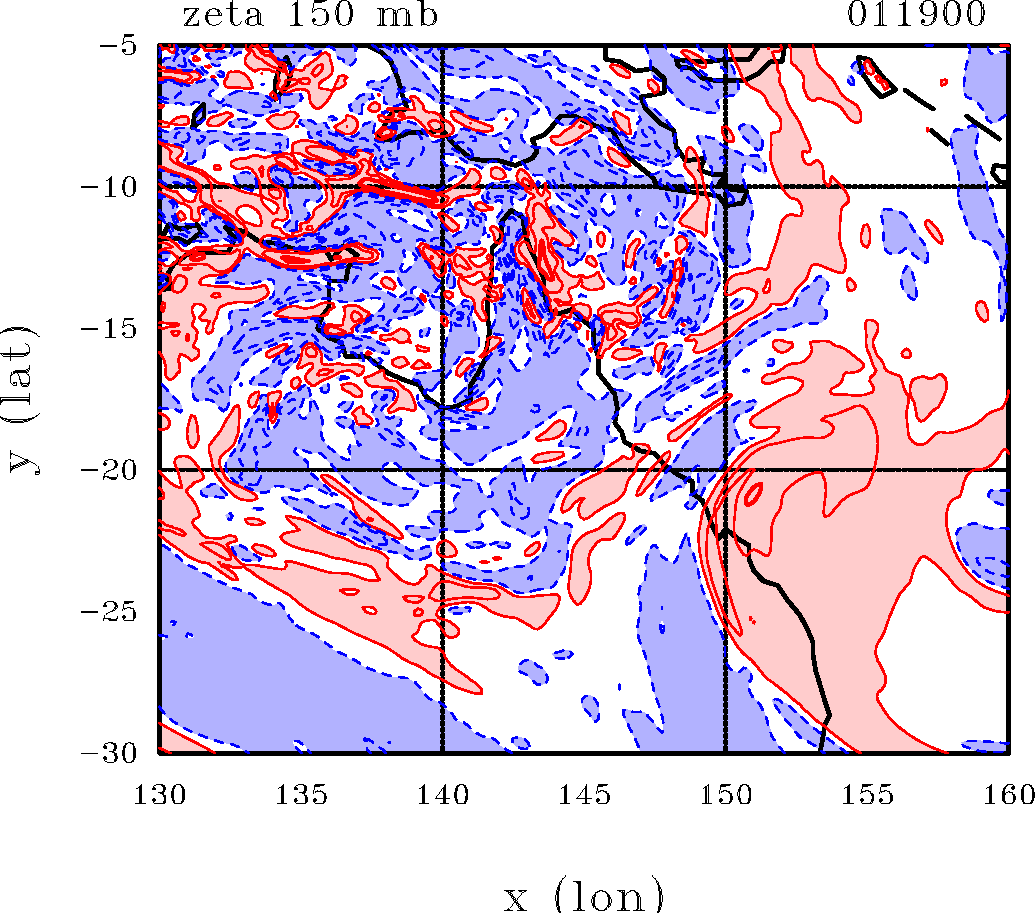
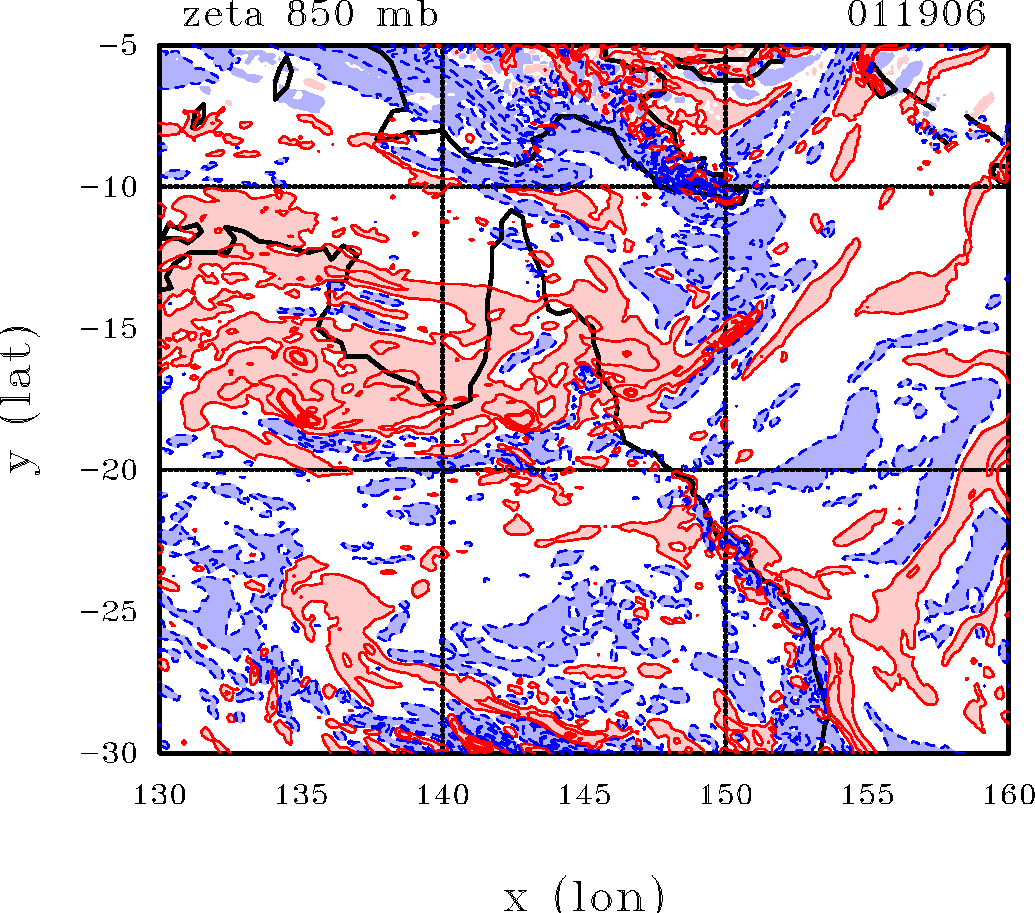
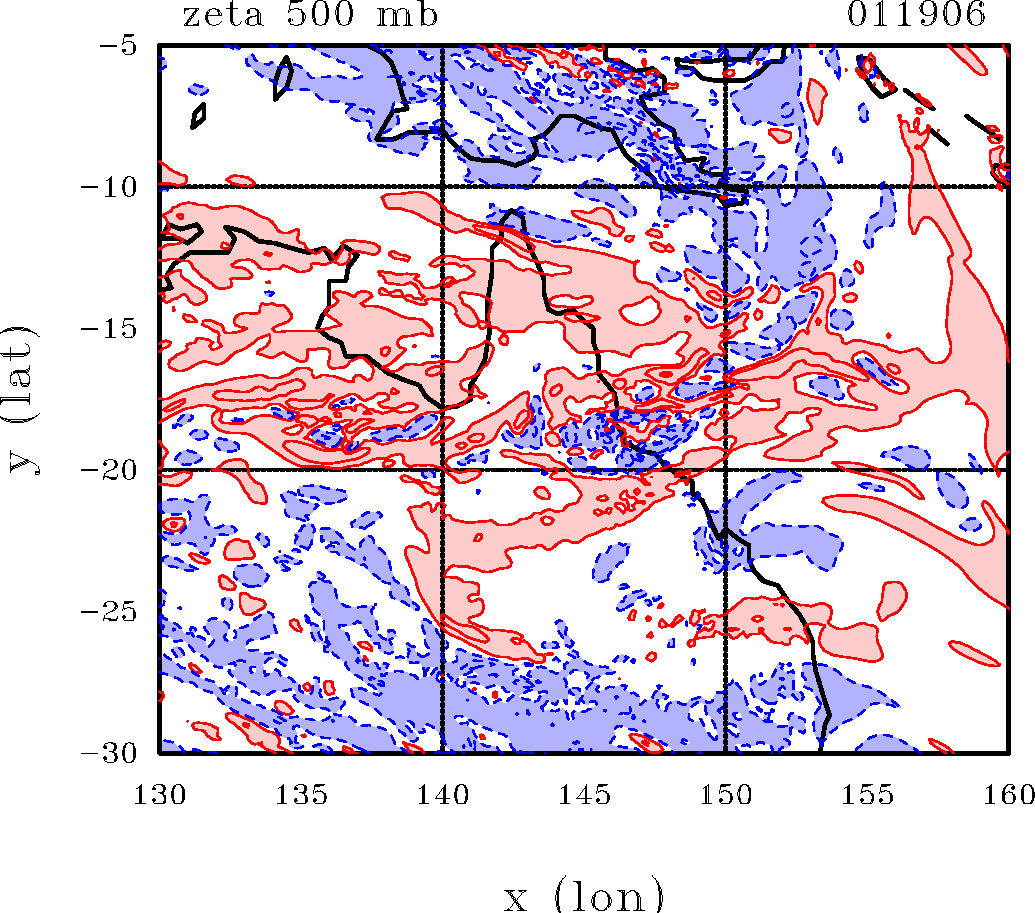
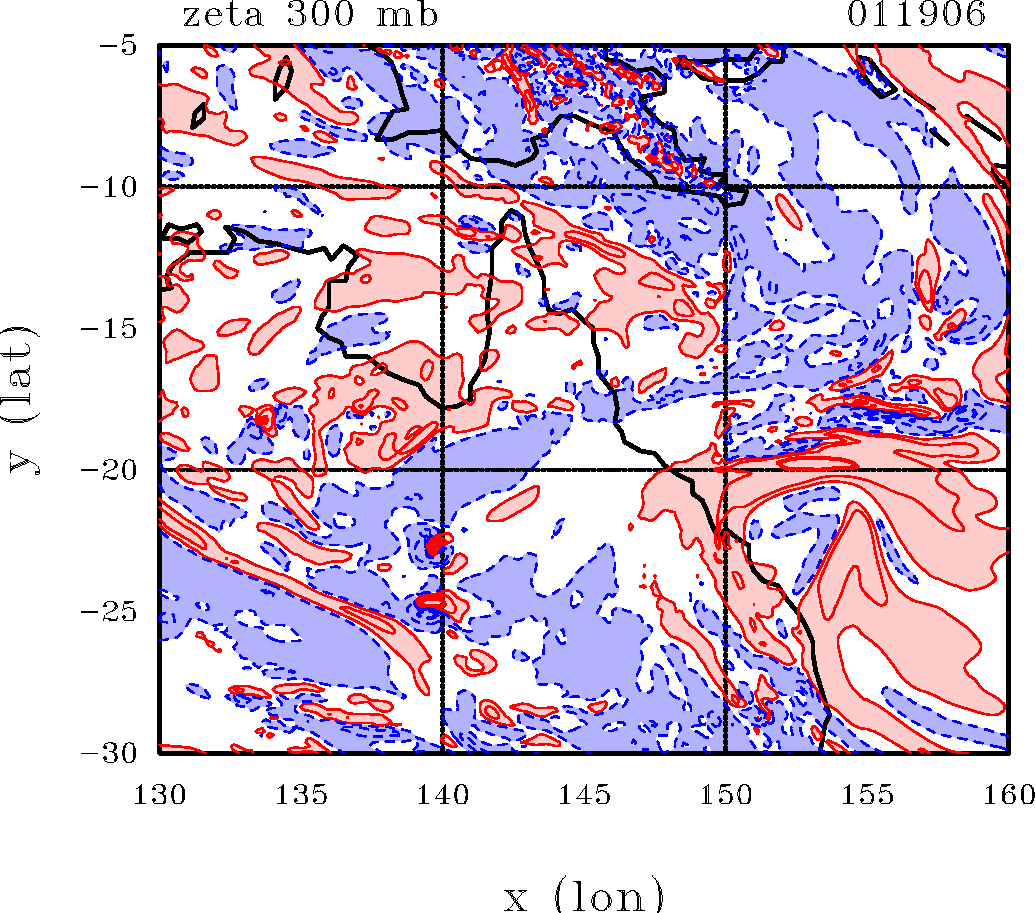
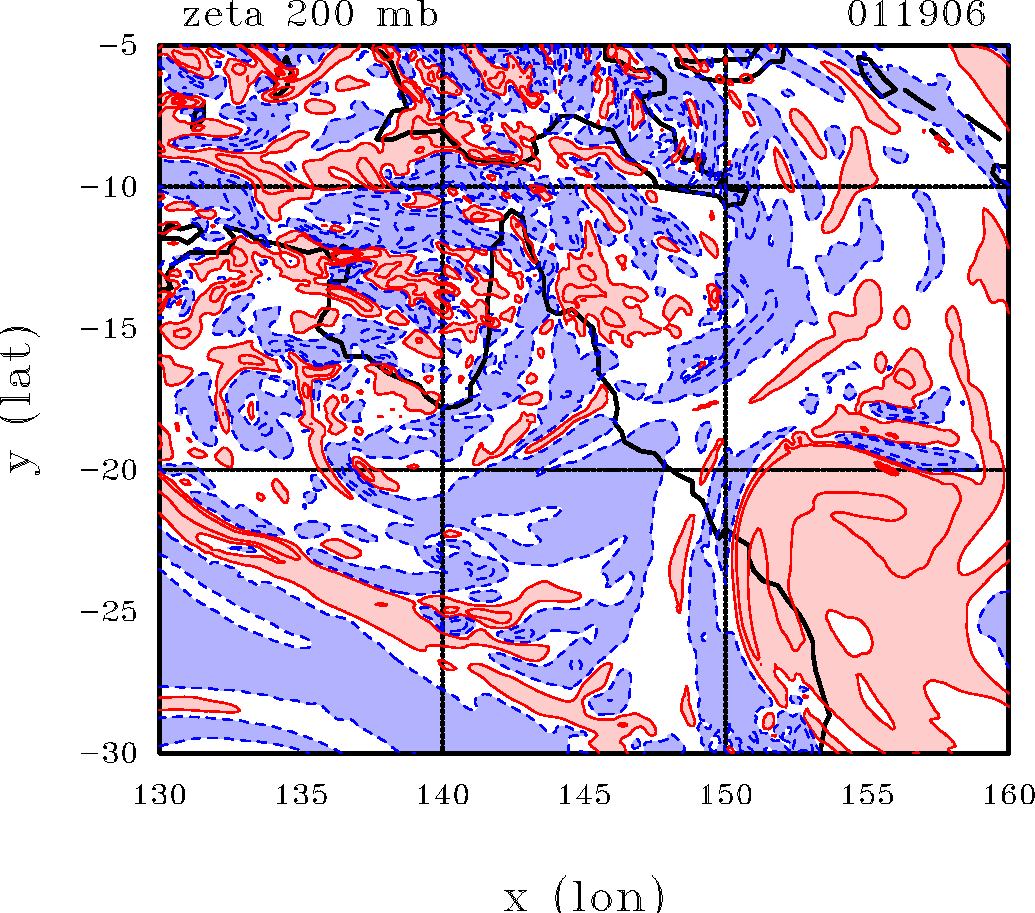
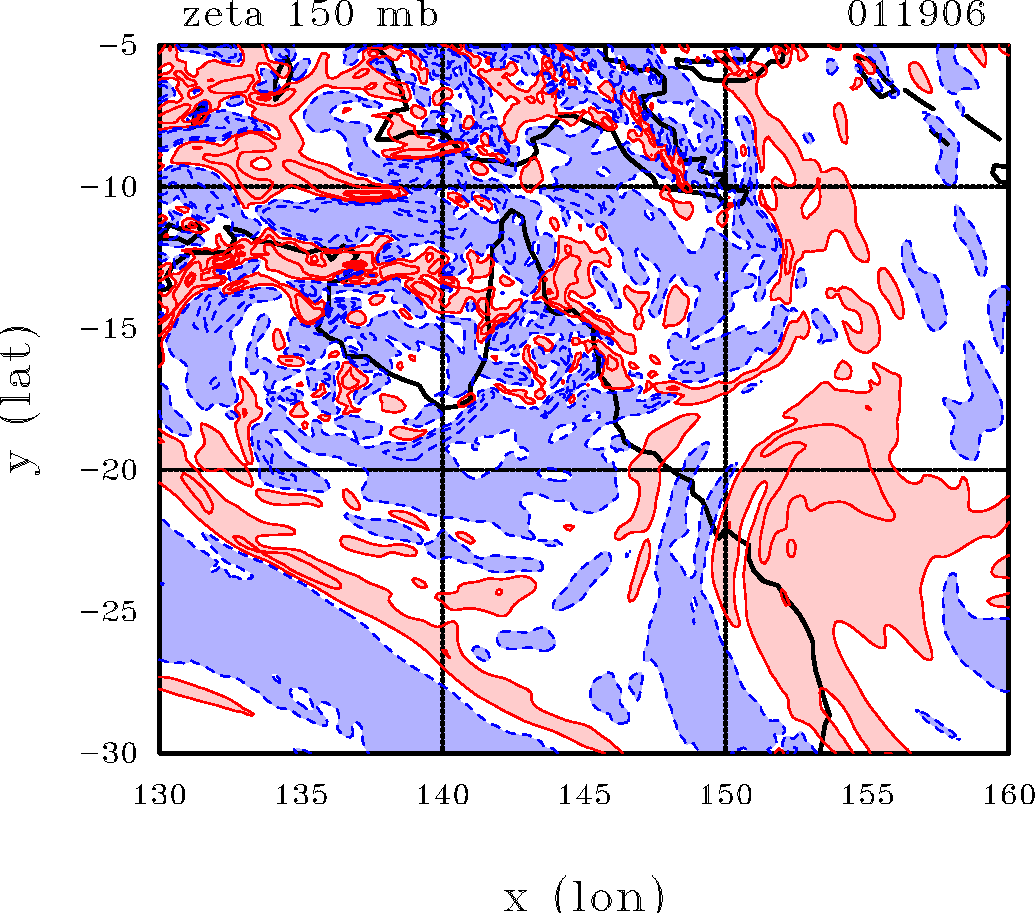
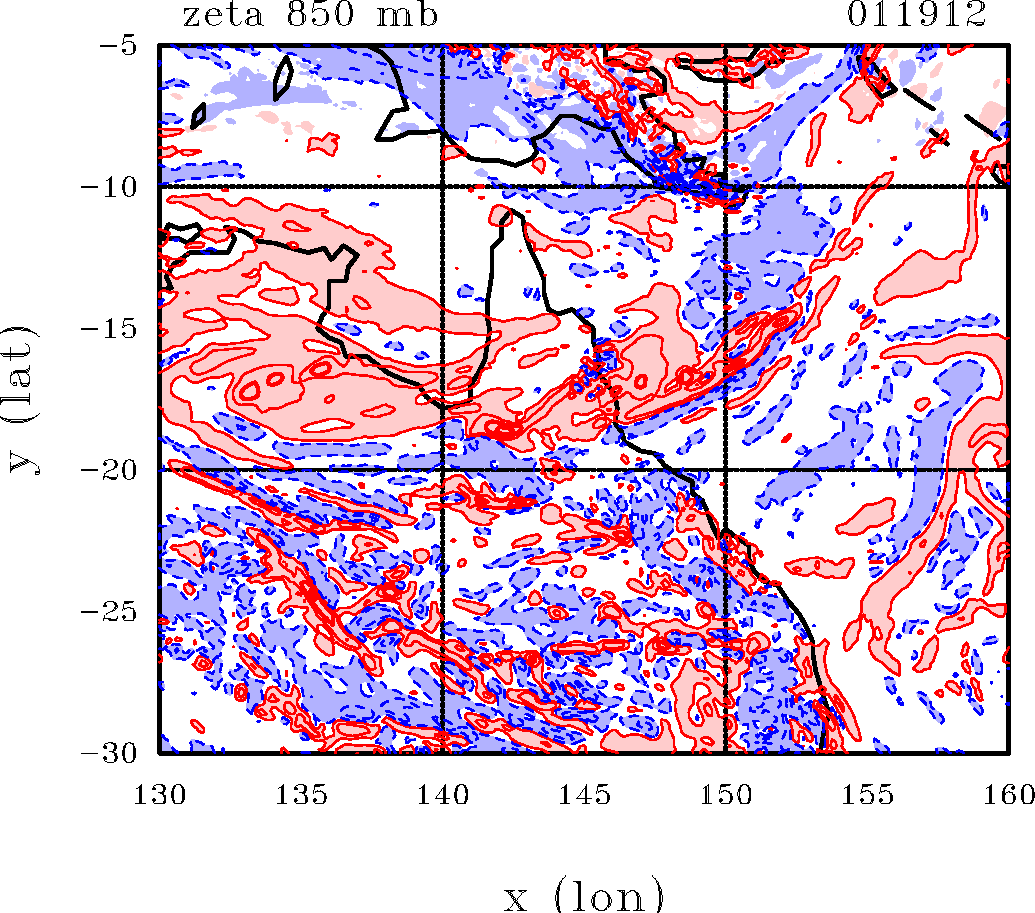
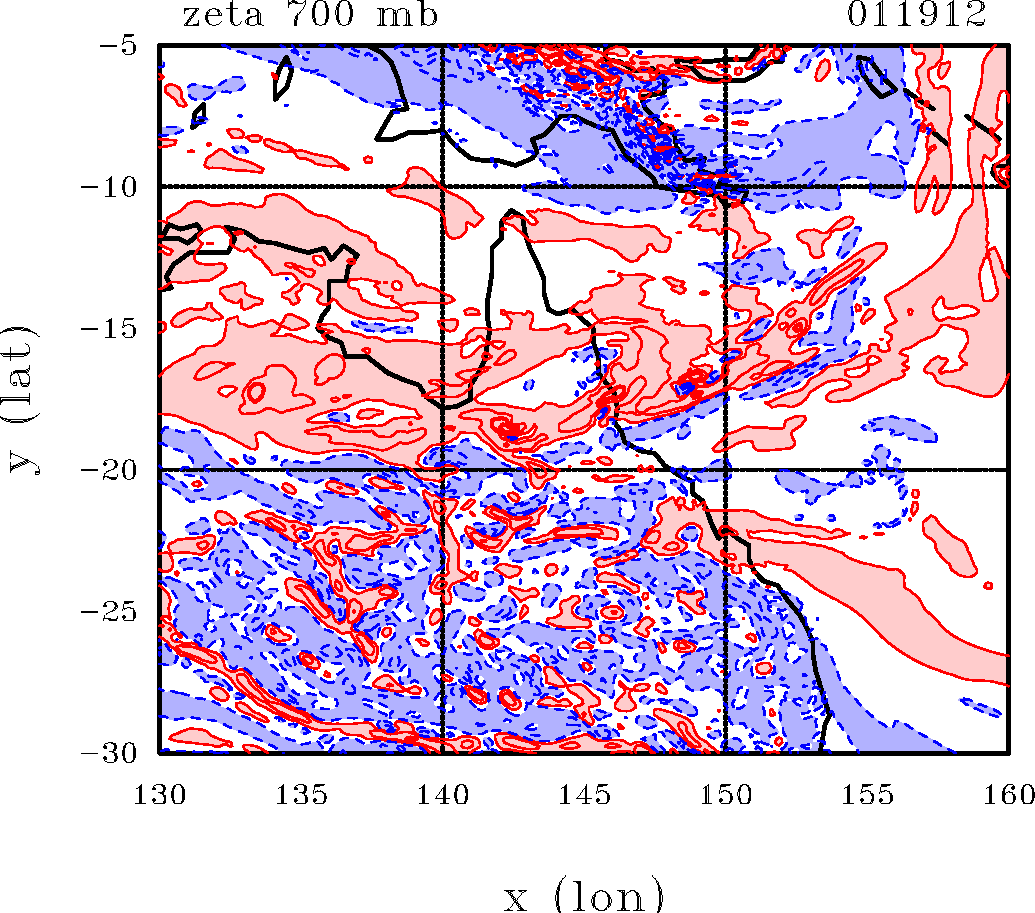
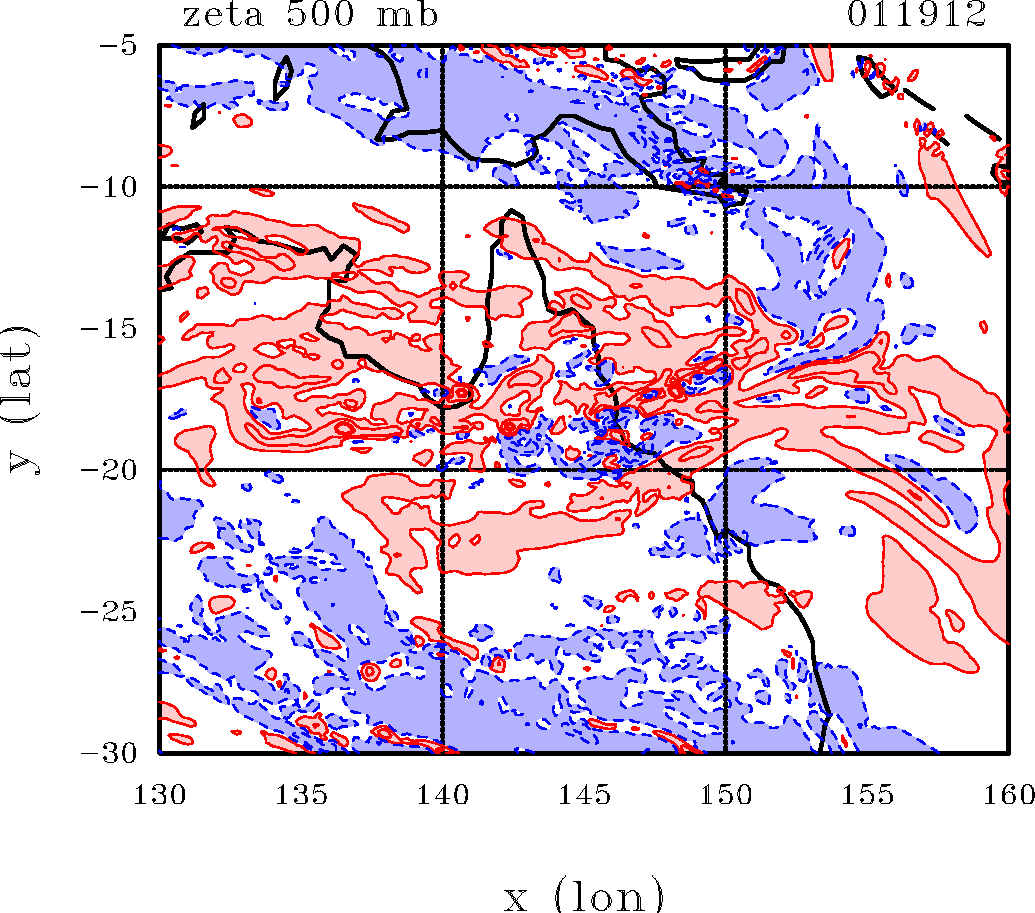
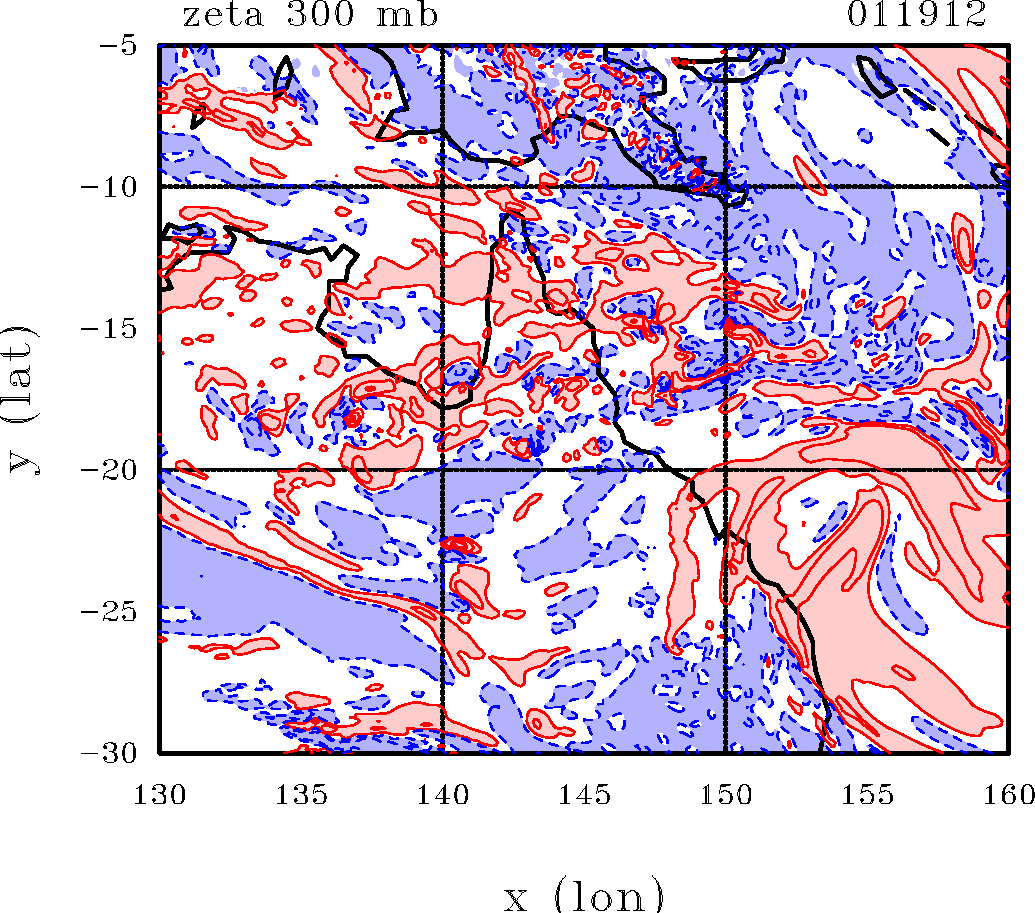
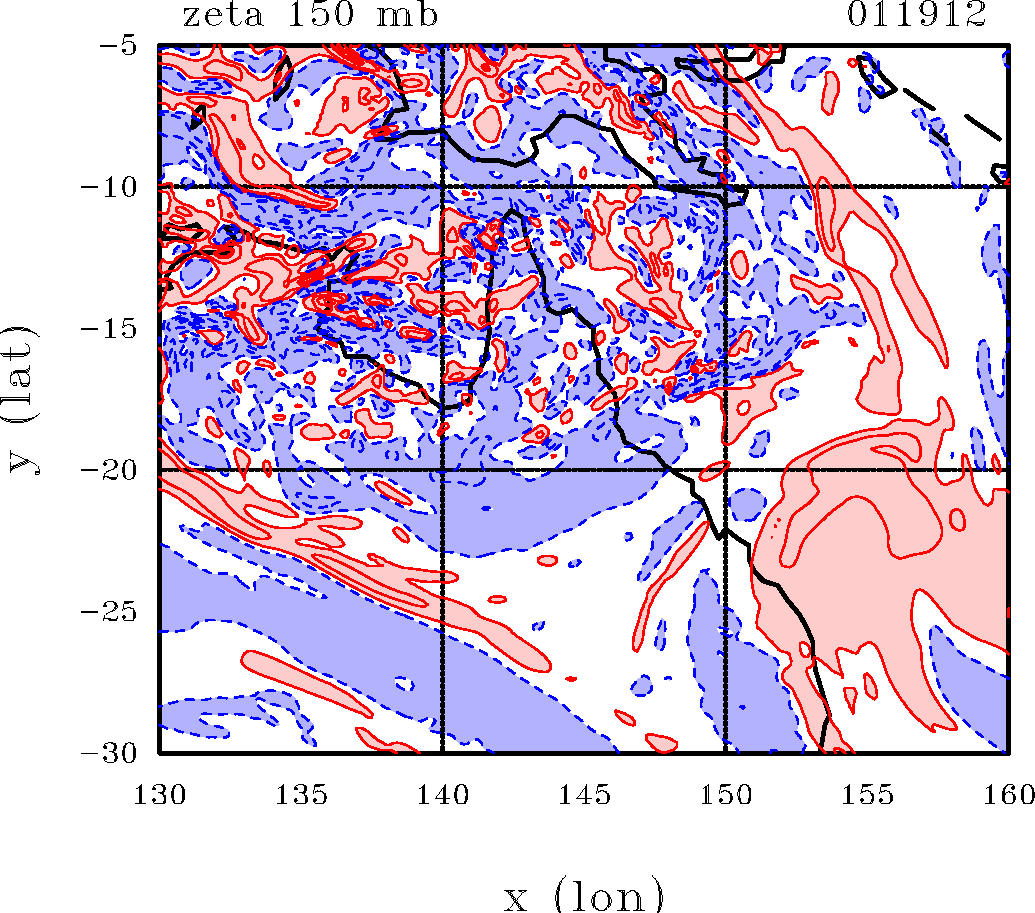
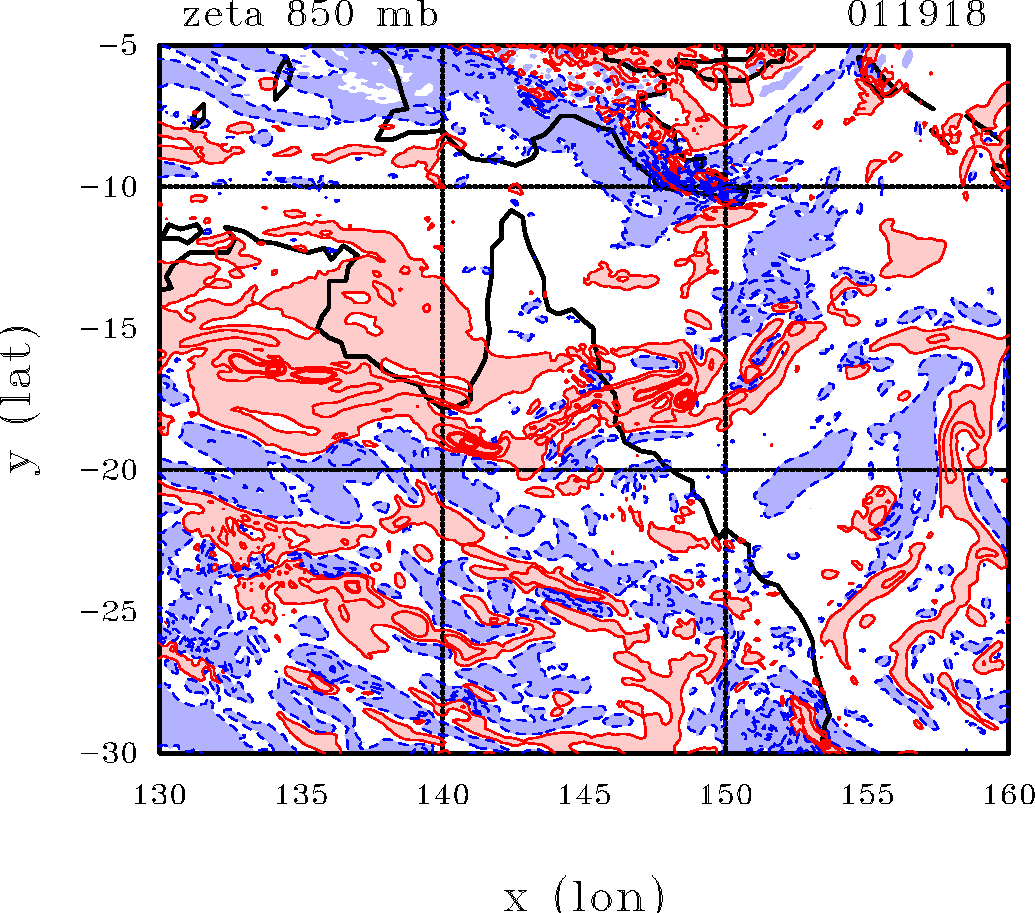
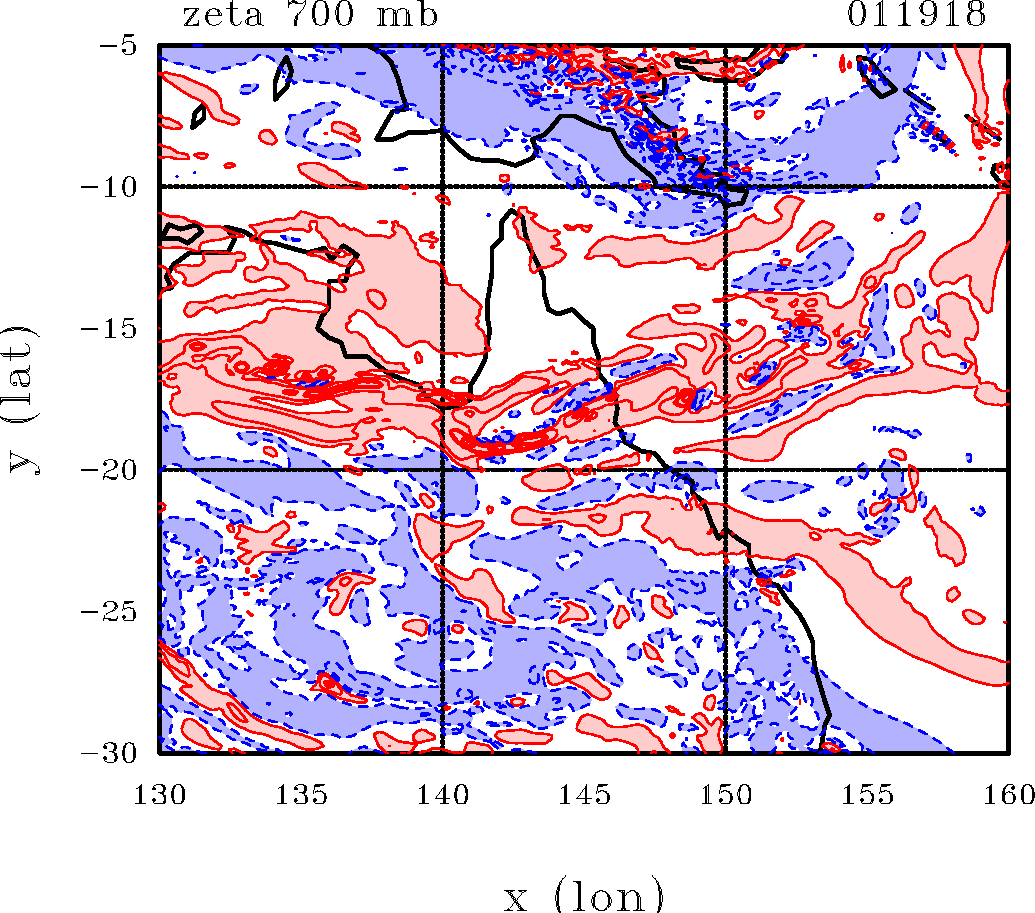
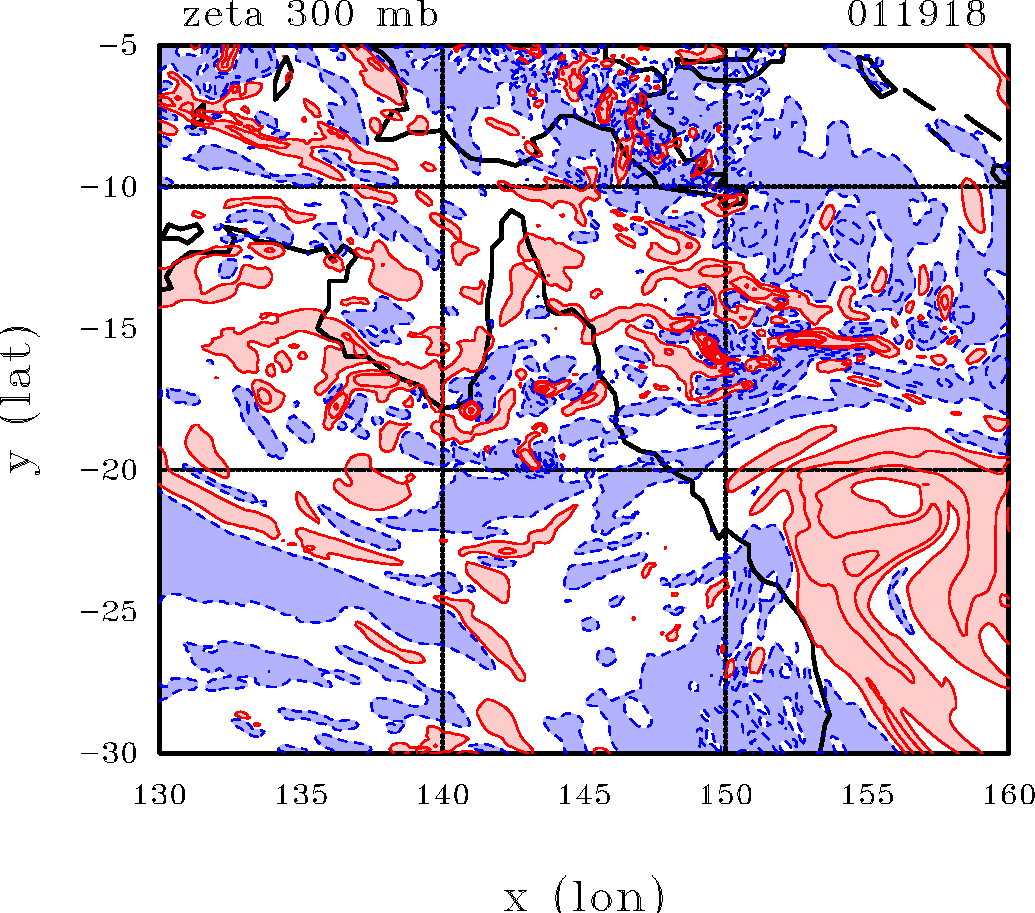
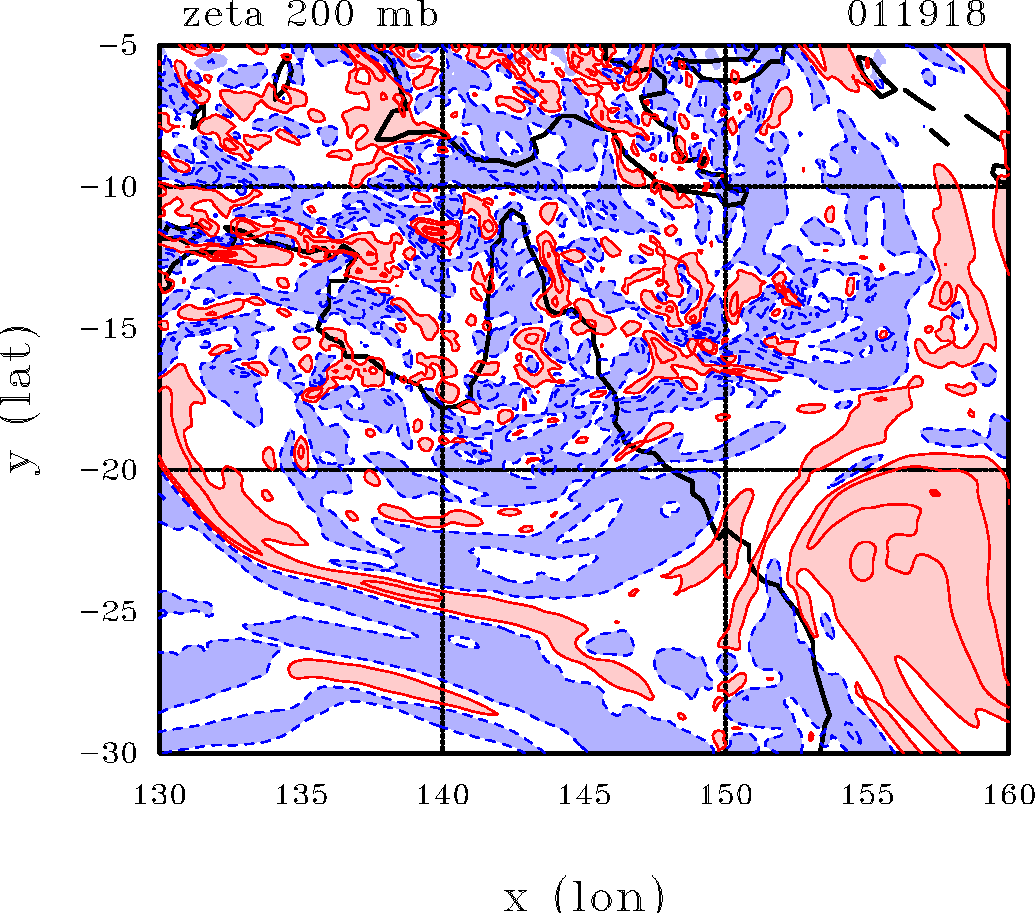
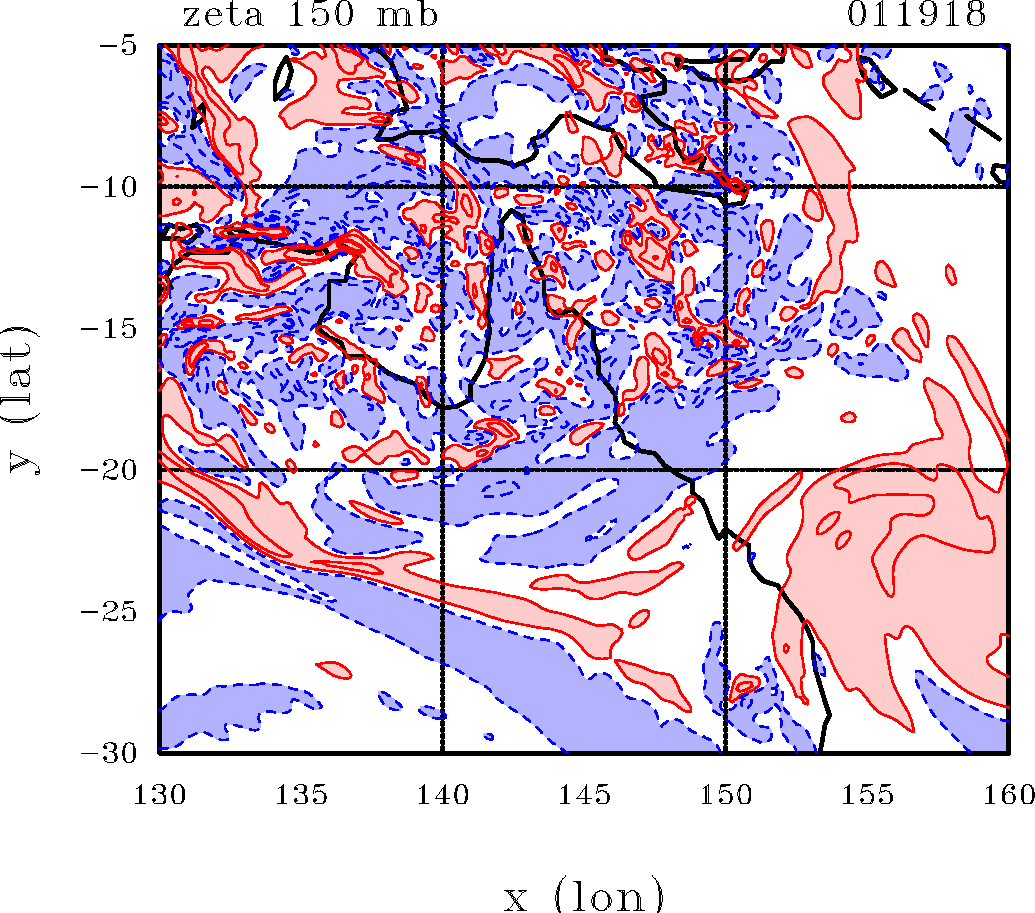
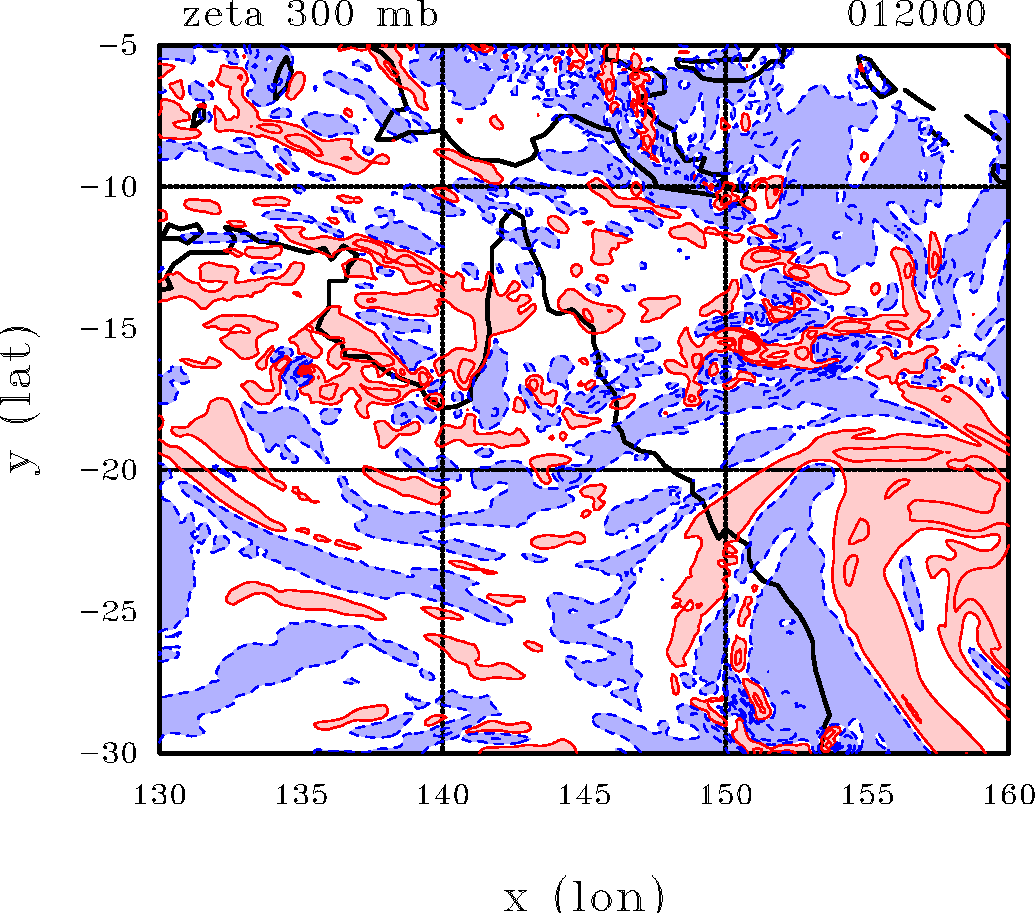
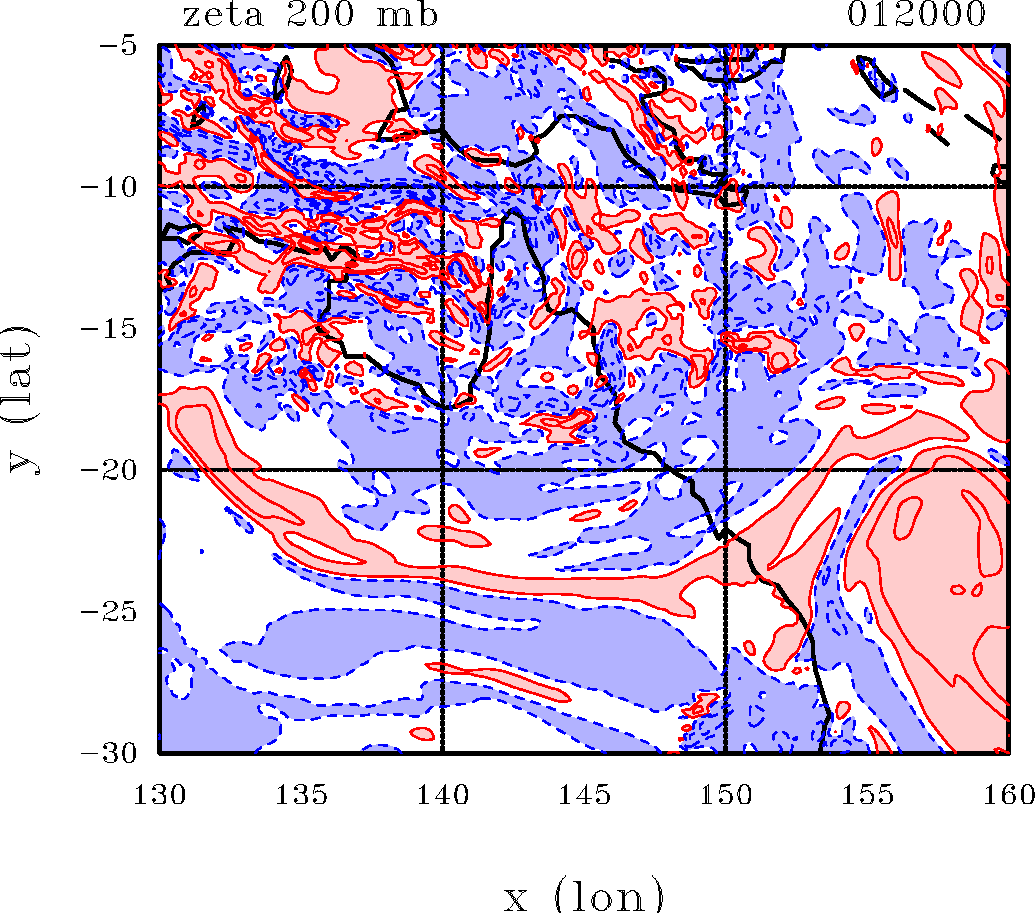
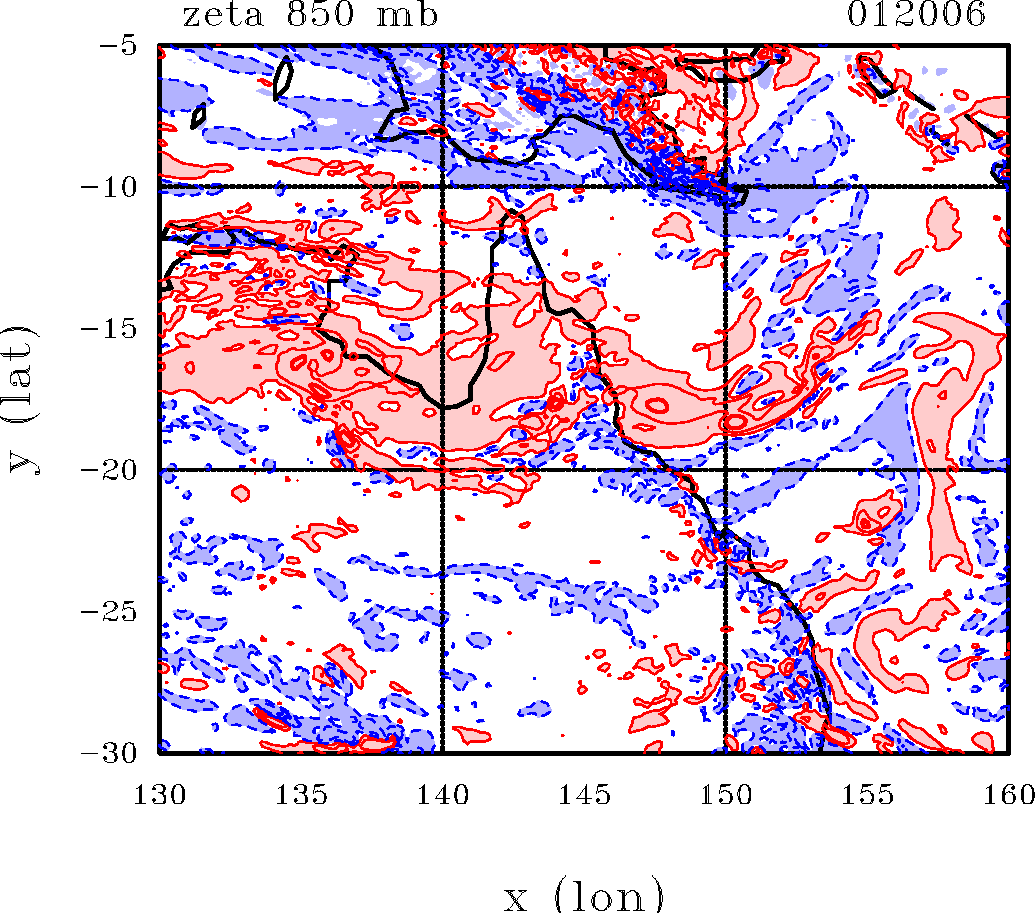
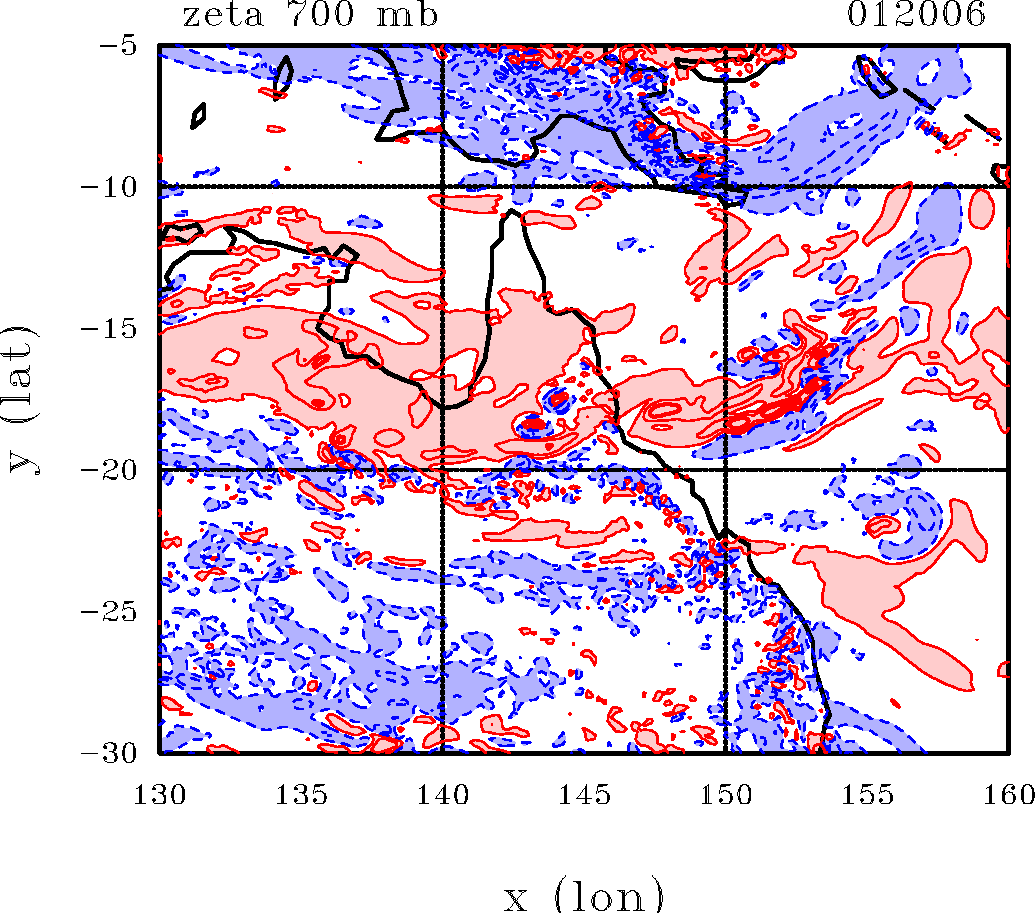
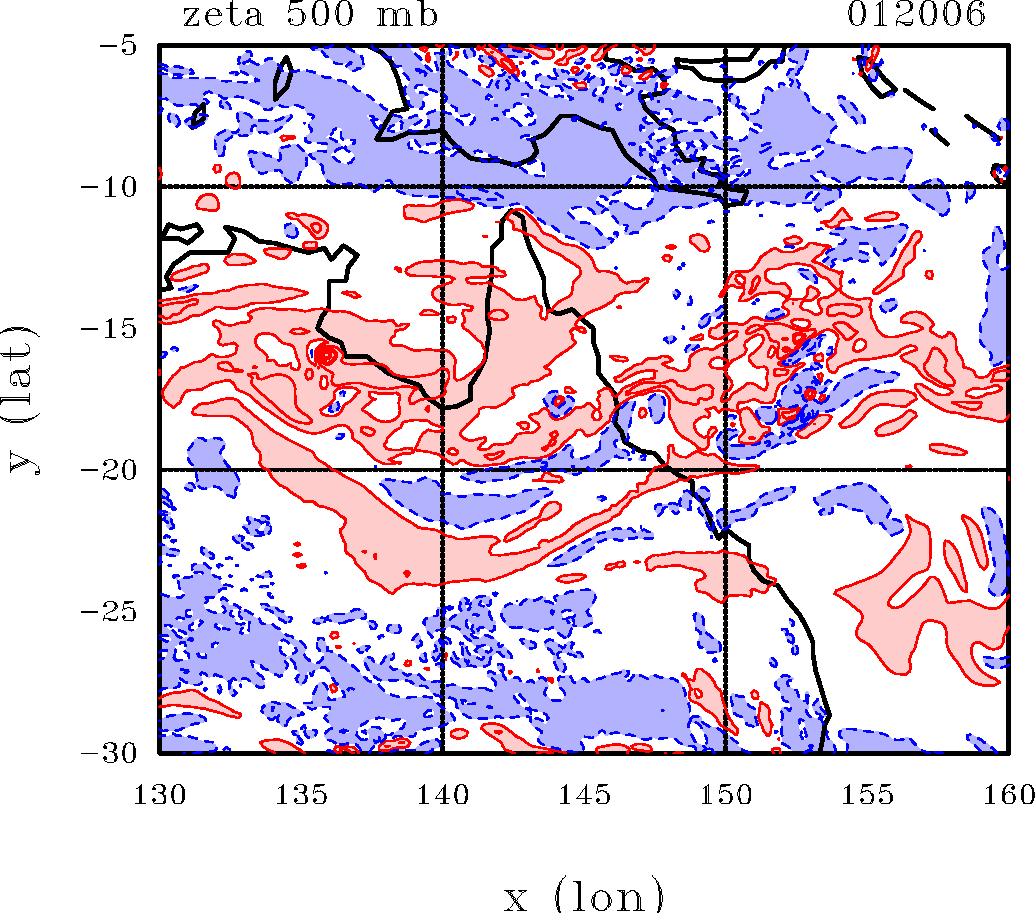
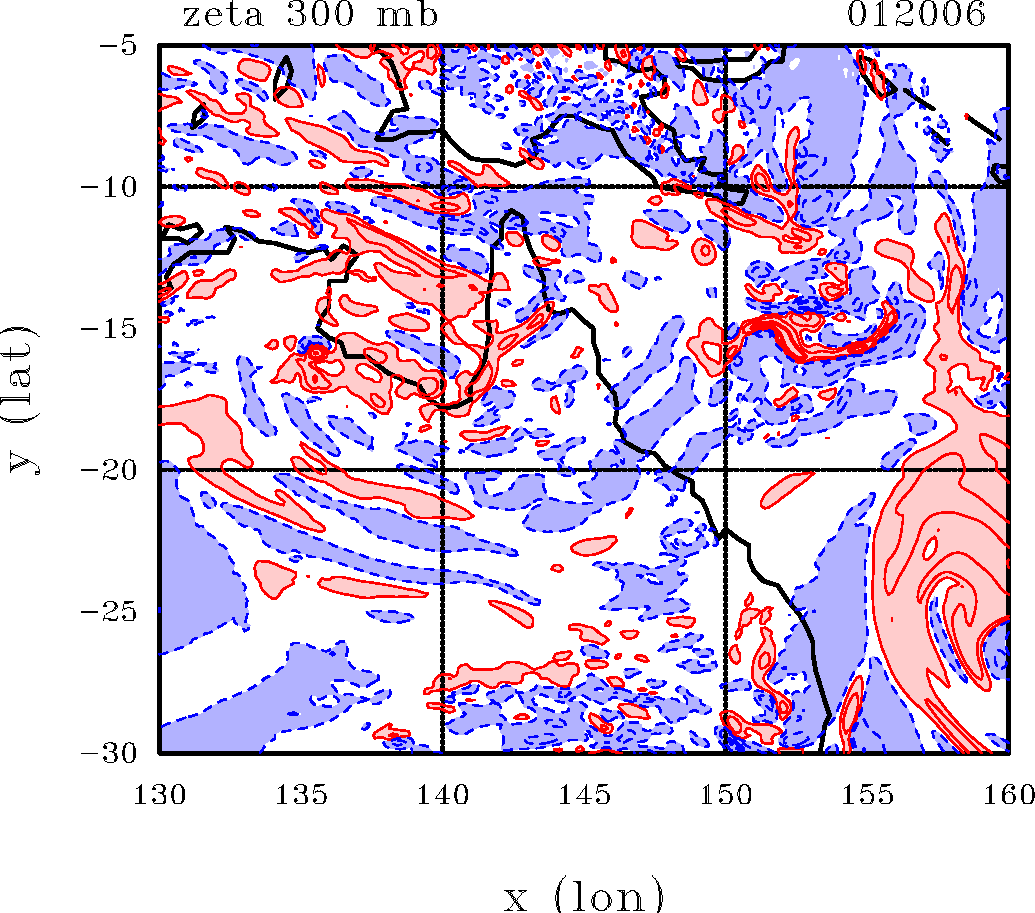
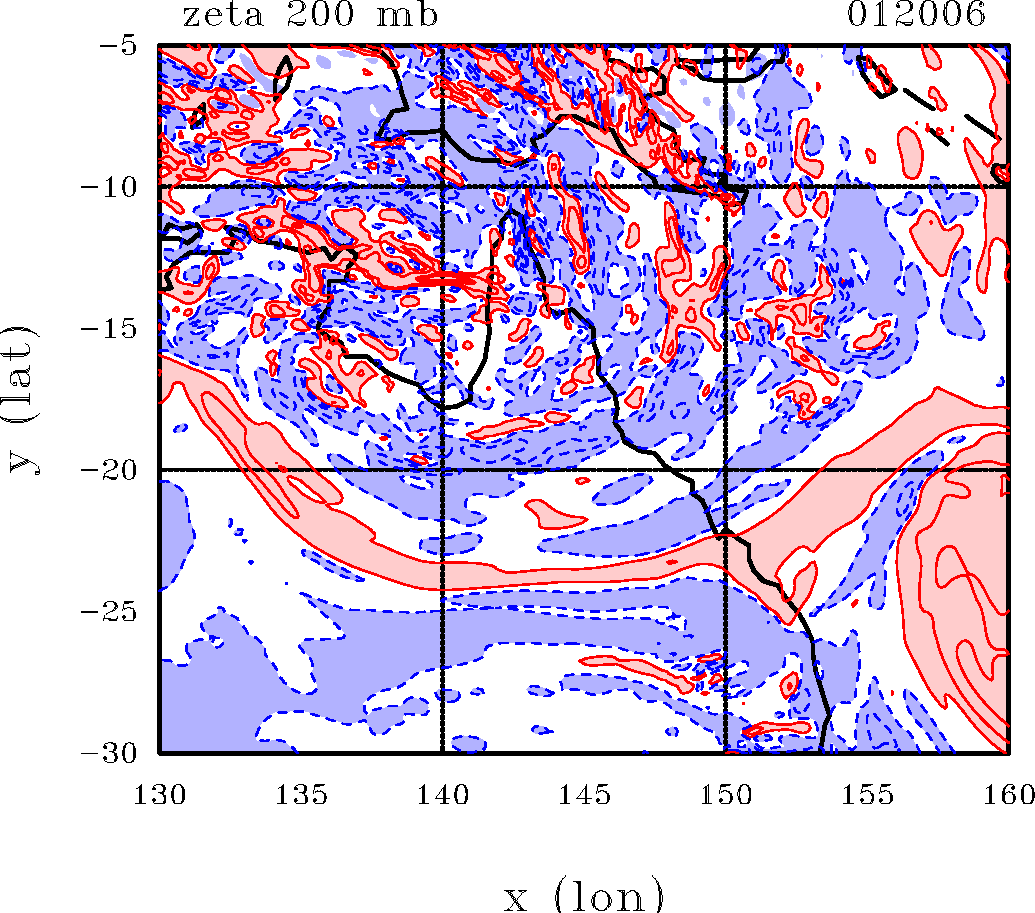
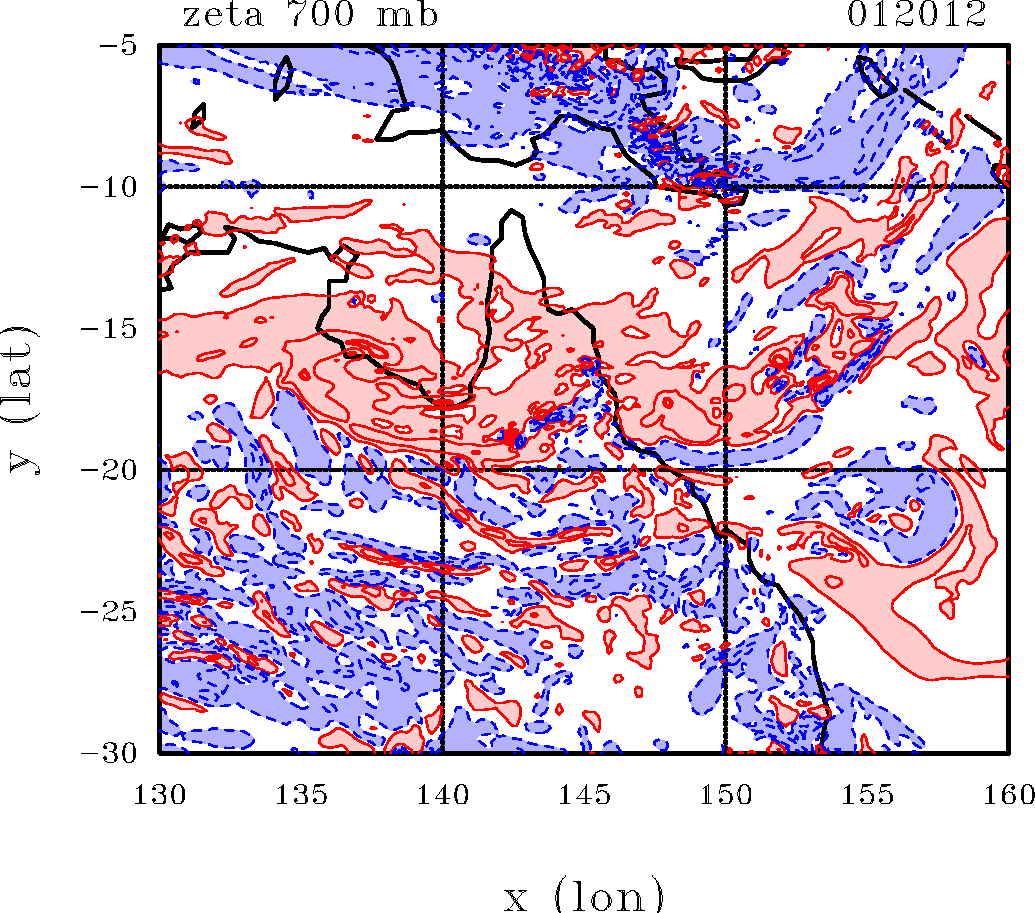
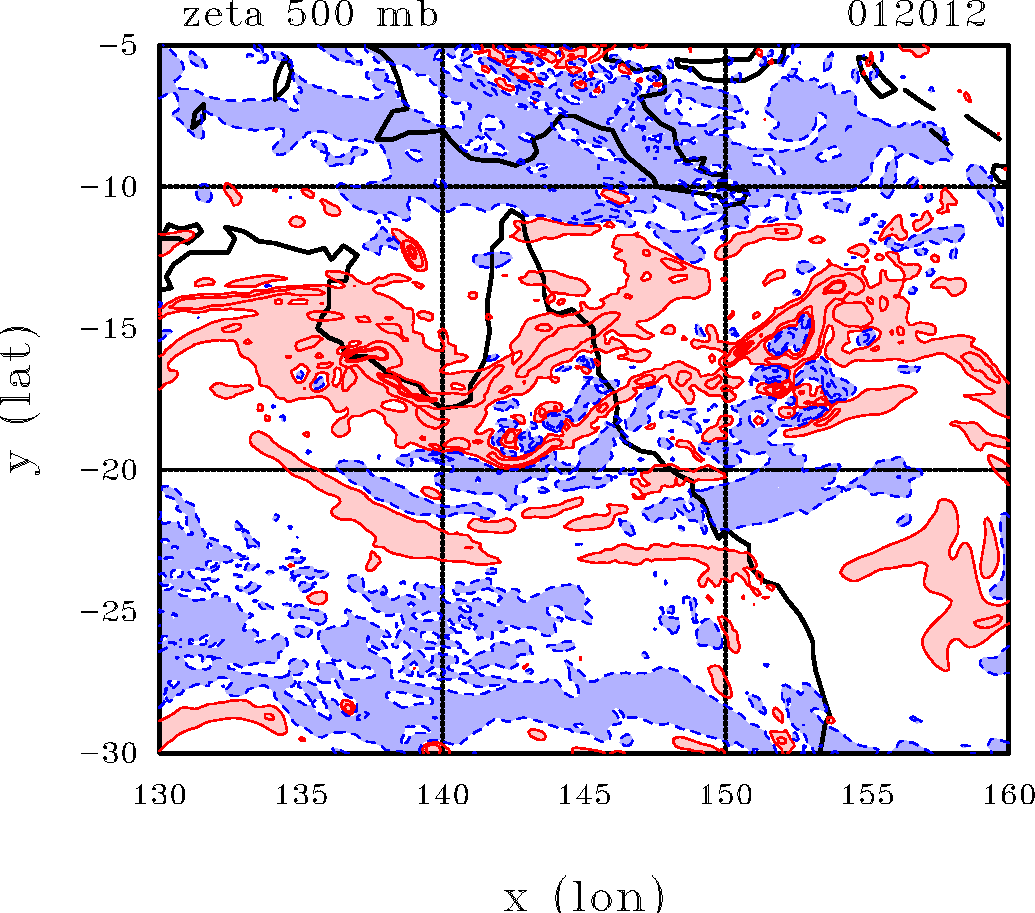
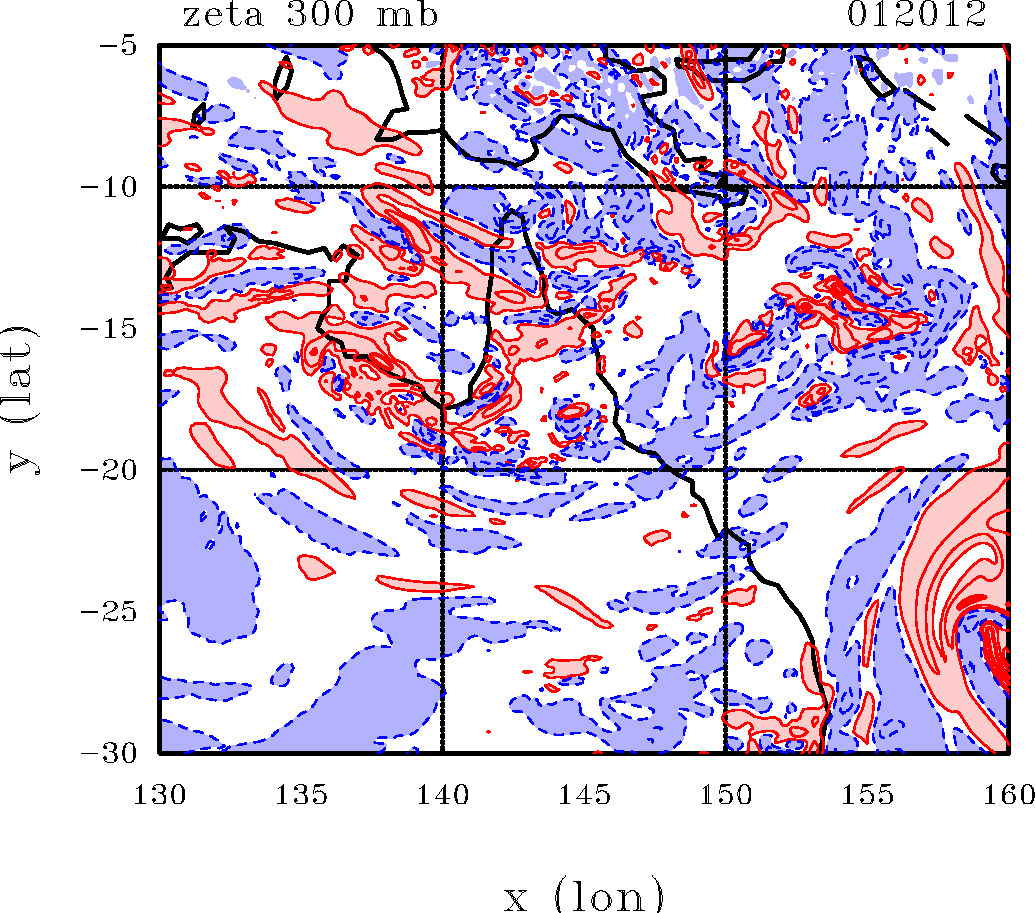
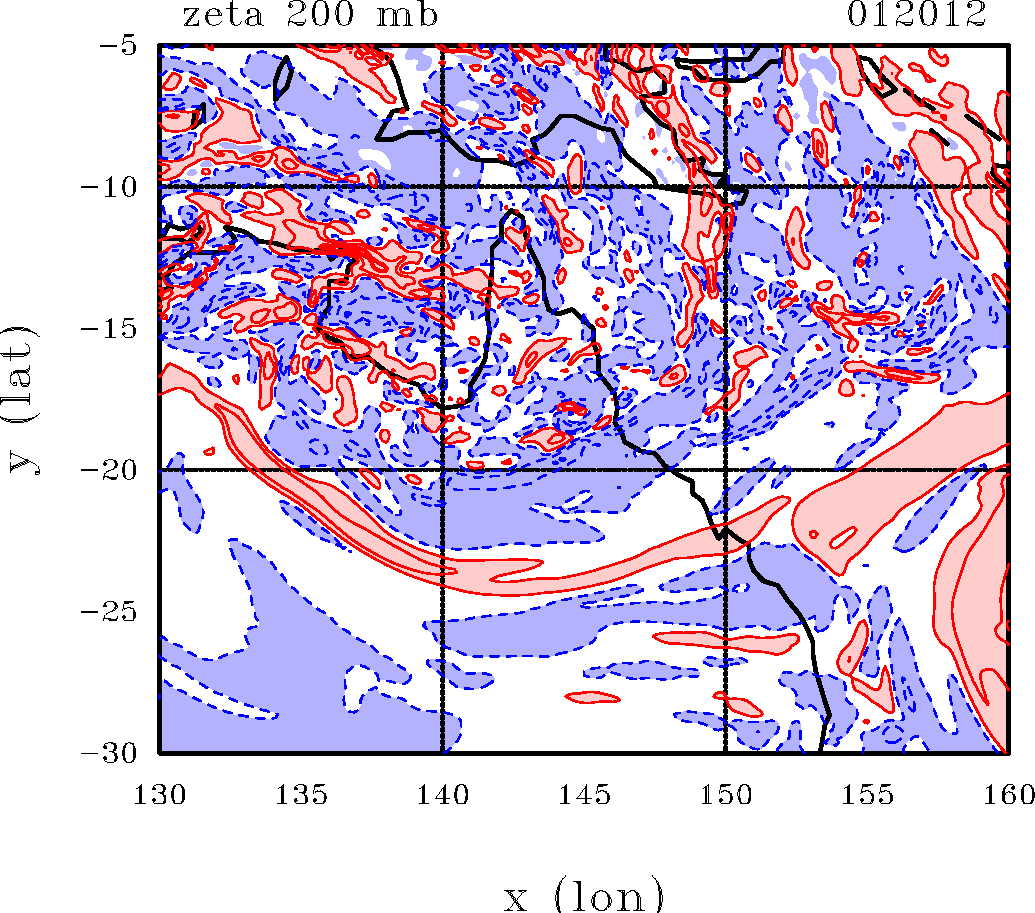
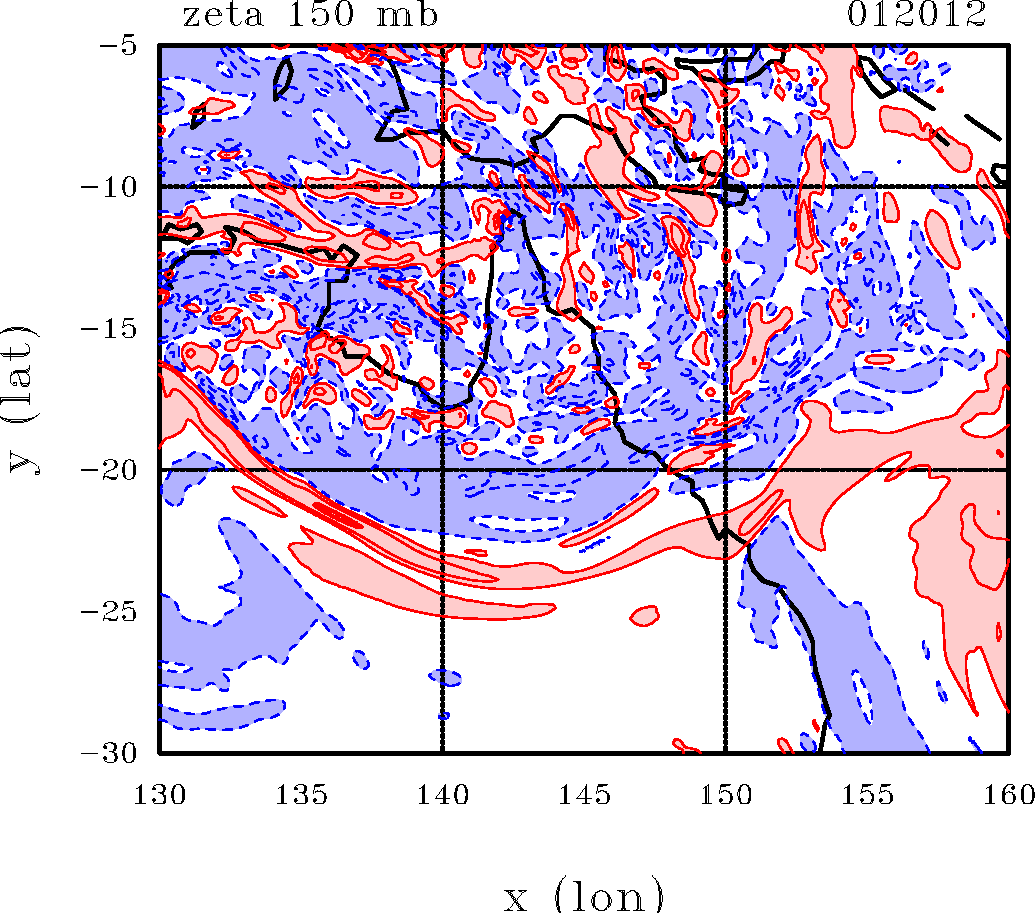
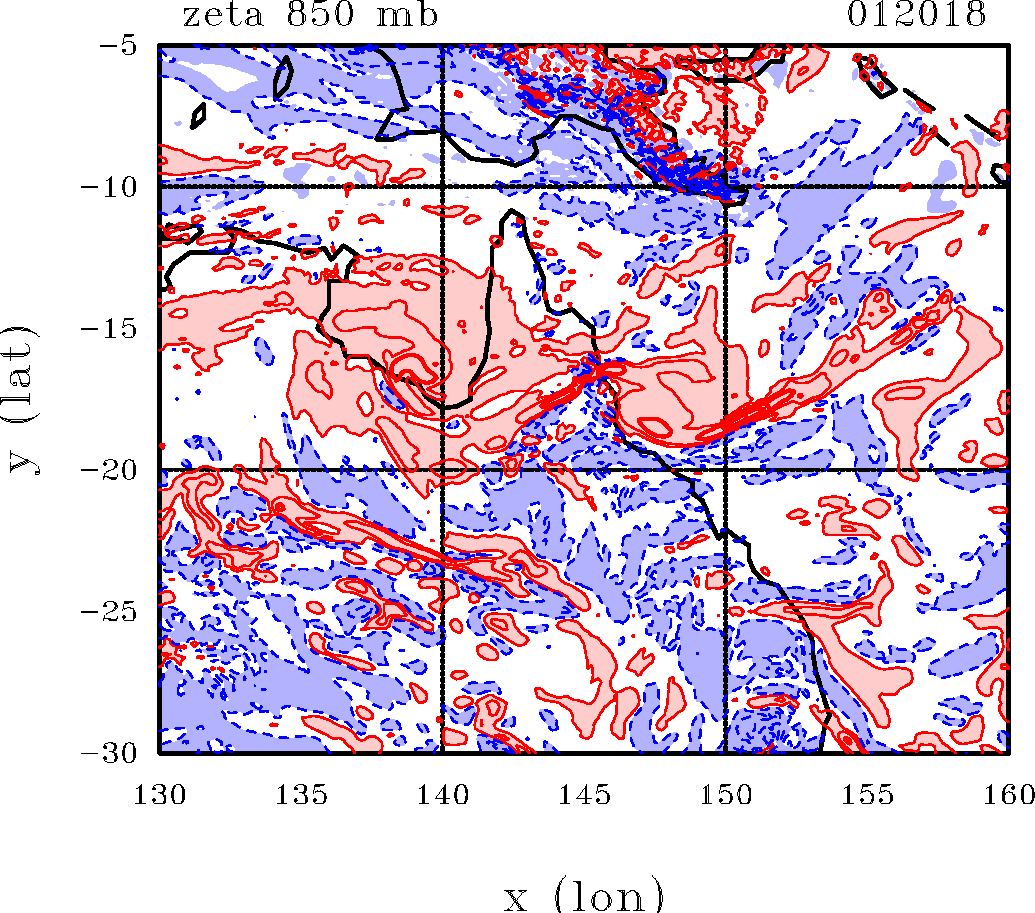
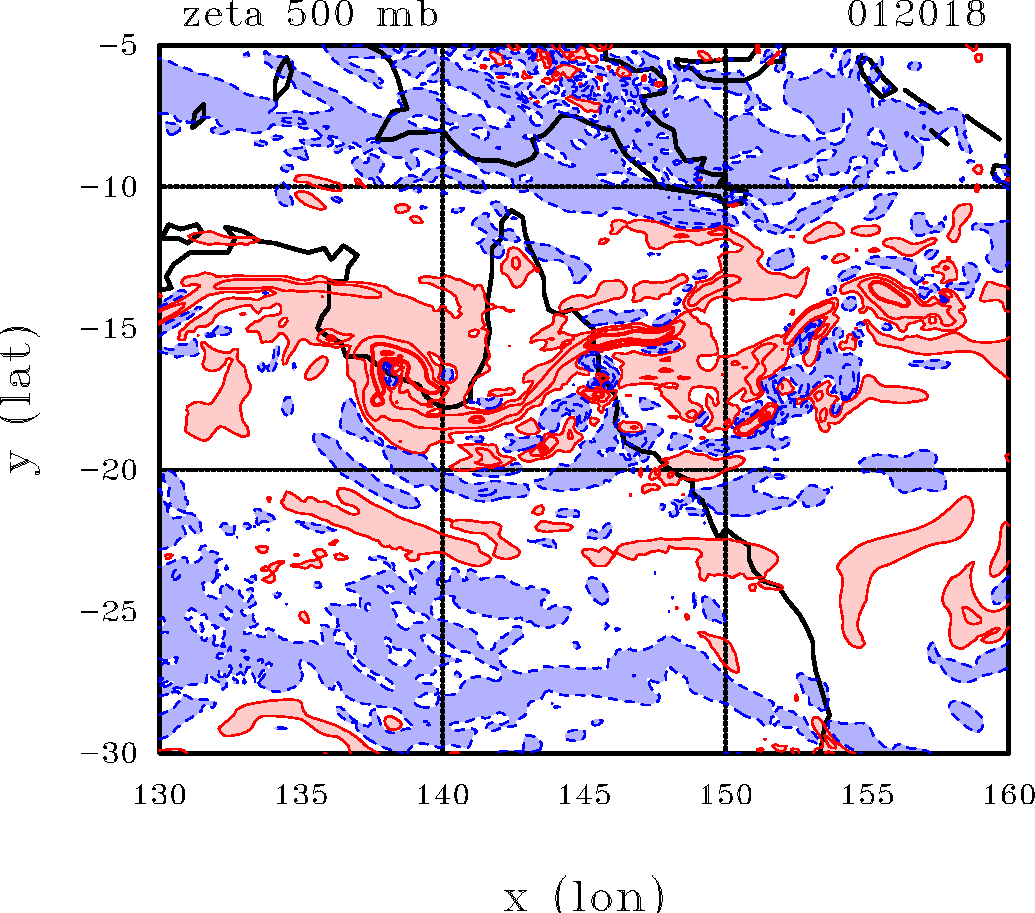
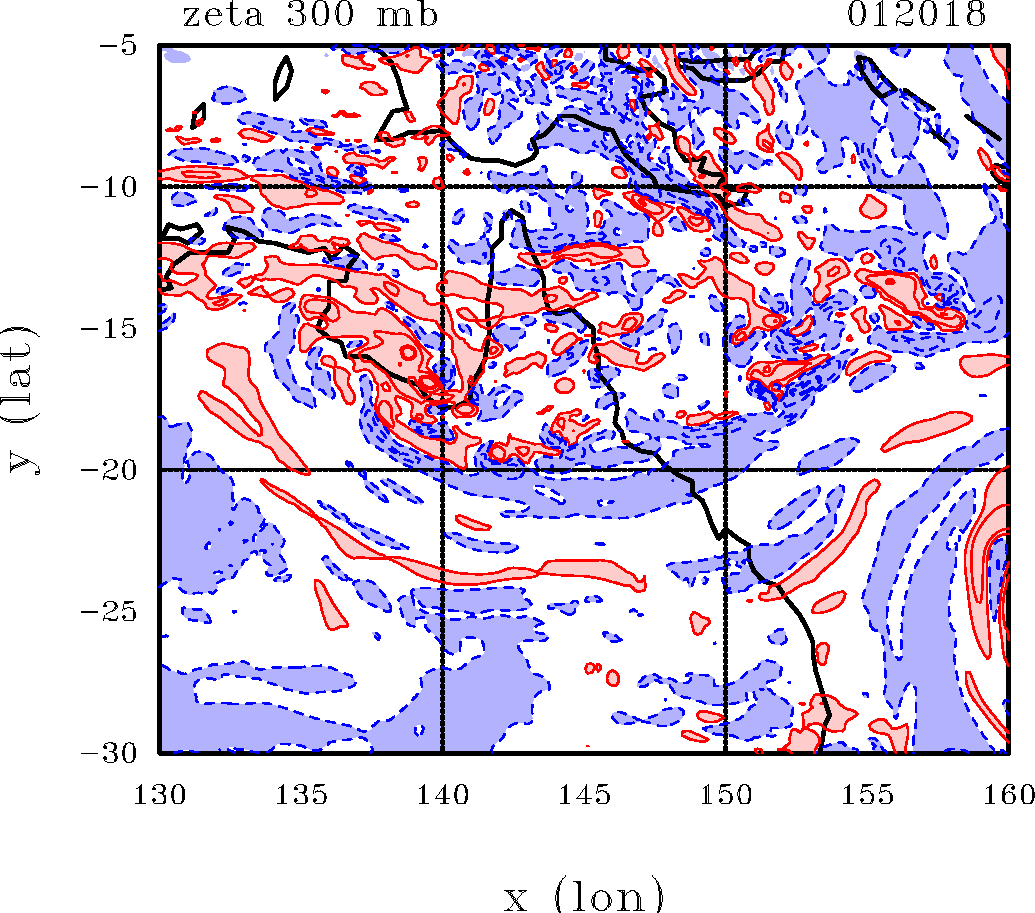
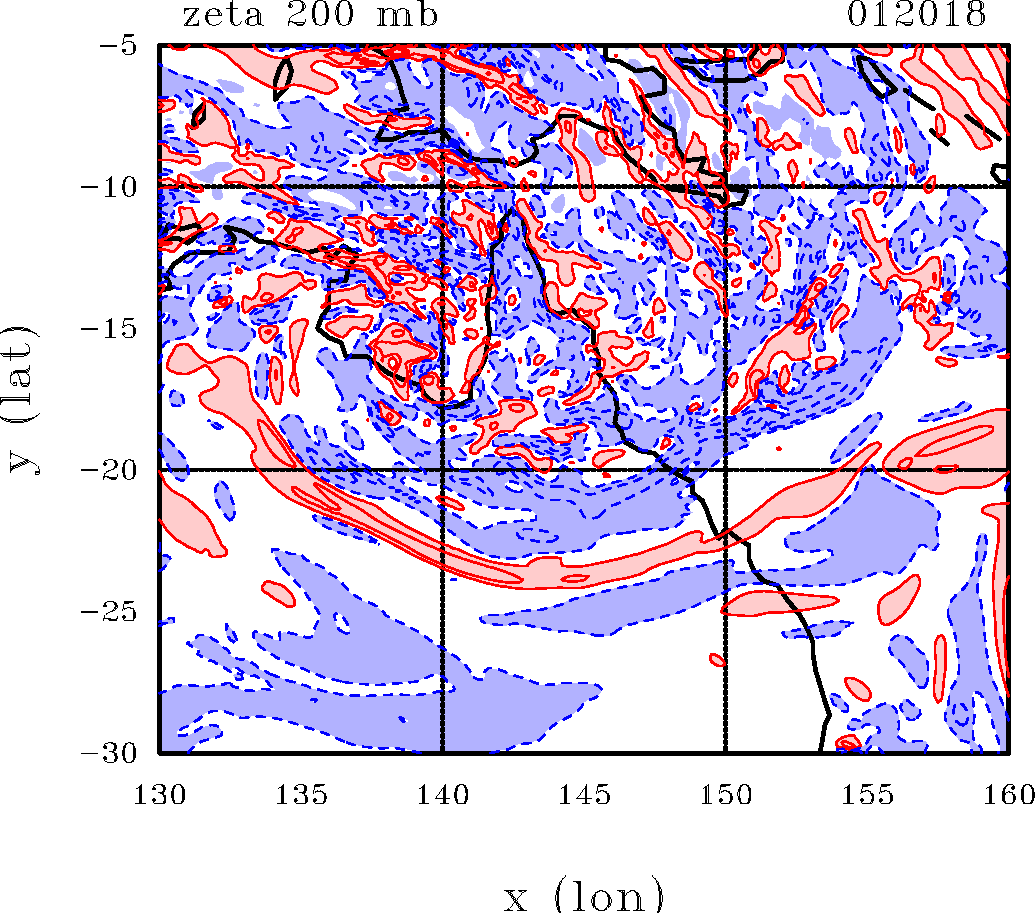
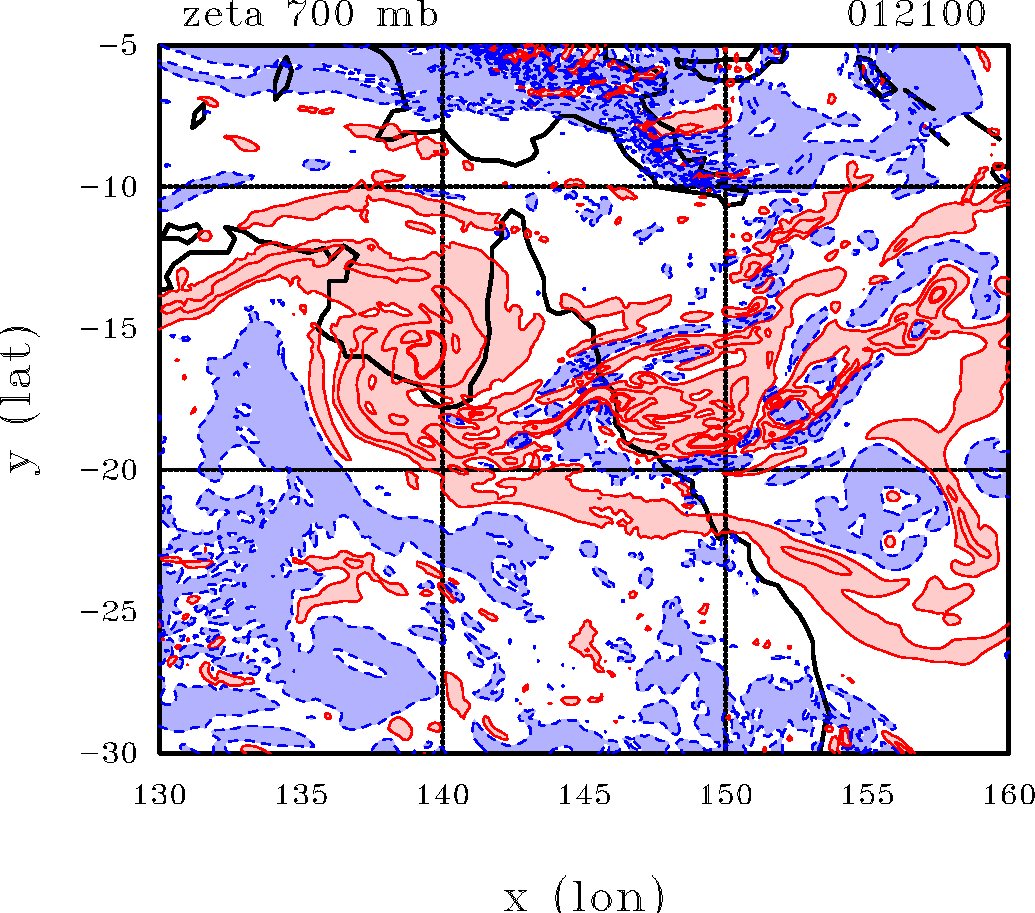
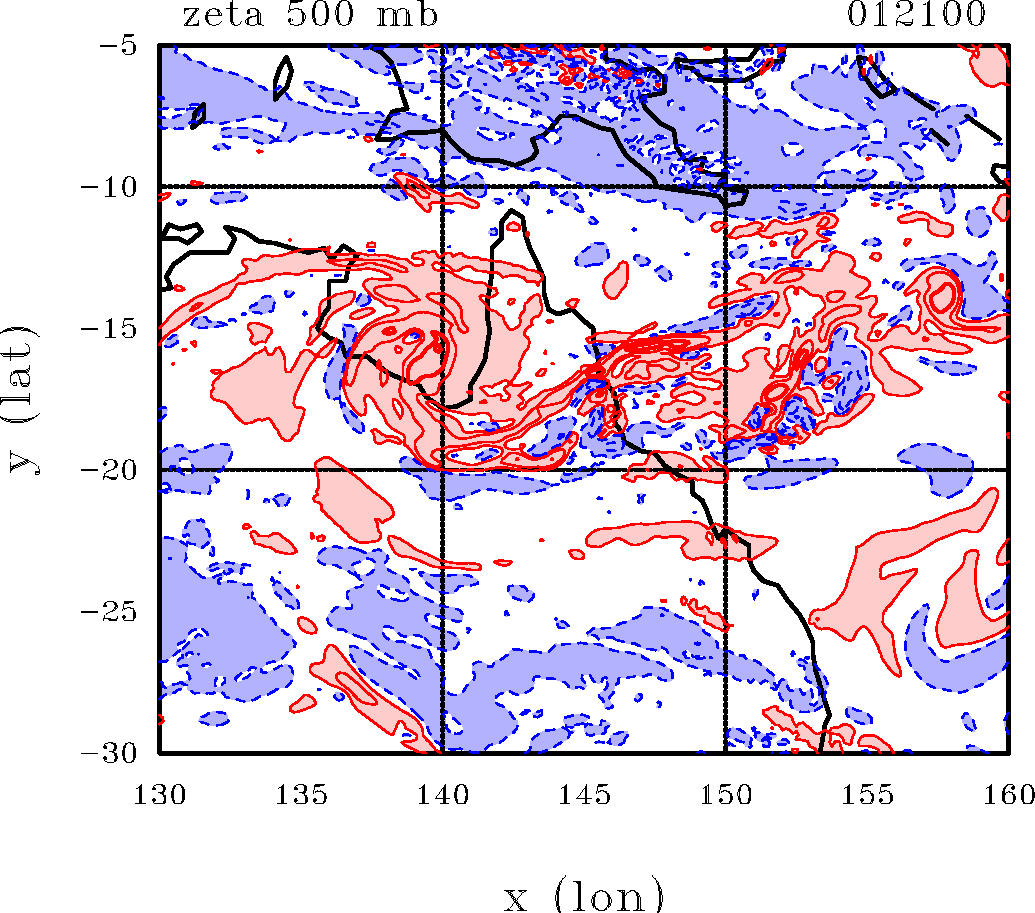
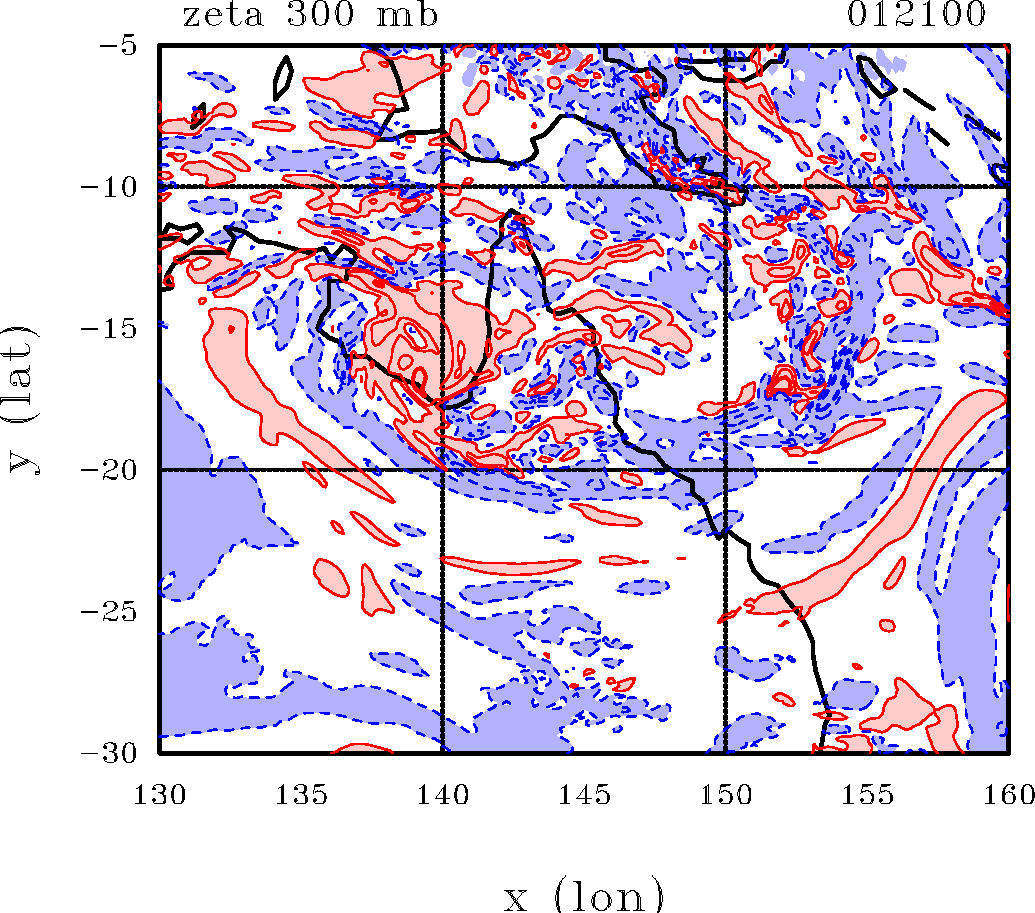
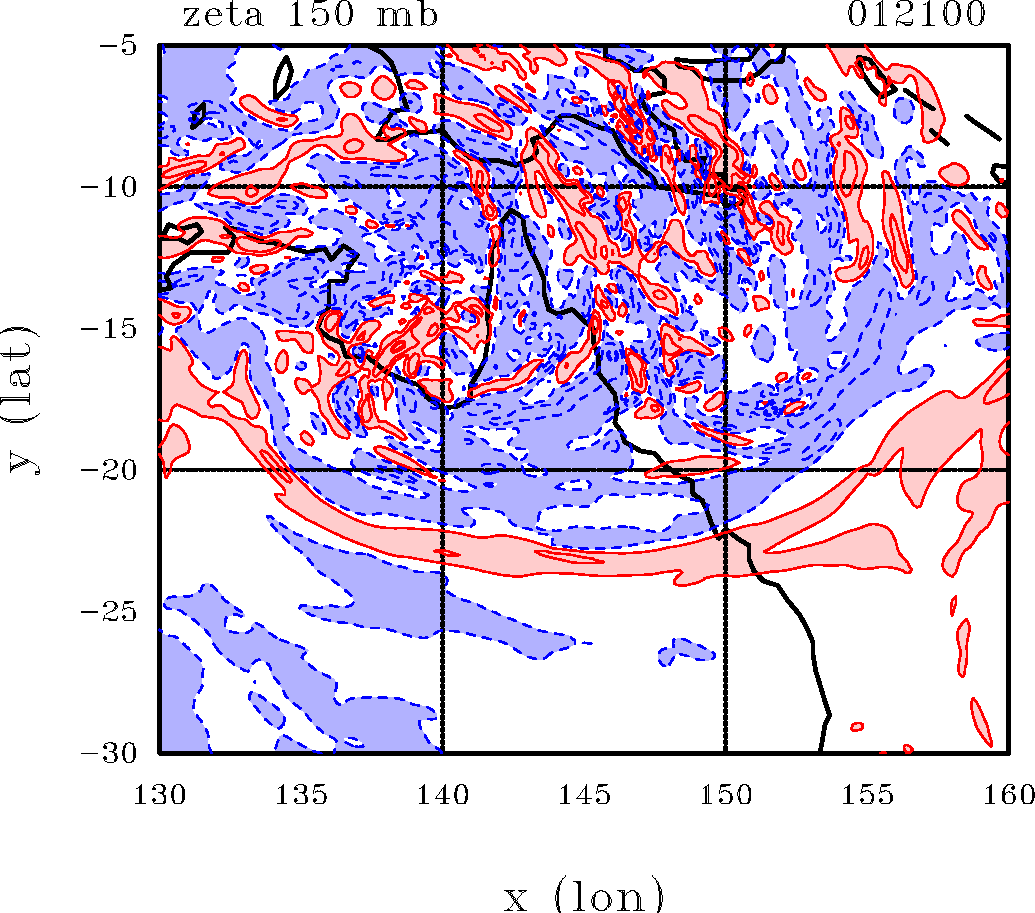
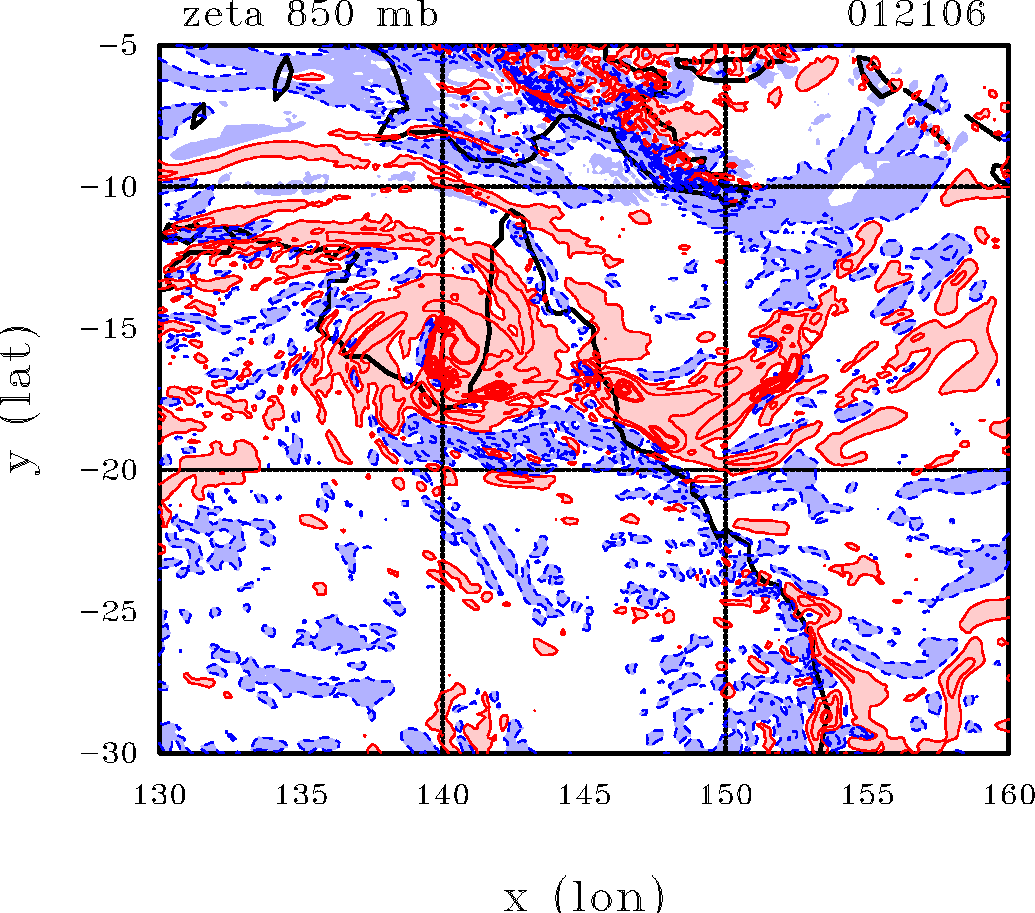
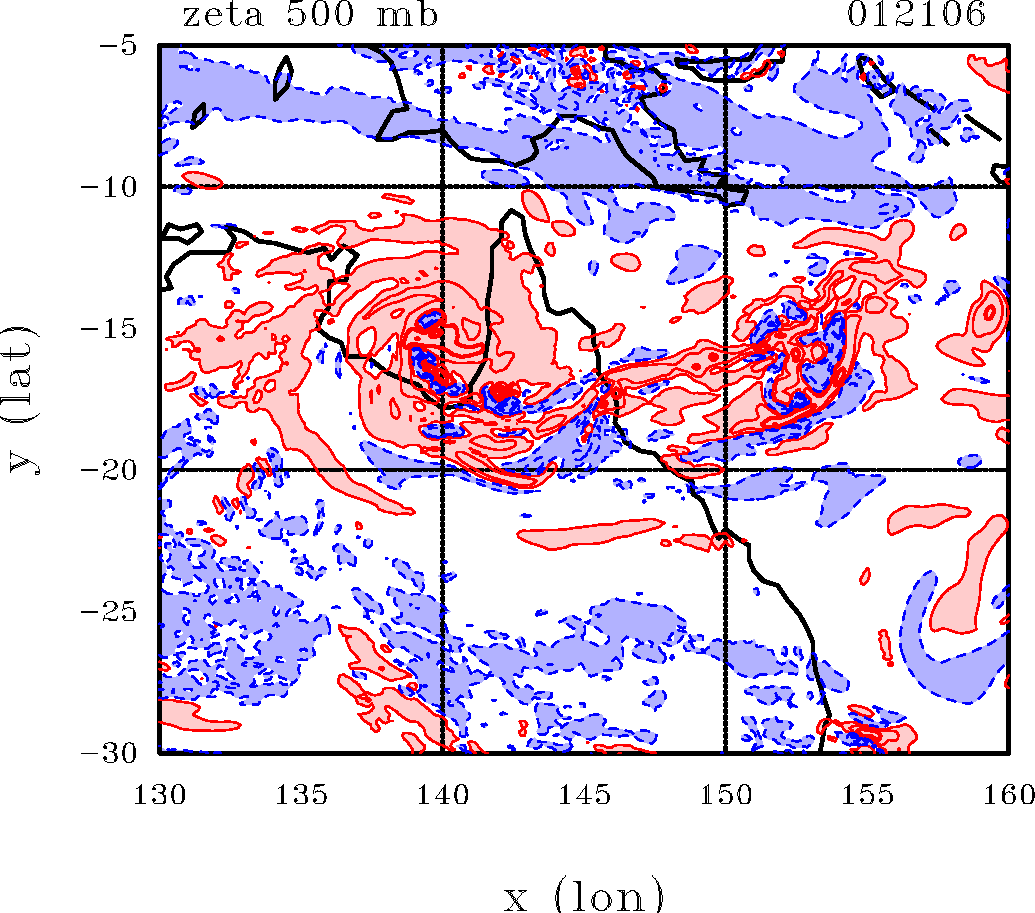
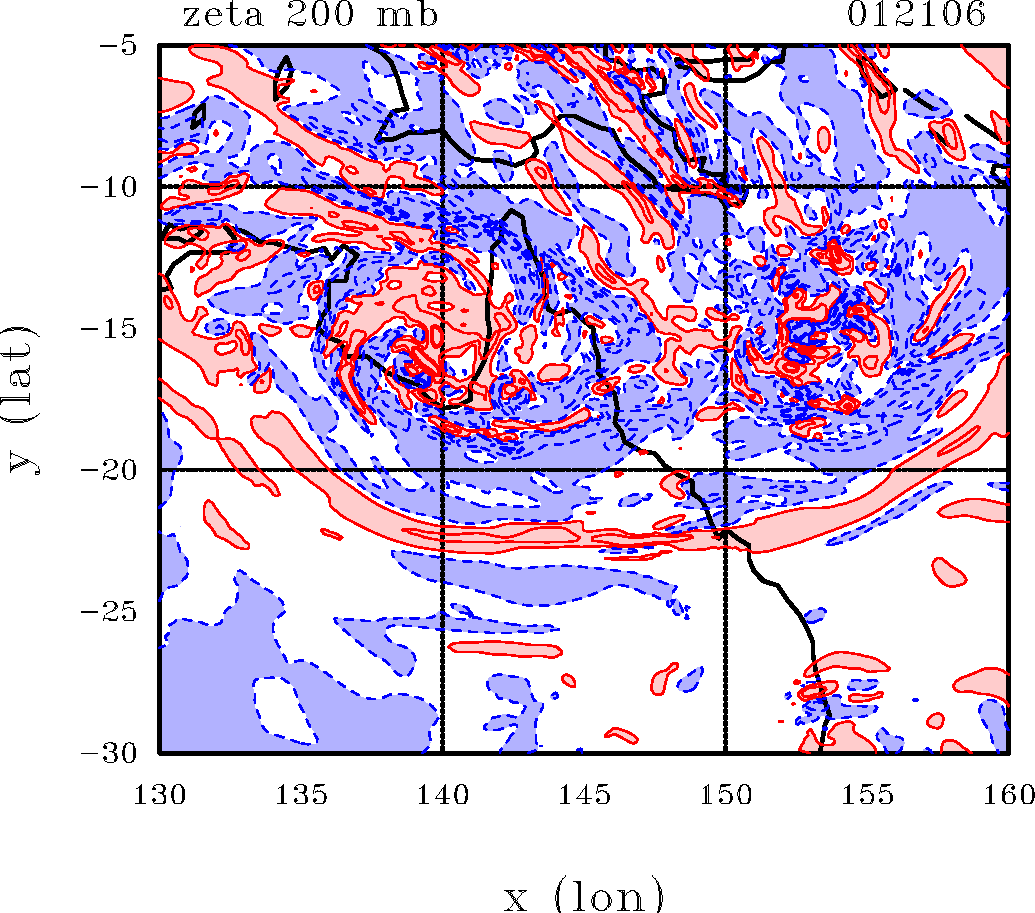
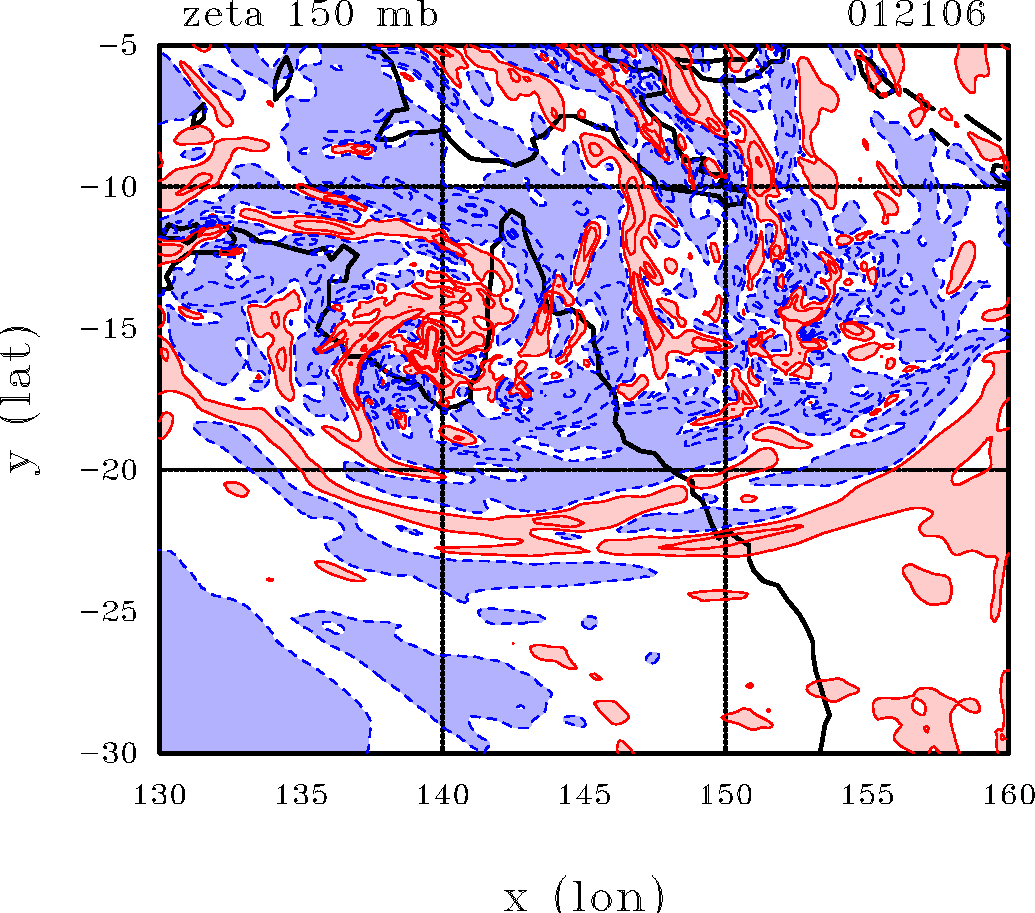
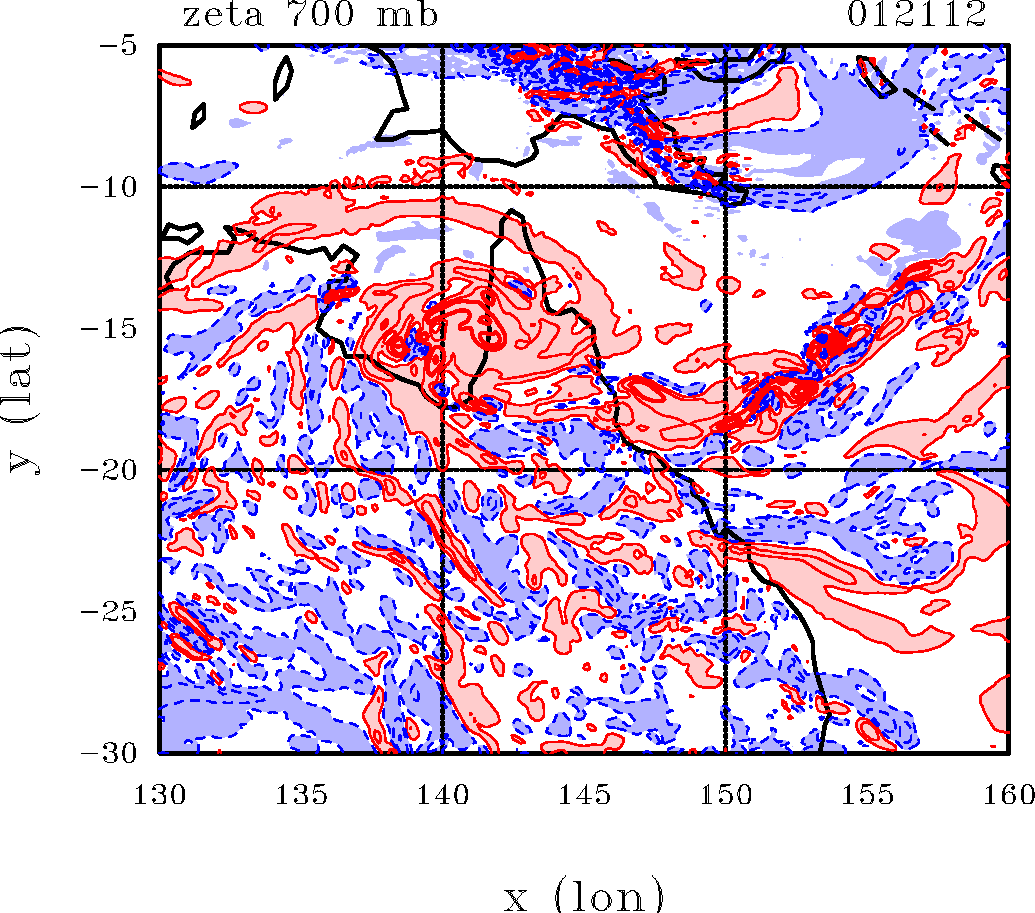
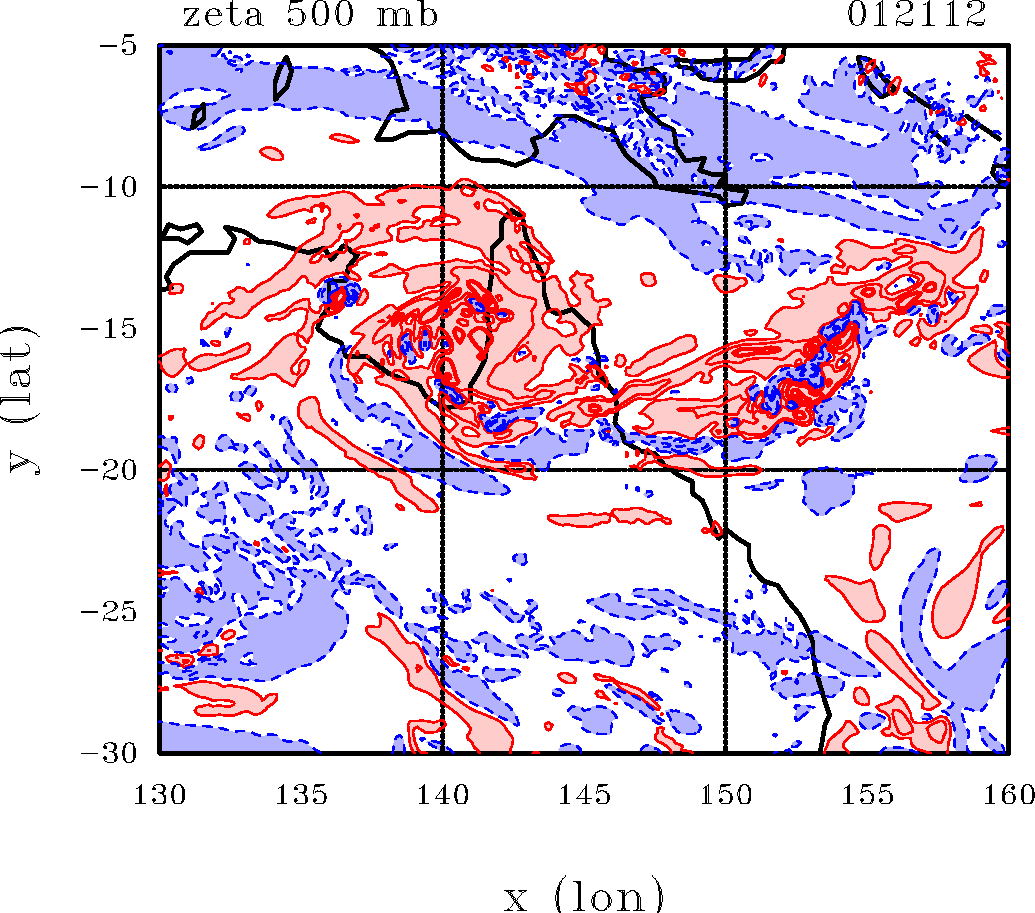
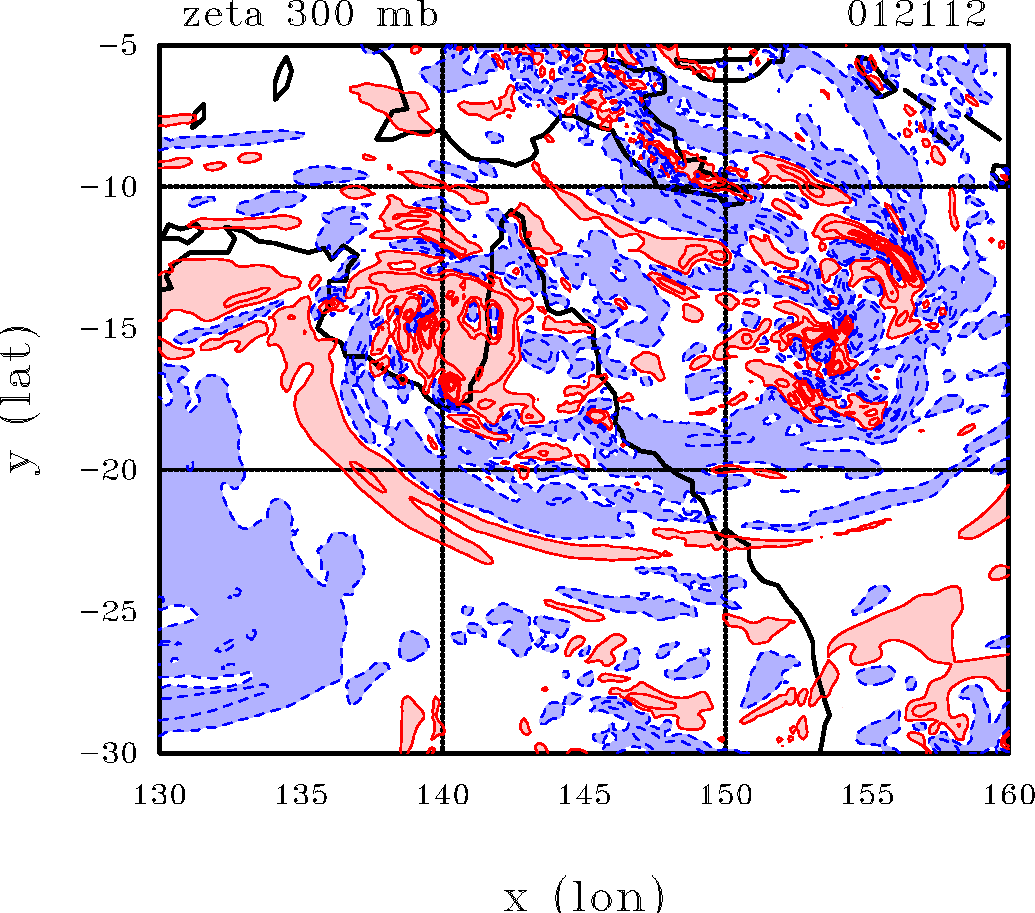
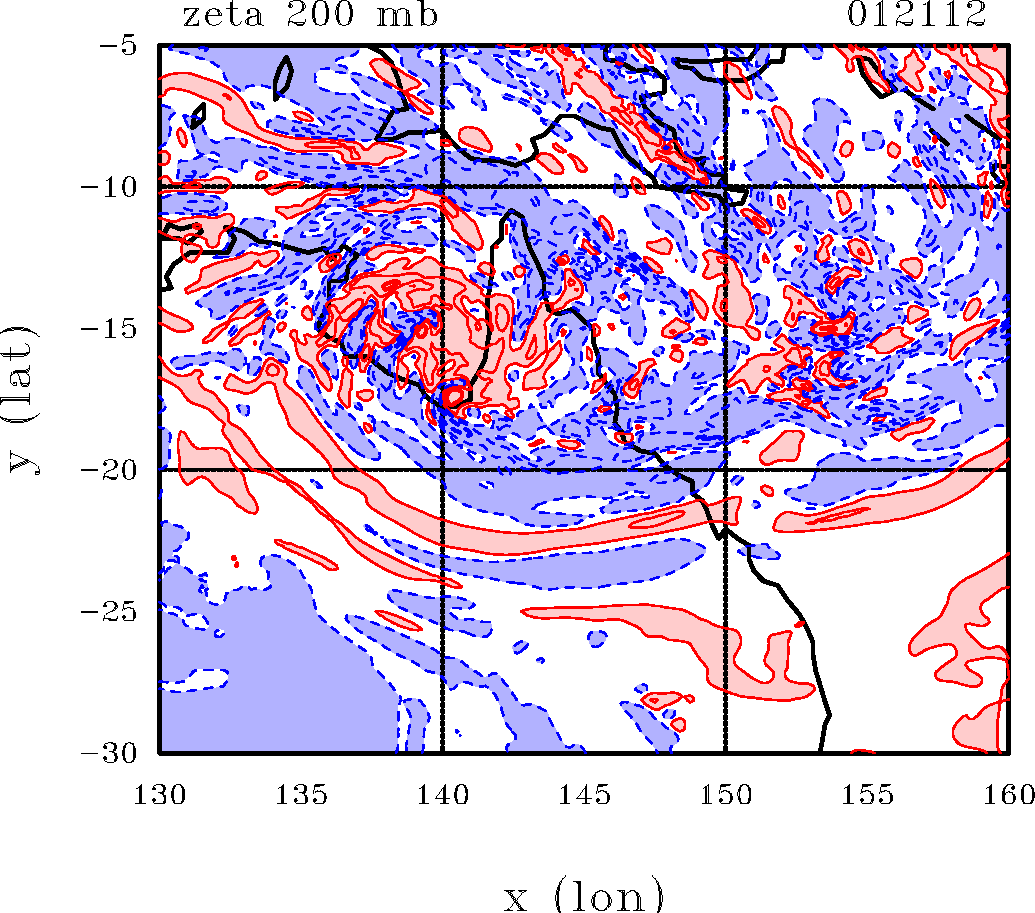
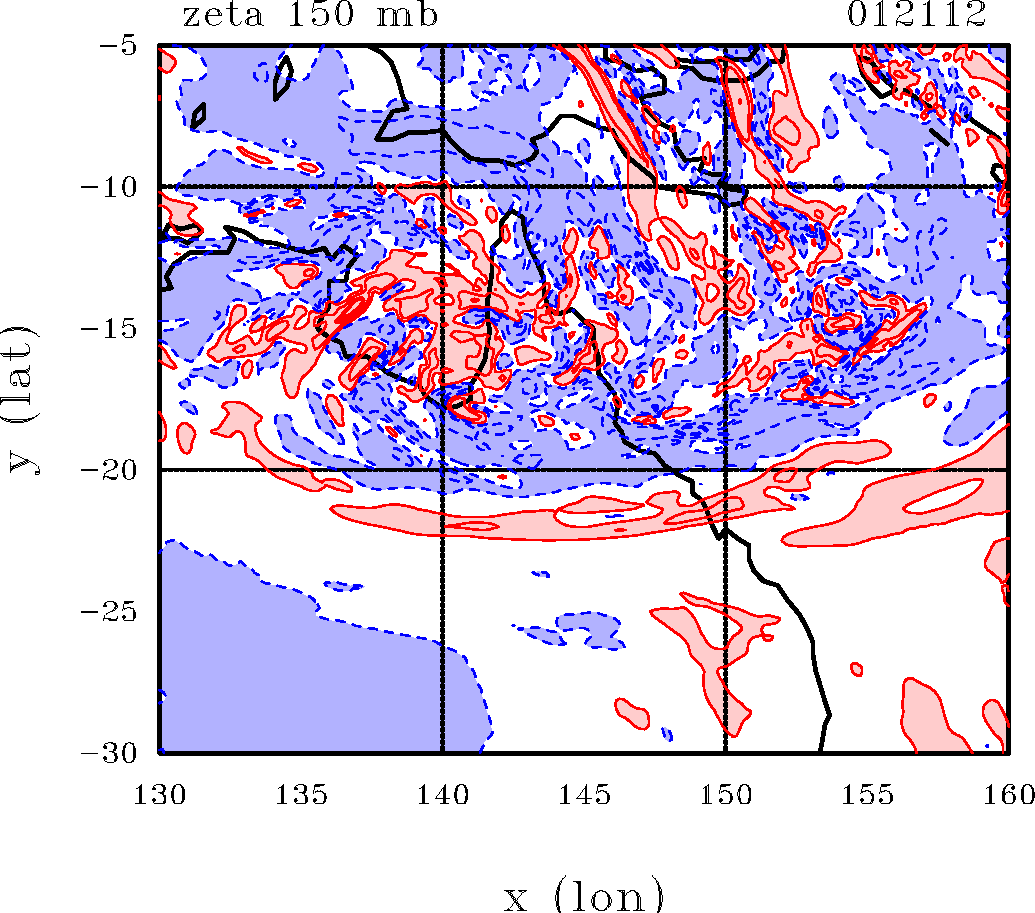
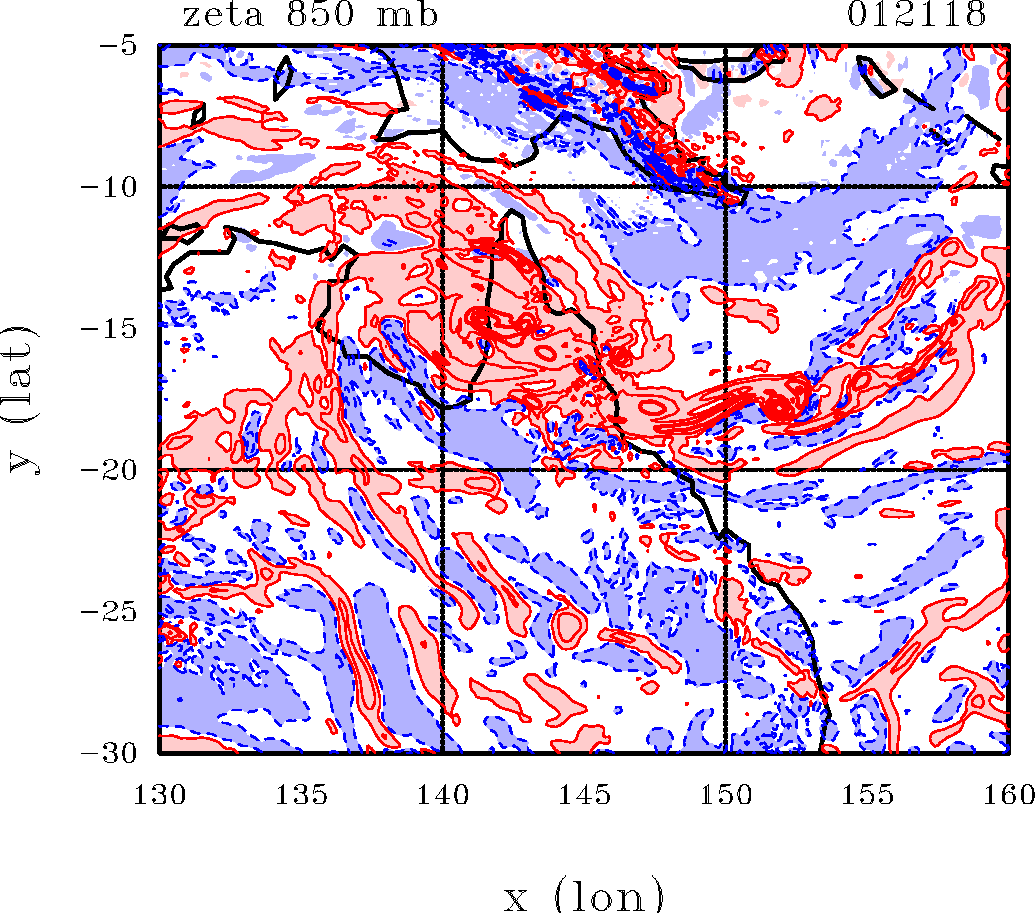
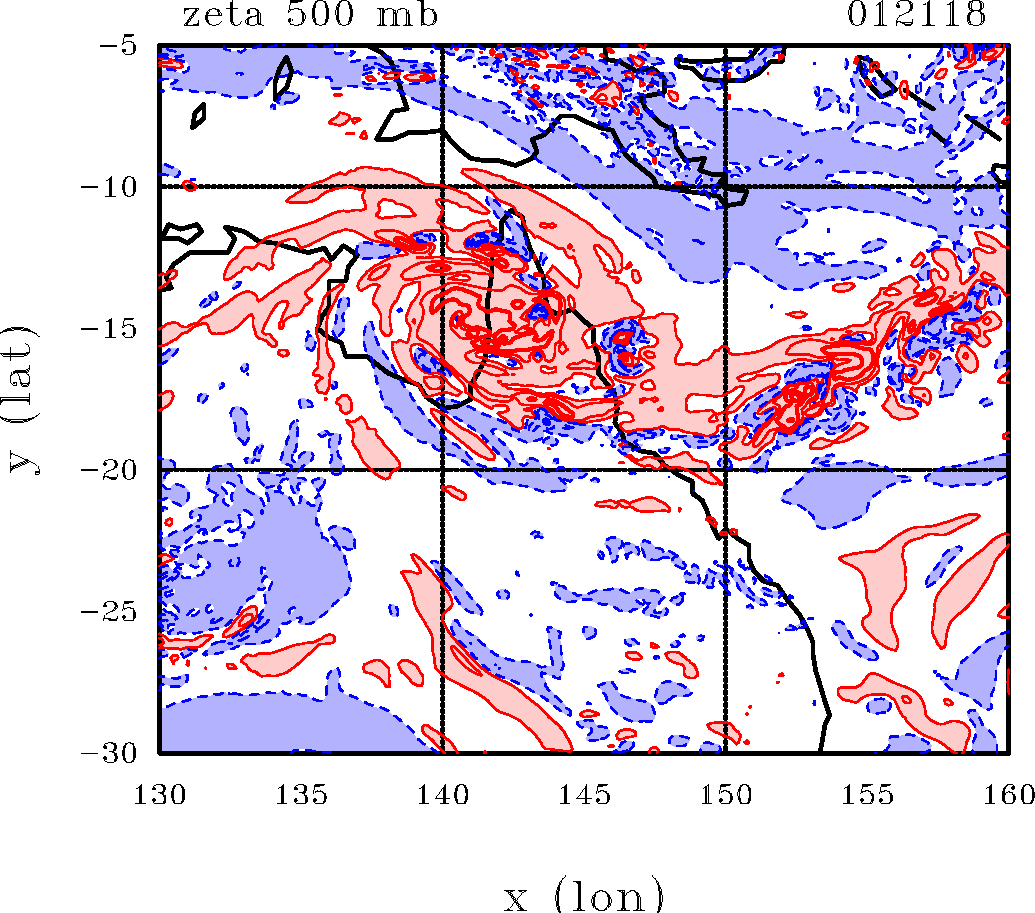
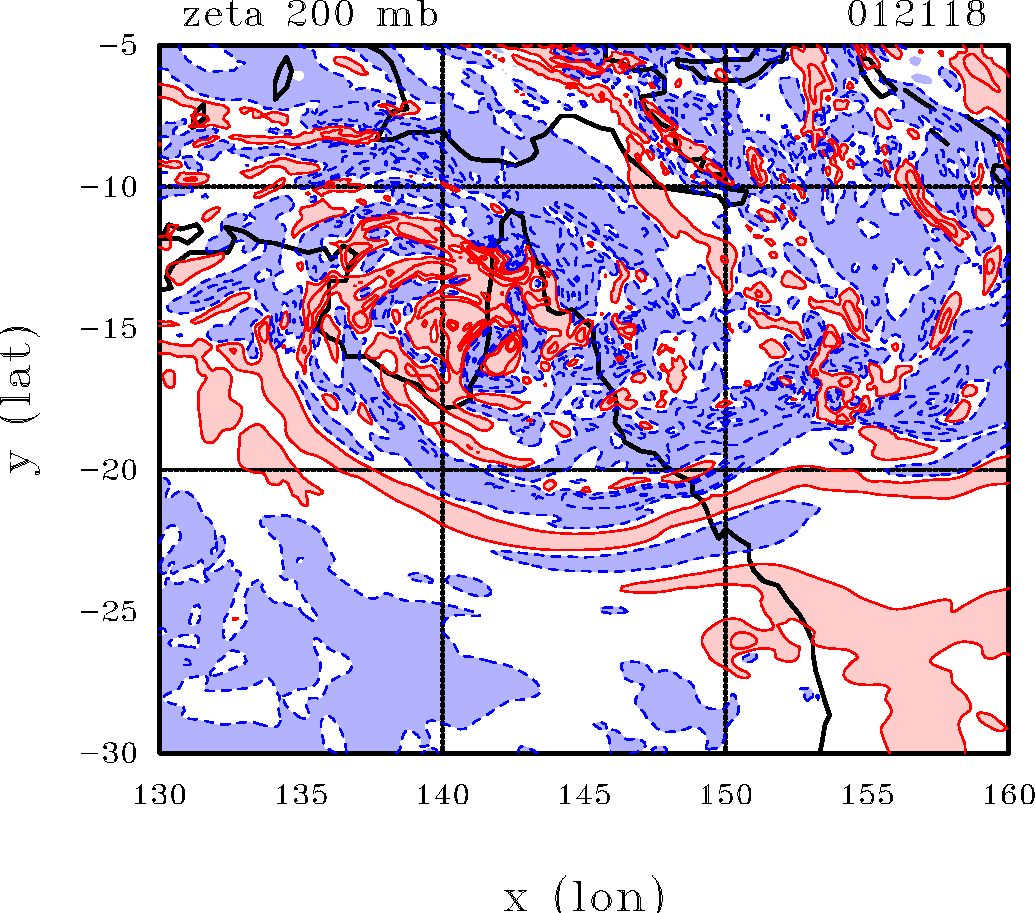
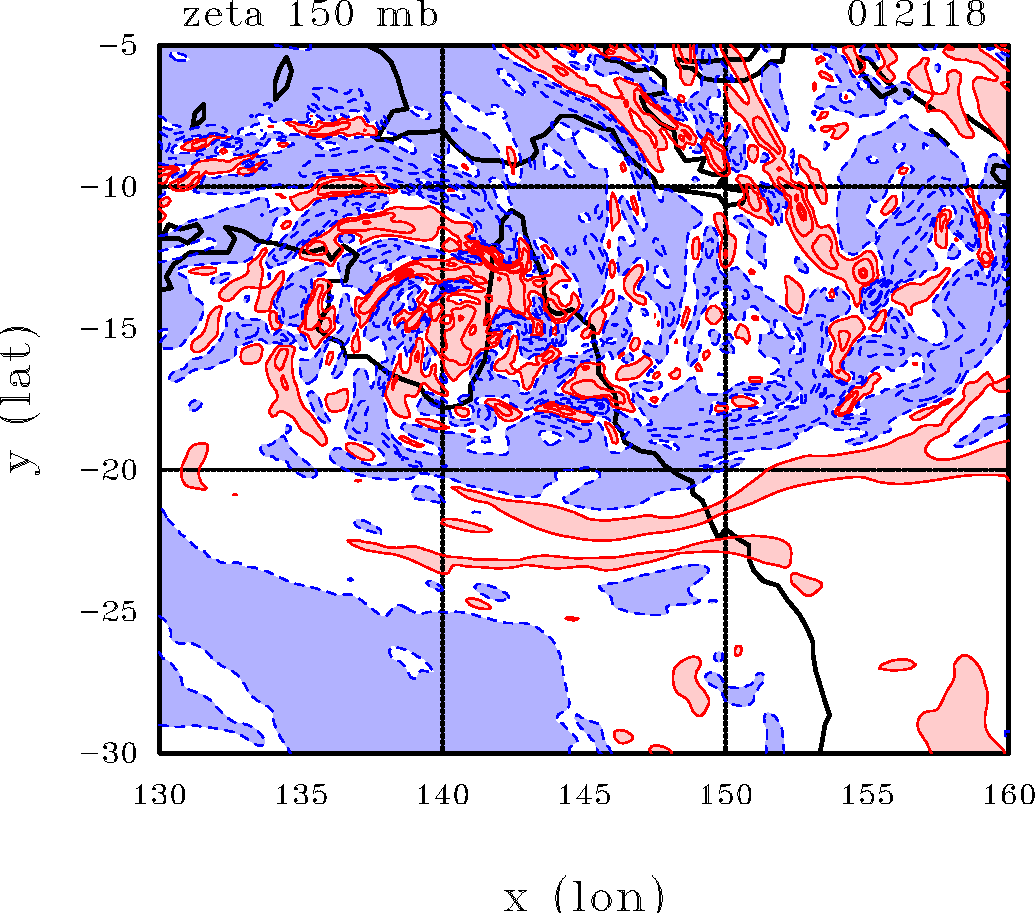
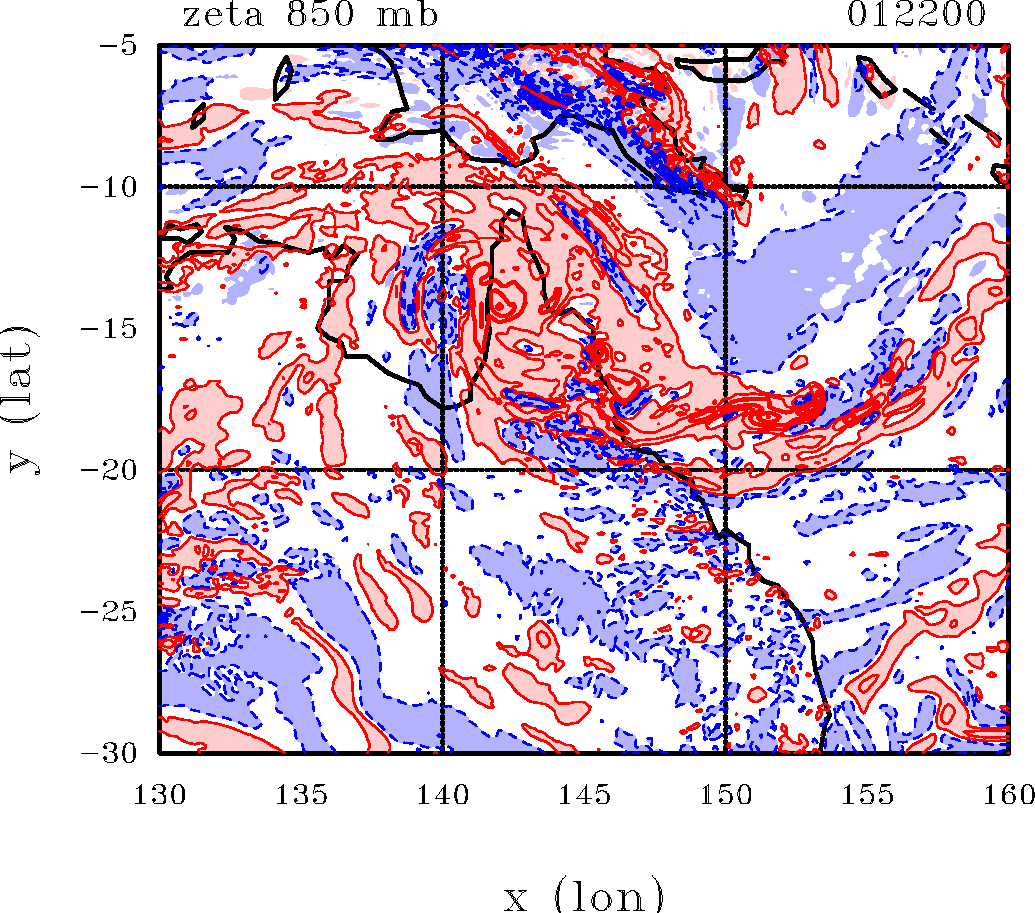
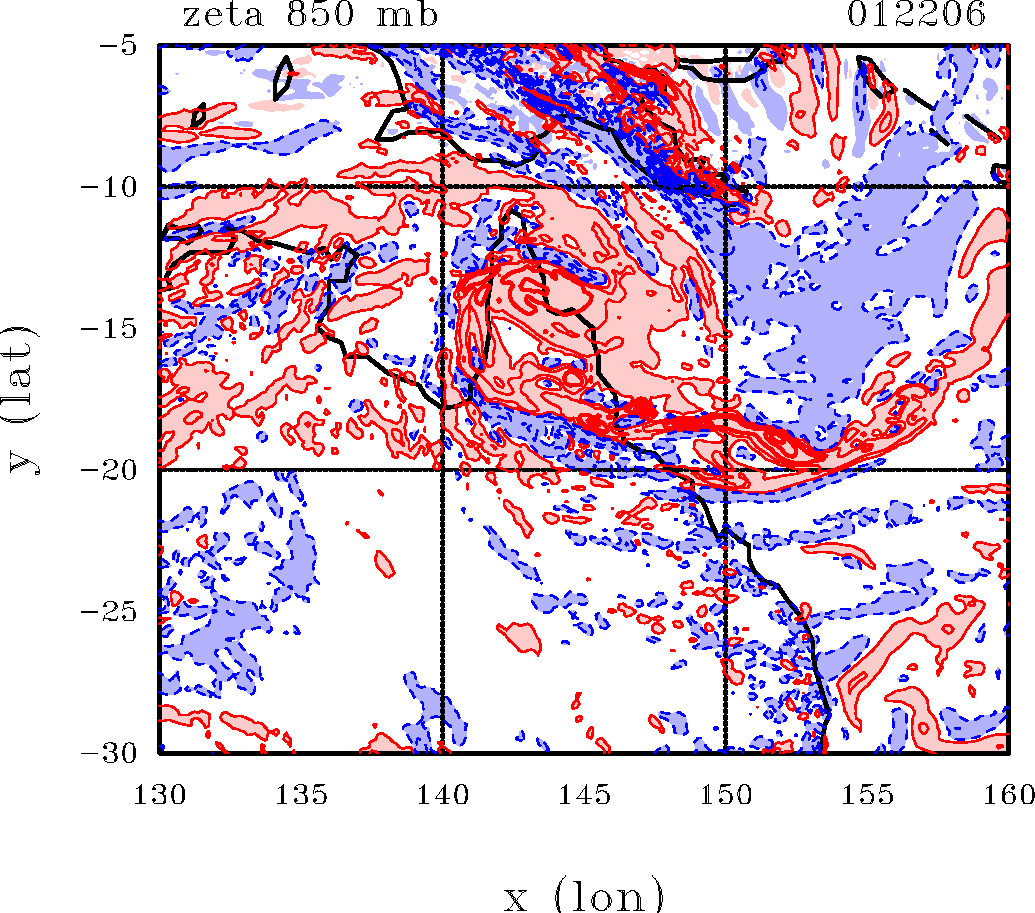
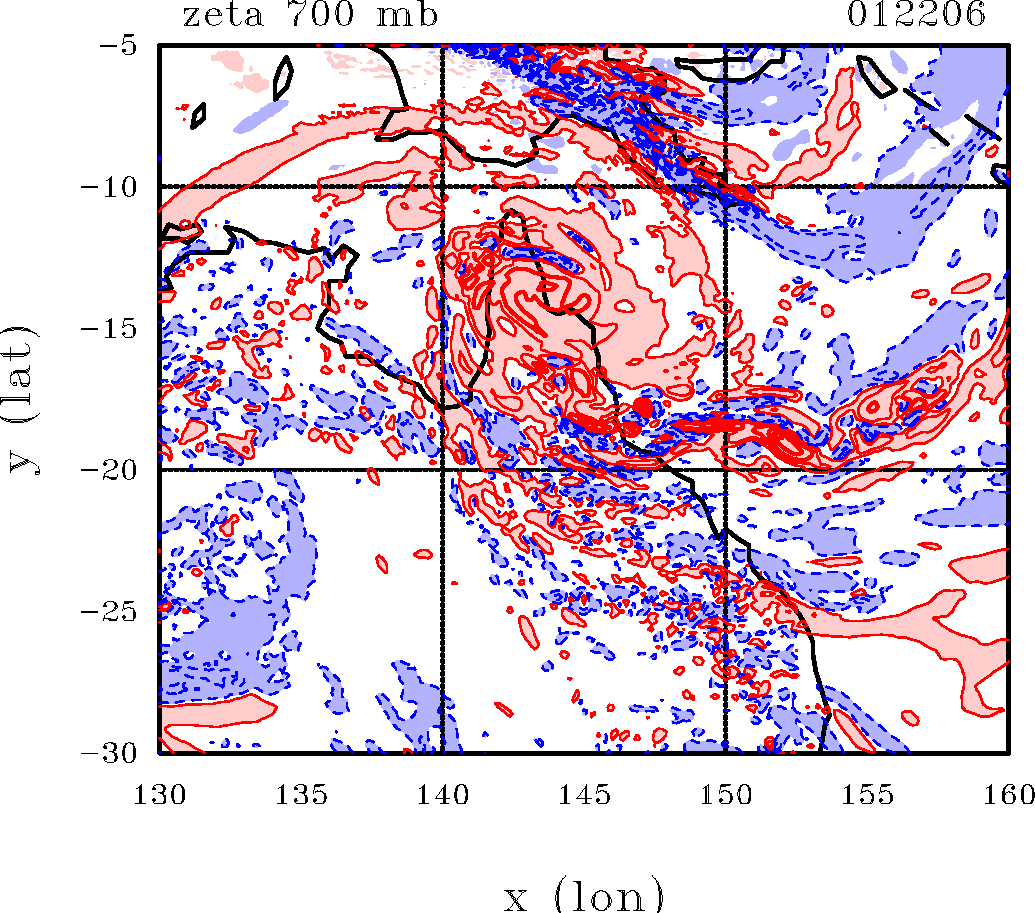
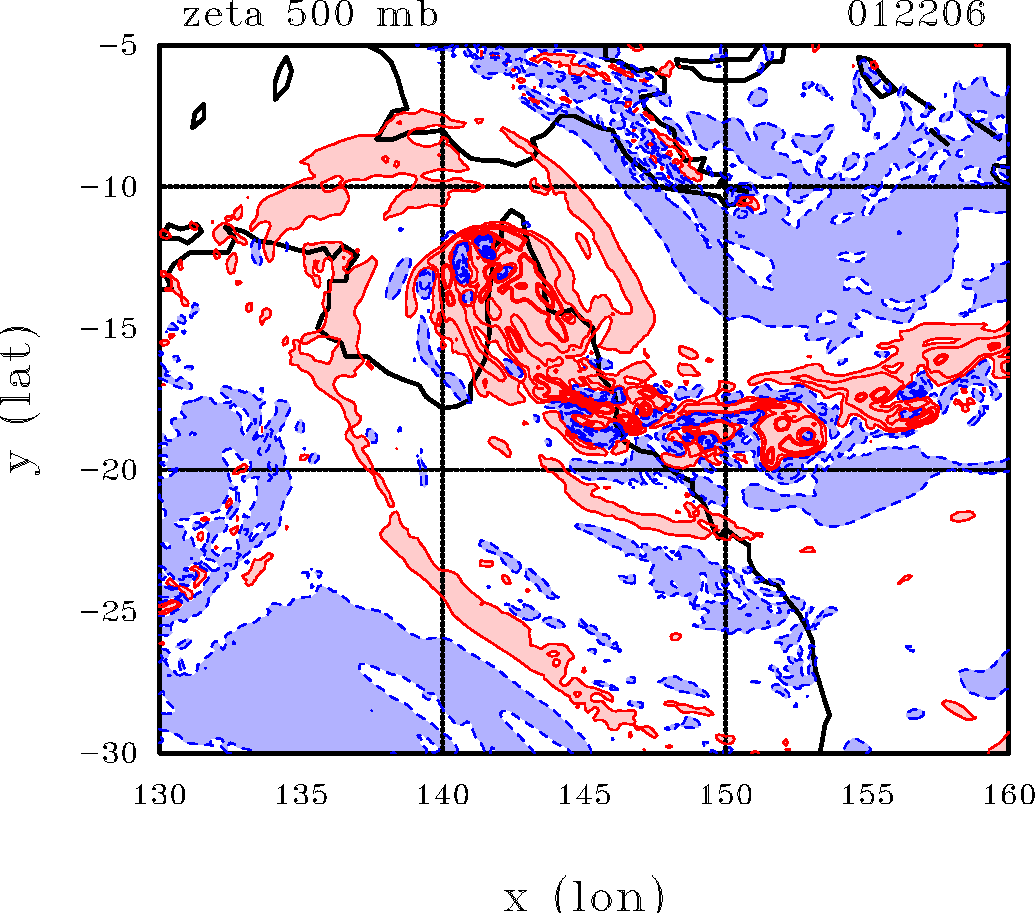
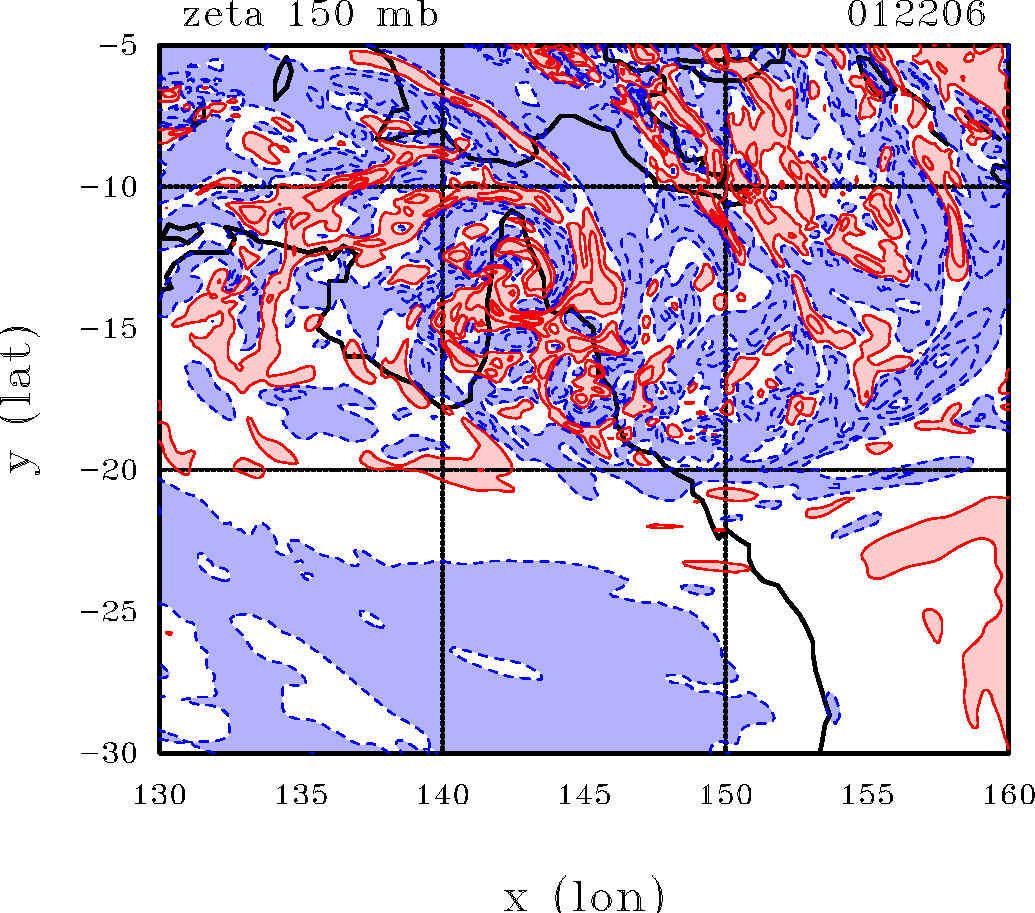
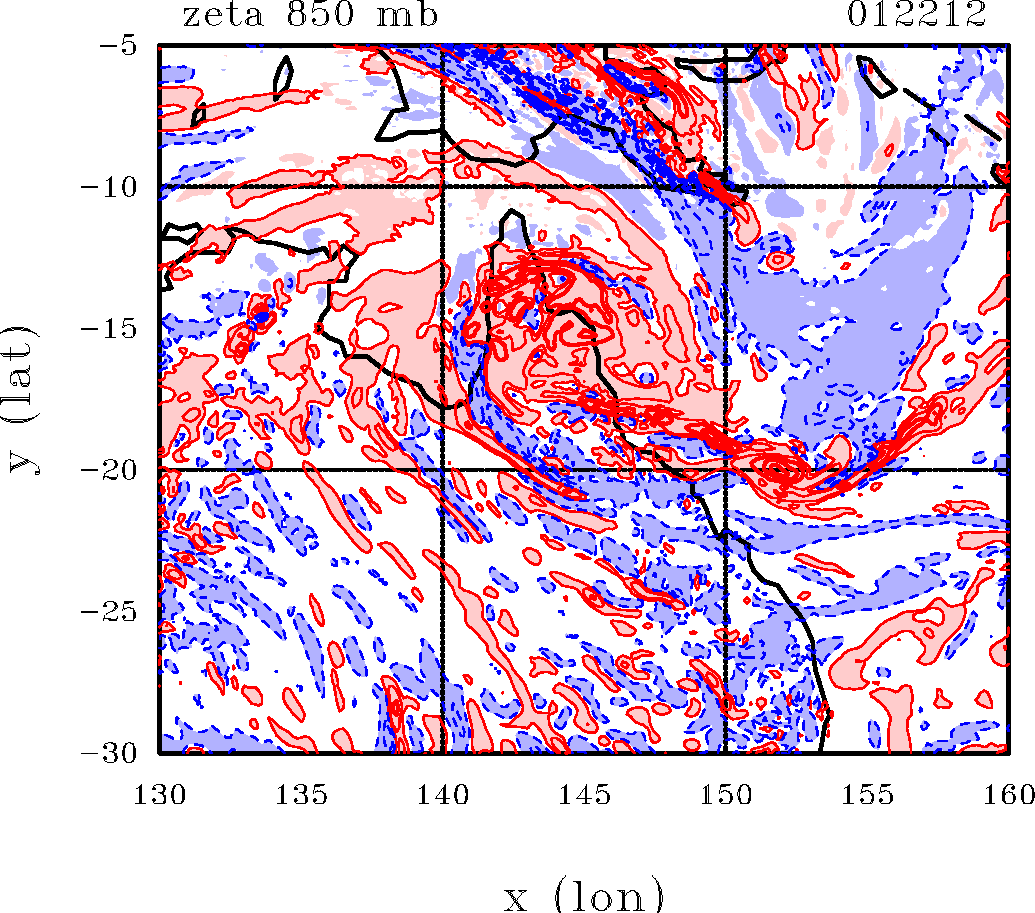
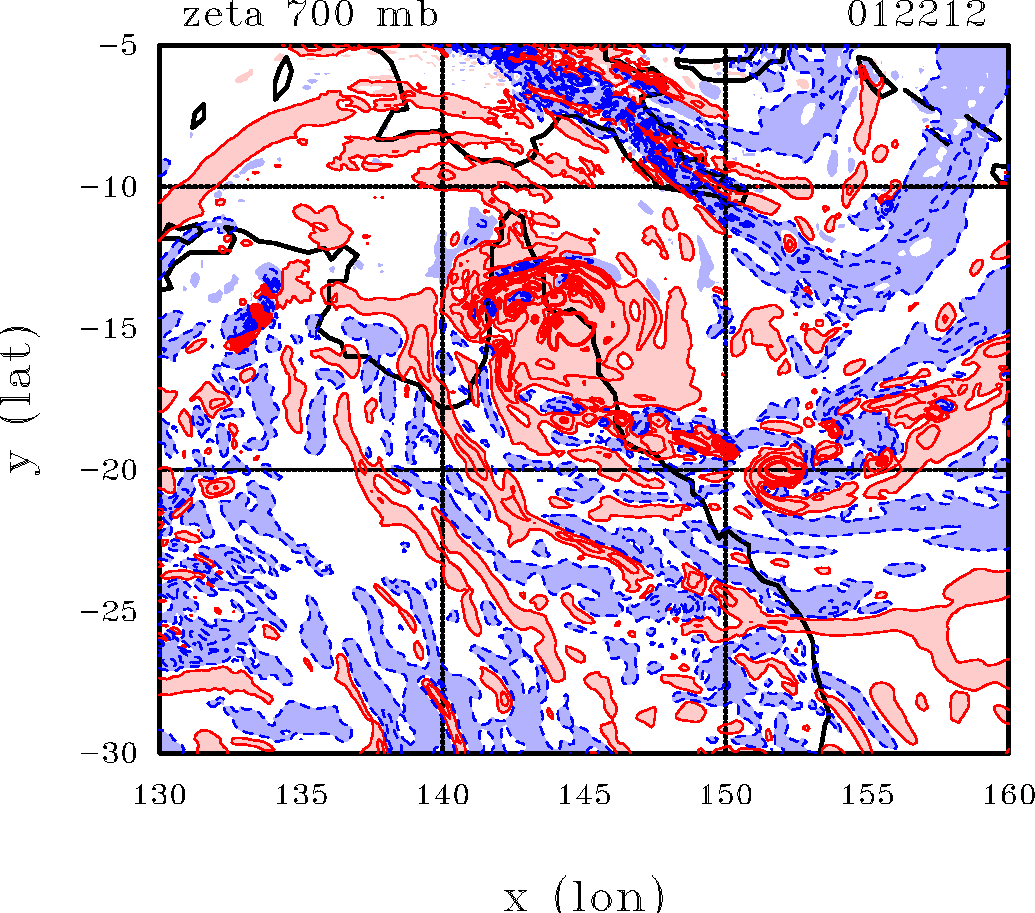
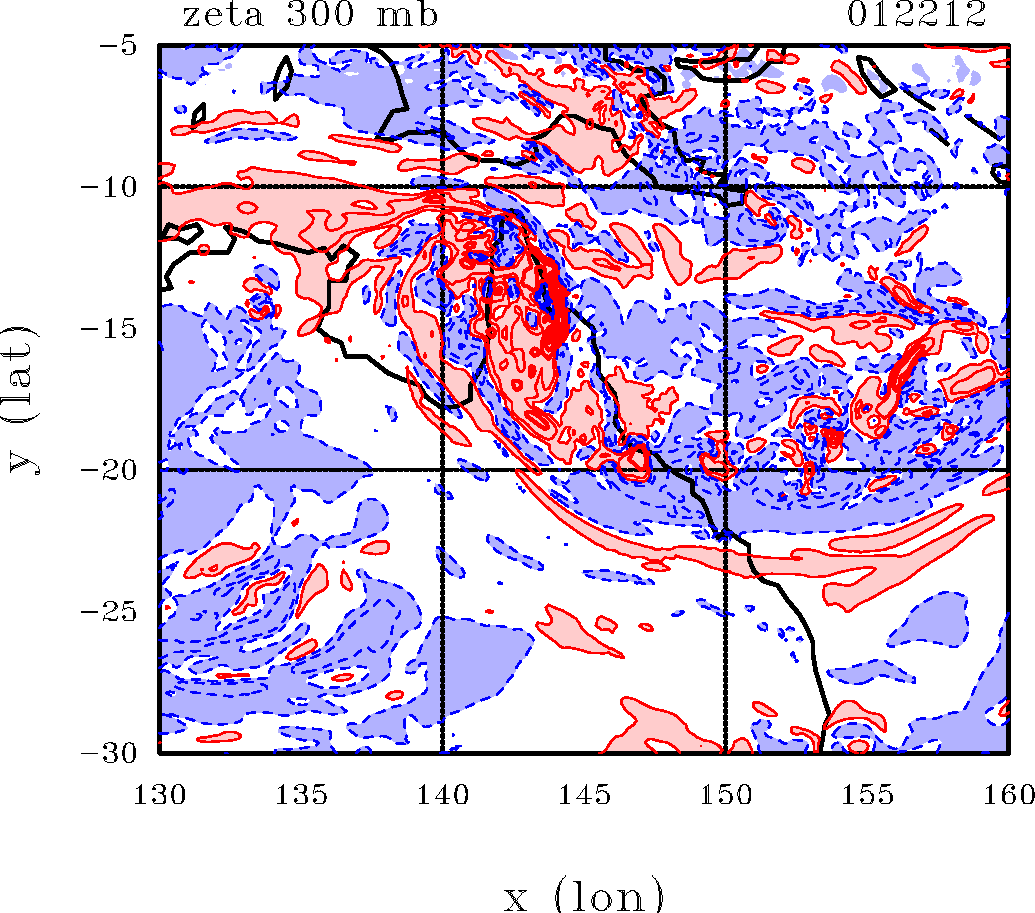
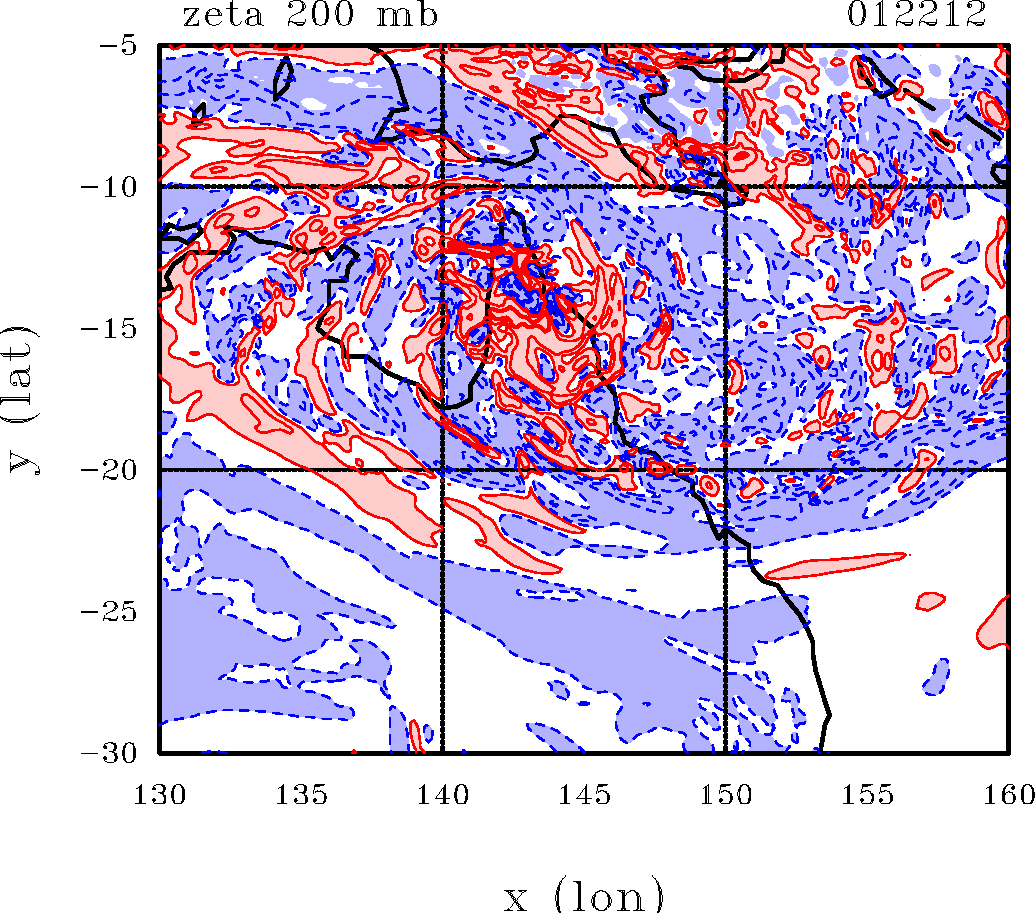
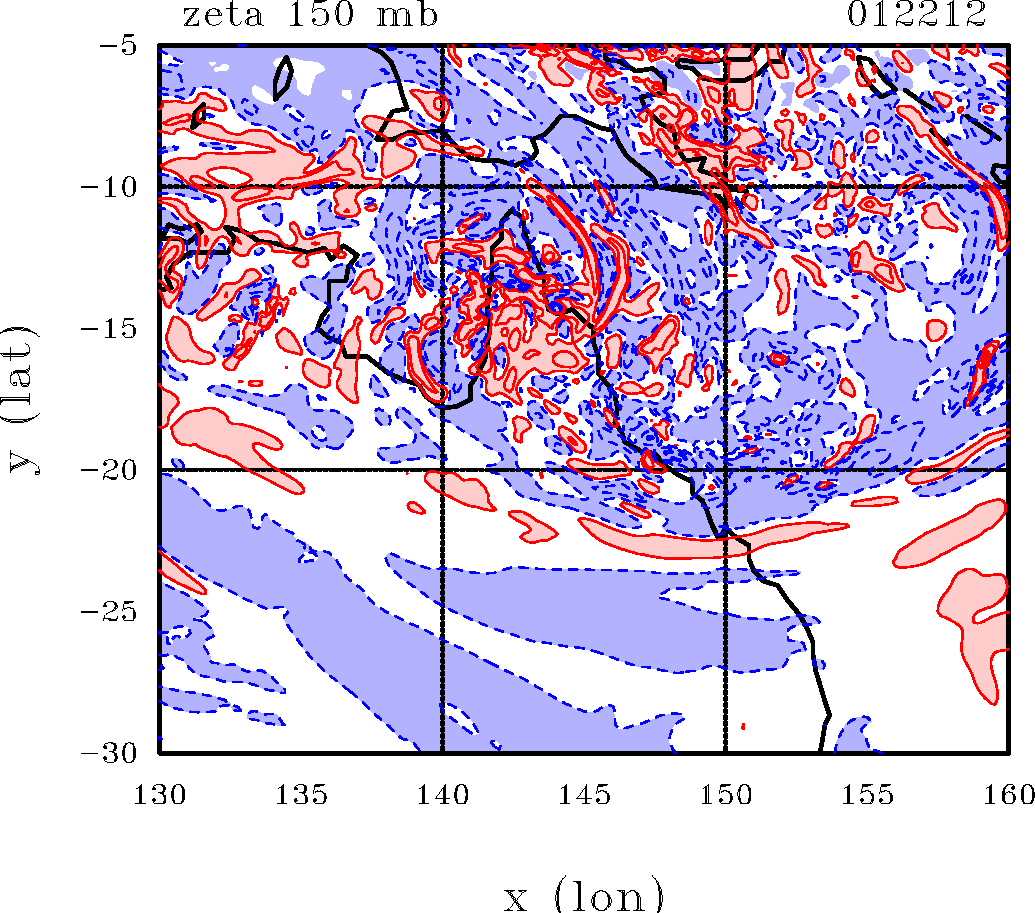
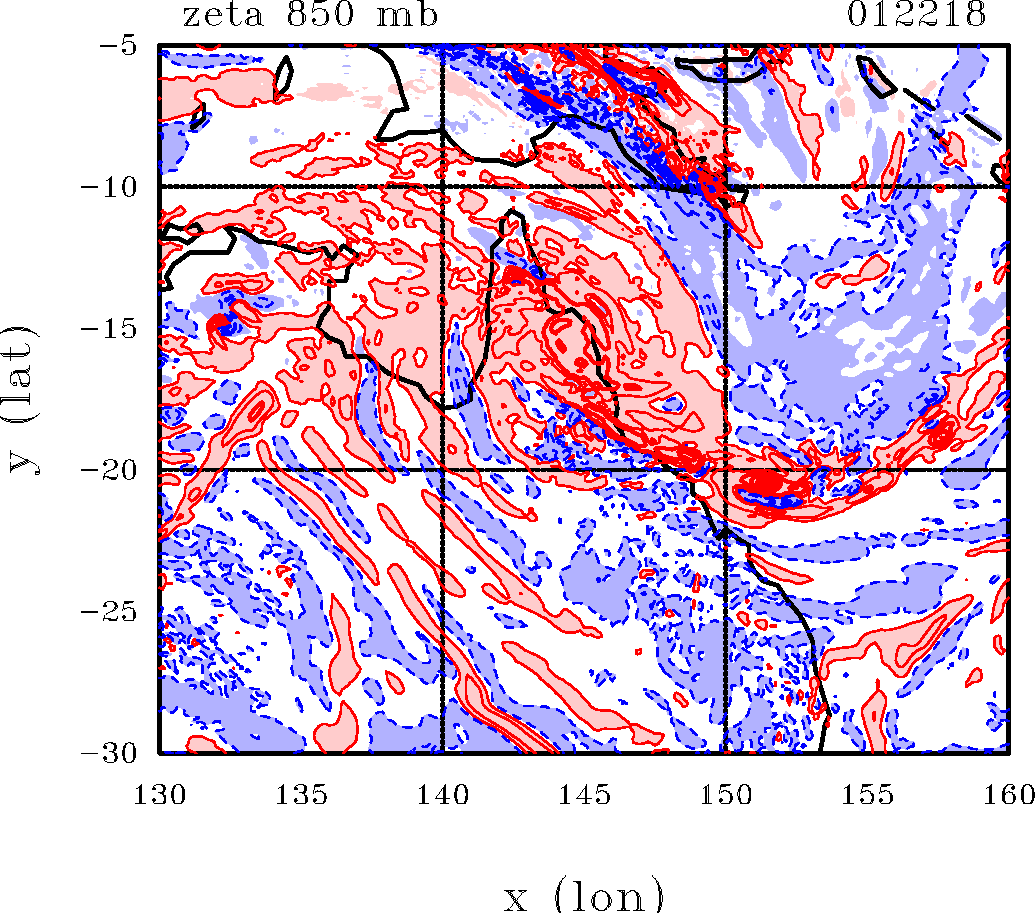
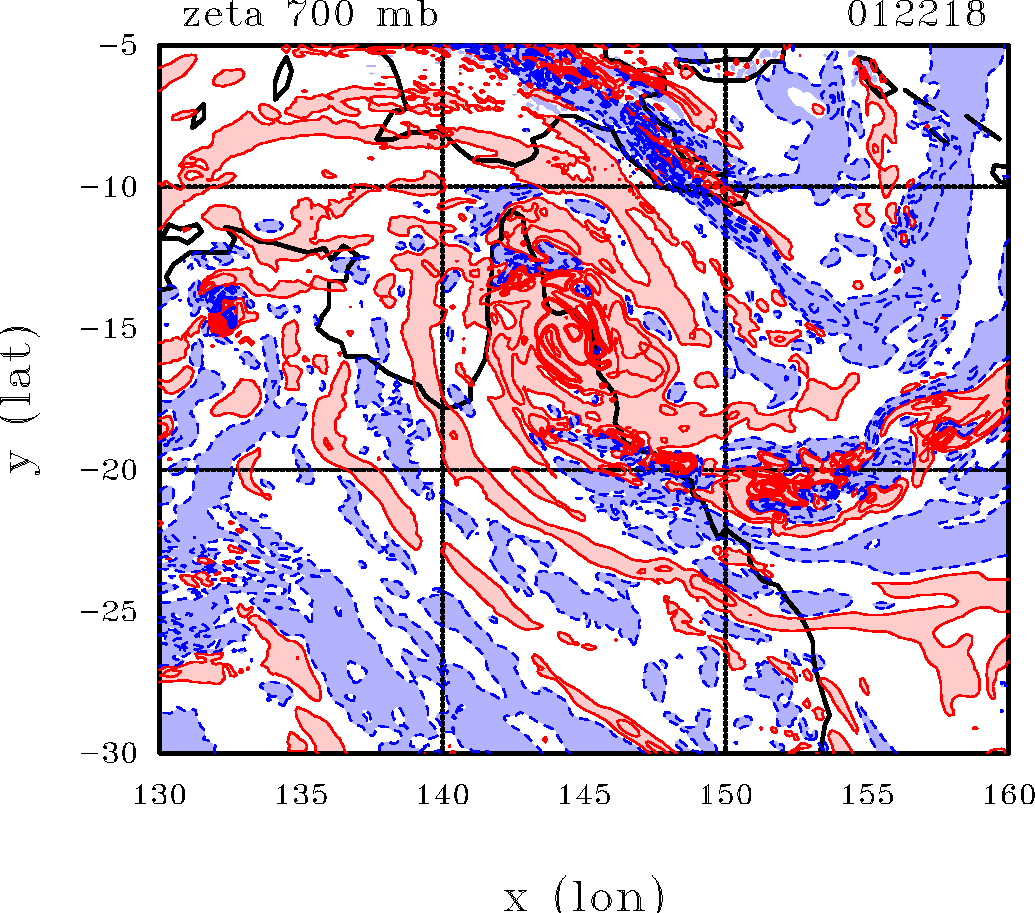
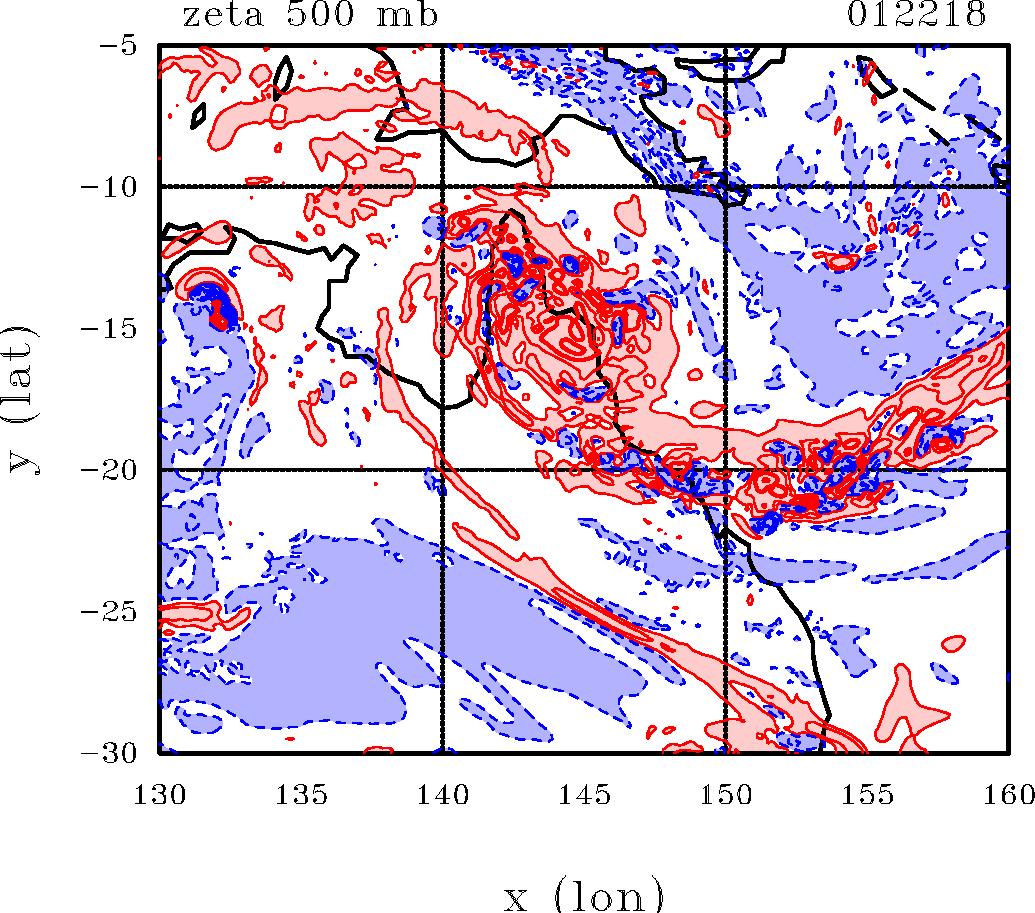
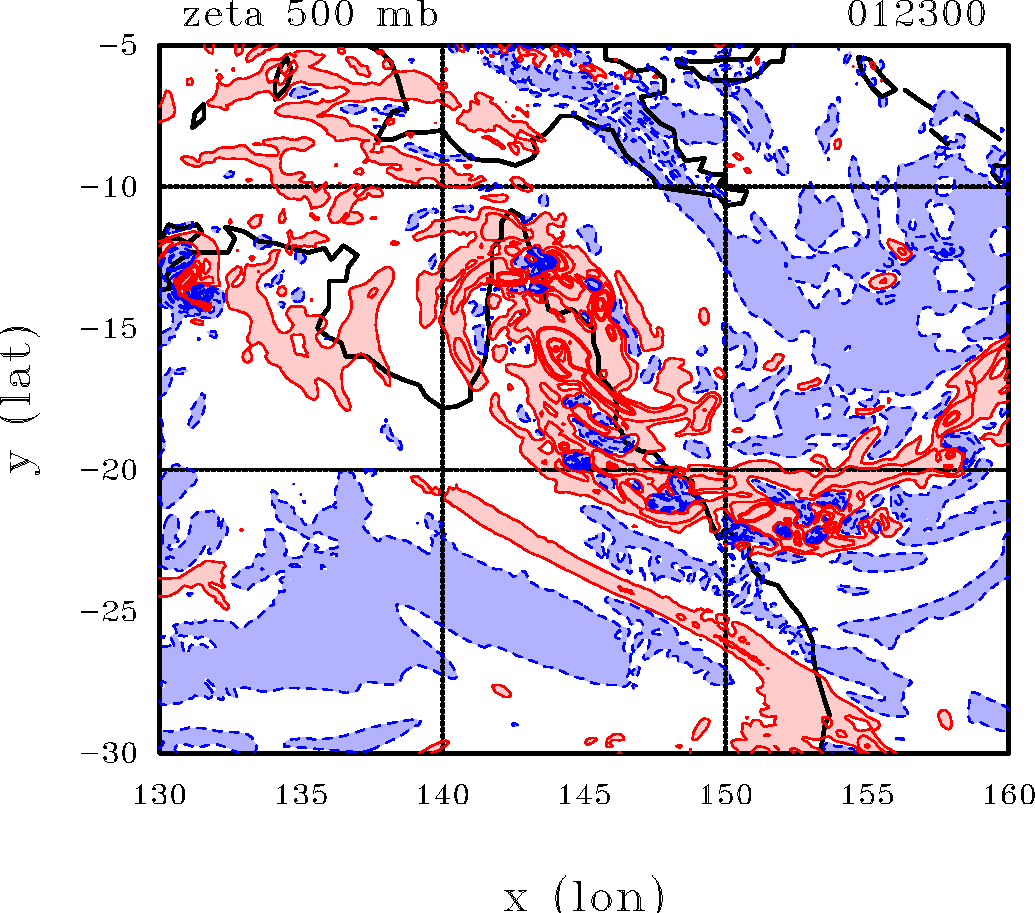
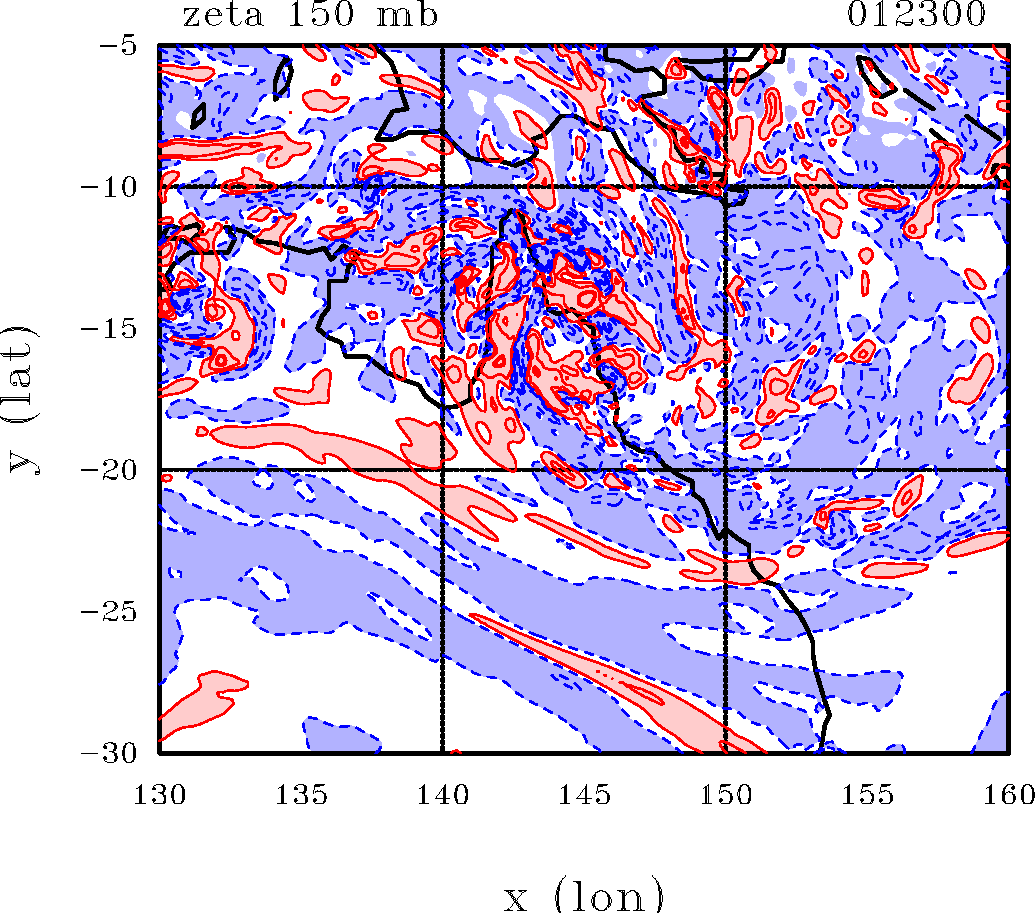
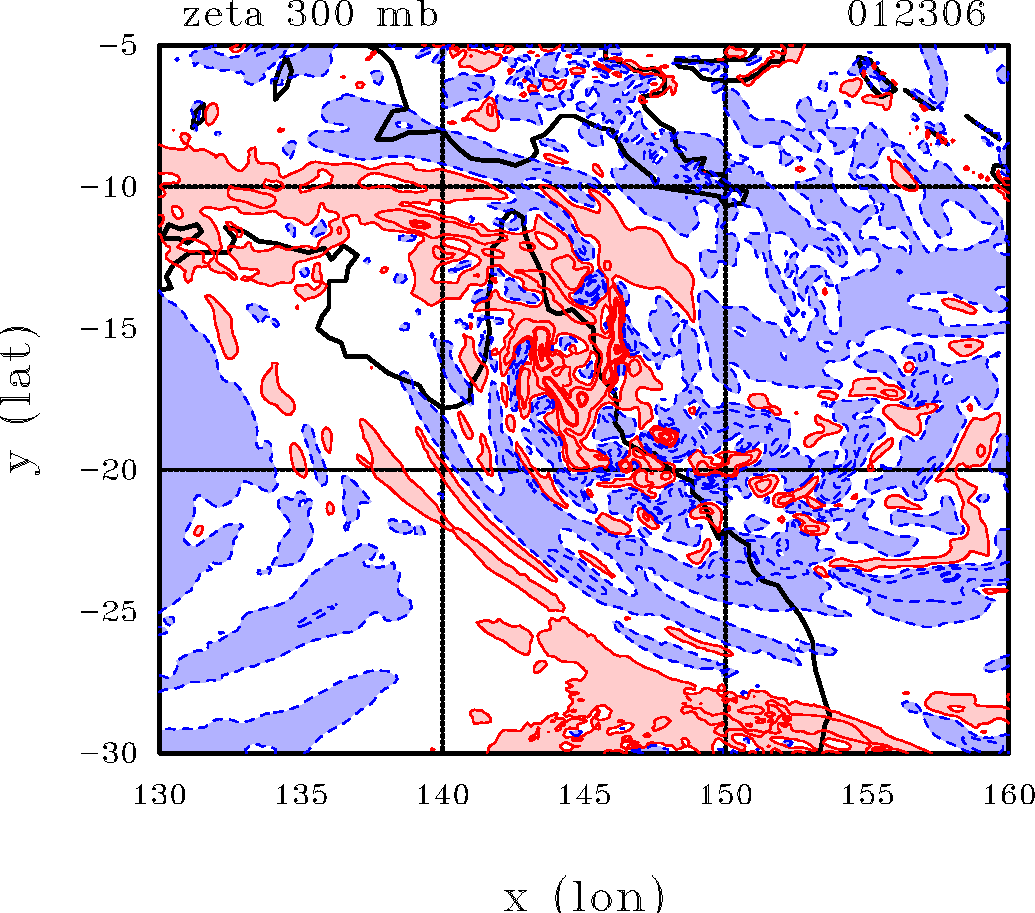
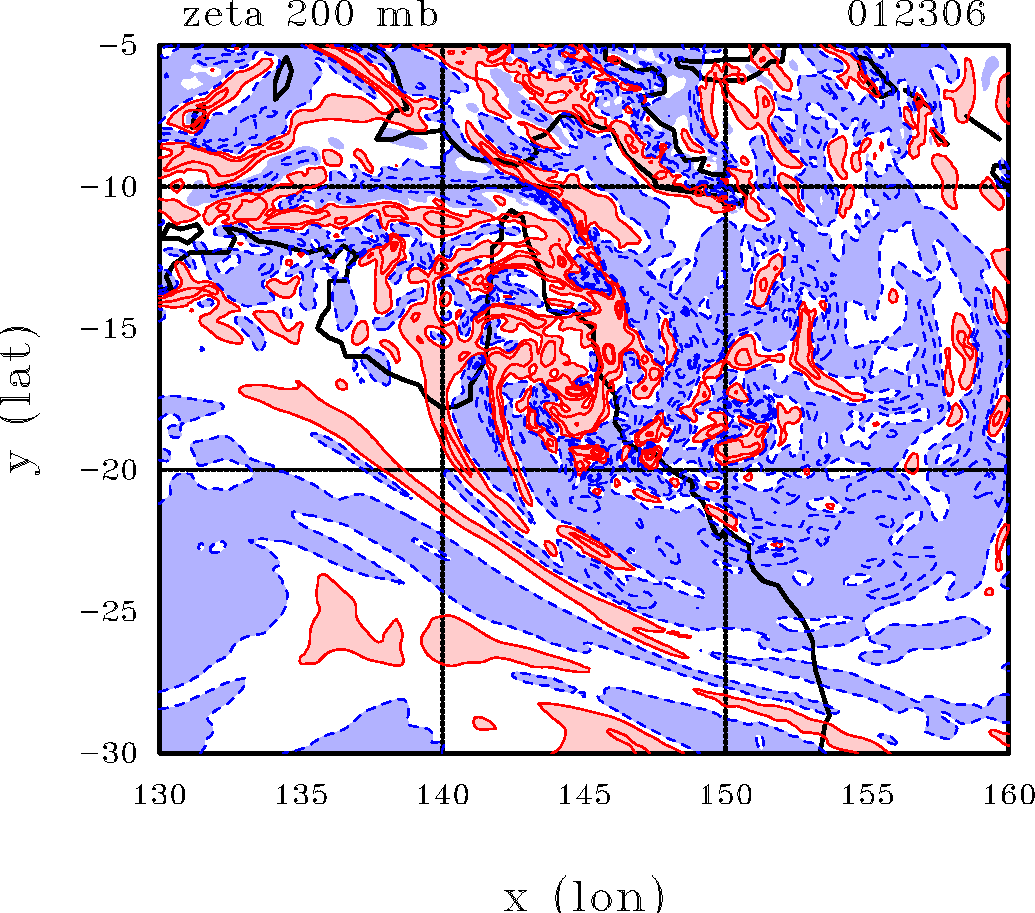
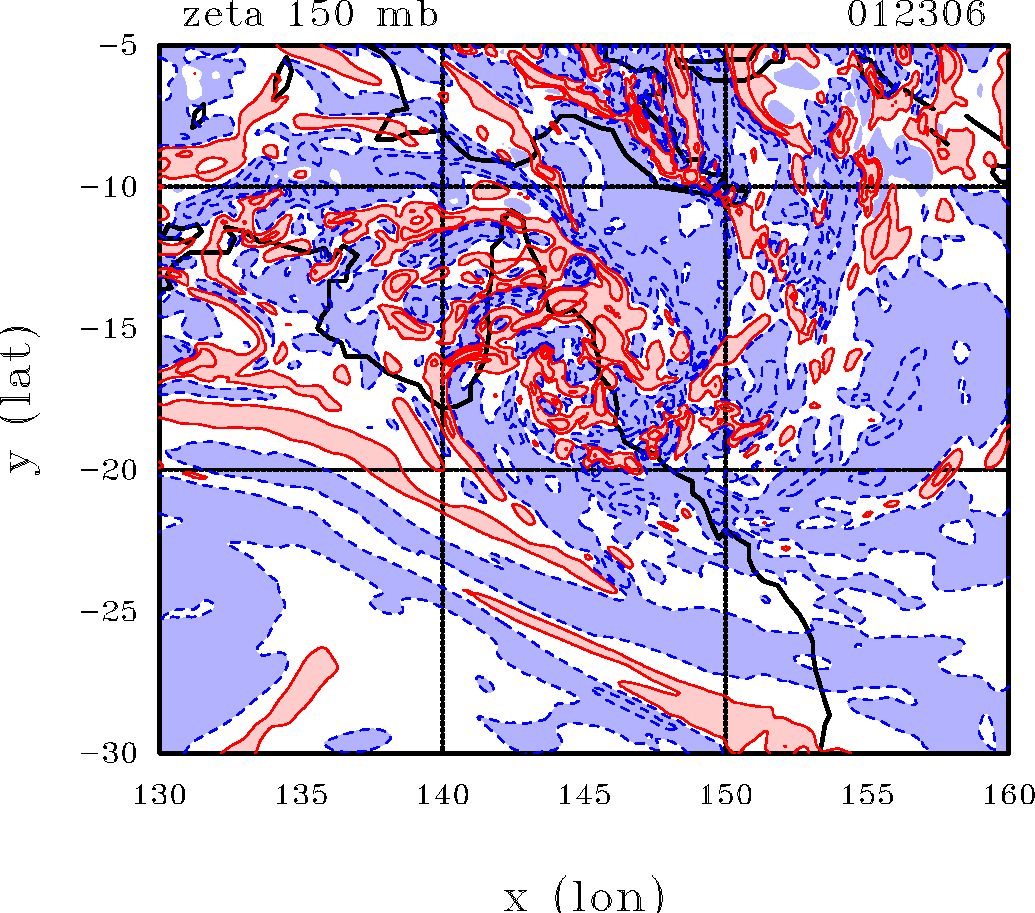
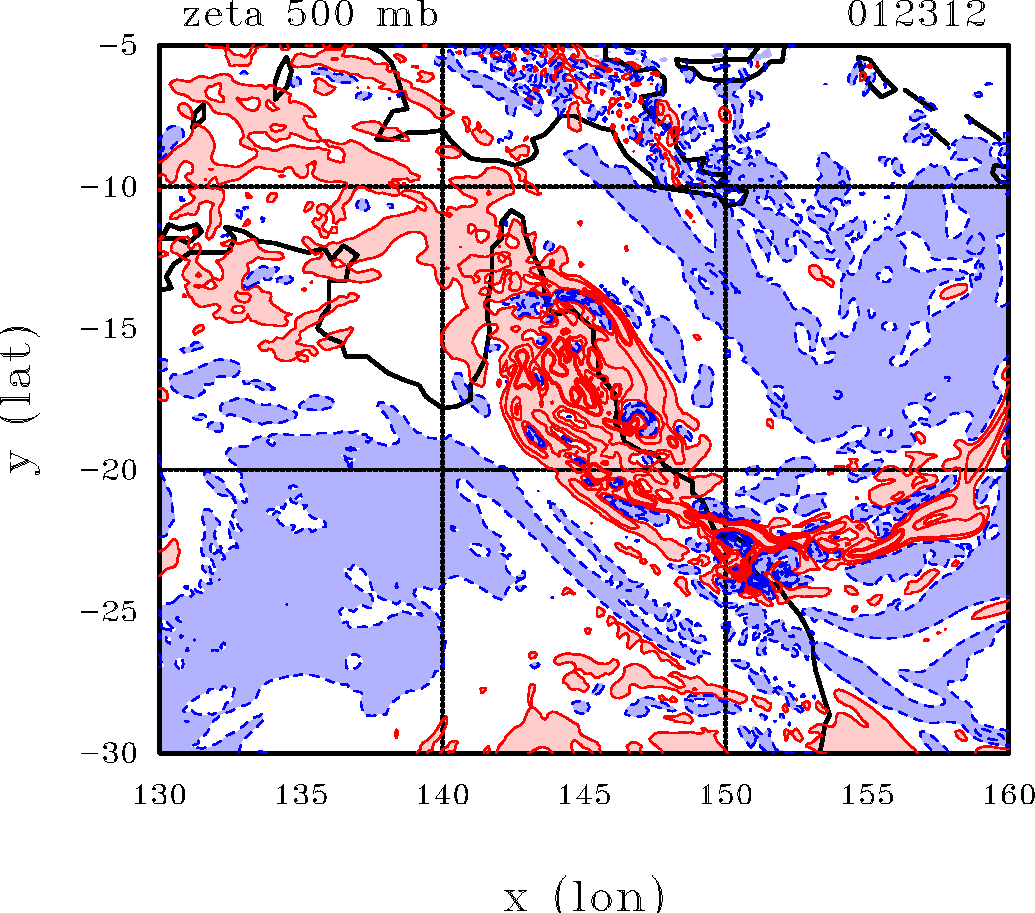
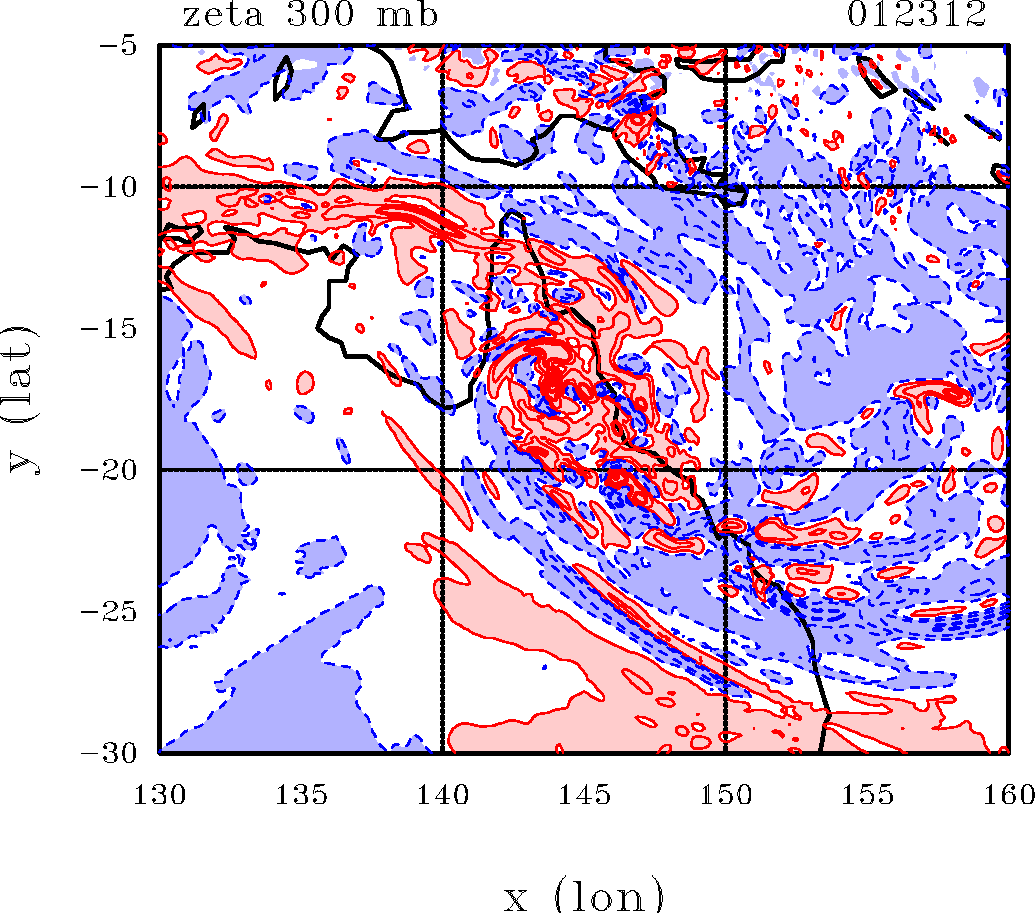
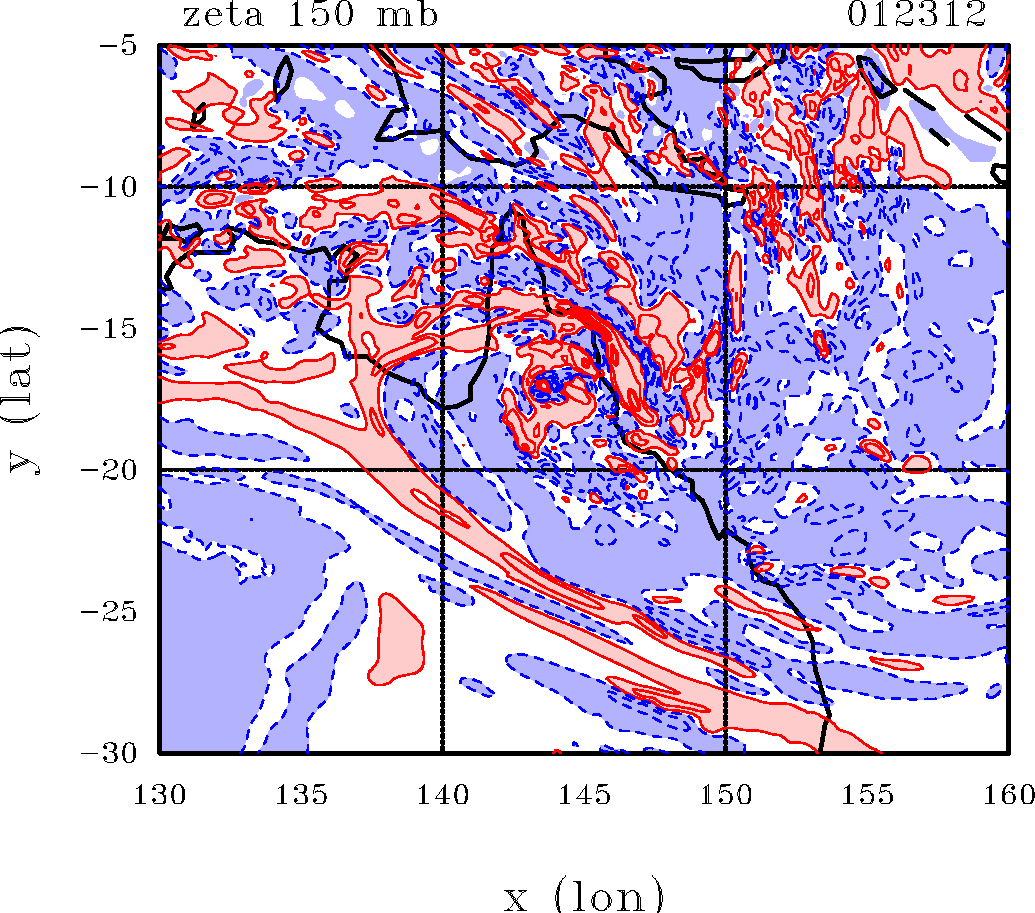
Vertical vorticity at selected pressure levels
The following plots show contours of vertical vorticity during the genesis and mature stage of the disturbances. Contour levels are: thick contours 10-4 s-1 s-1; thin contours 2*10-5 s-1; Negative contours blue/dashed. Regions of cyclonic > 2*10-5 s-1 are shaded pink; regions of anticyclonic vorticity < -2*10-5 s-1 shaded light blue.
 |  |
 |  |
 |  | " />
 |  |
 |  |
 |  |
 |  |
 |  |
 |  |
 |  |
 |  |
 |  |
 |  |
 |  |
 |  |
 |  |
 |  |
 |  |
 |  |
 |  |
 |  |
 |  |
 |  |
 |  |
 |  |
 |  |
 |  |
 |  |
 |  |
 |  |
 |  |
 |  |
 |  |
 |  |
 |  |
 |  |
 |  |
 |  |
 | |
 |  |
 |  |
 |  |
 |  |
 |  |
 |  |
 |  |
 |  |
 |  |
 |  |
 |  |
 |  |
 |  |
 |  |
 |  |
 |  |
 |  |
 |  |
 |  |
 |  |
 |  |
 |  |
 |  |
 |  |
 |  |
 |  |
 |  |
 |  |
 |  |
 |  |
 |  |
 |  |
 |  |
 |  |
 |  |
 |  |
 |  |
 |  |
 |  |
 |  |
 |  |
 |  |
Copyright © Roger Smith