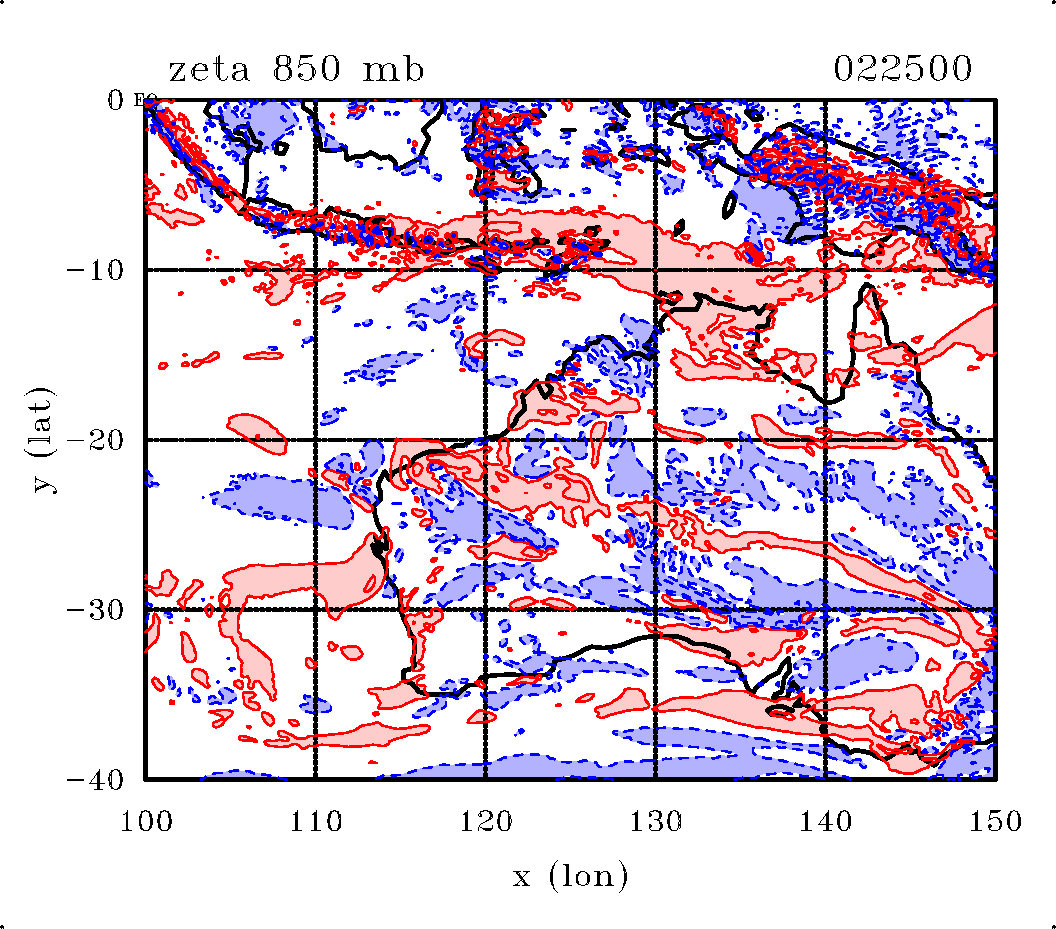
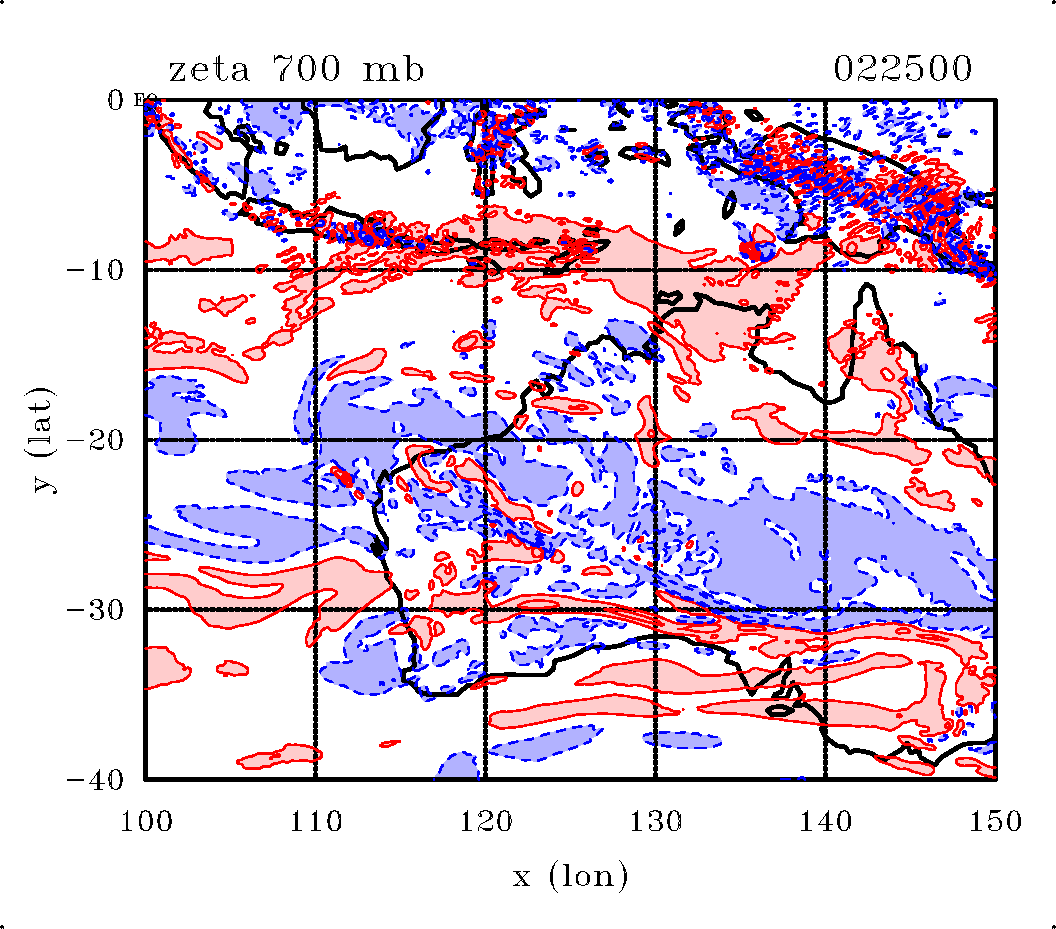
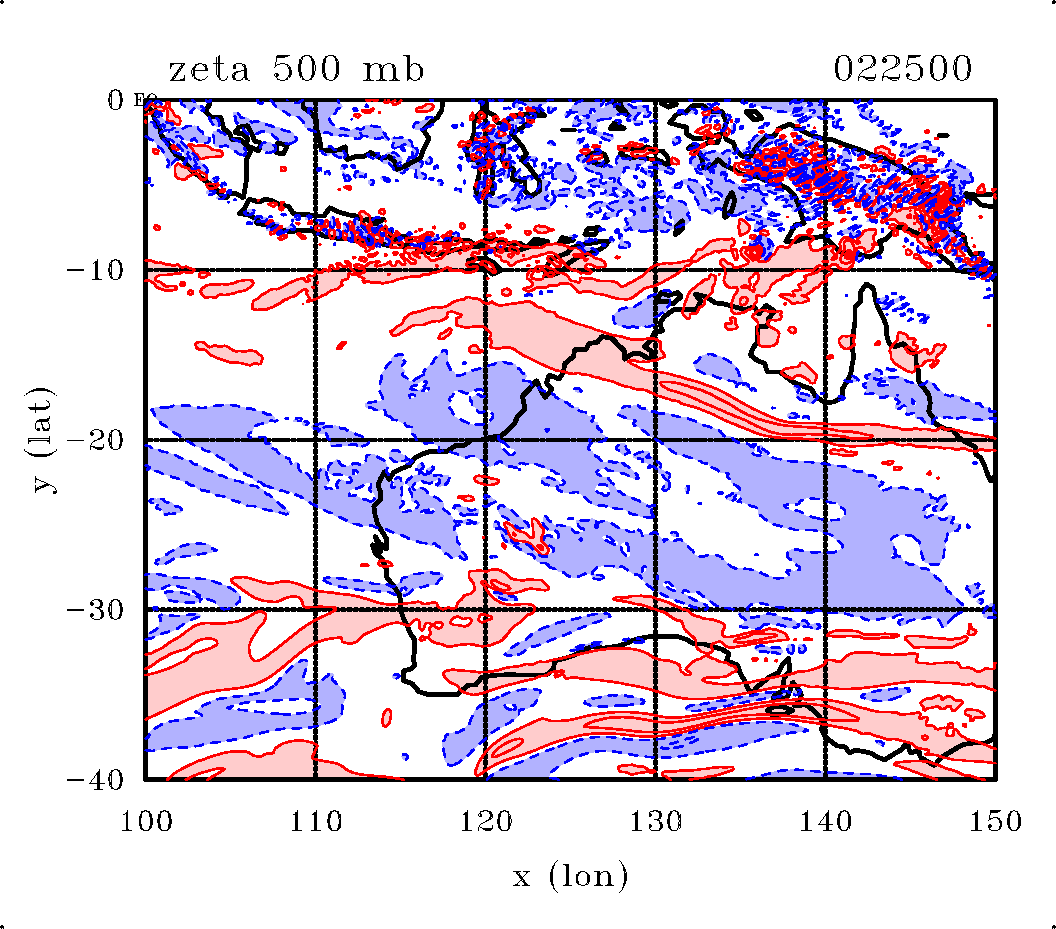
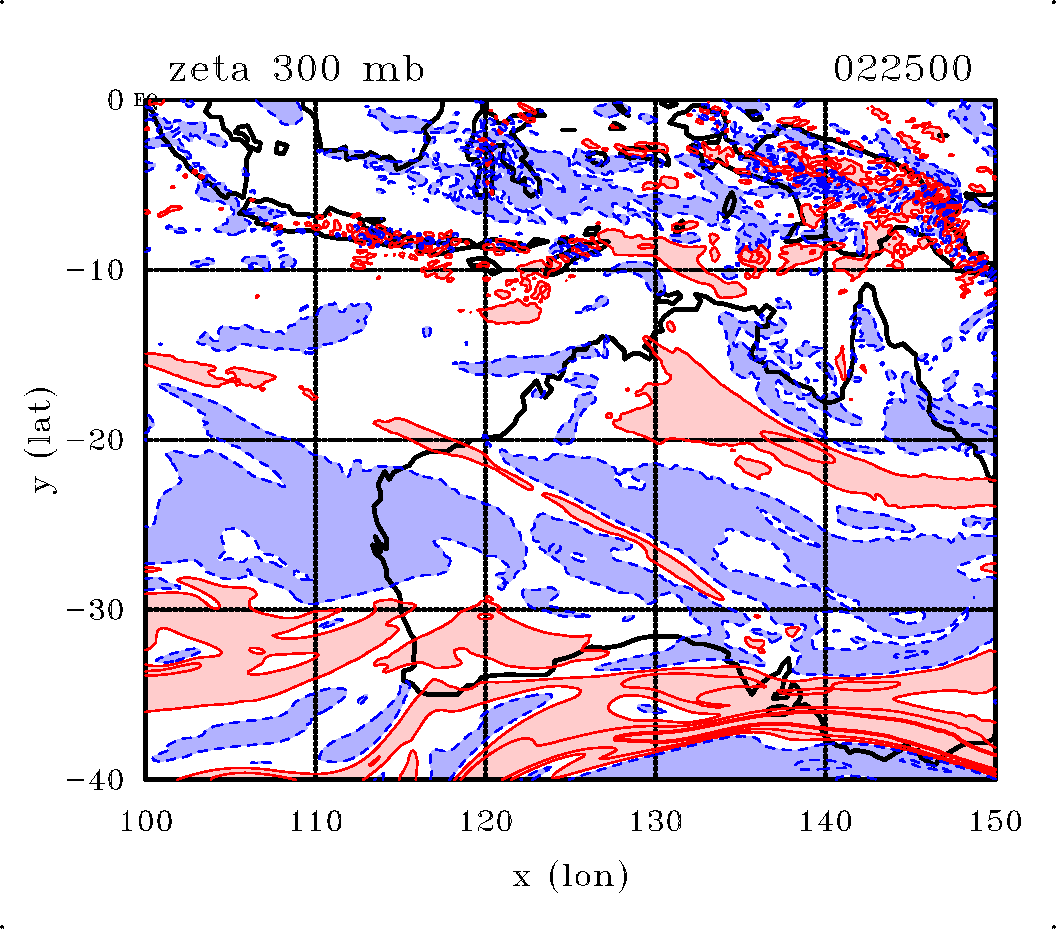
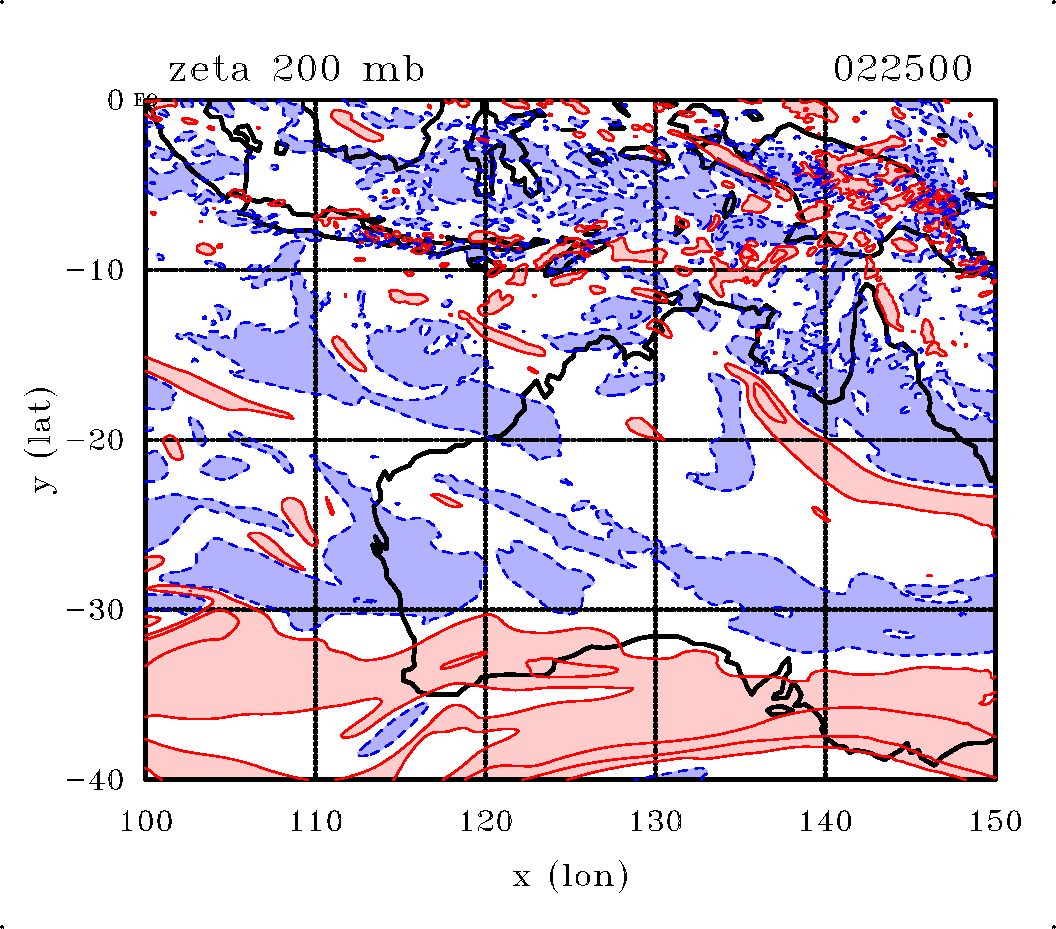
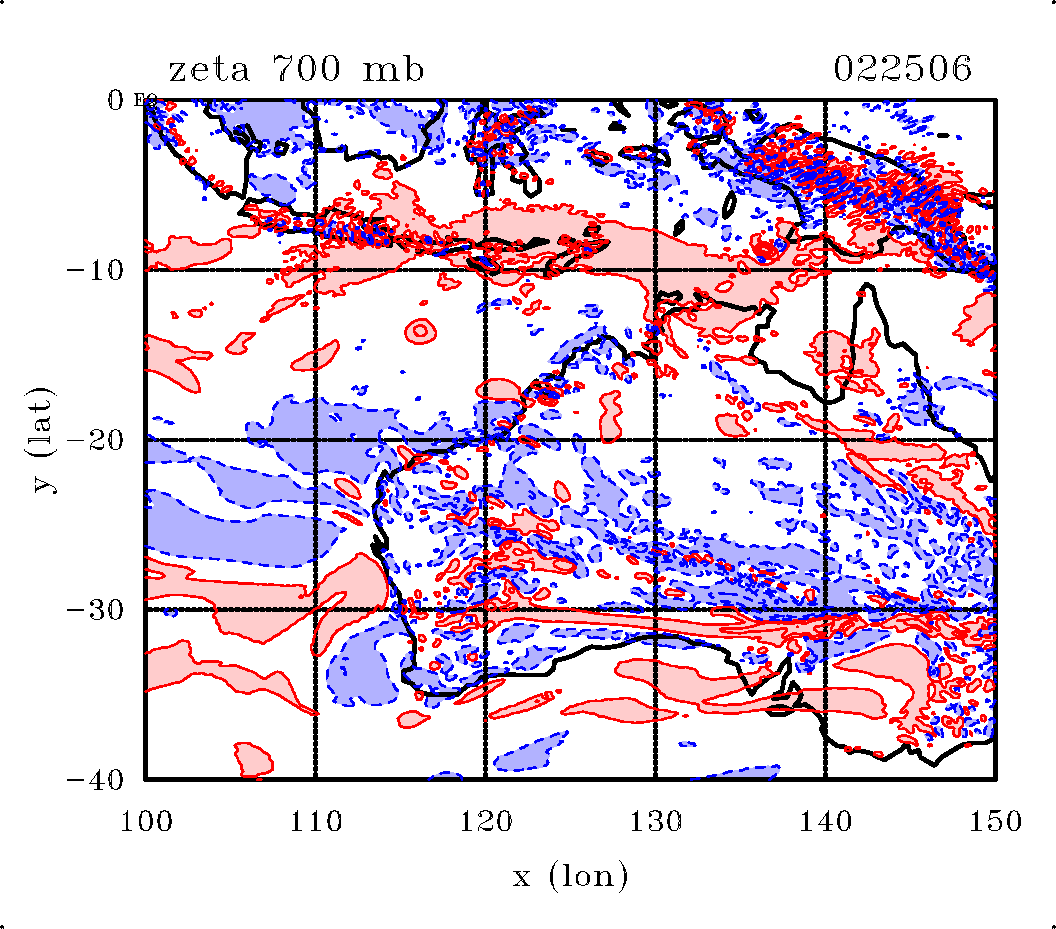
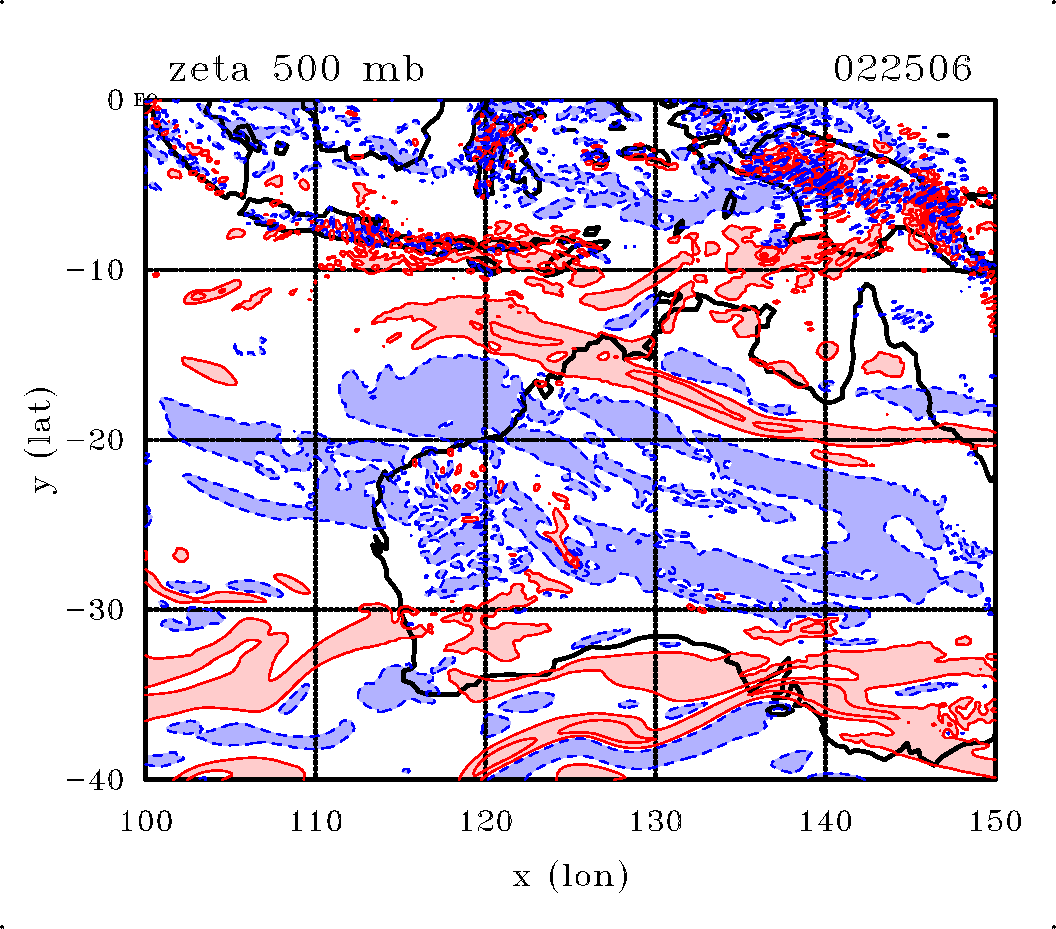
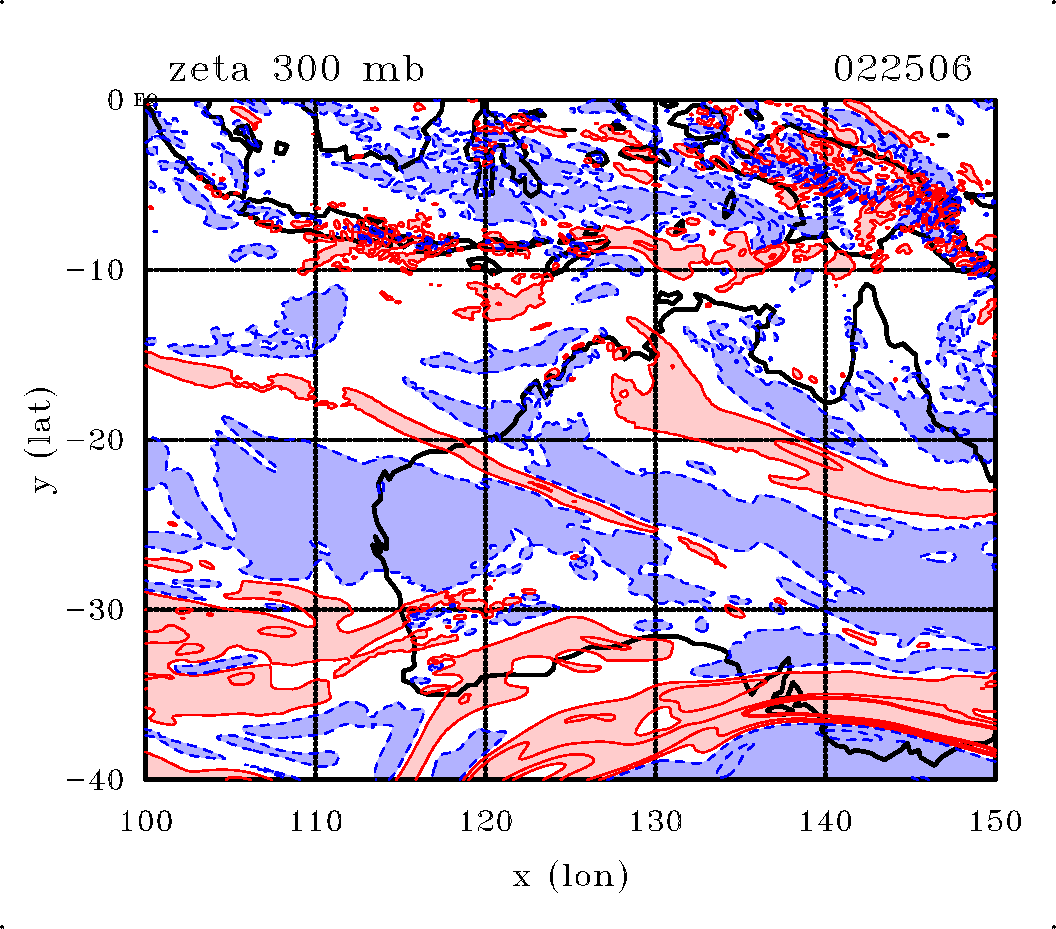
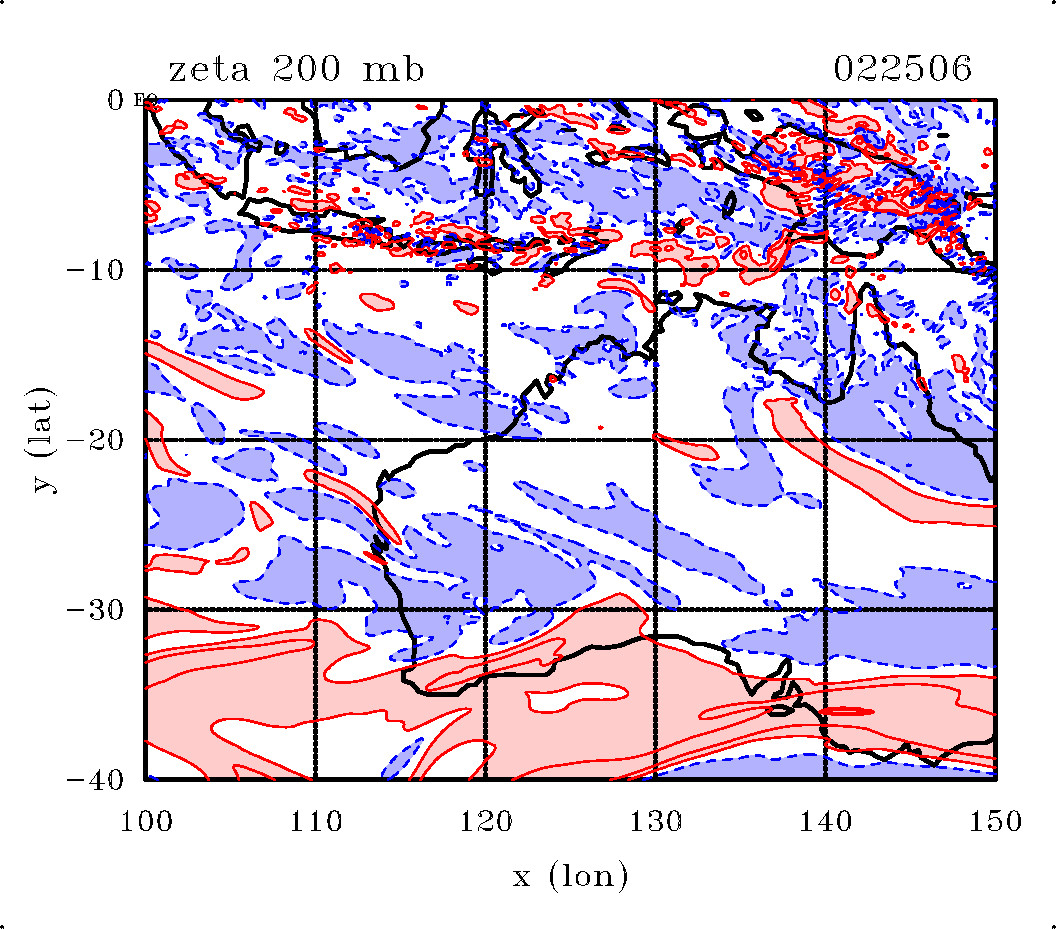
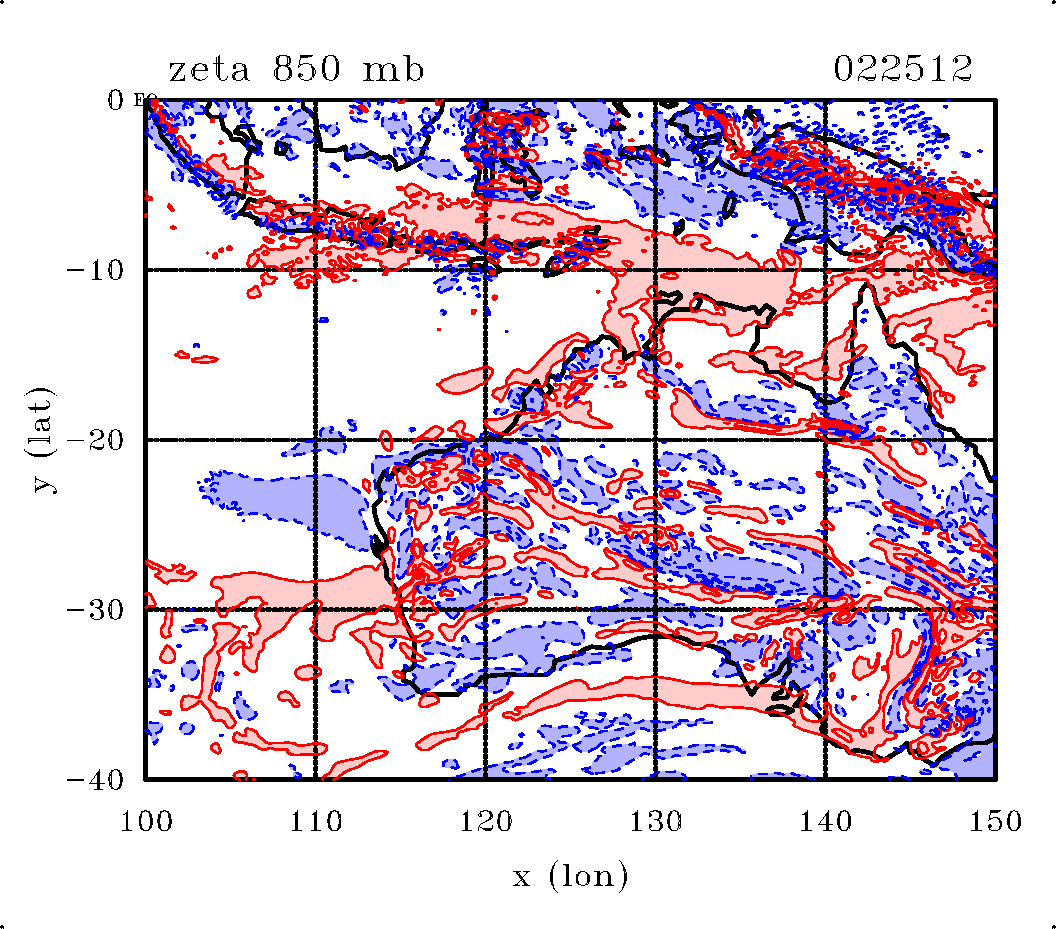
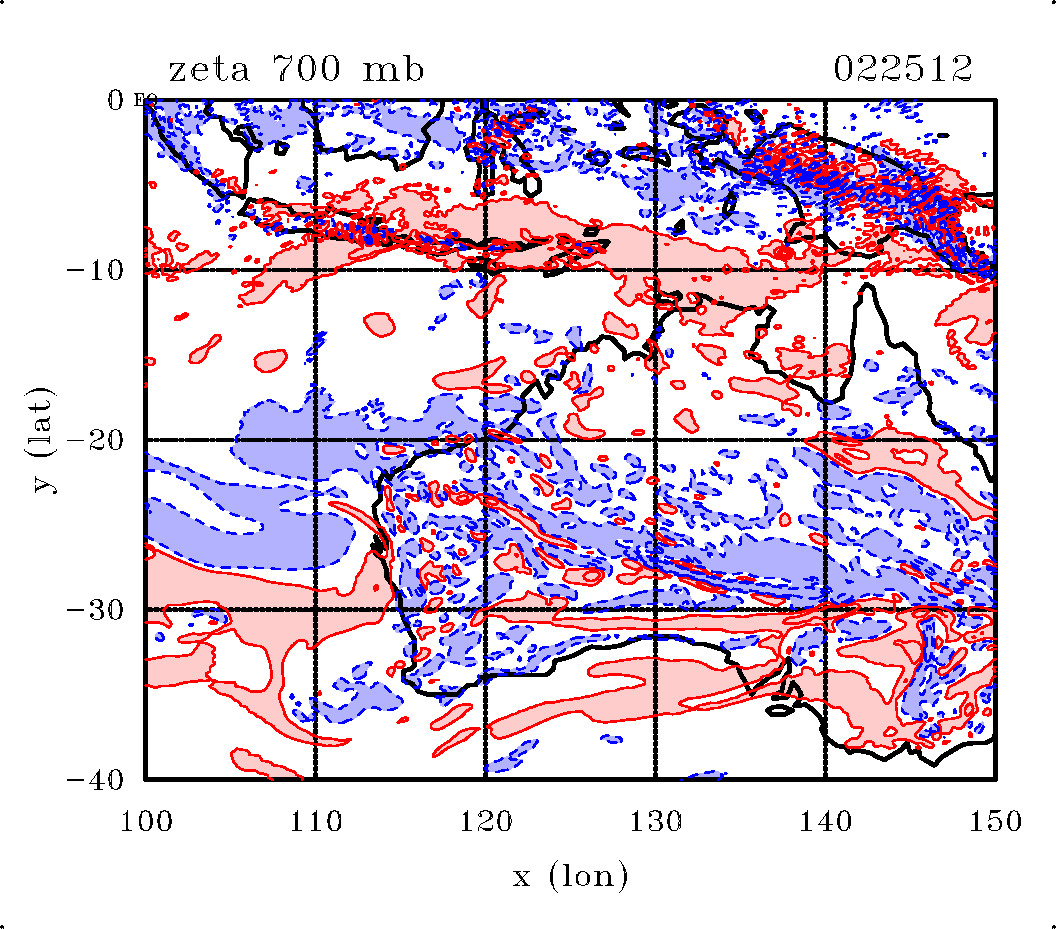
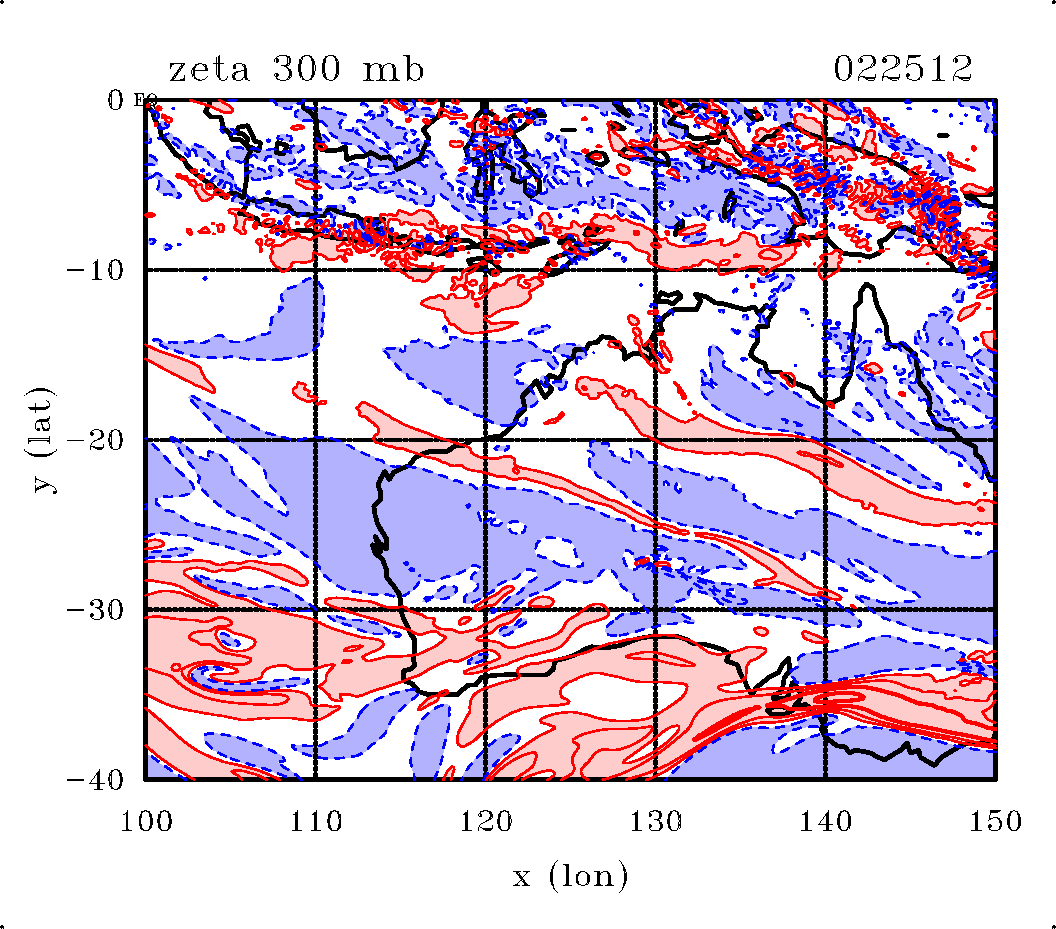
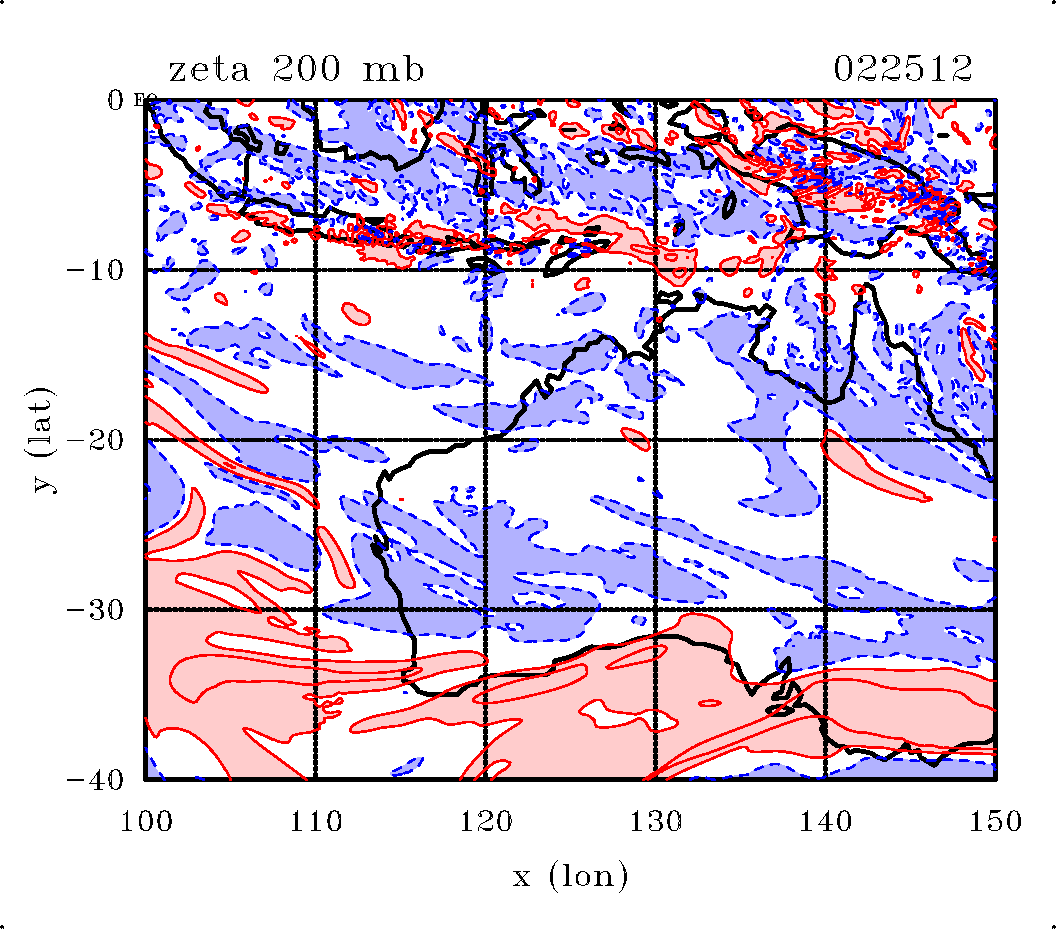
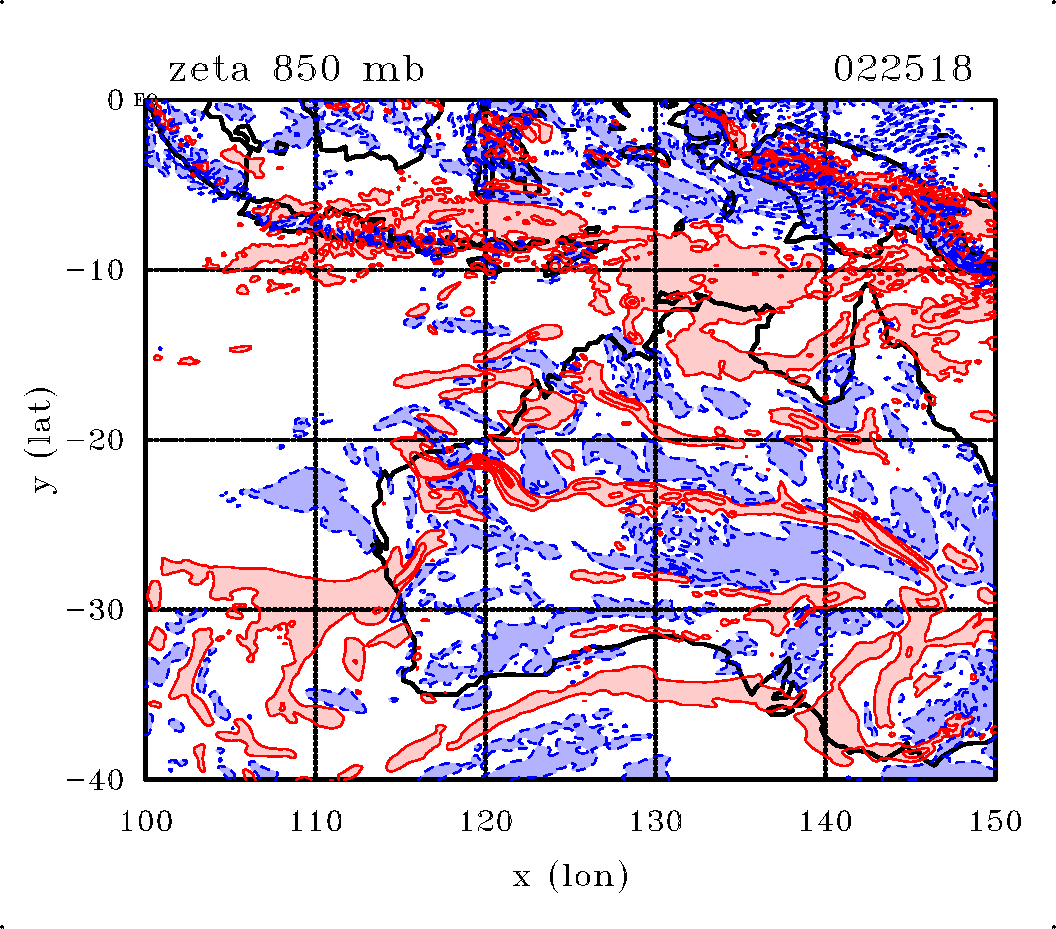
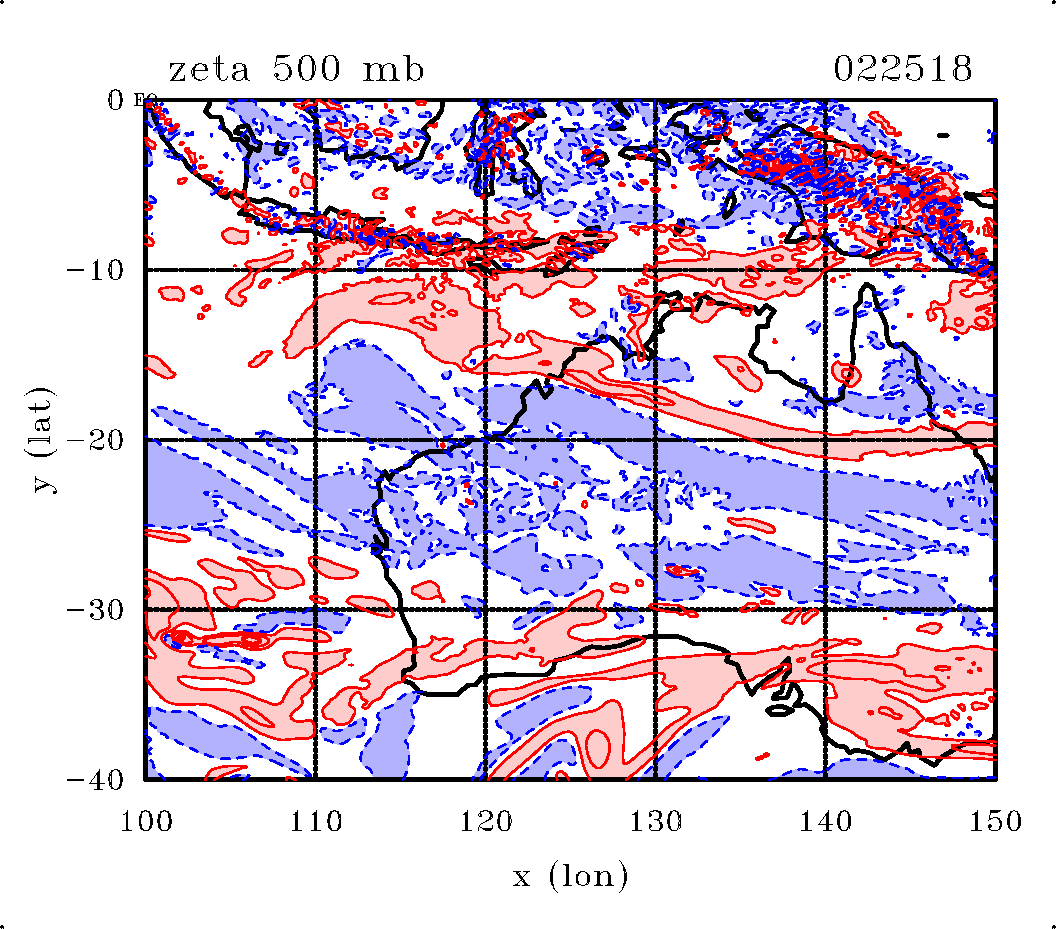
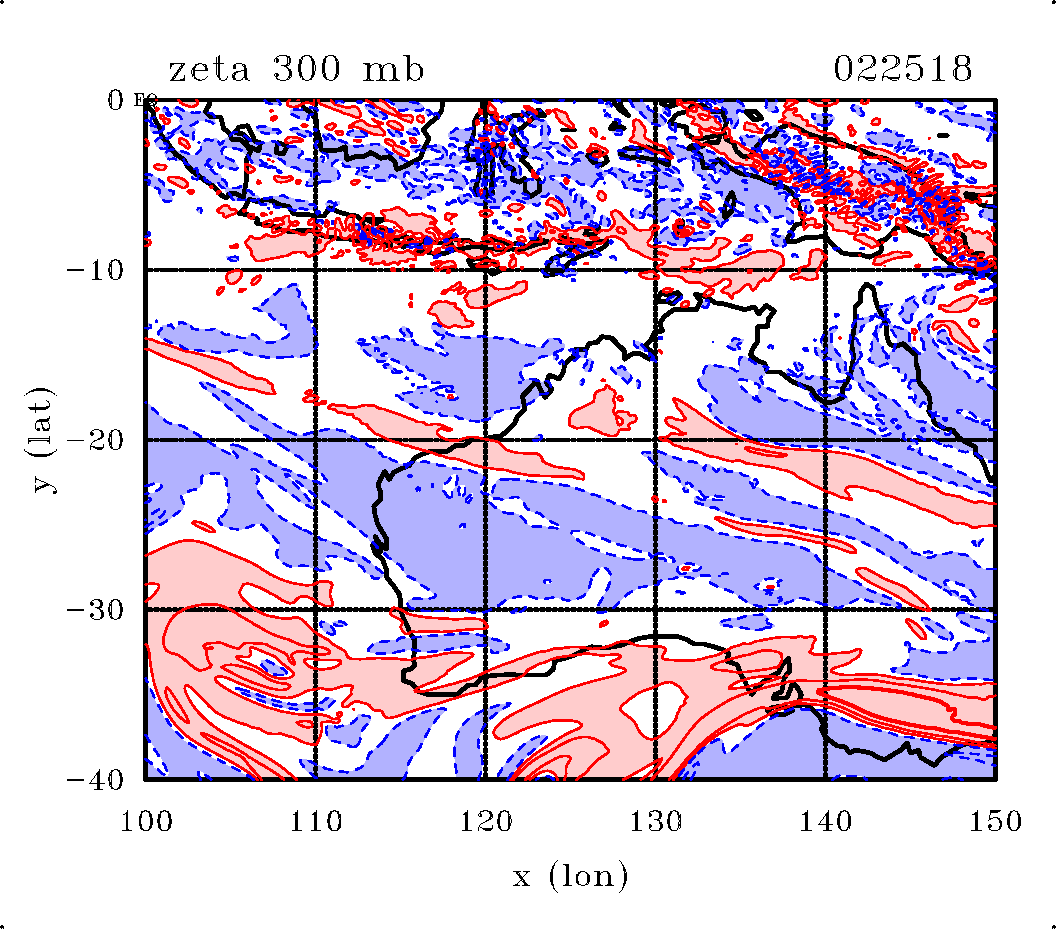
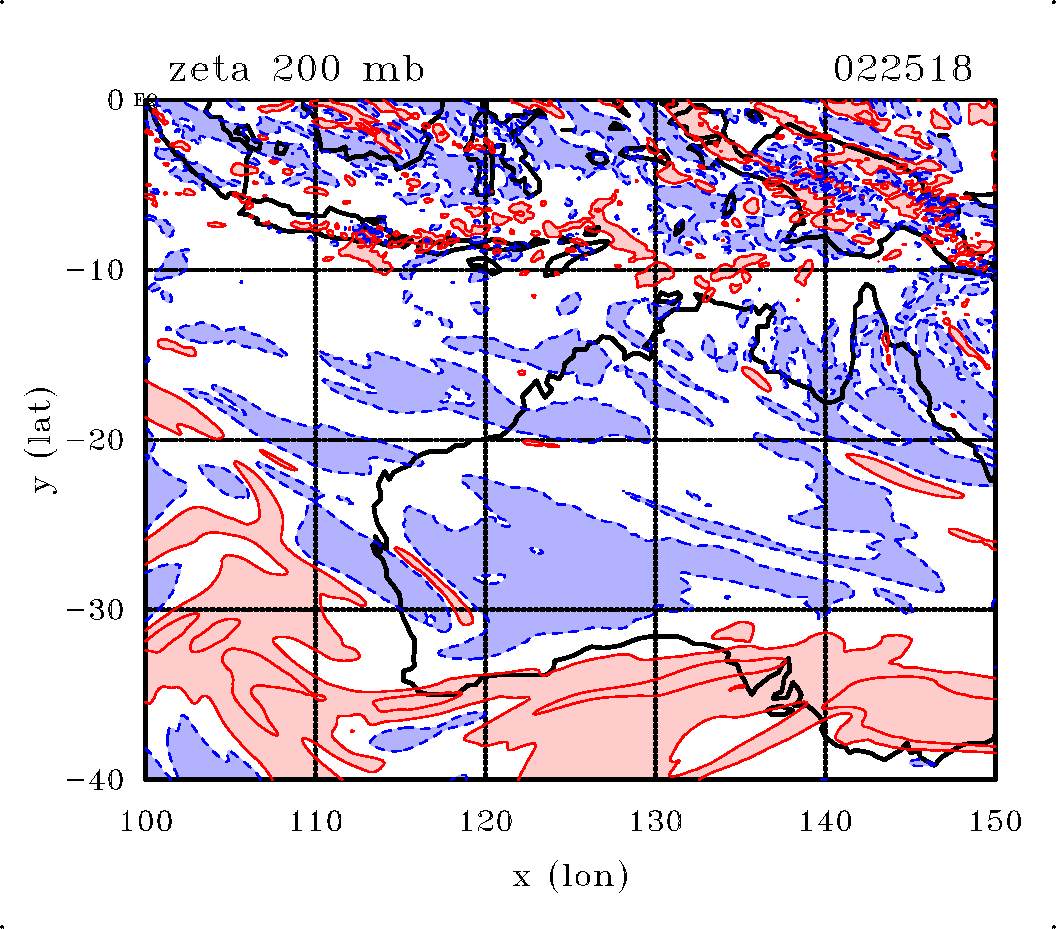
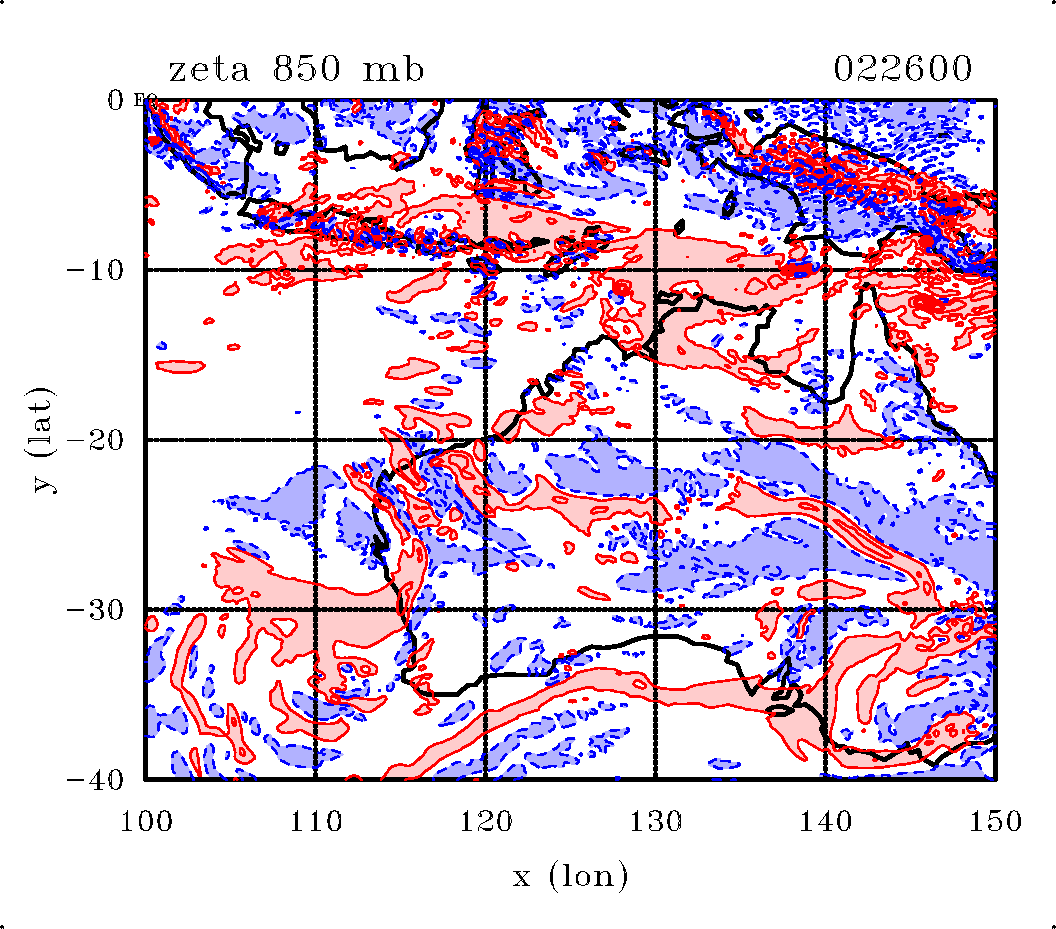
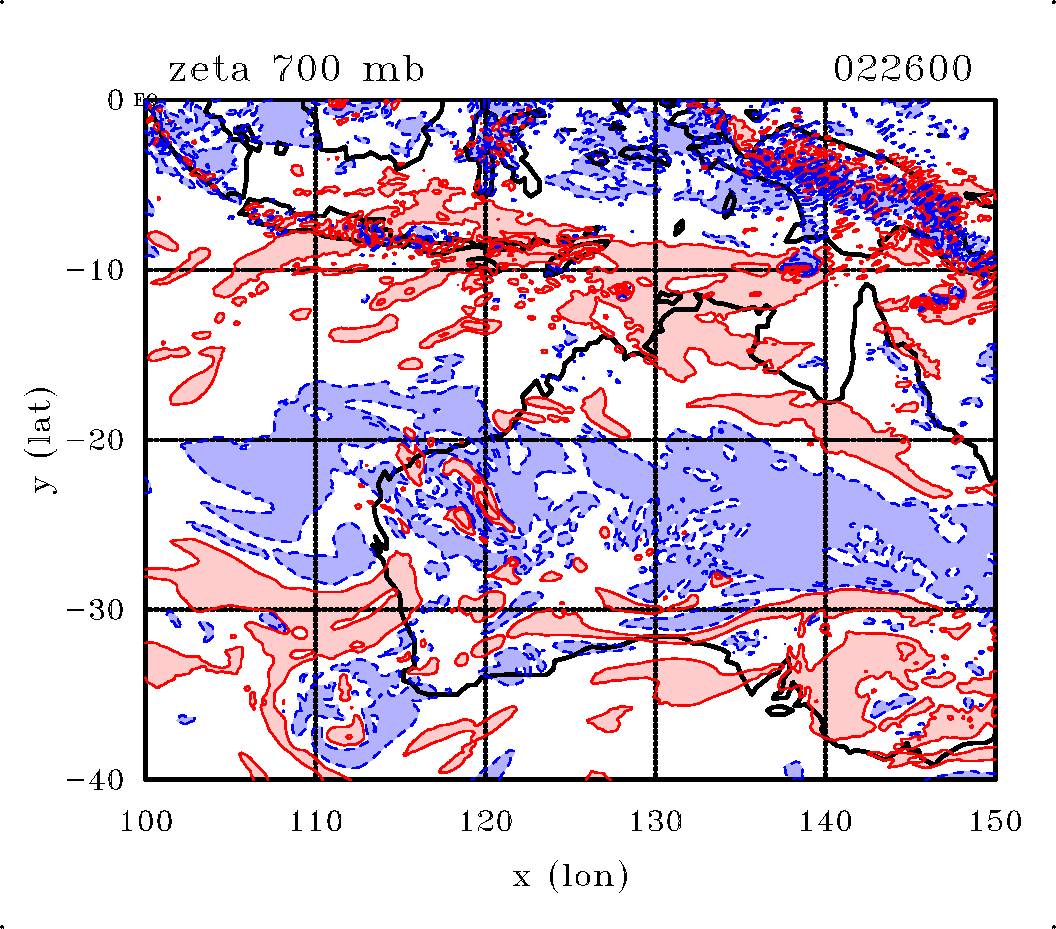
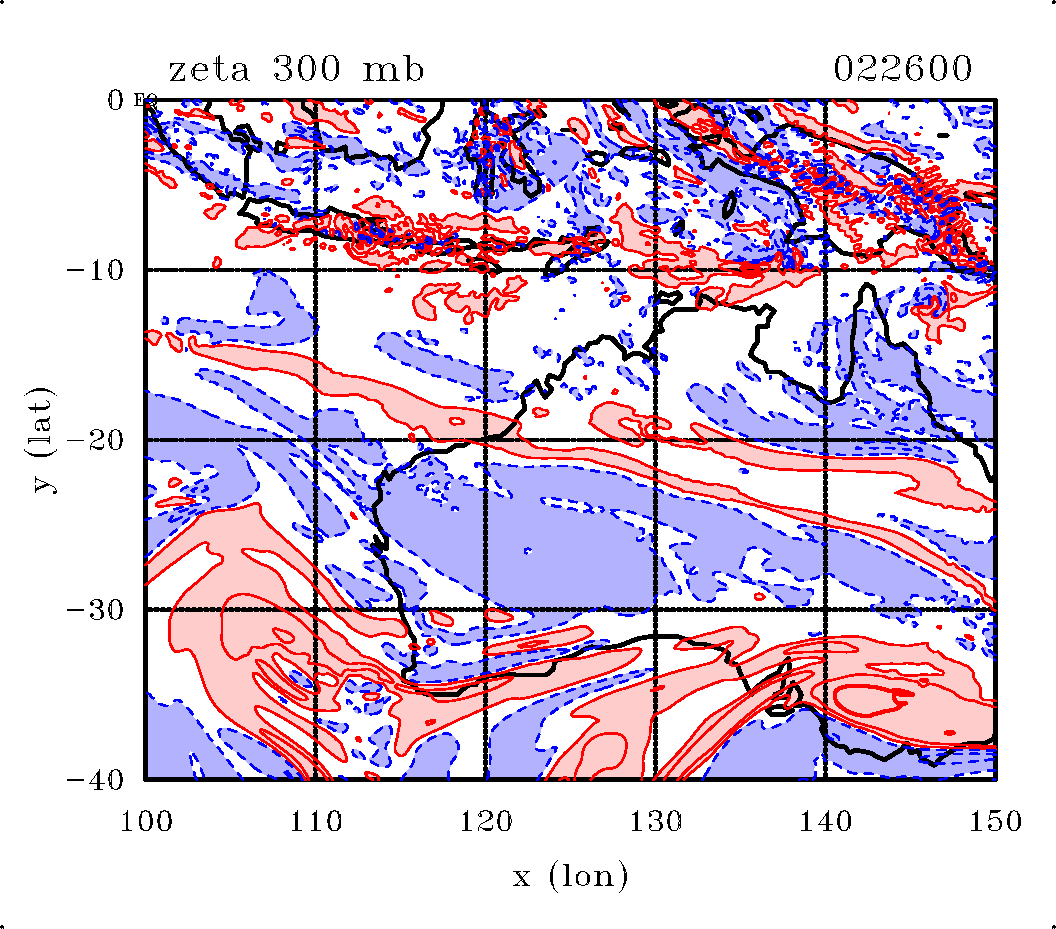
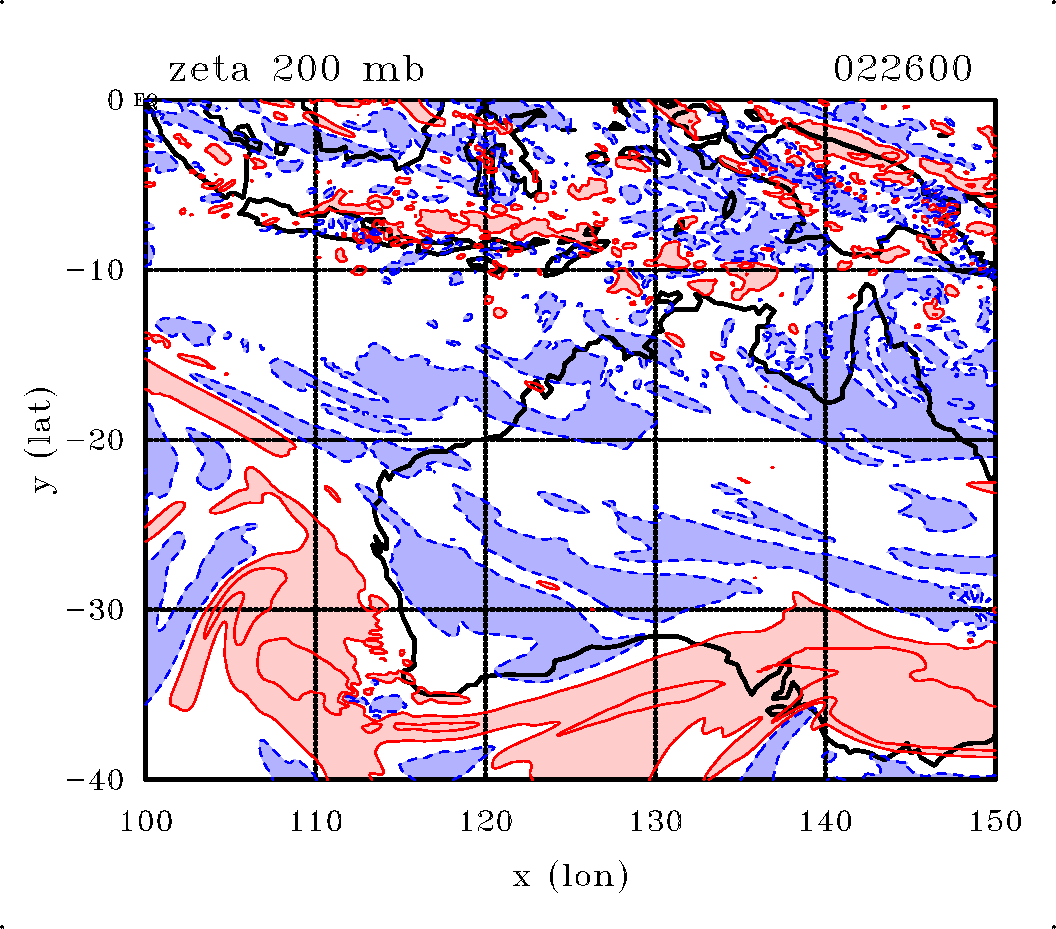
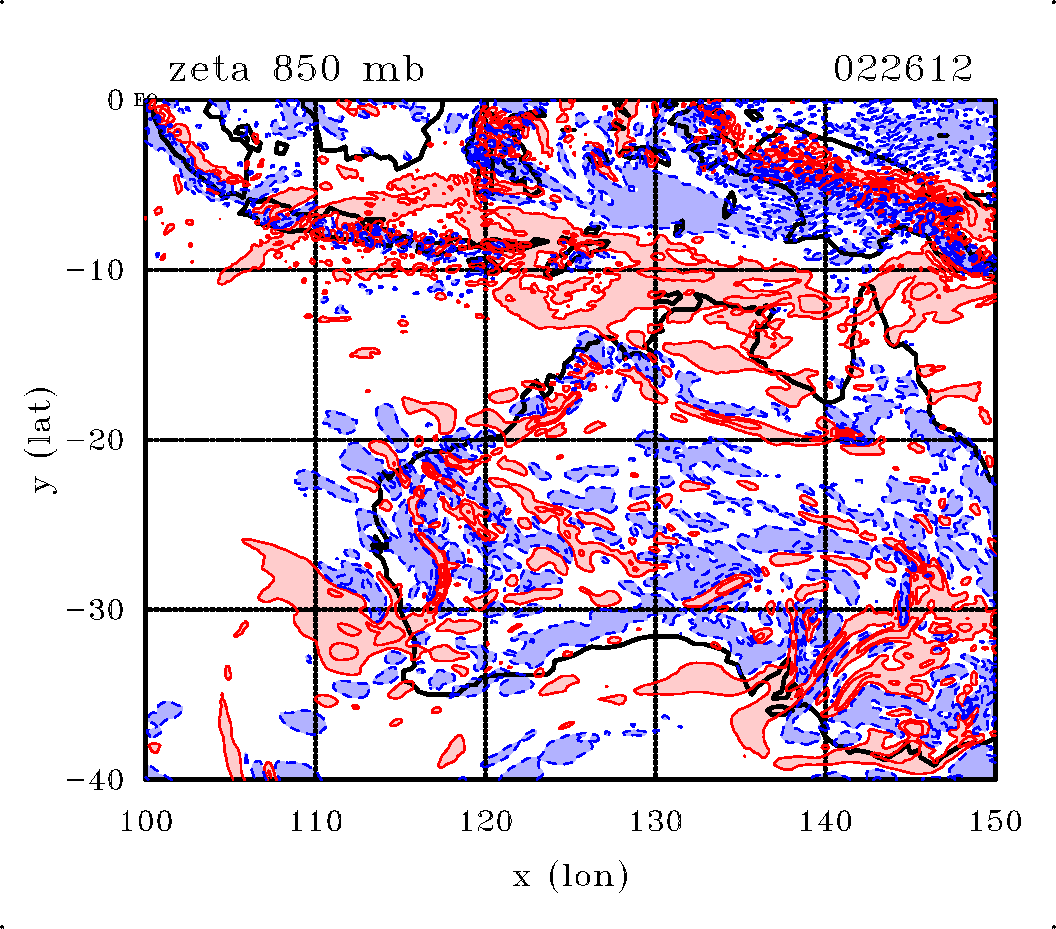
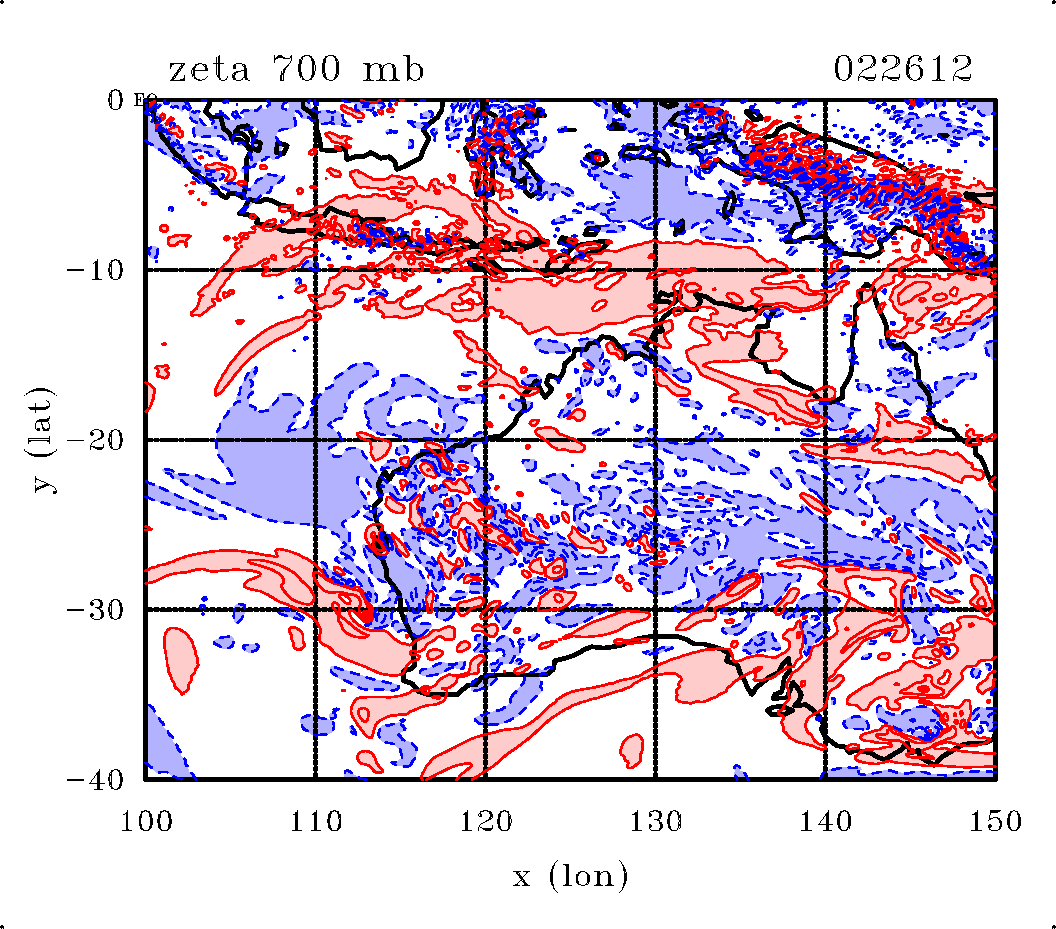
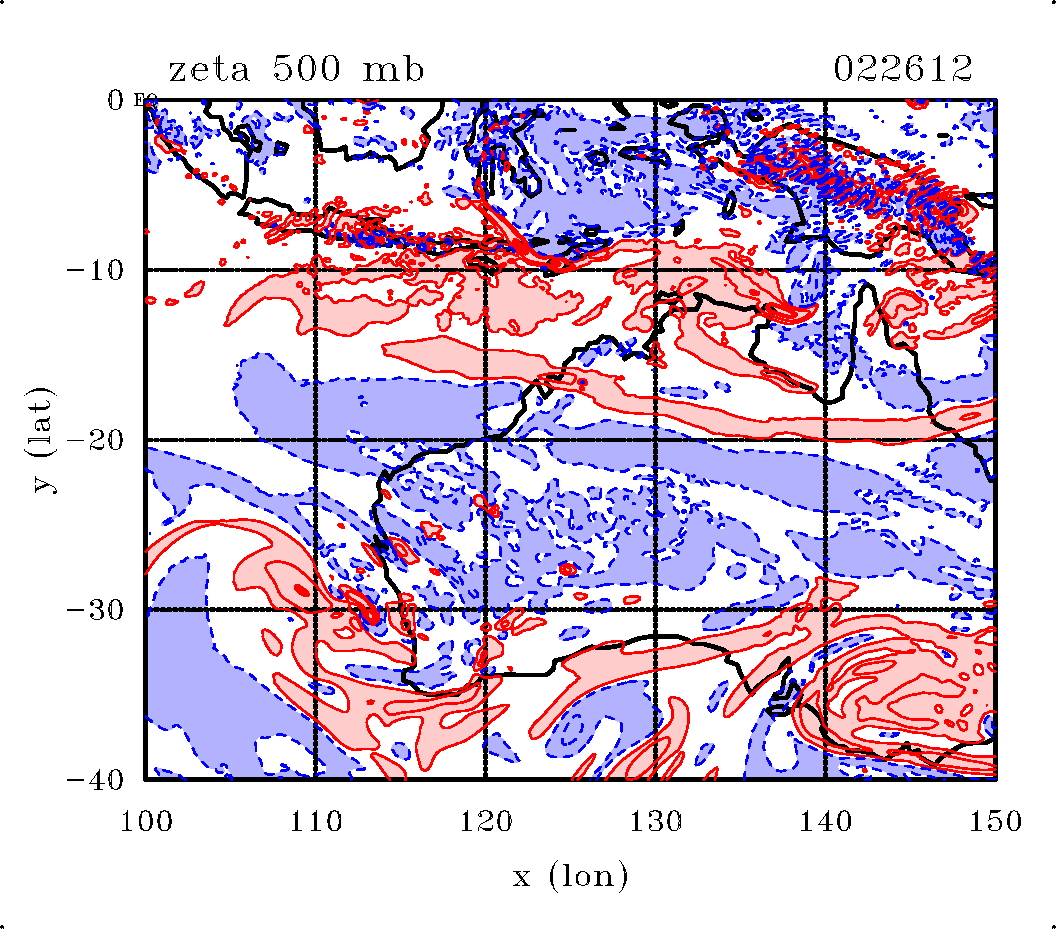
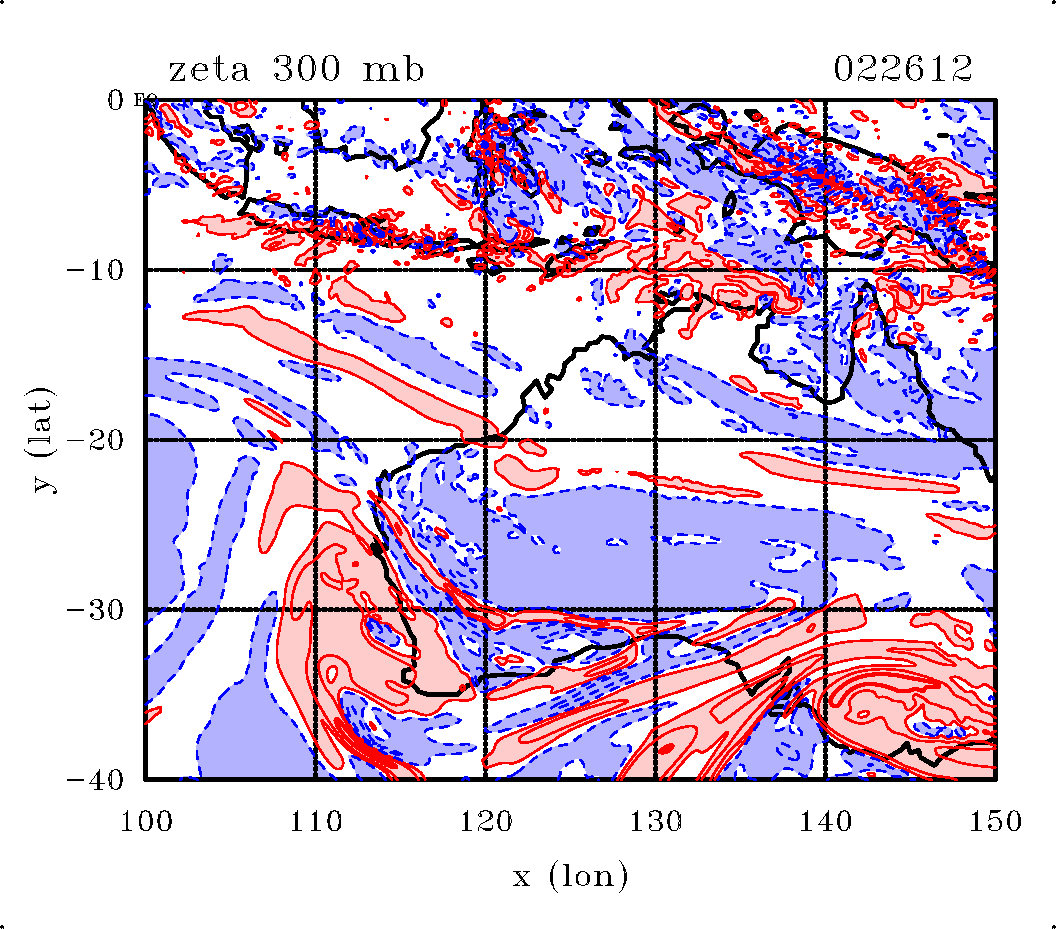
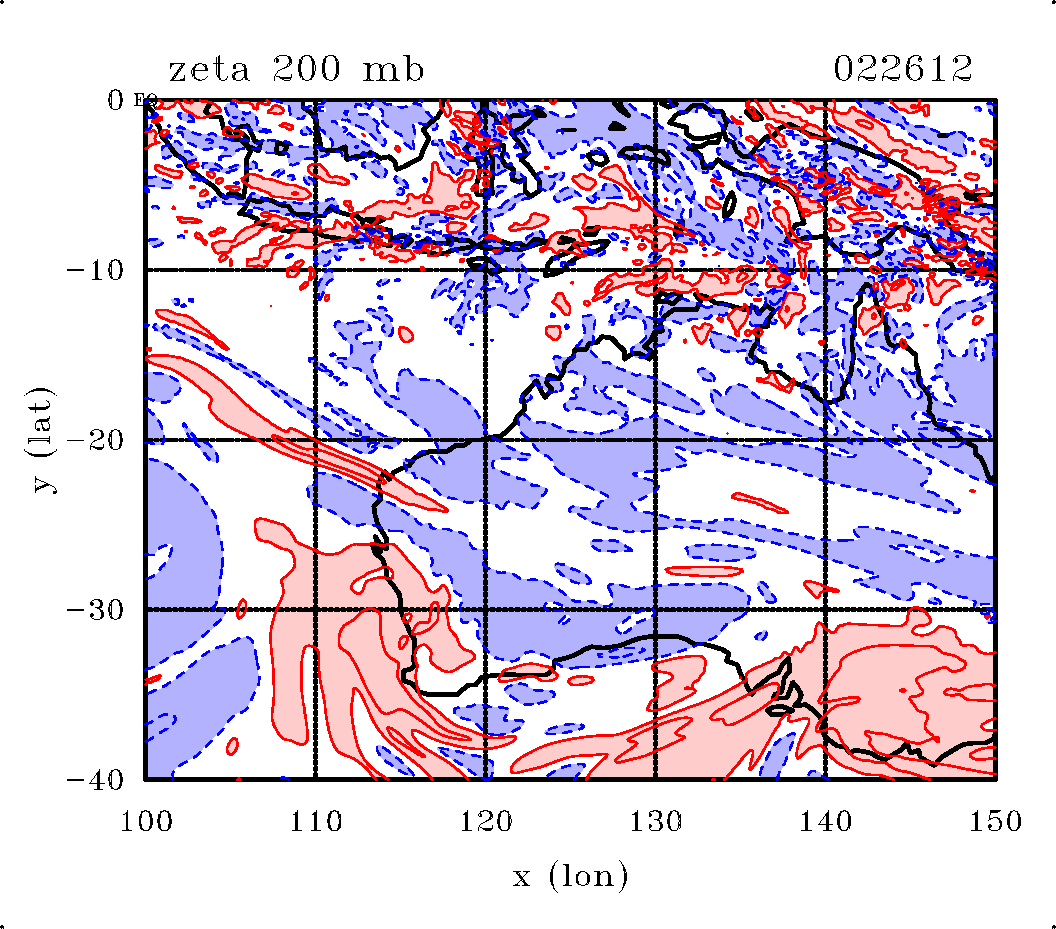
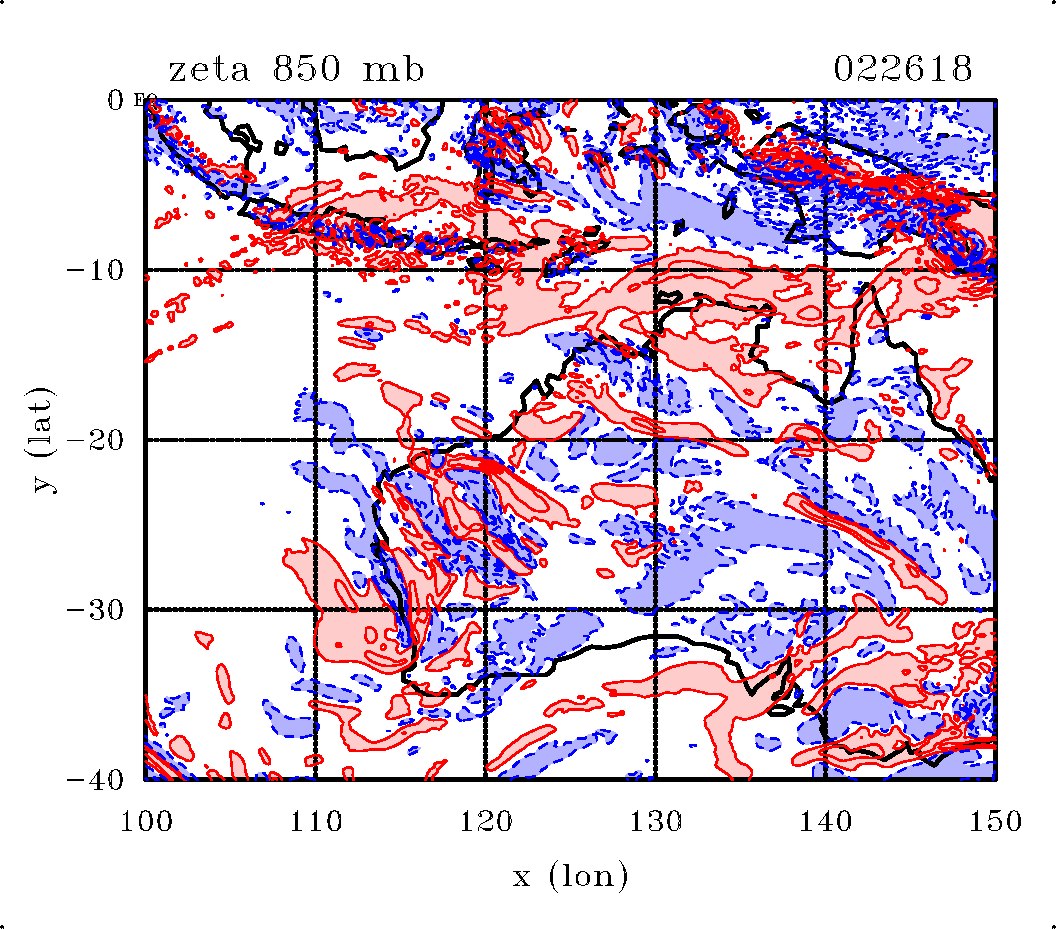
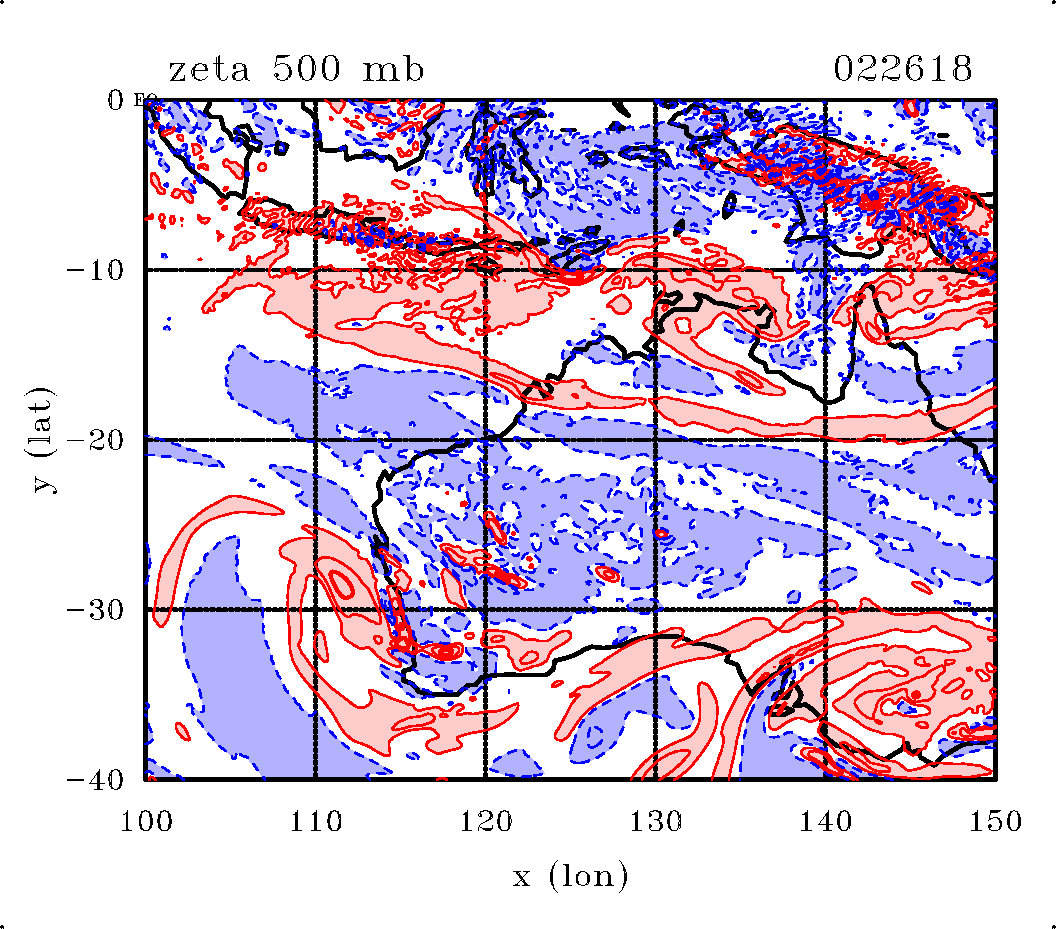
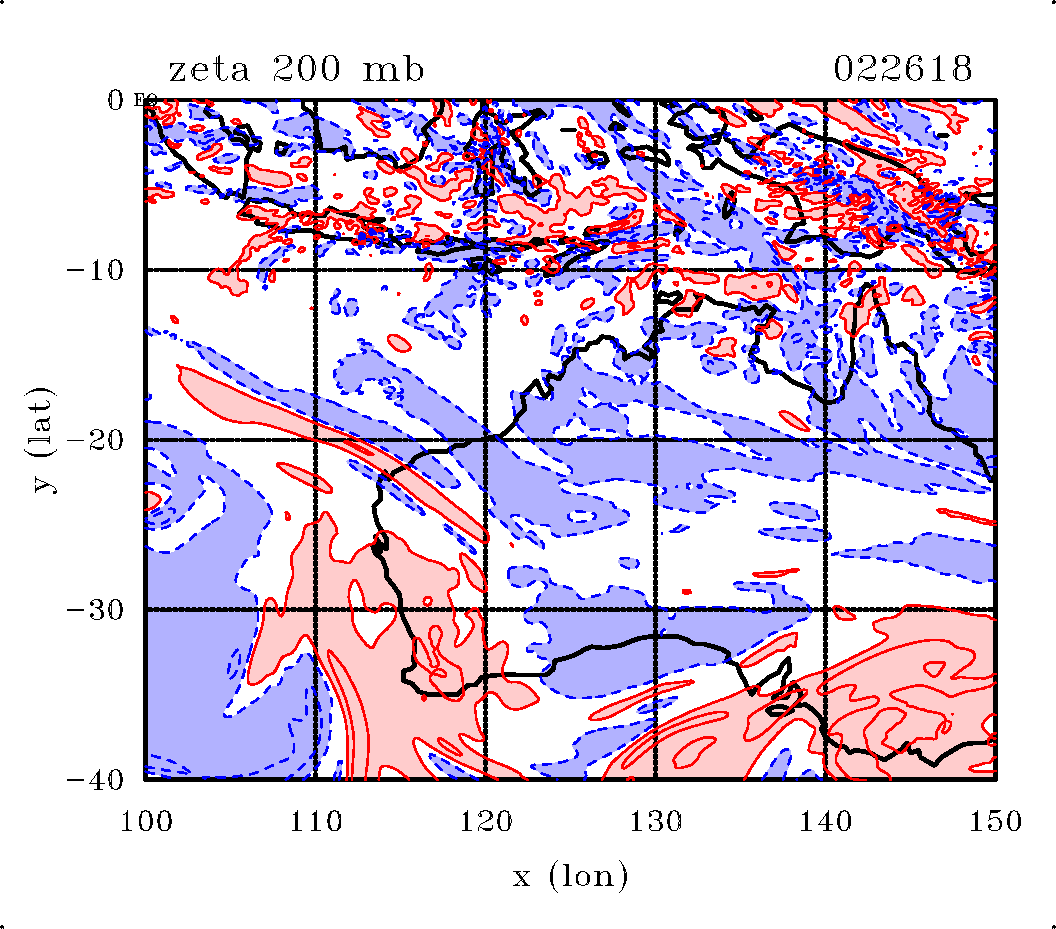
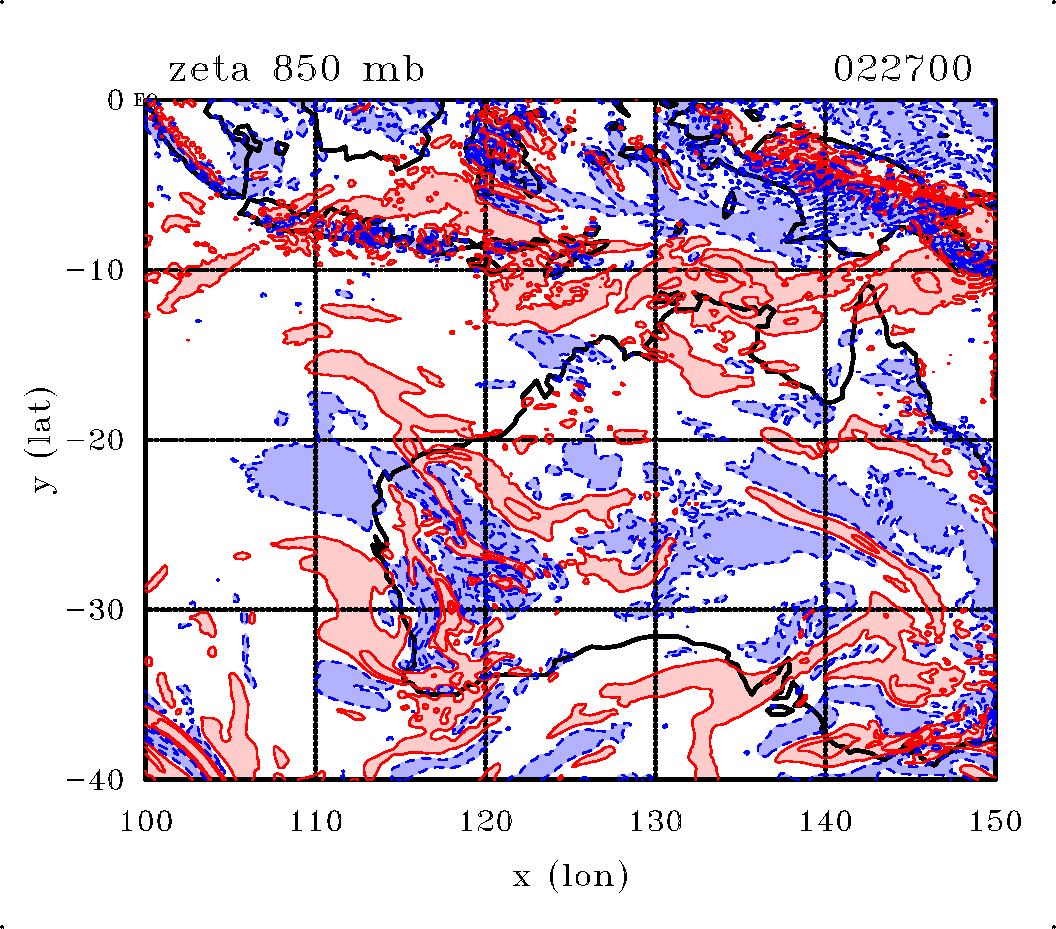
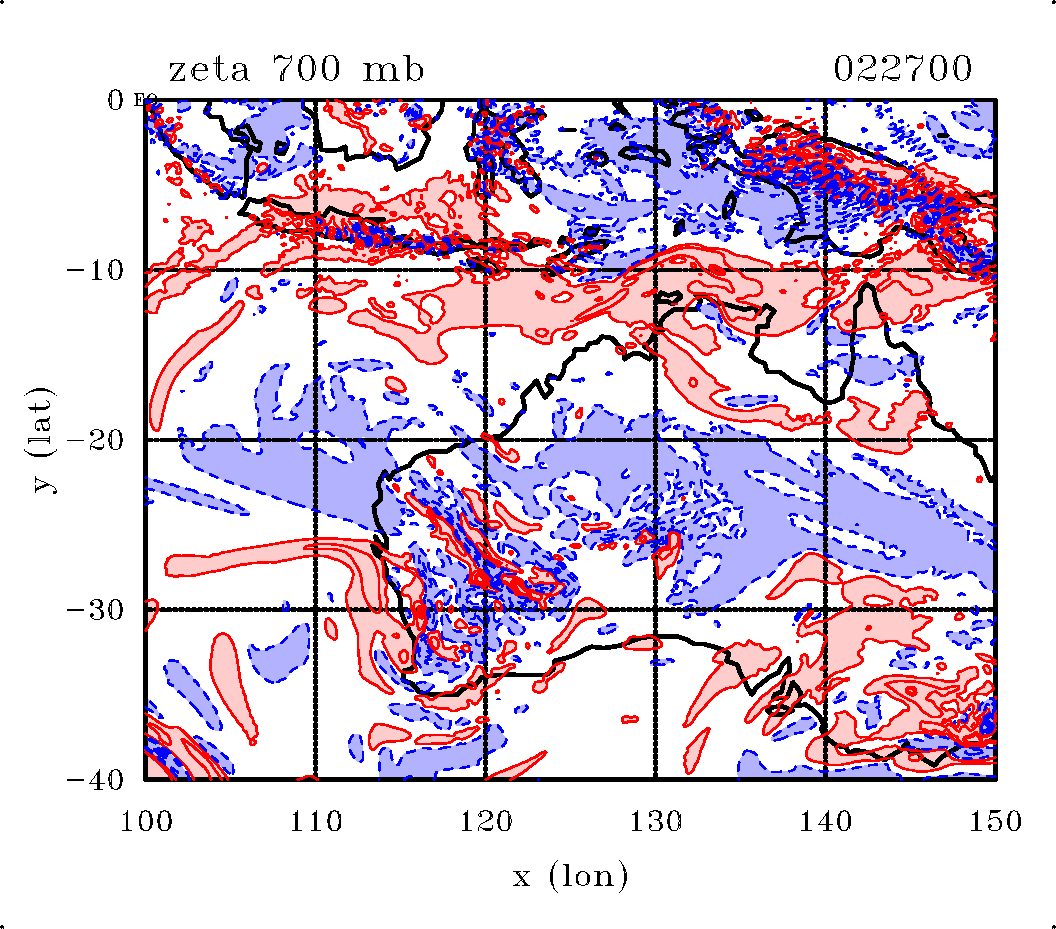
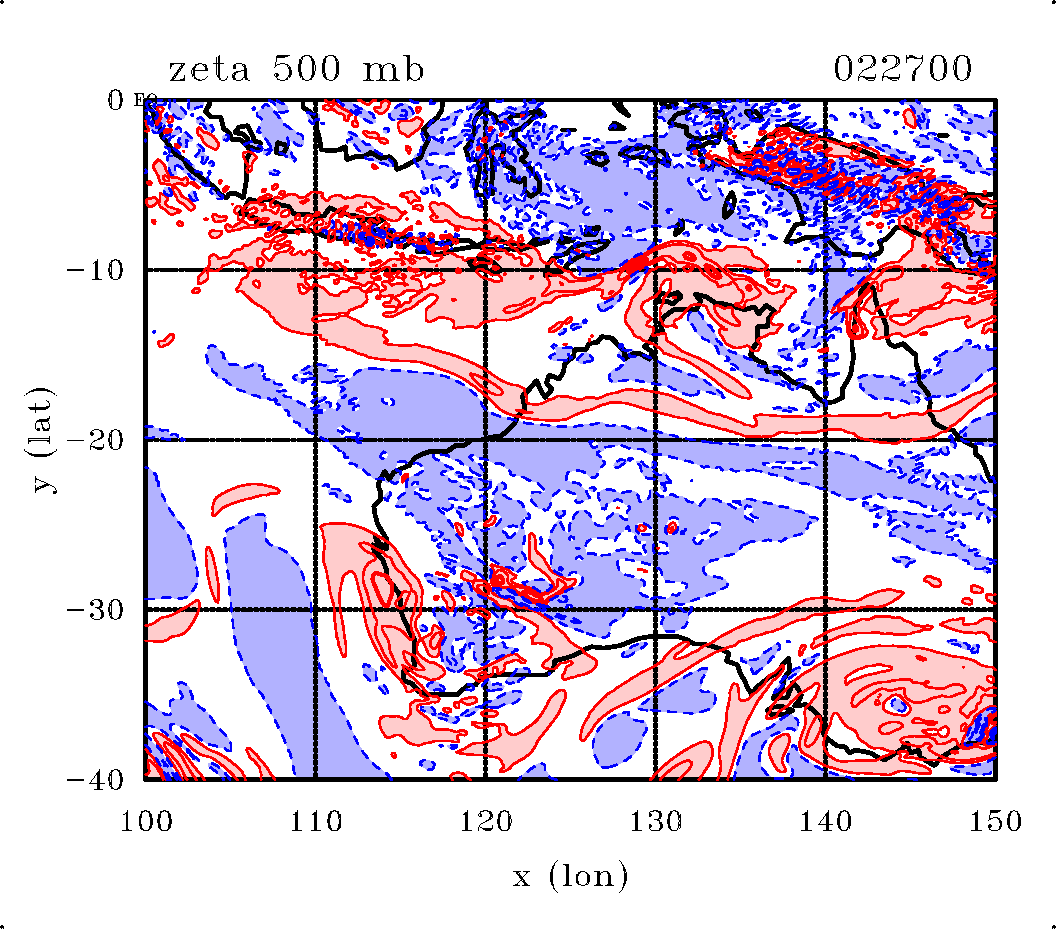
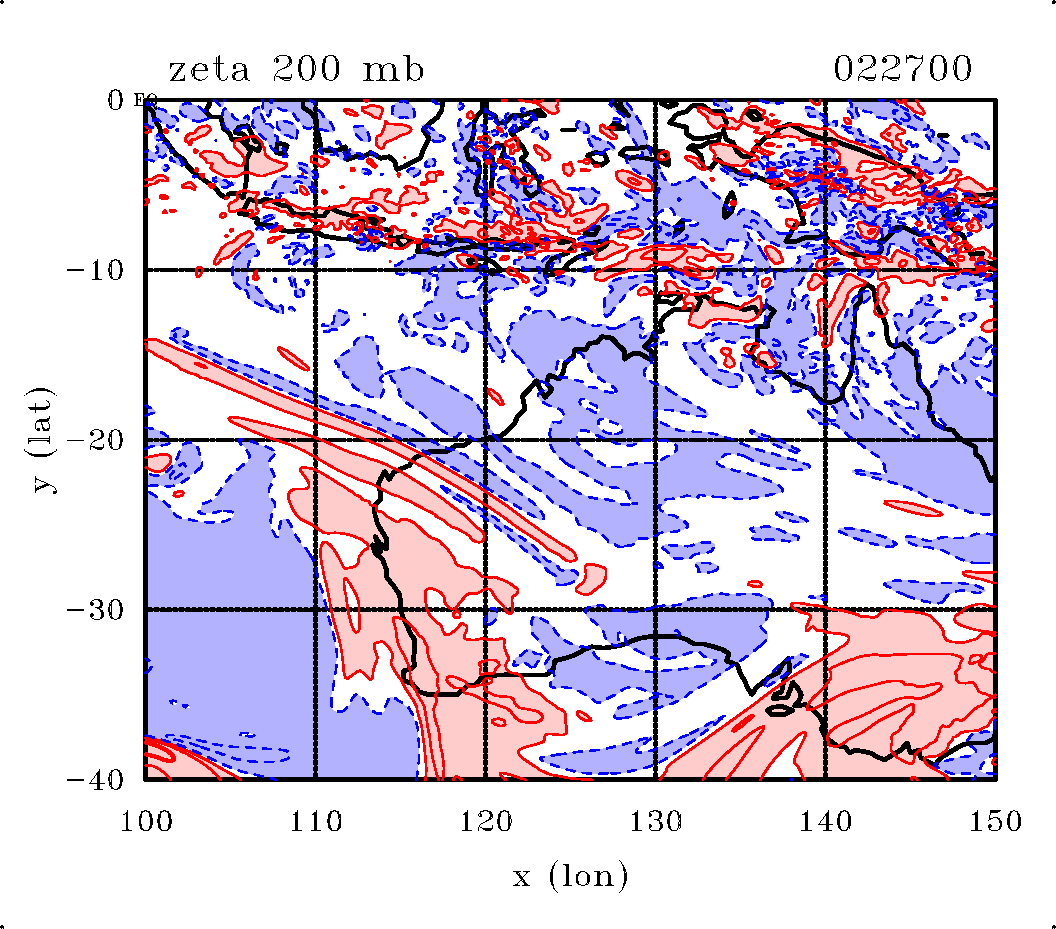
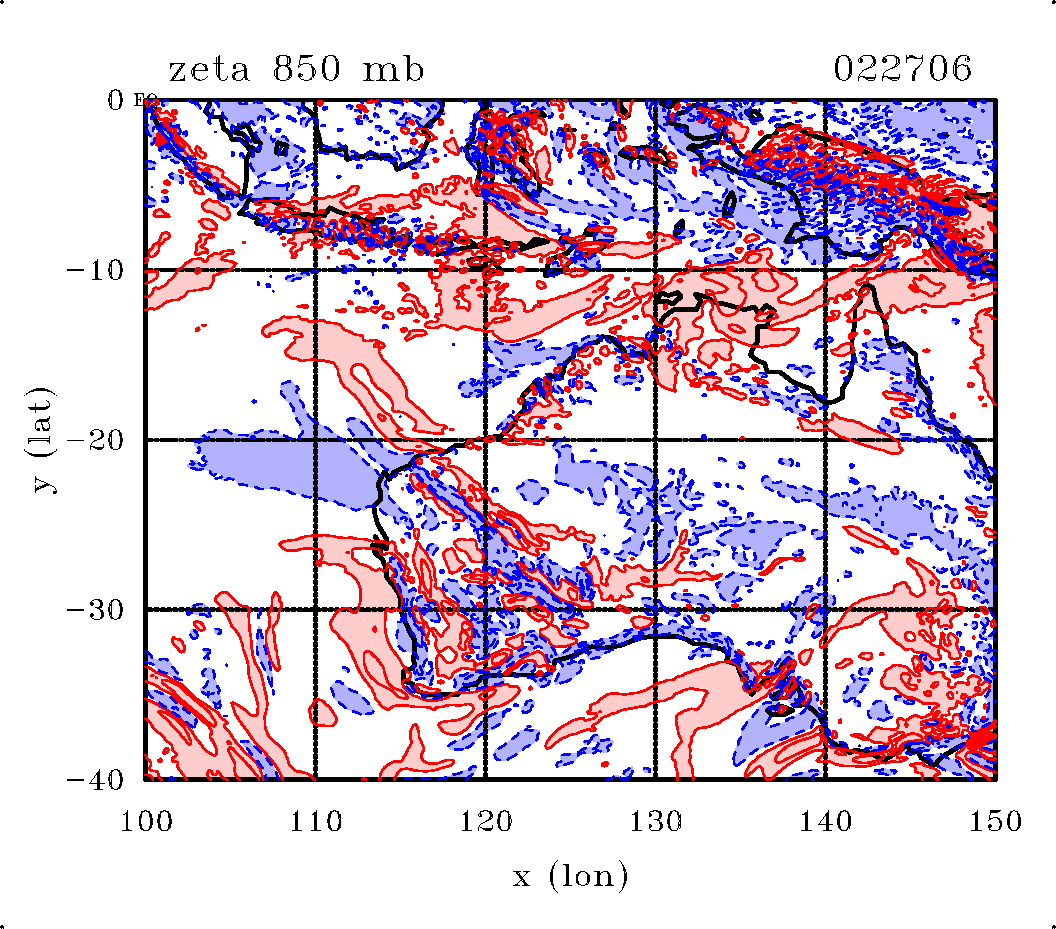
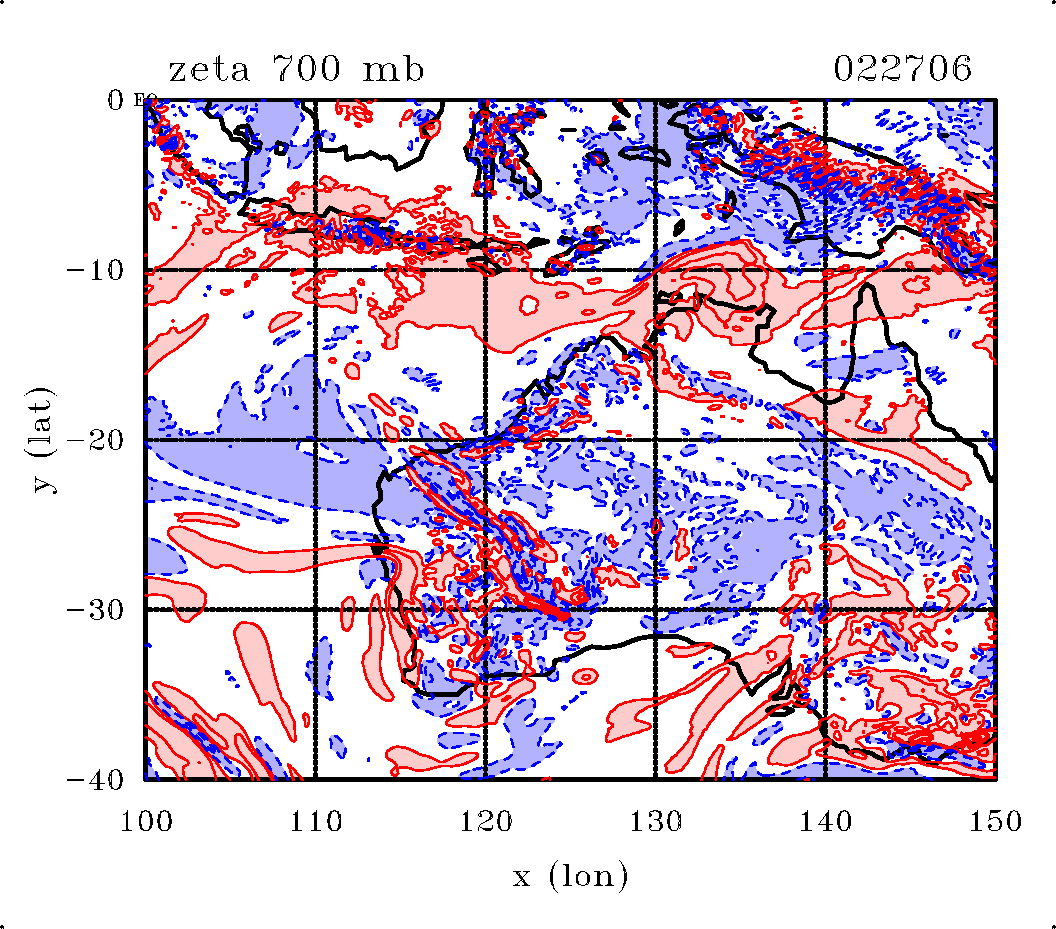
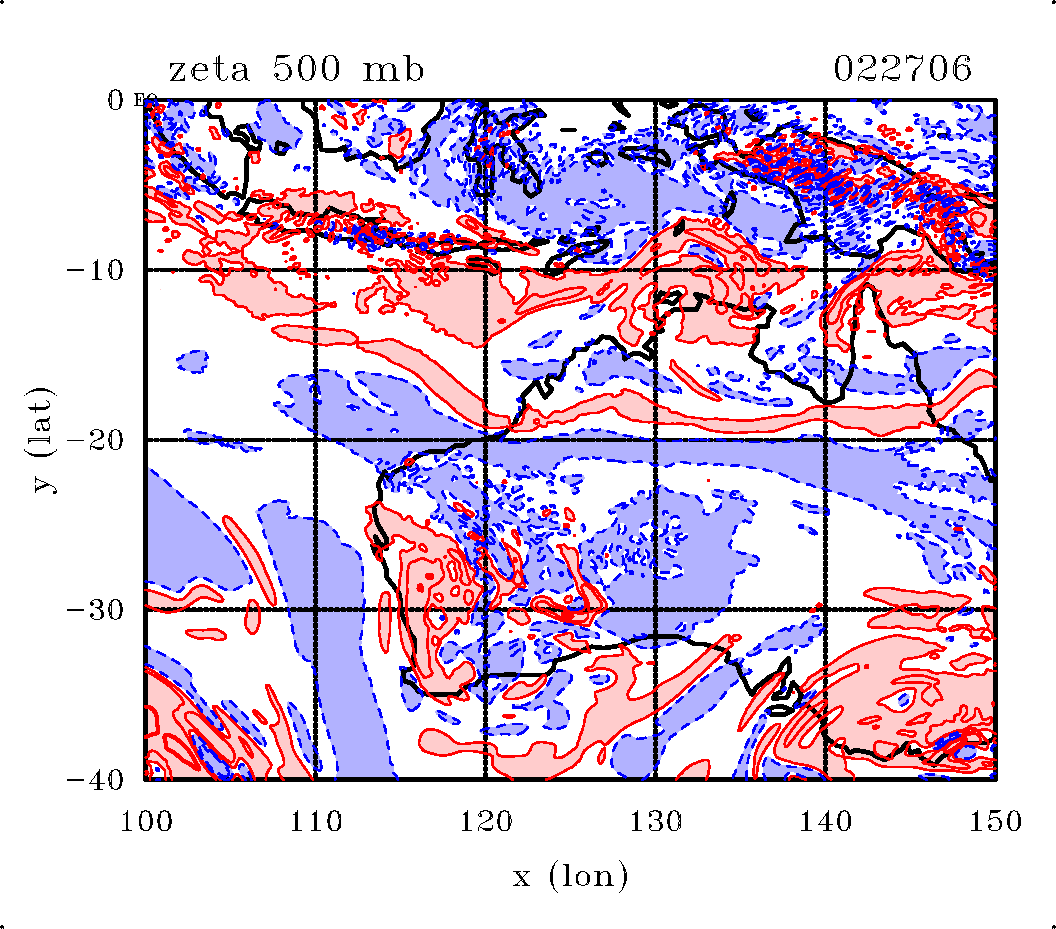
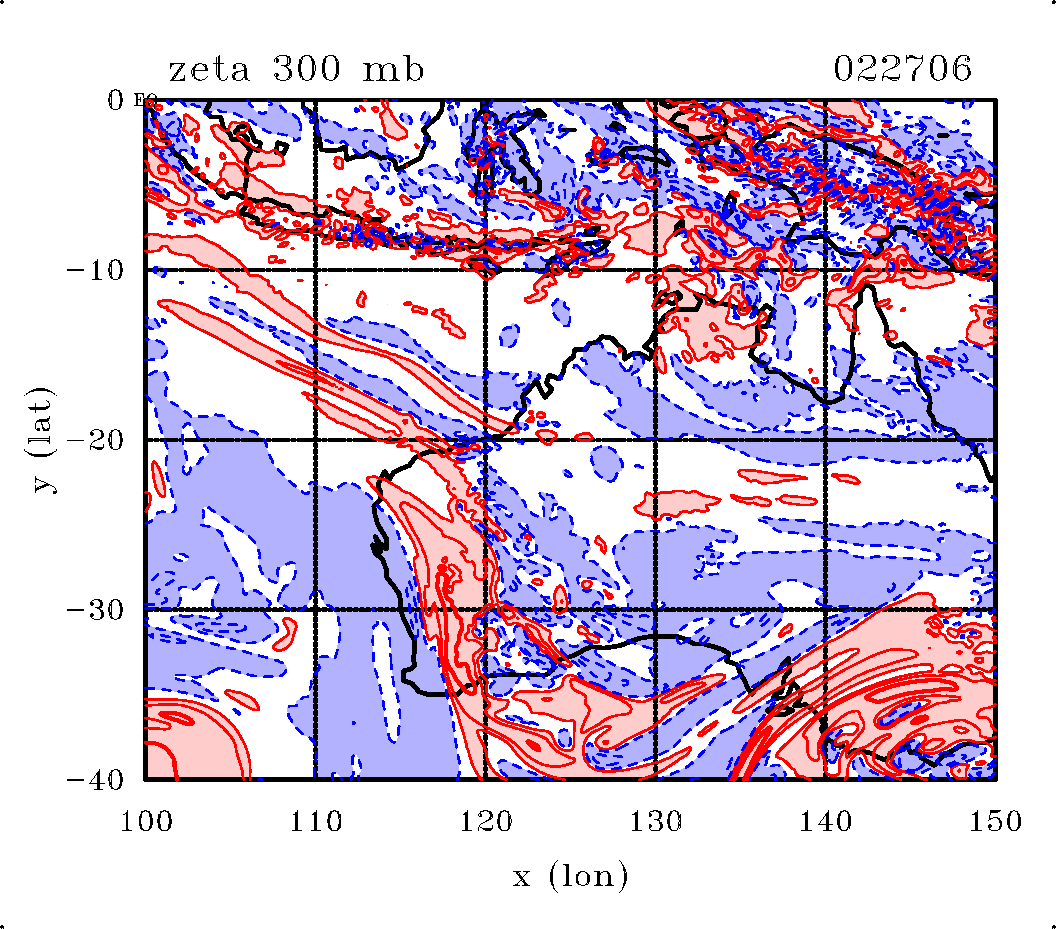
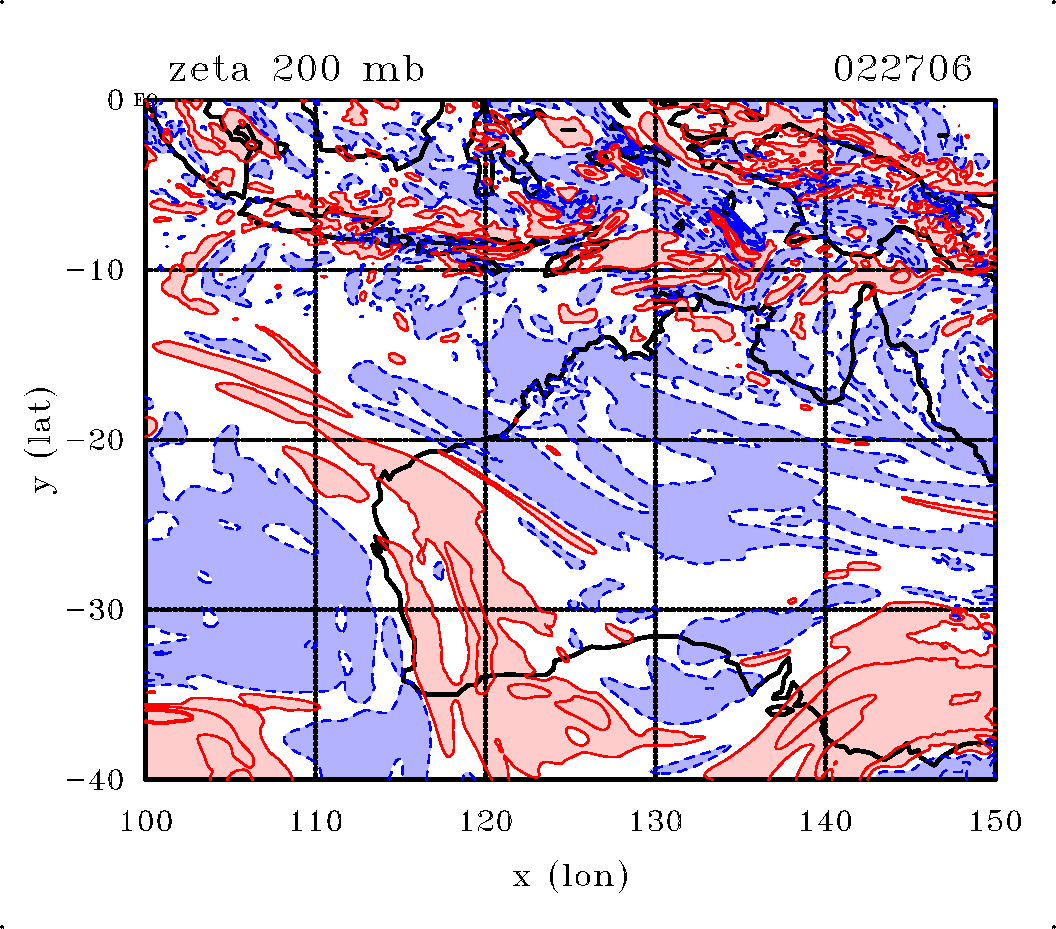
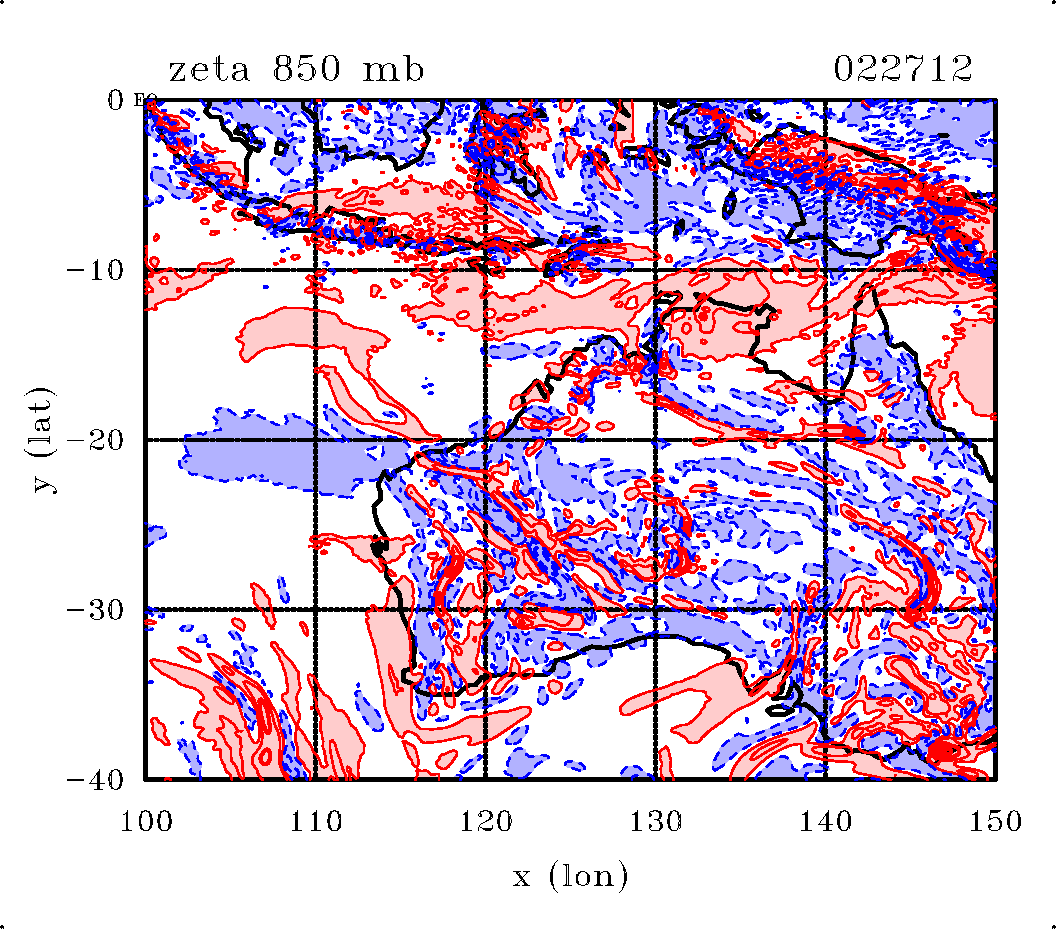
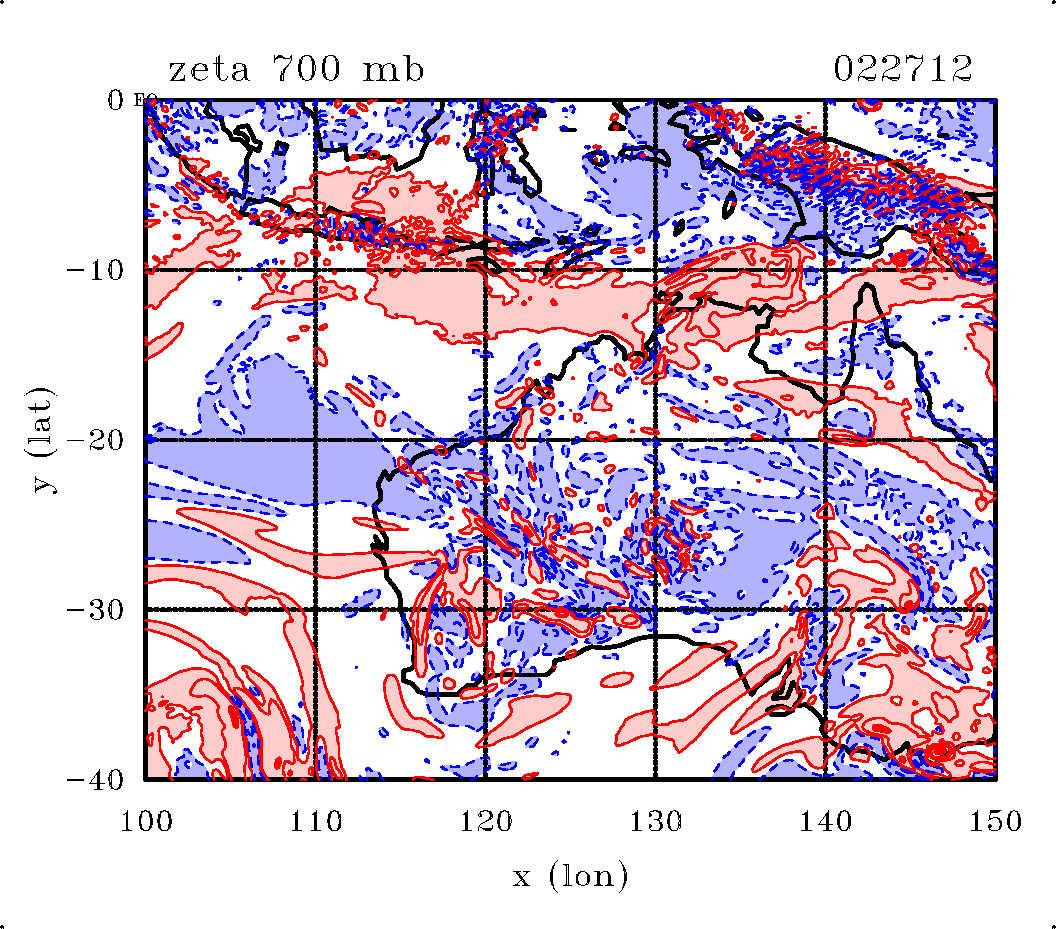
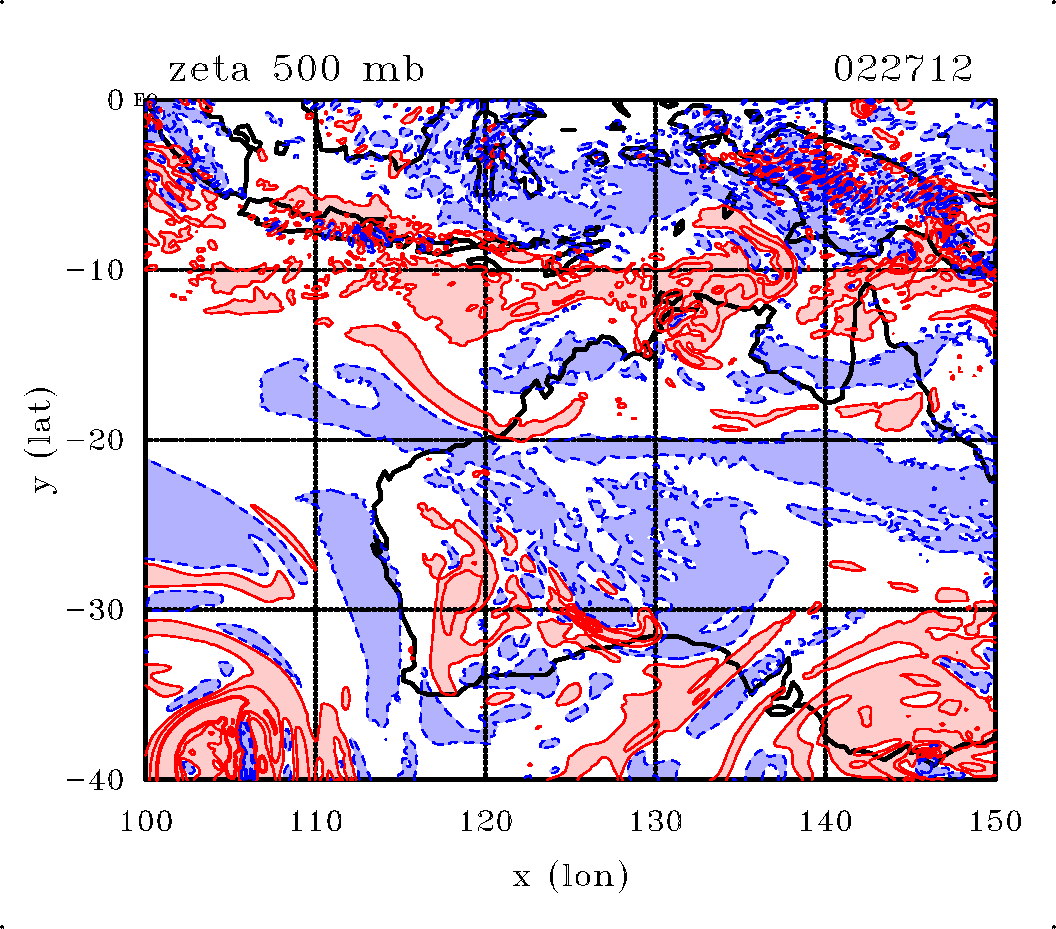
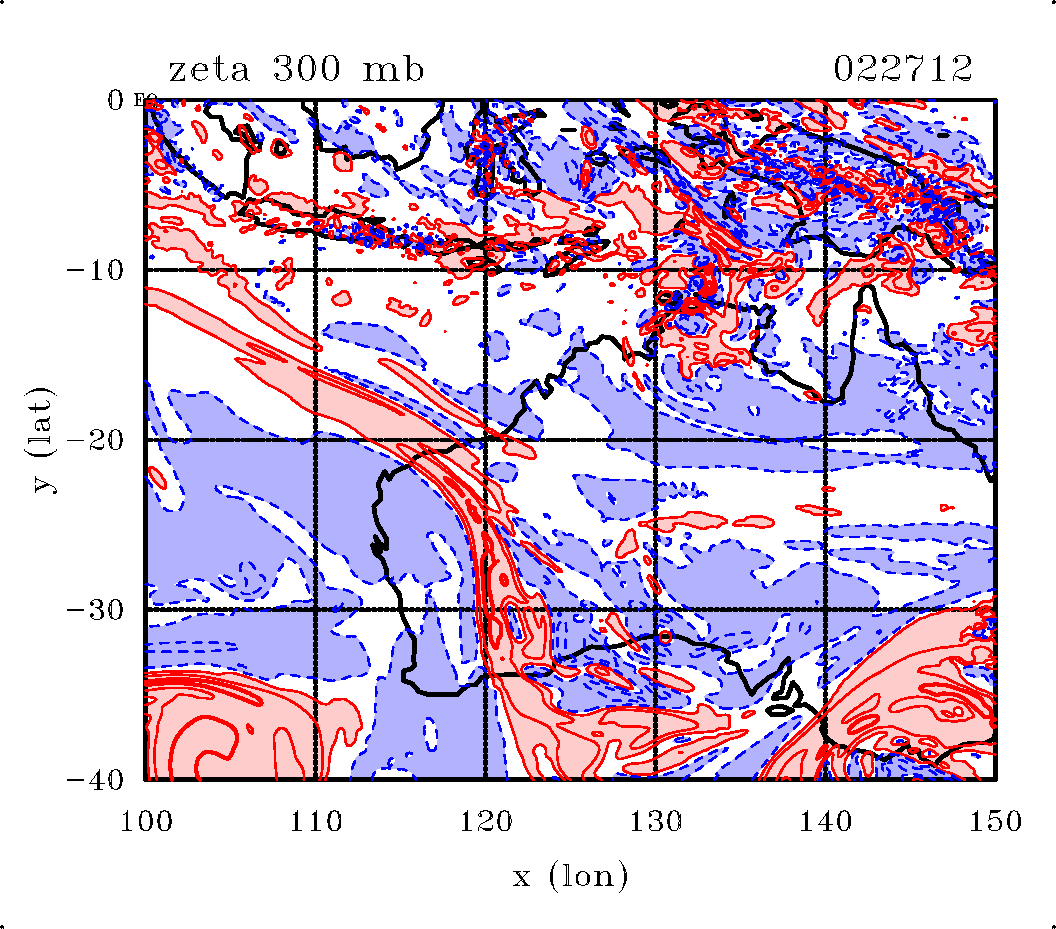
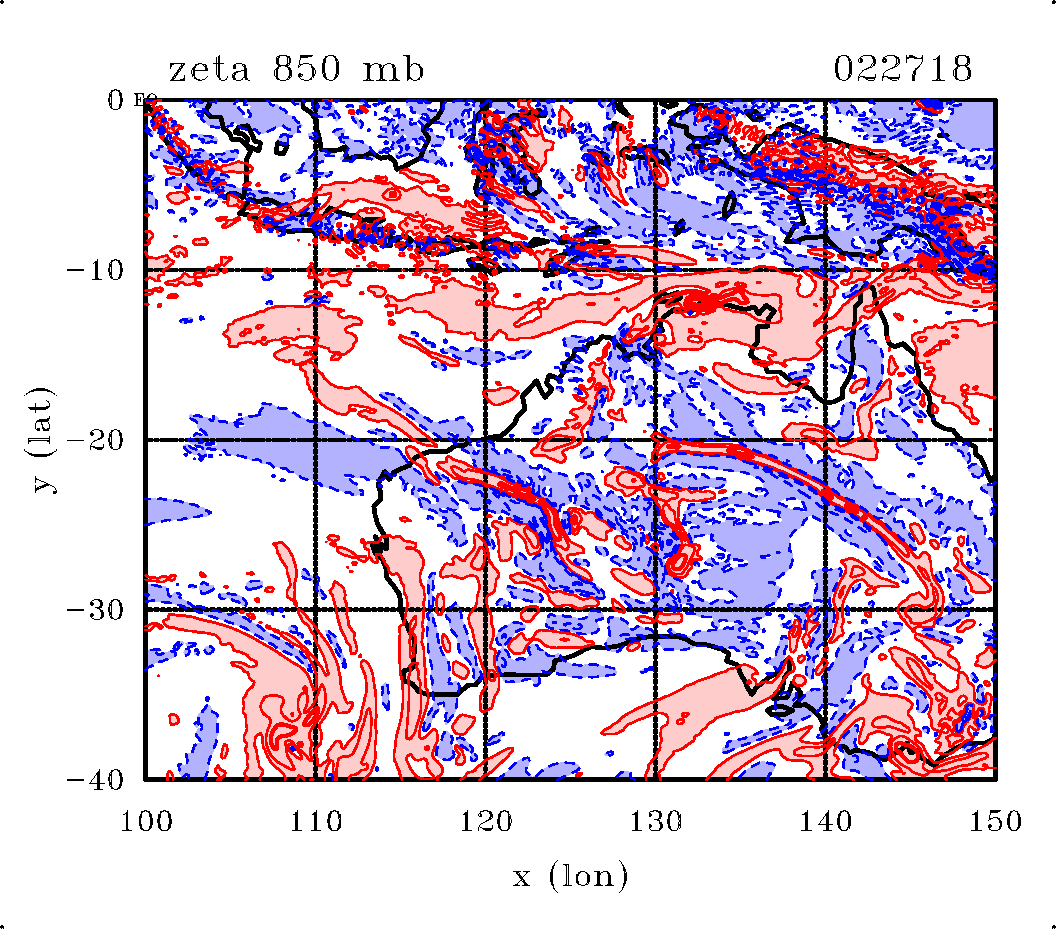
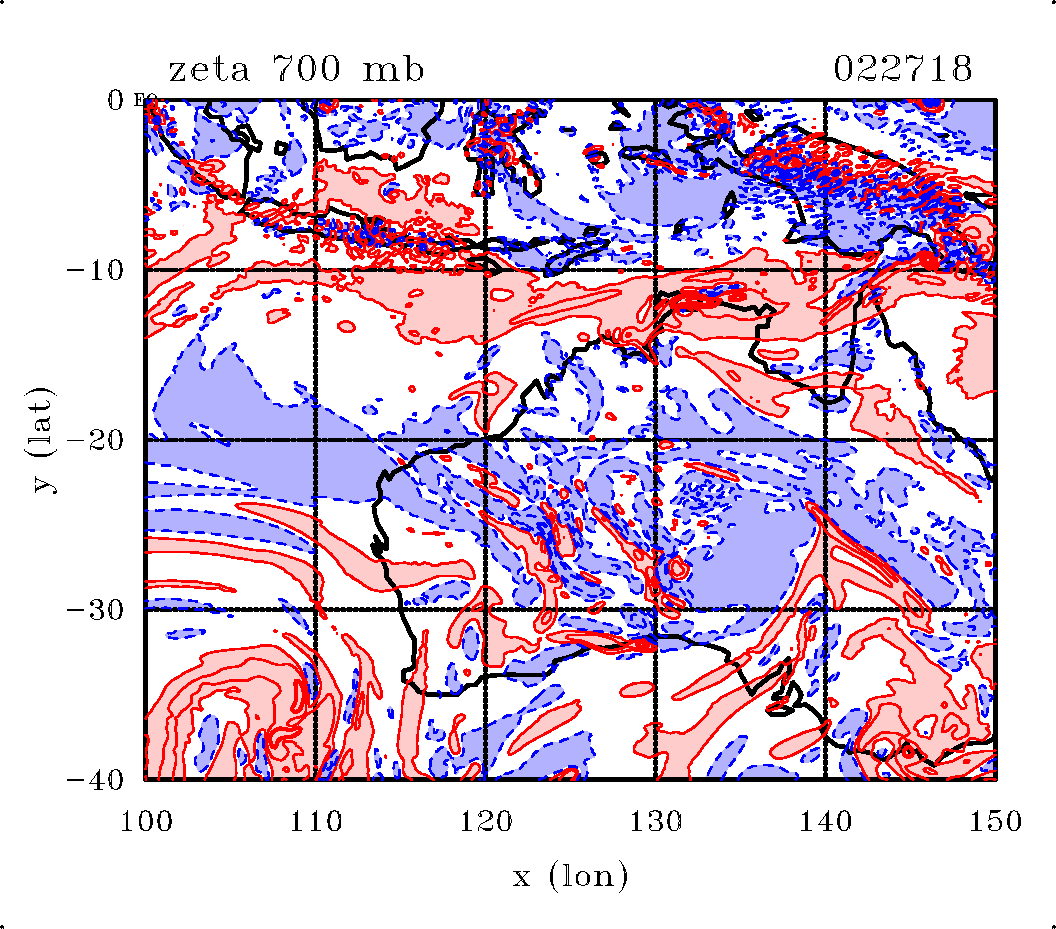
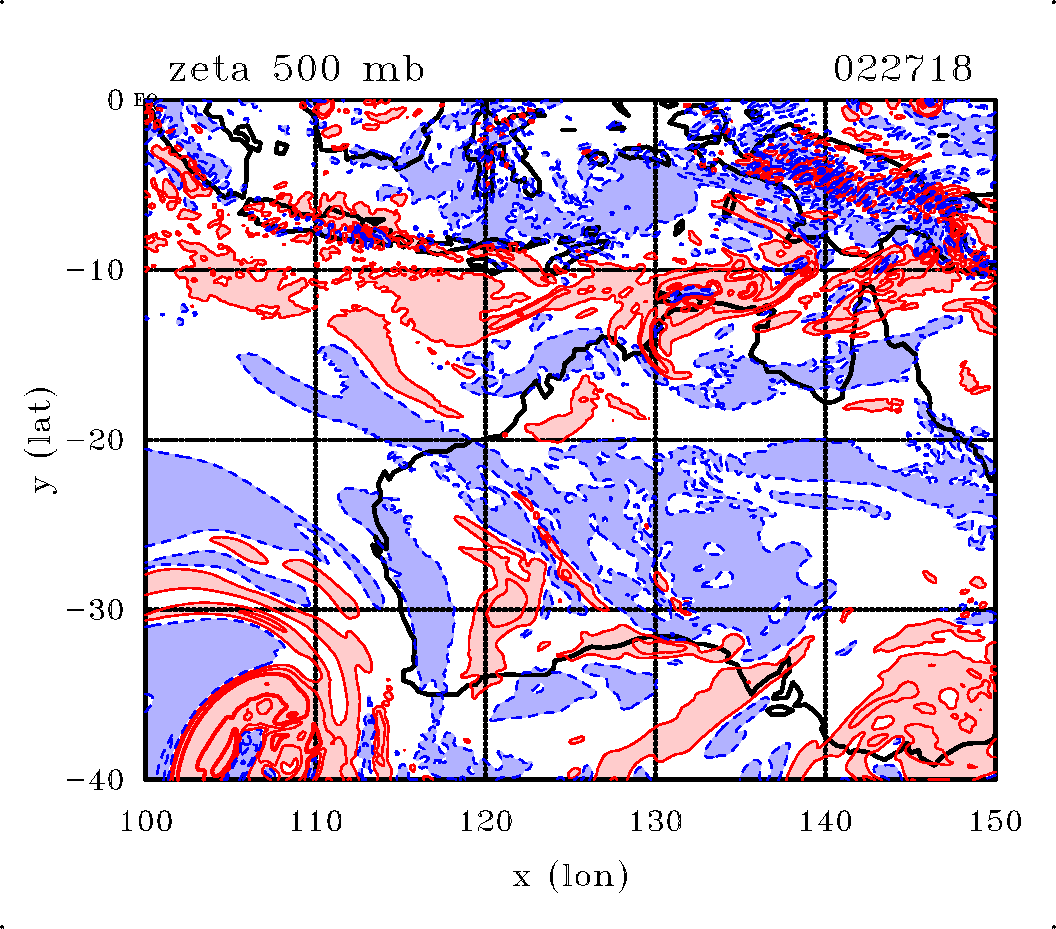
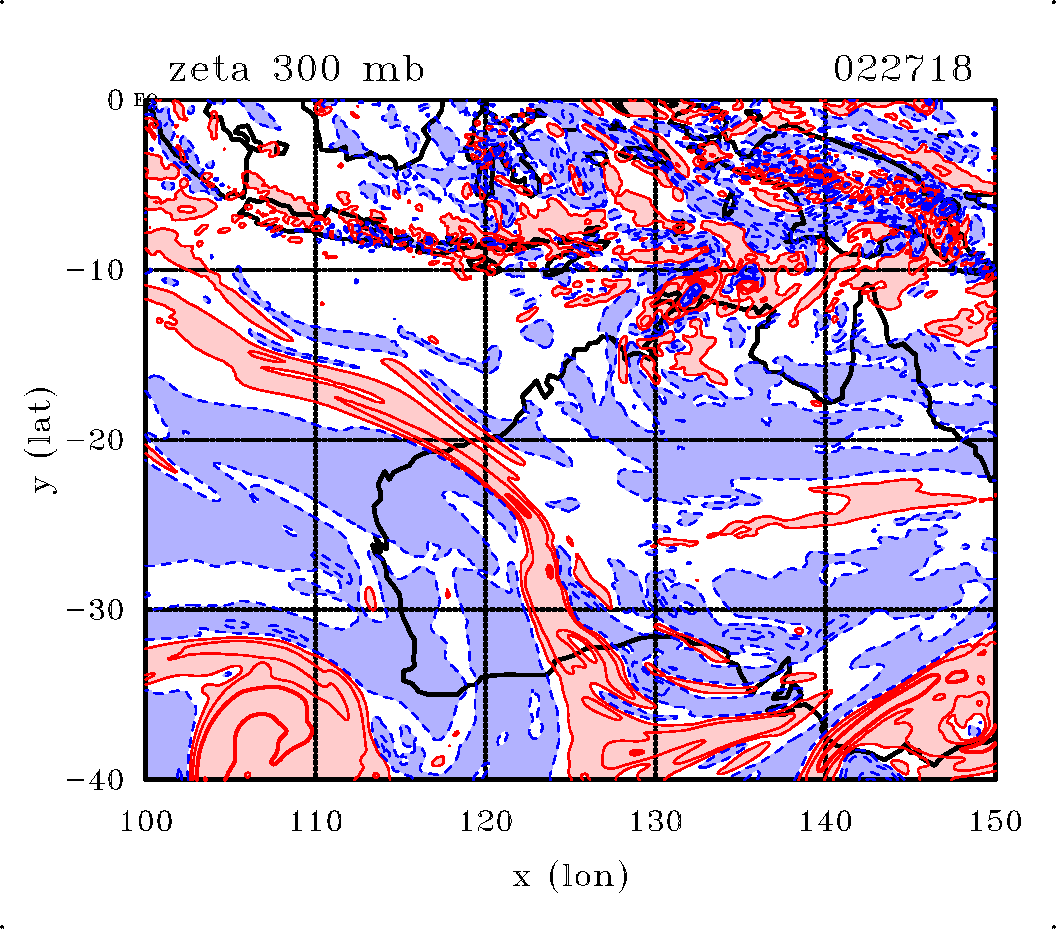
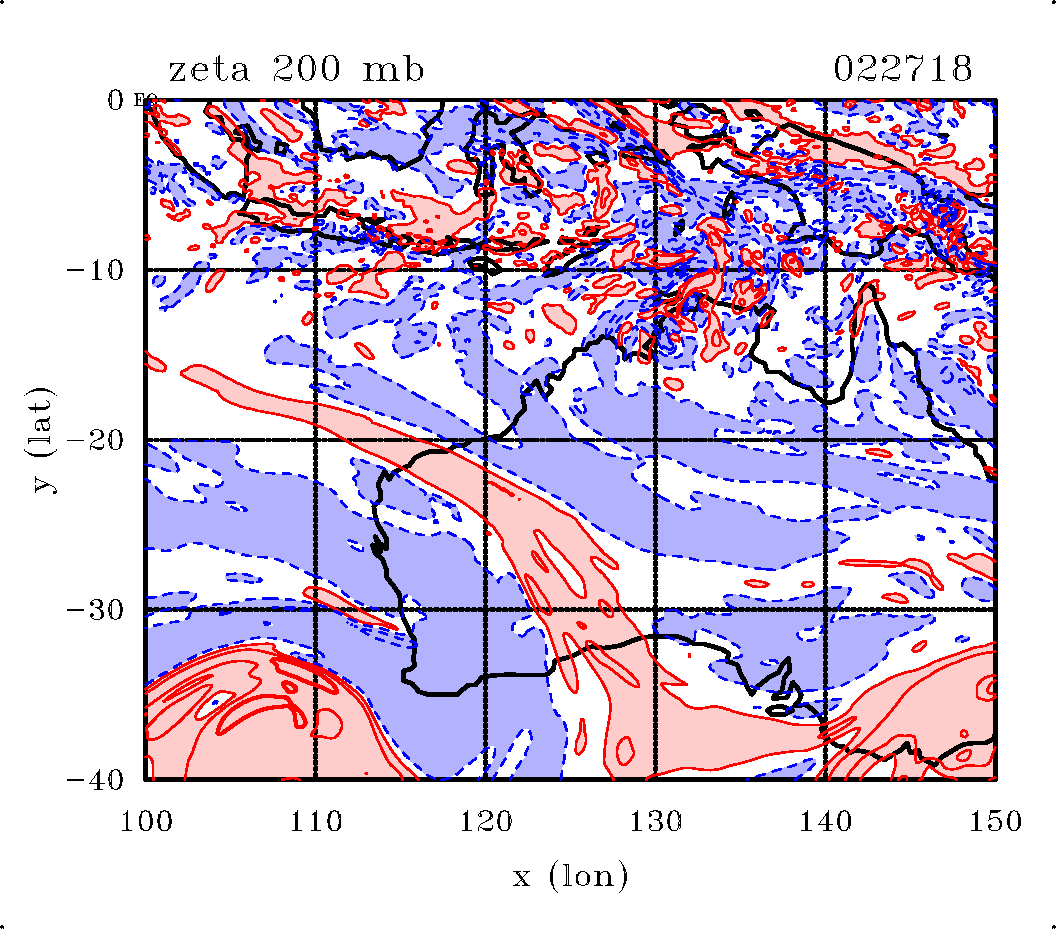
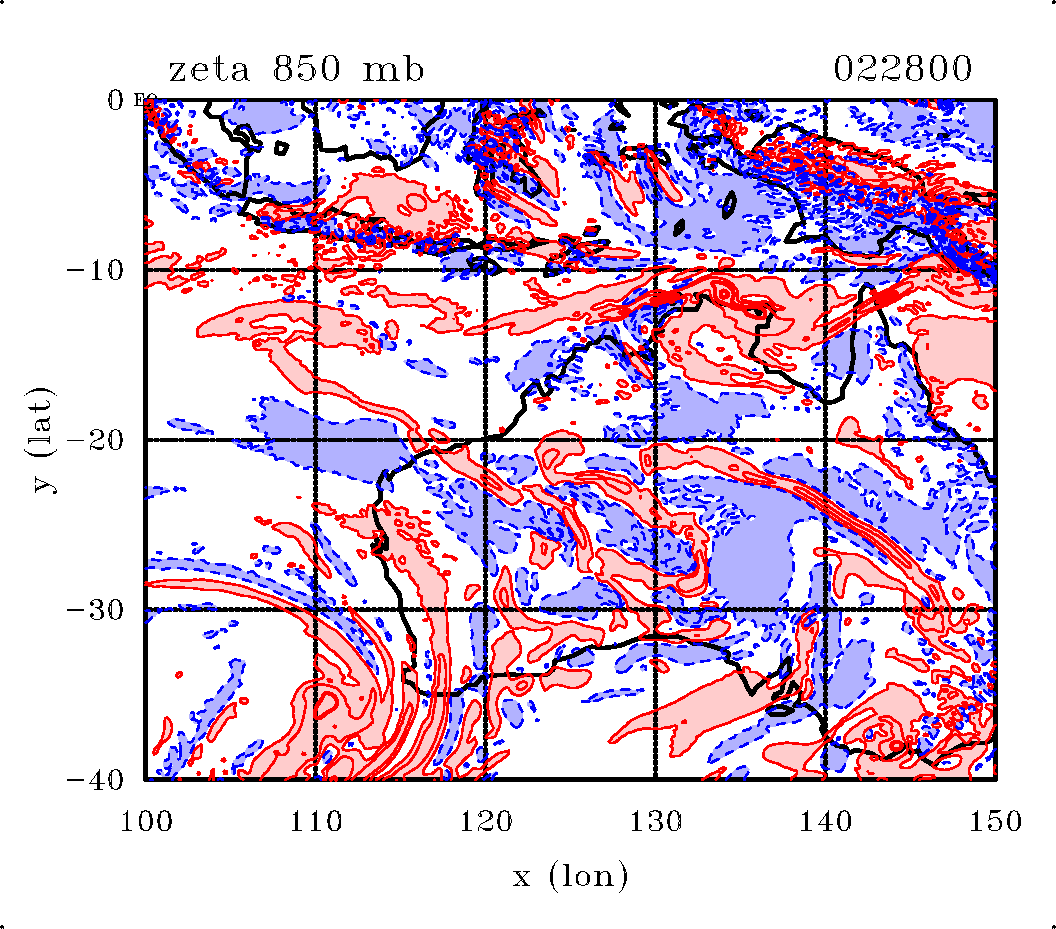
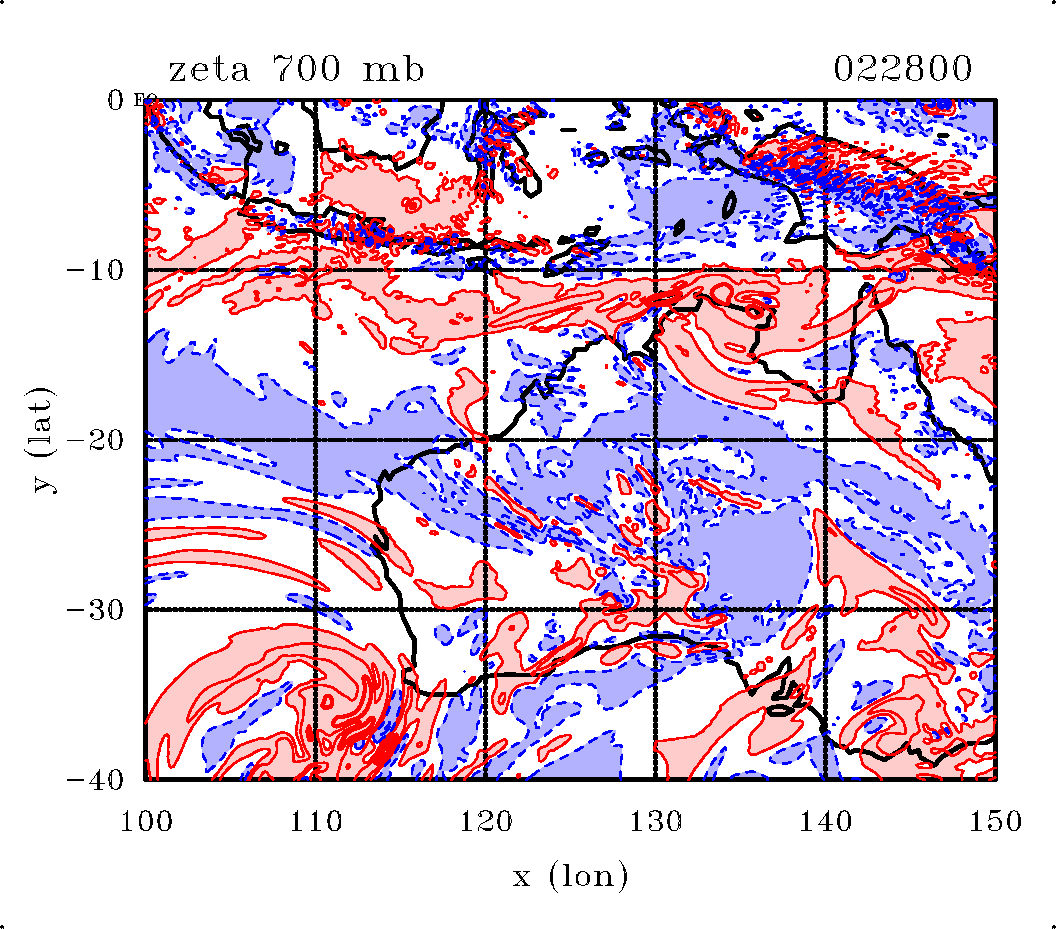
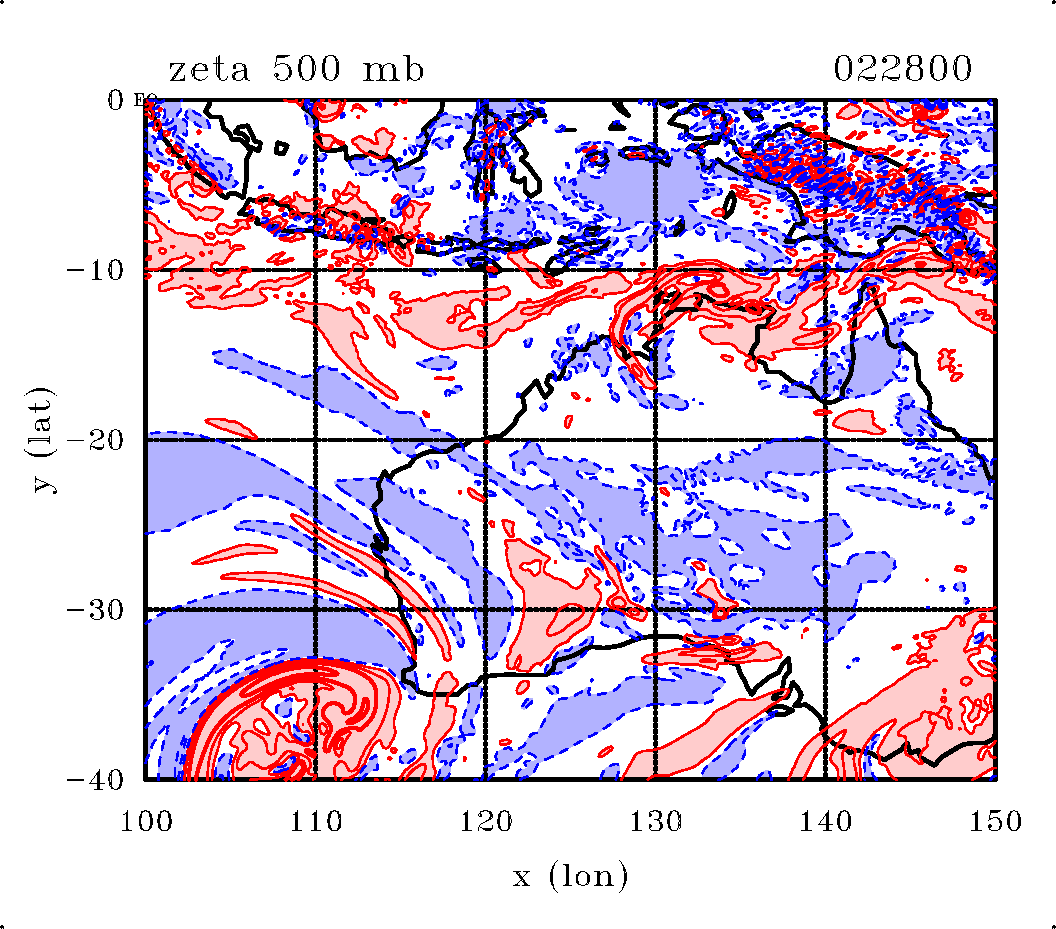
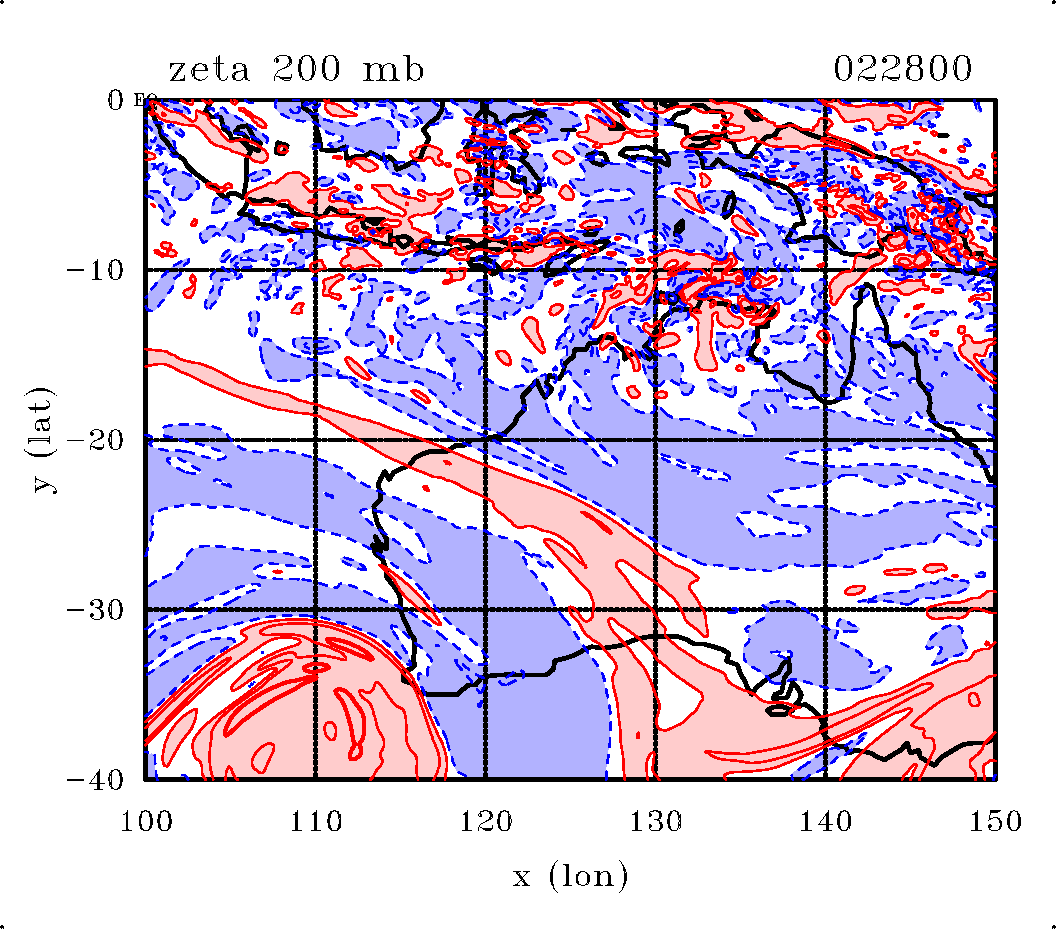
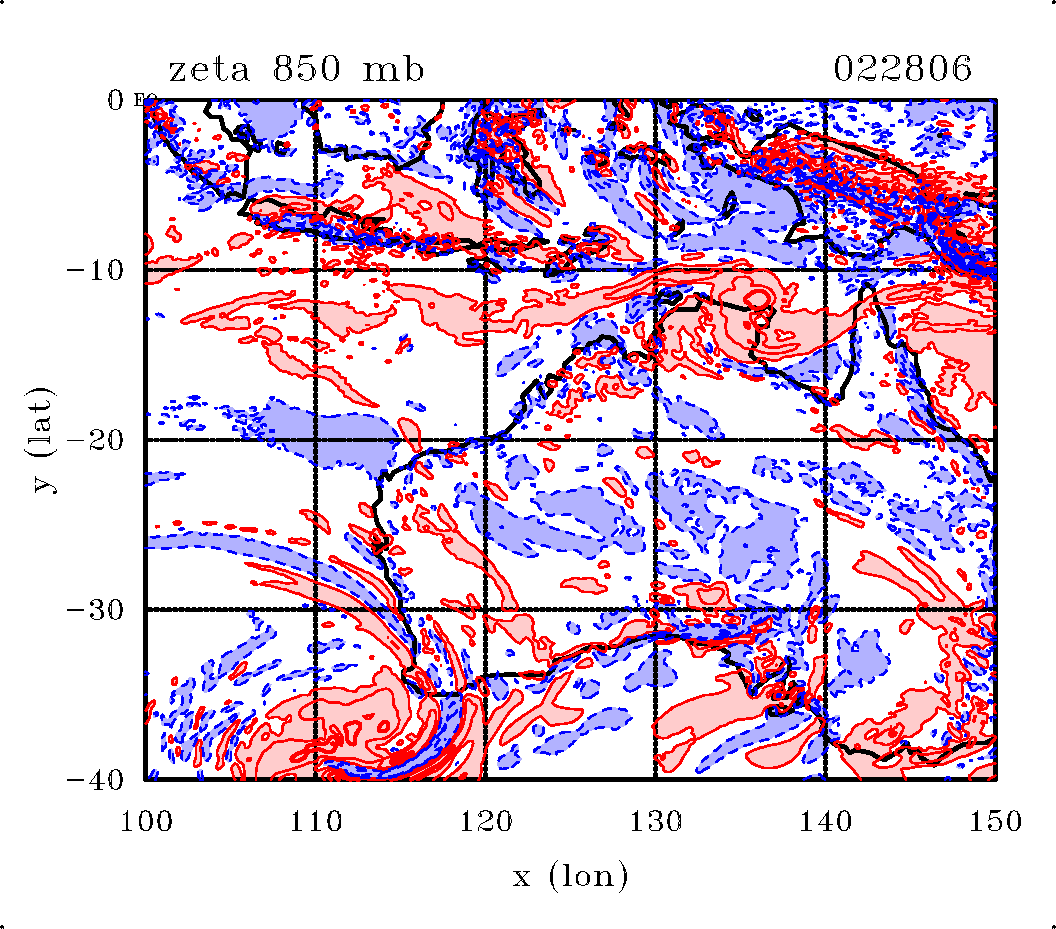
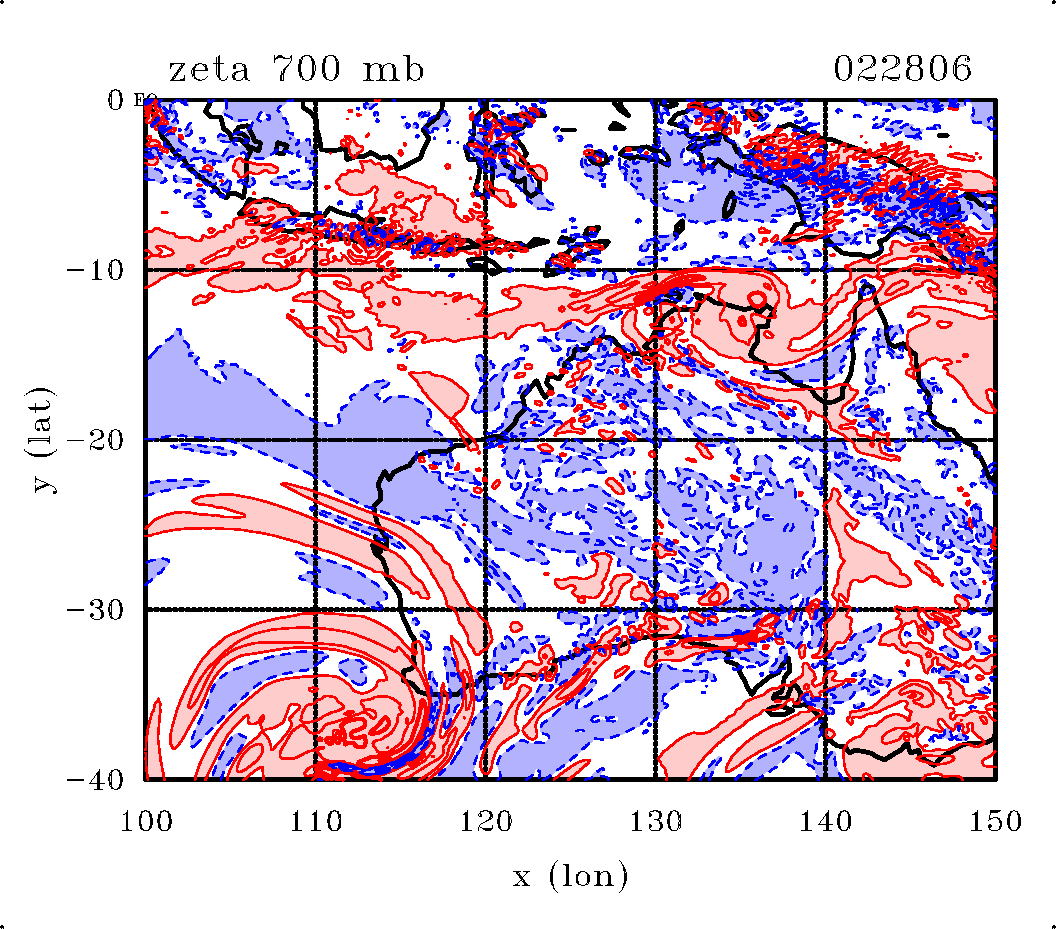
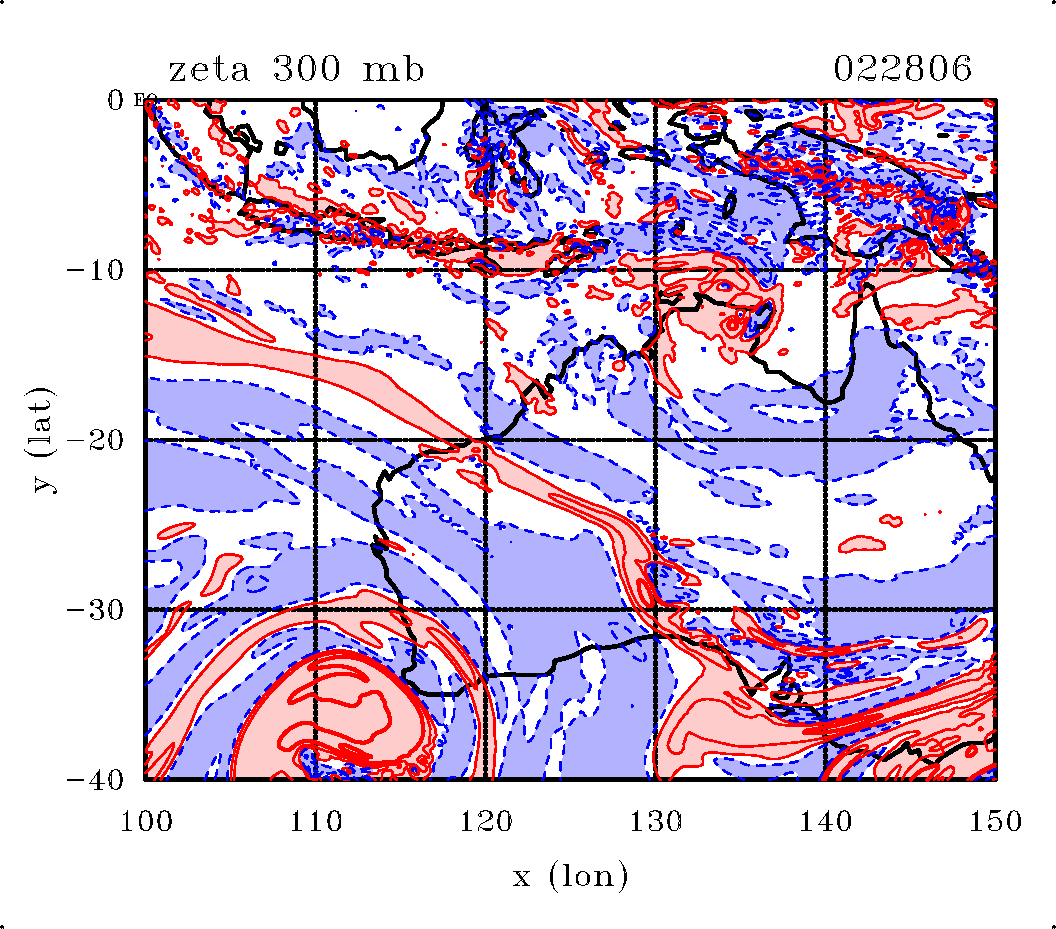
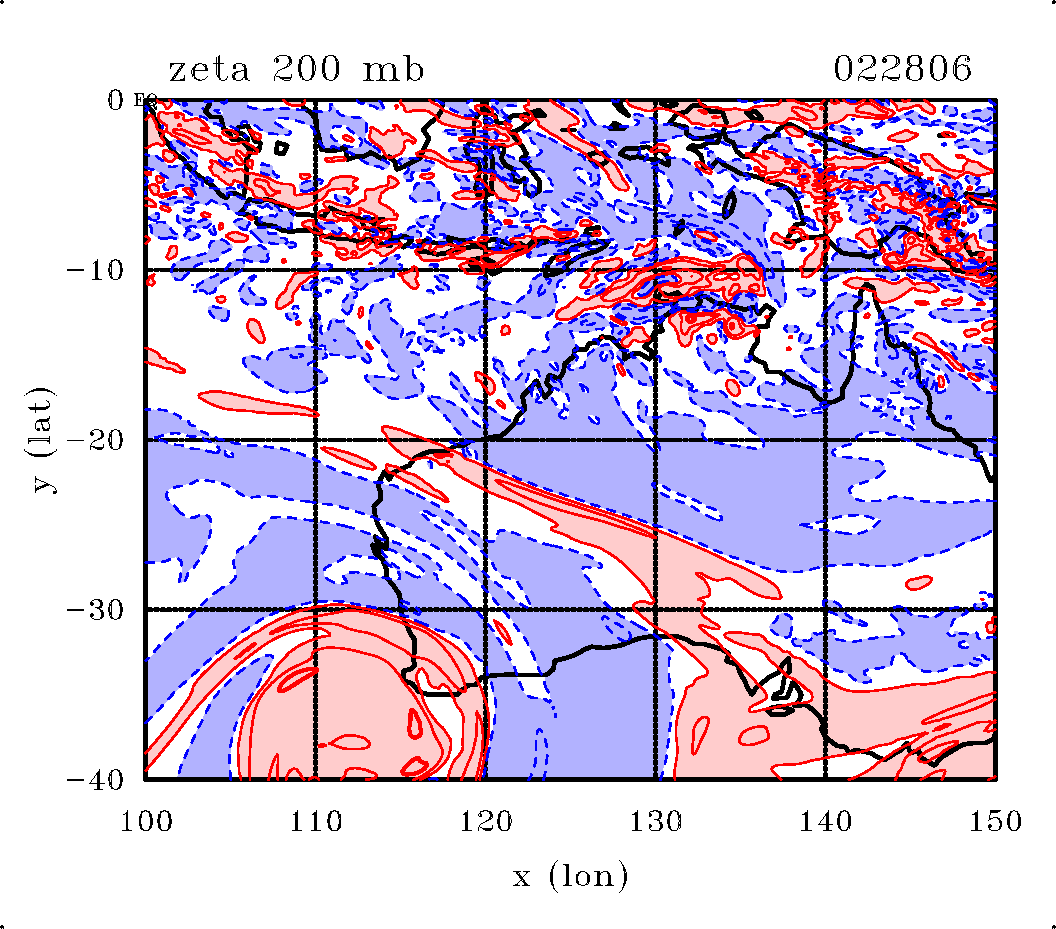
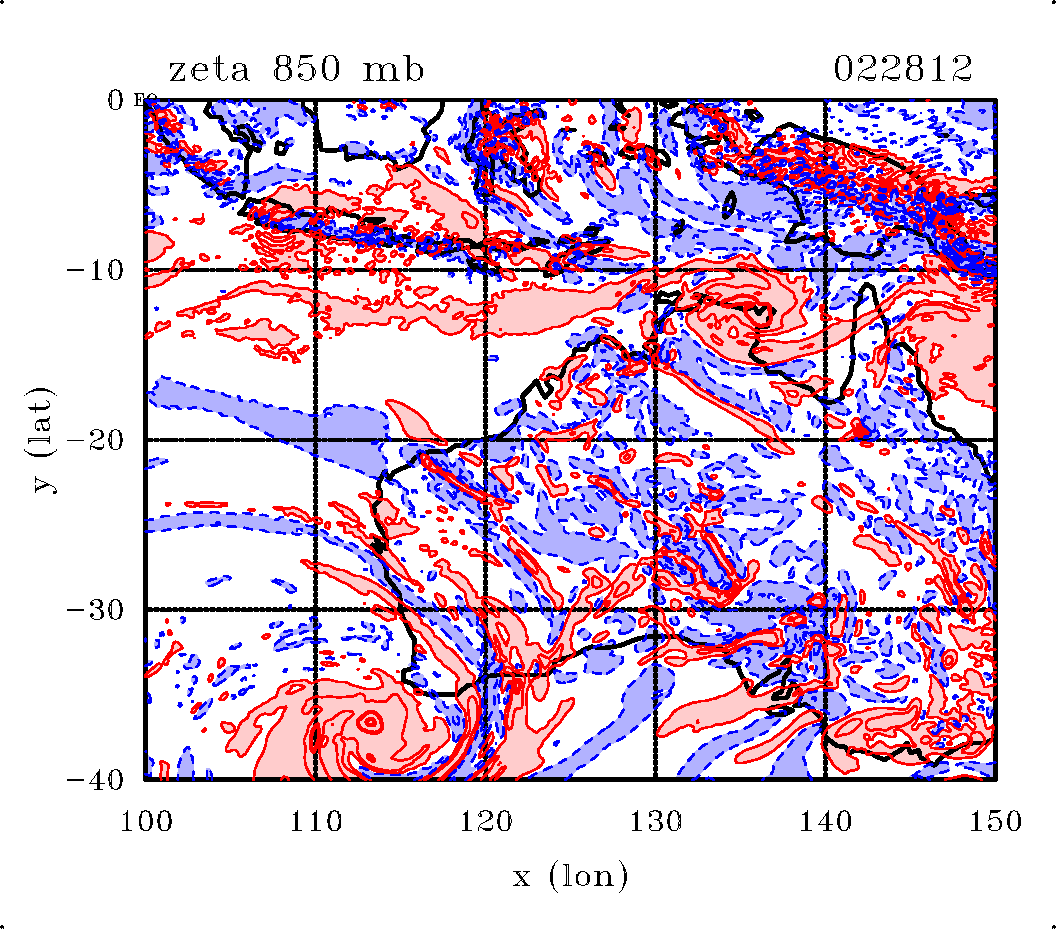
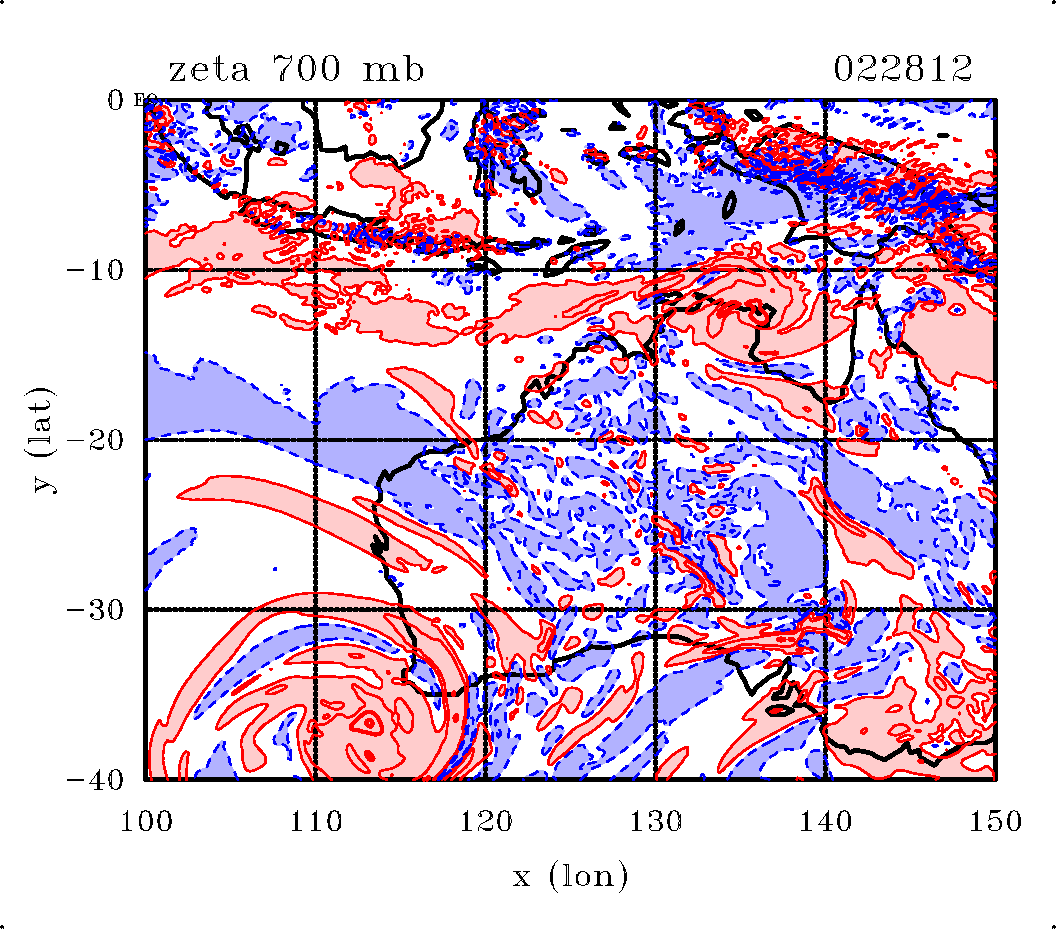
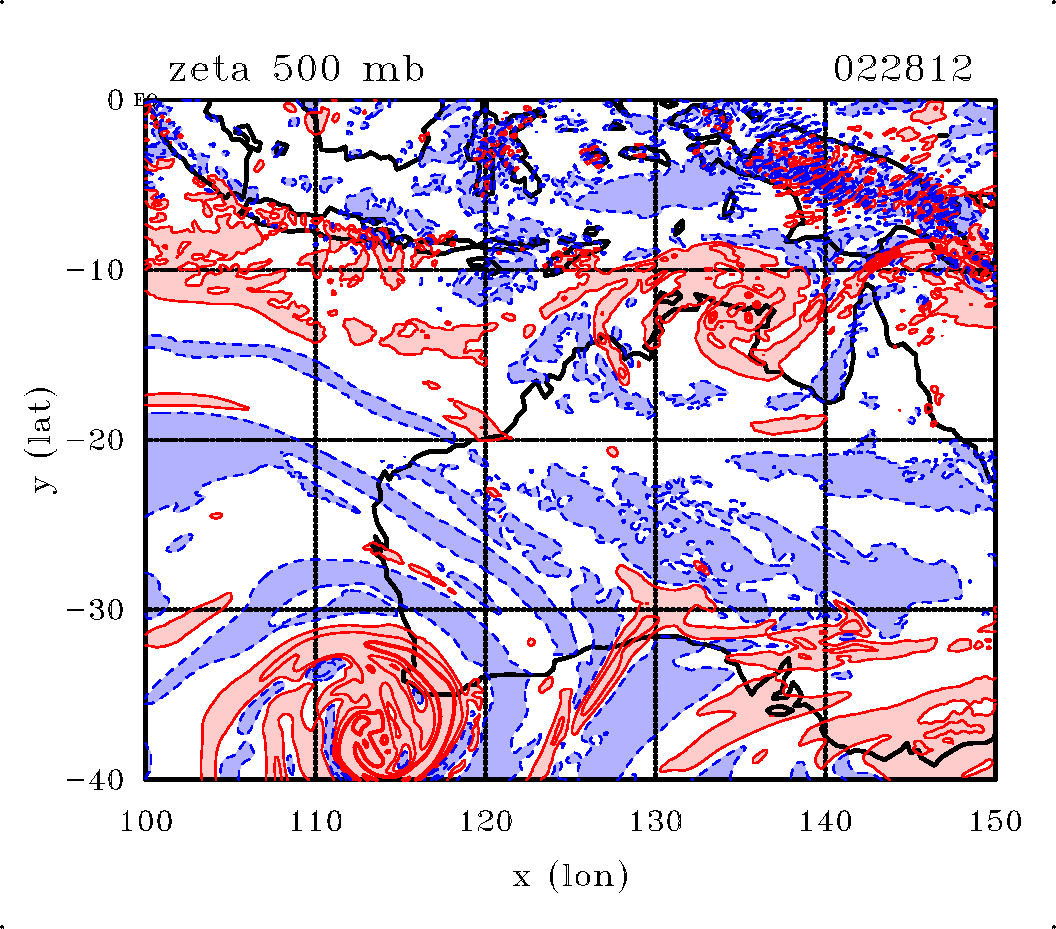
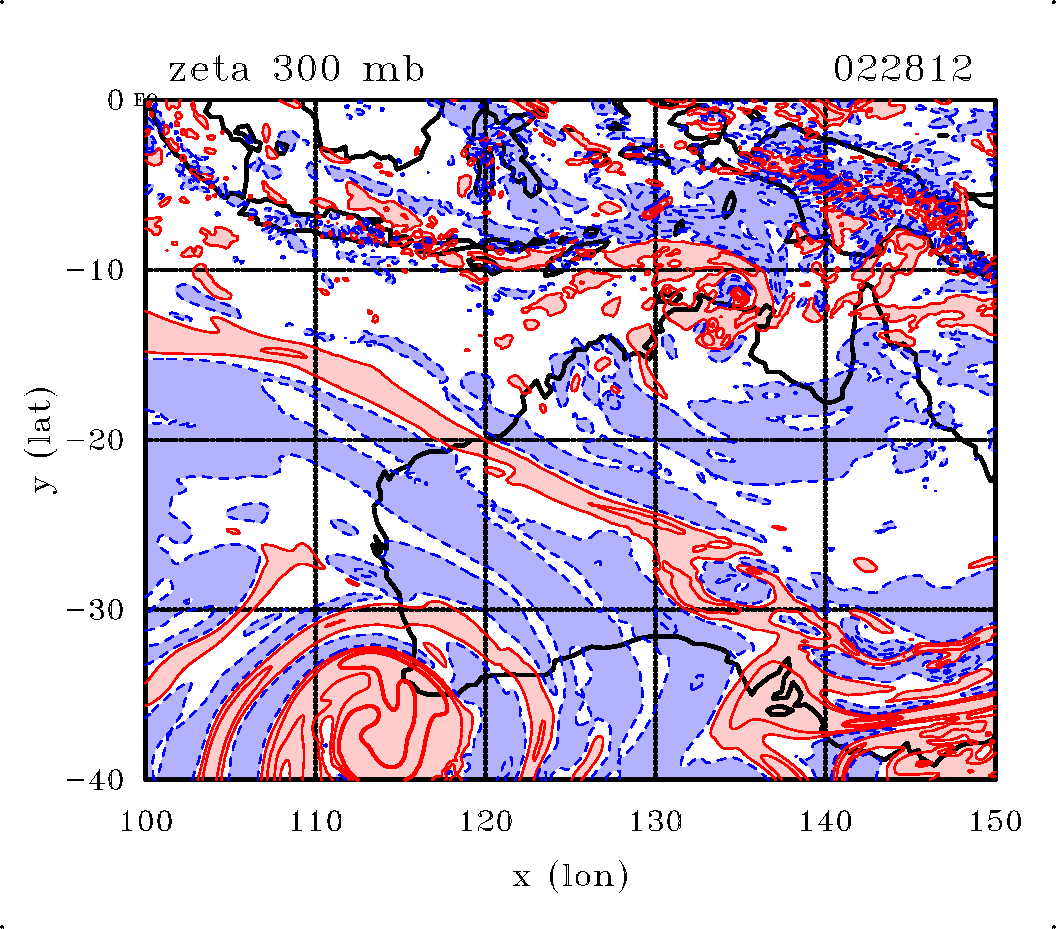
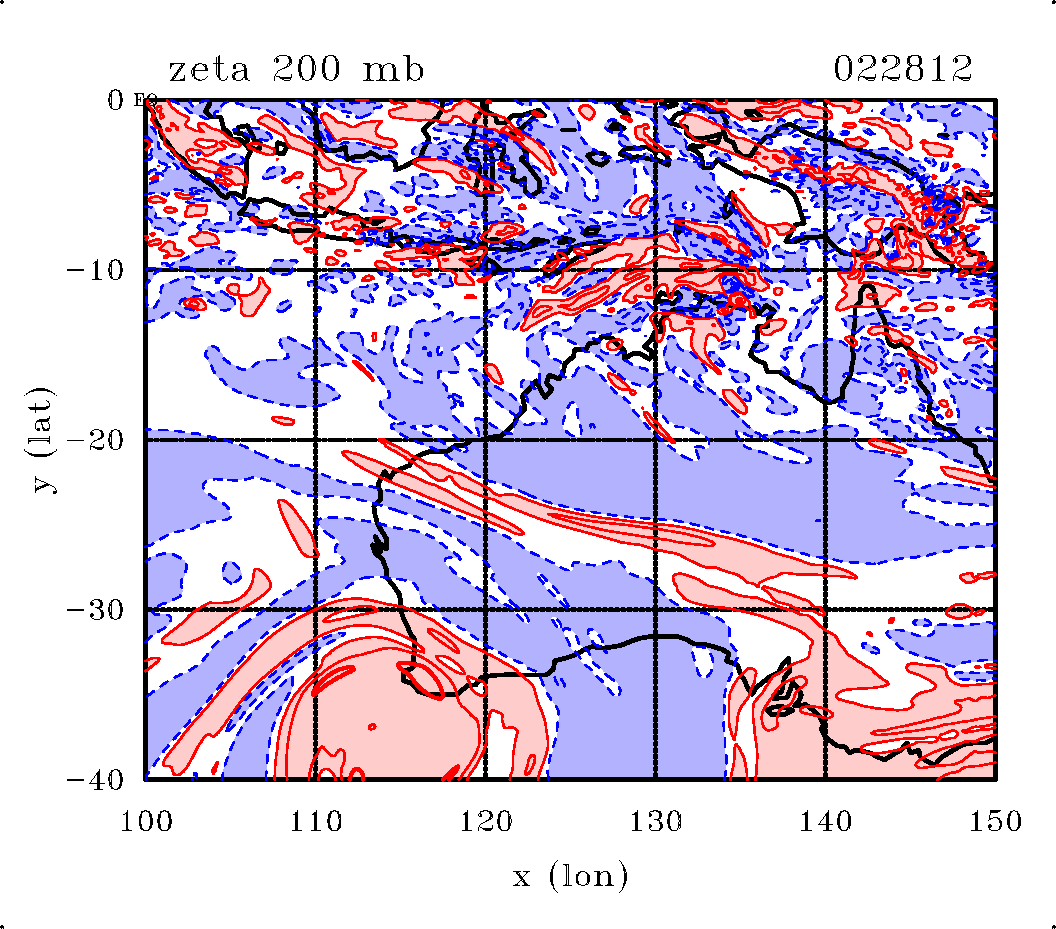
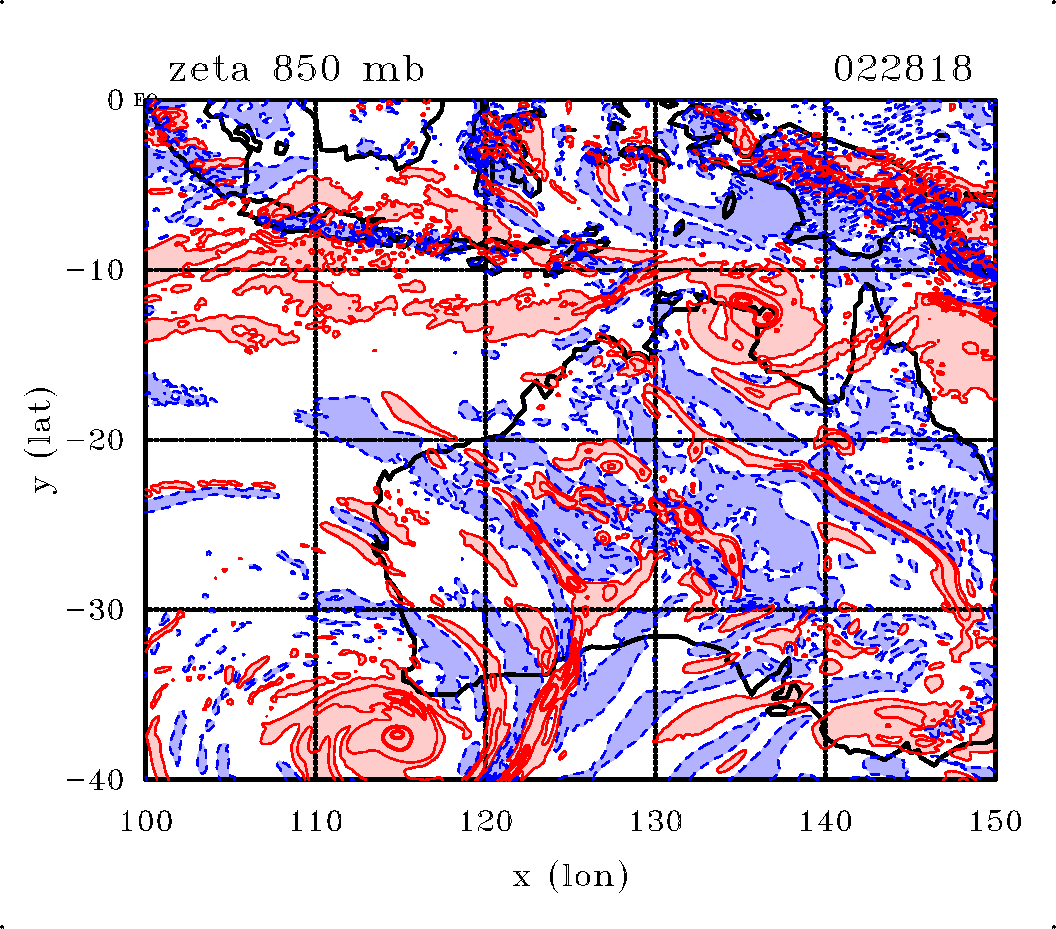
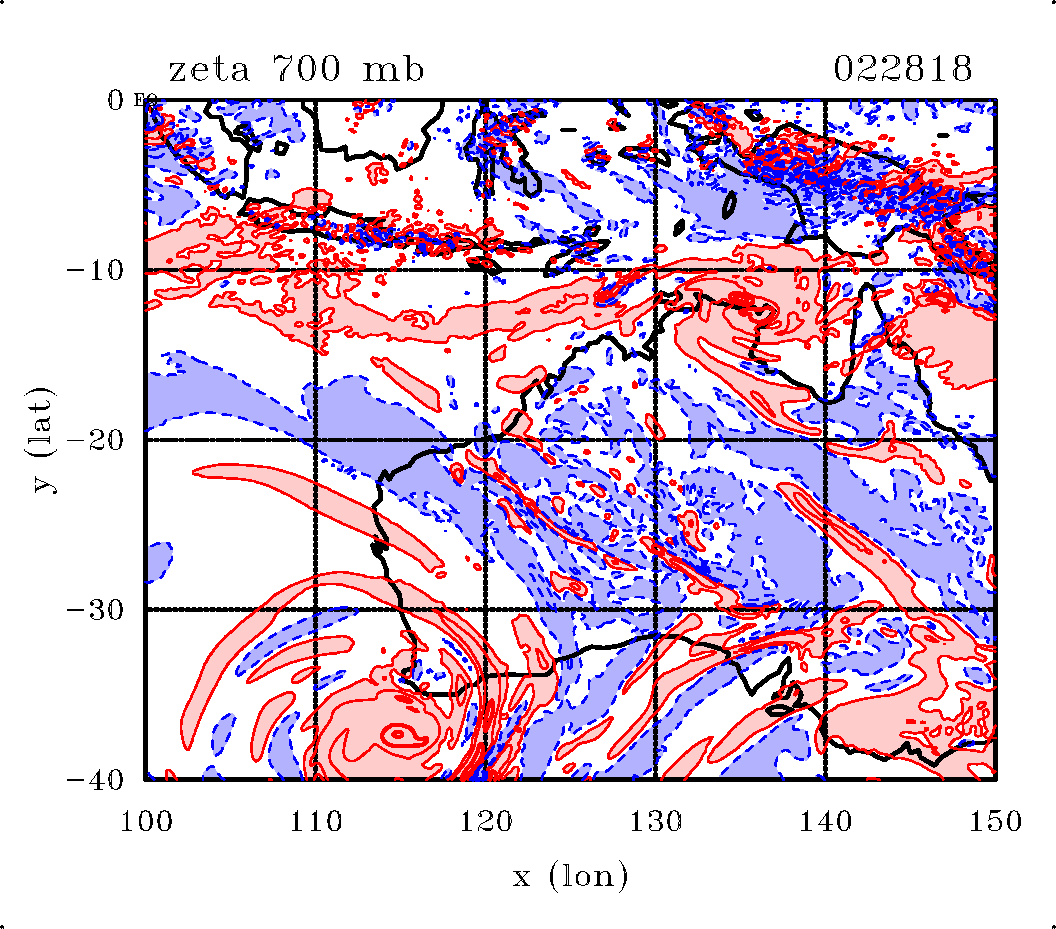
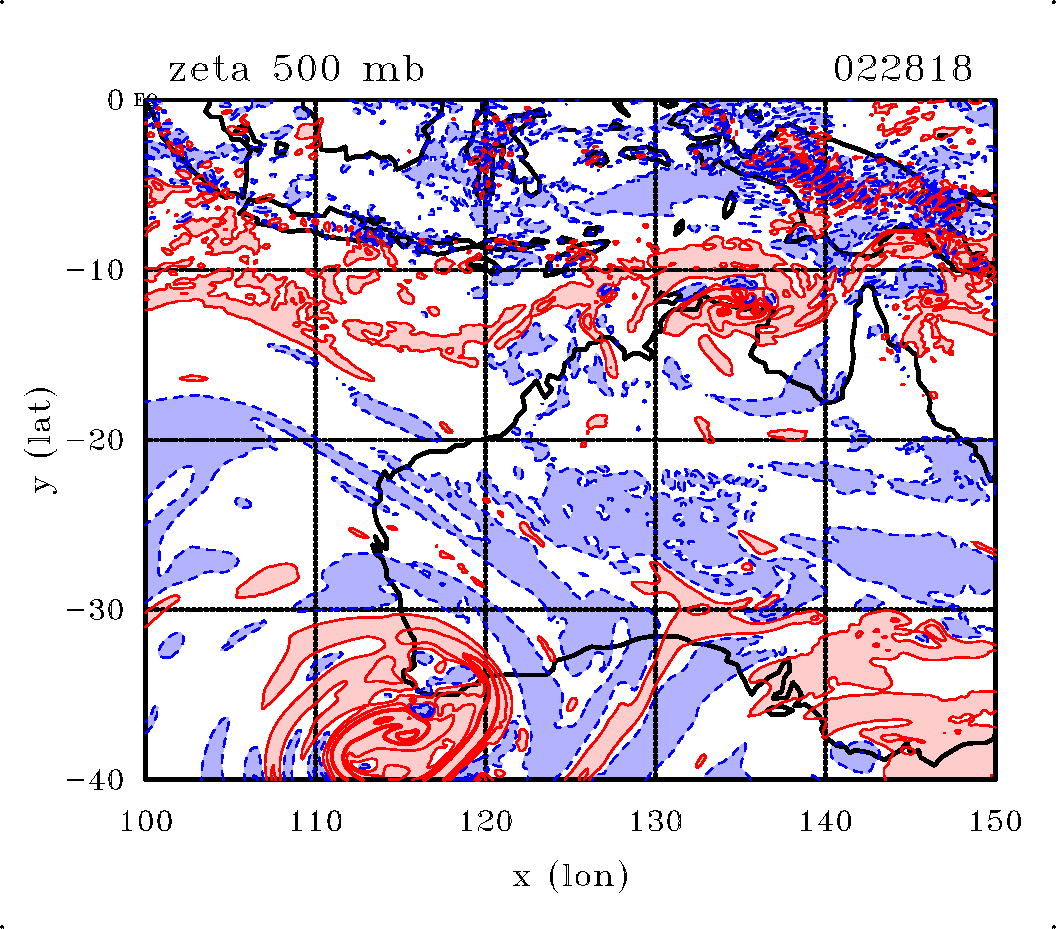
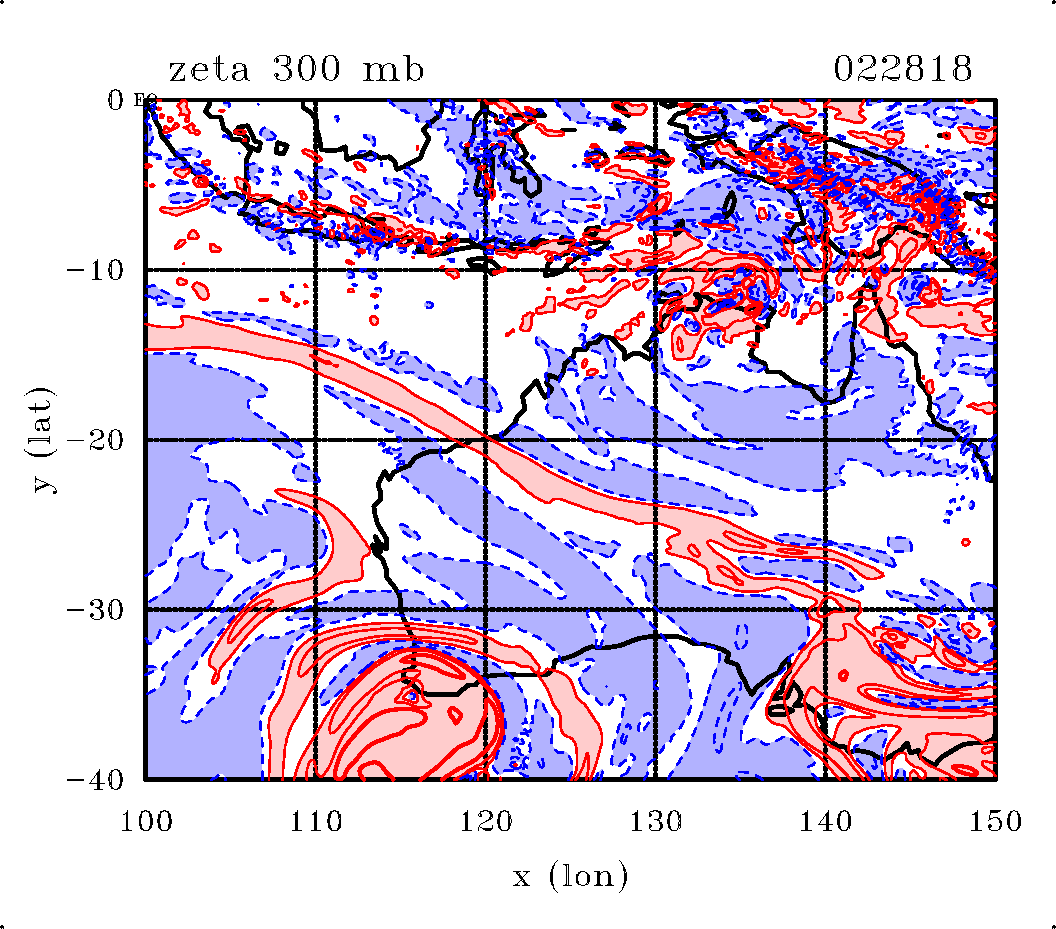
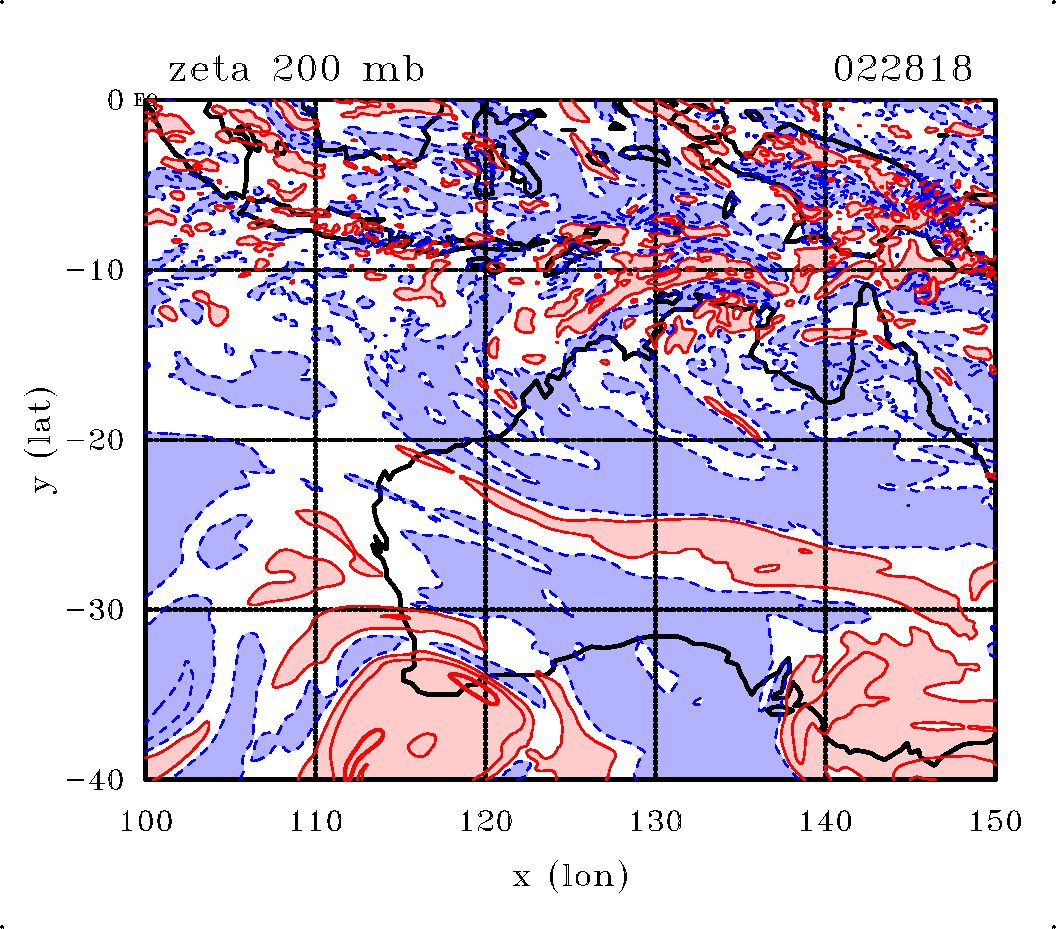
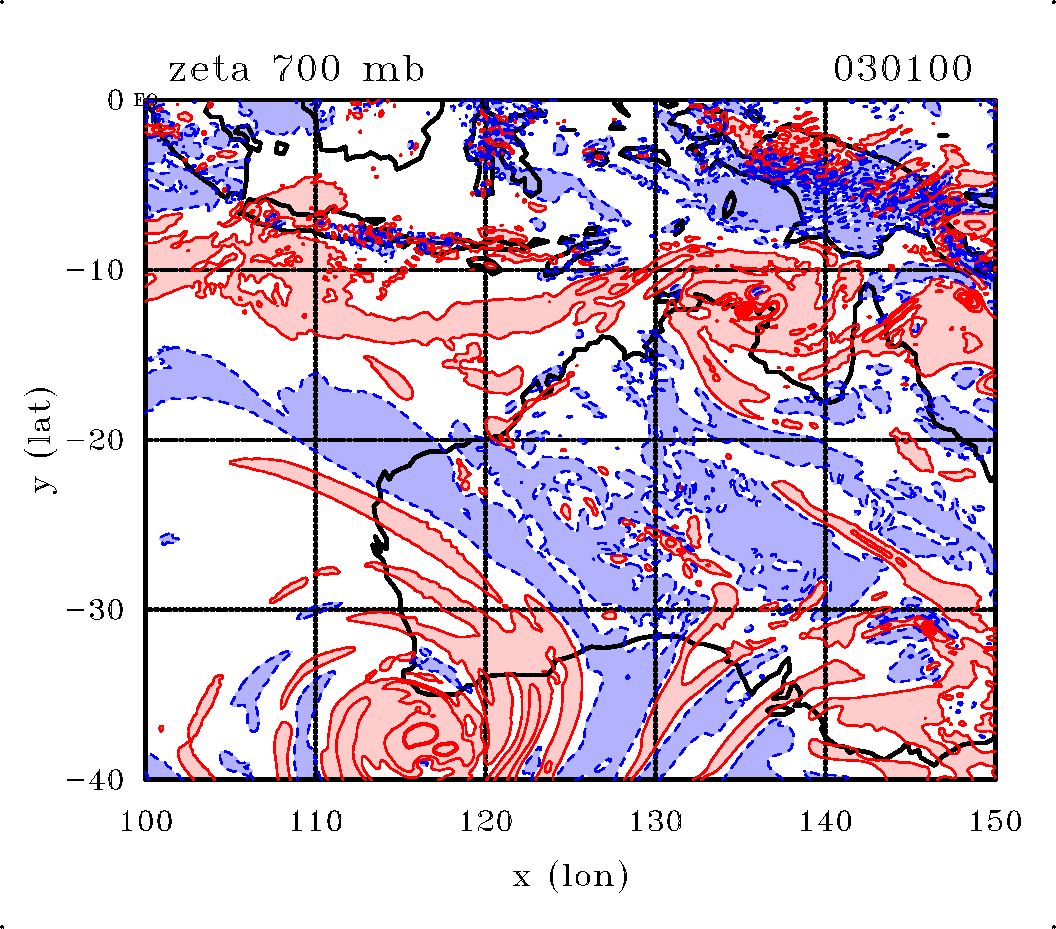
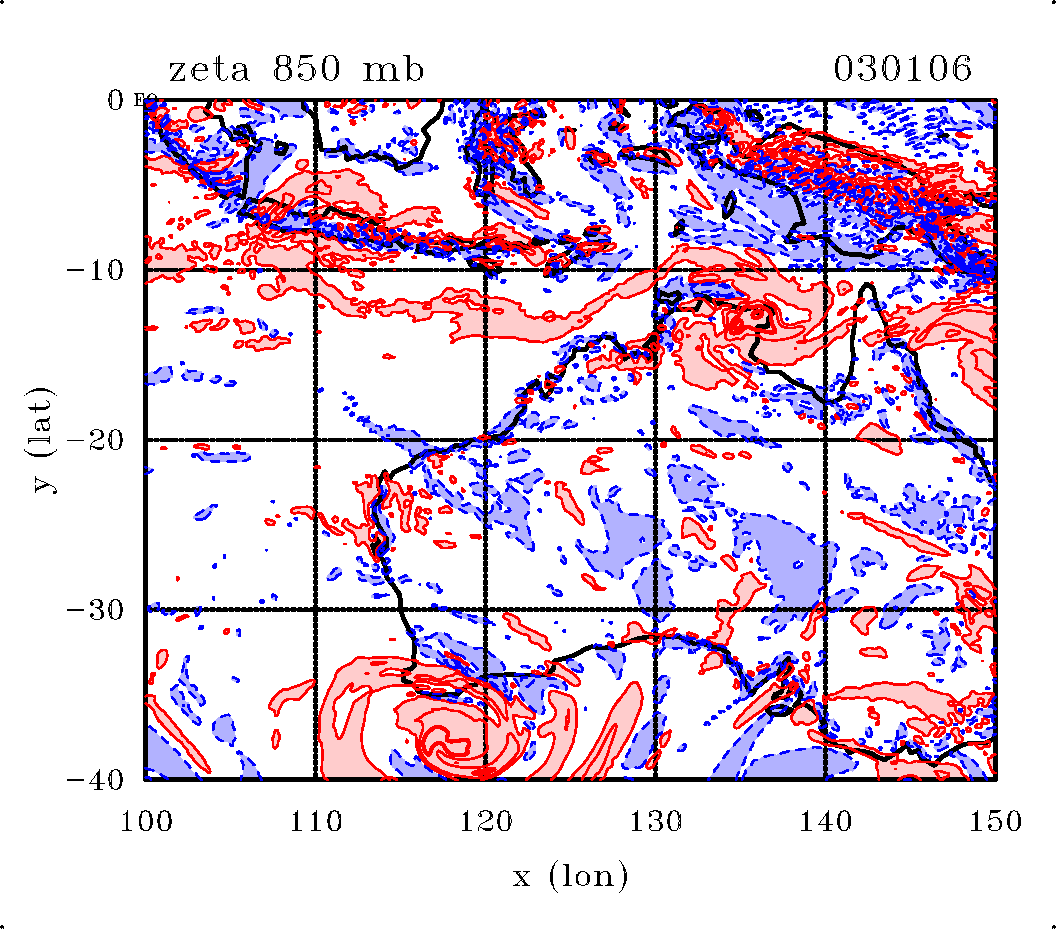
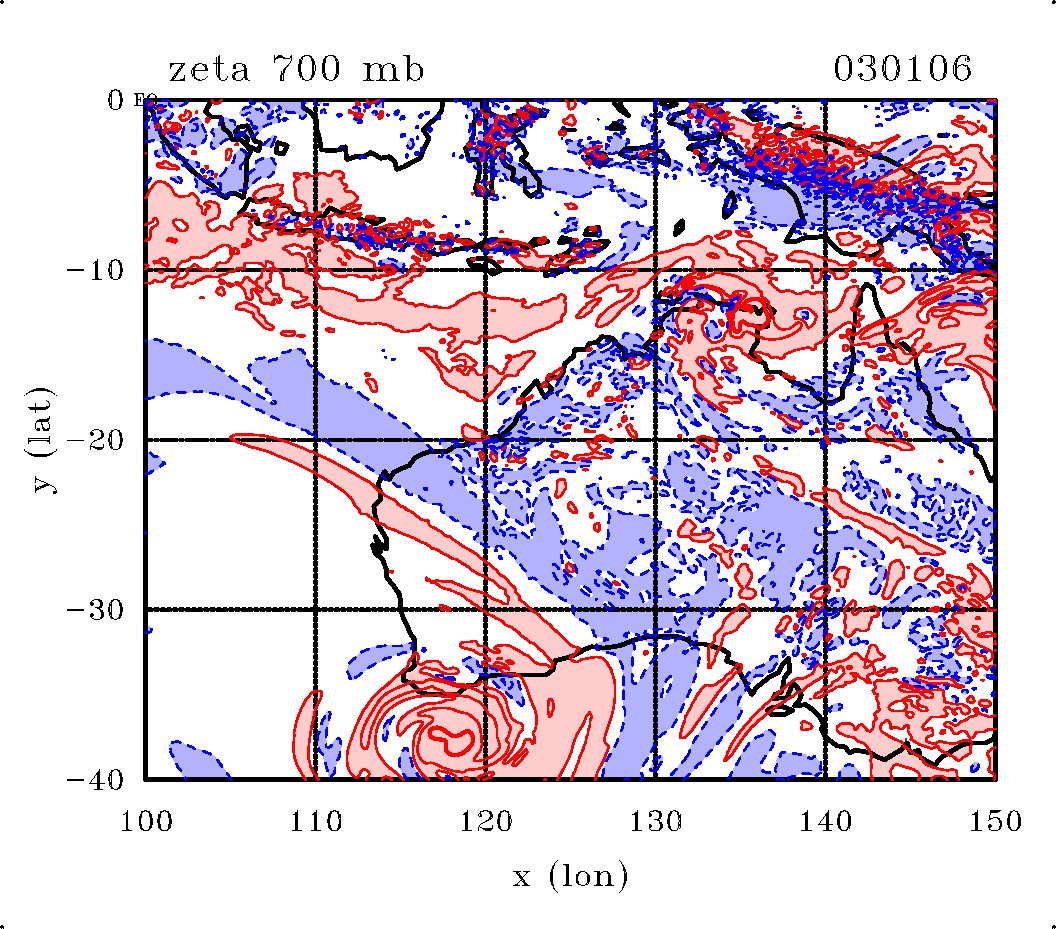
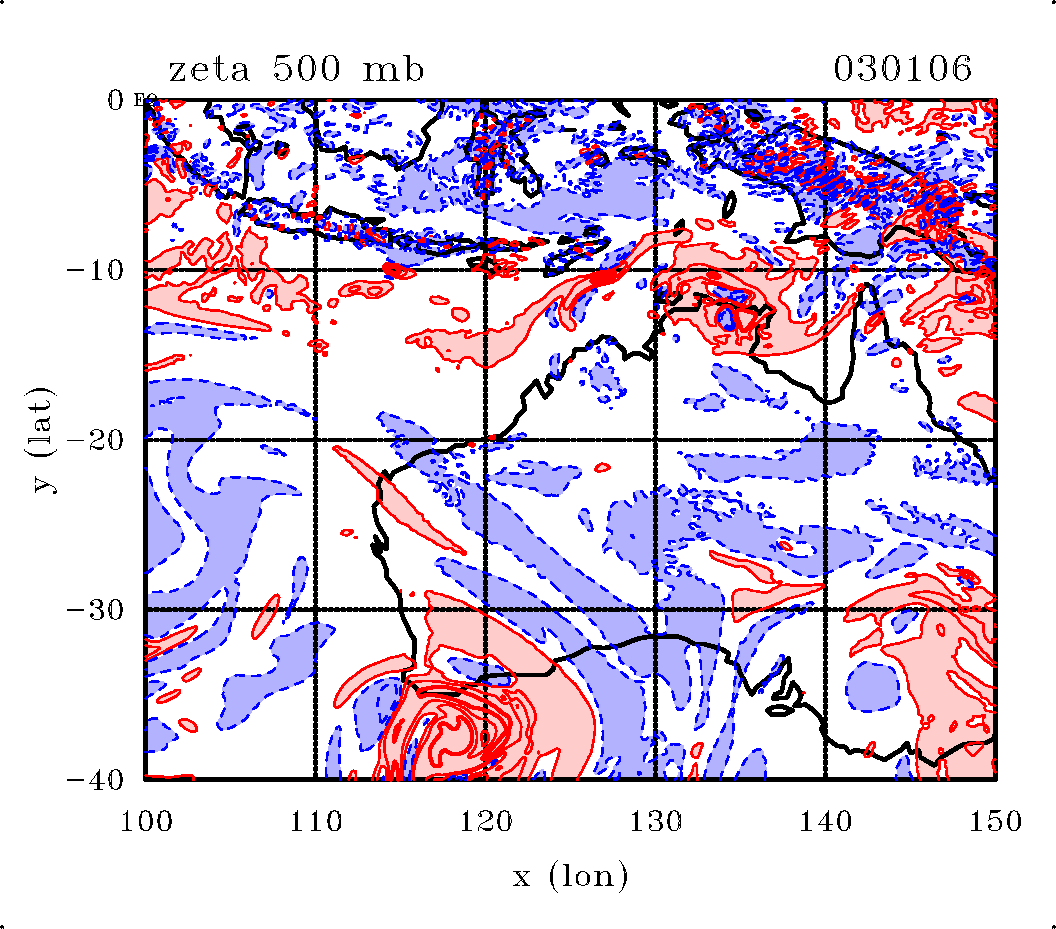
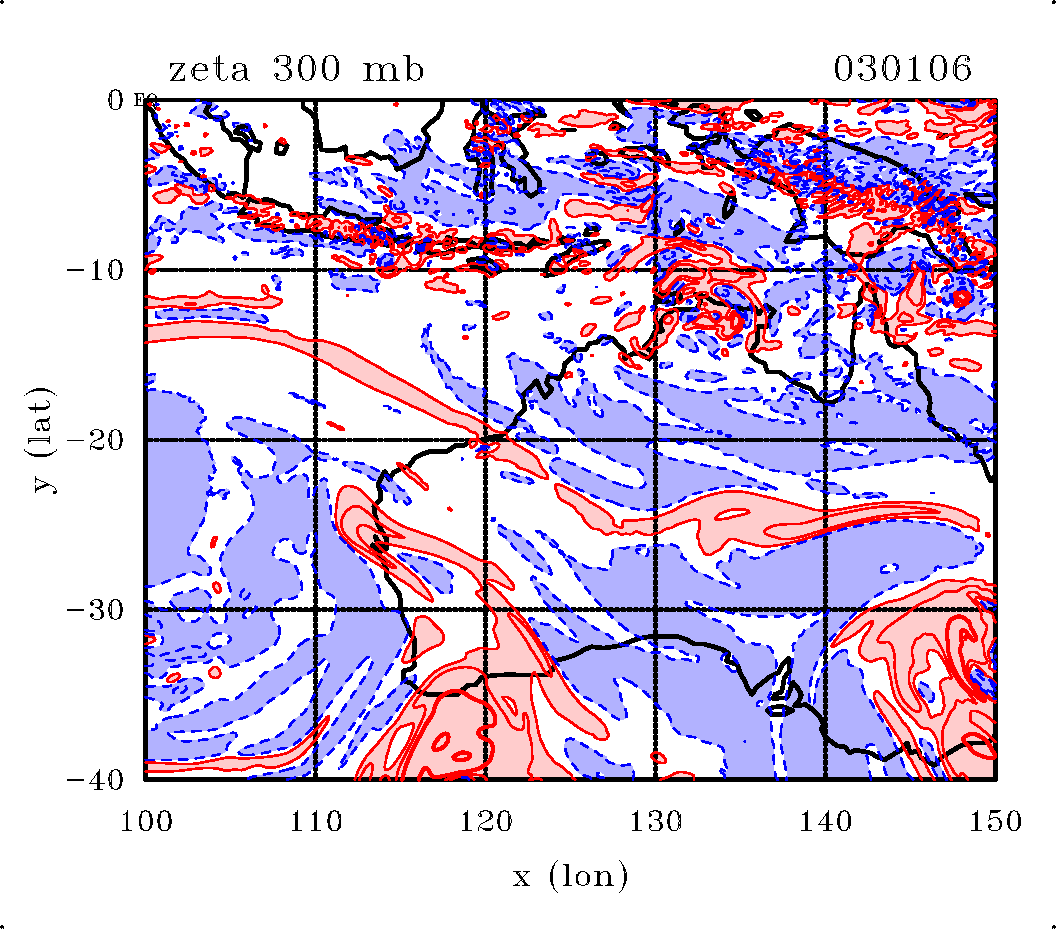
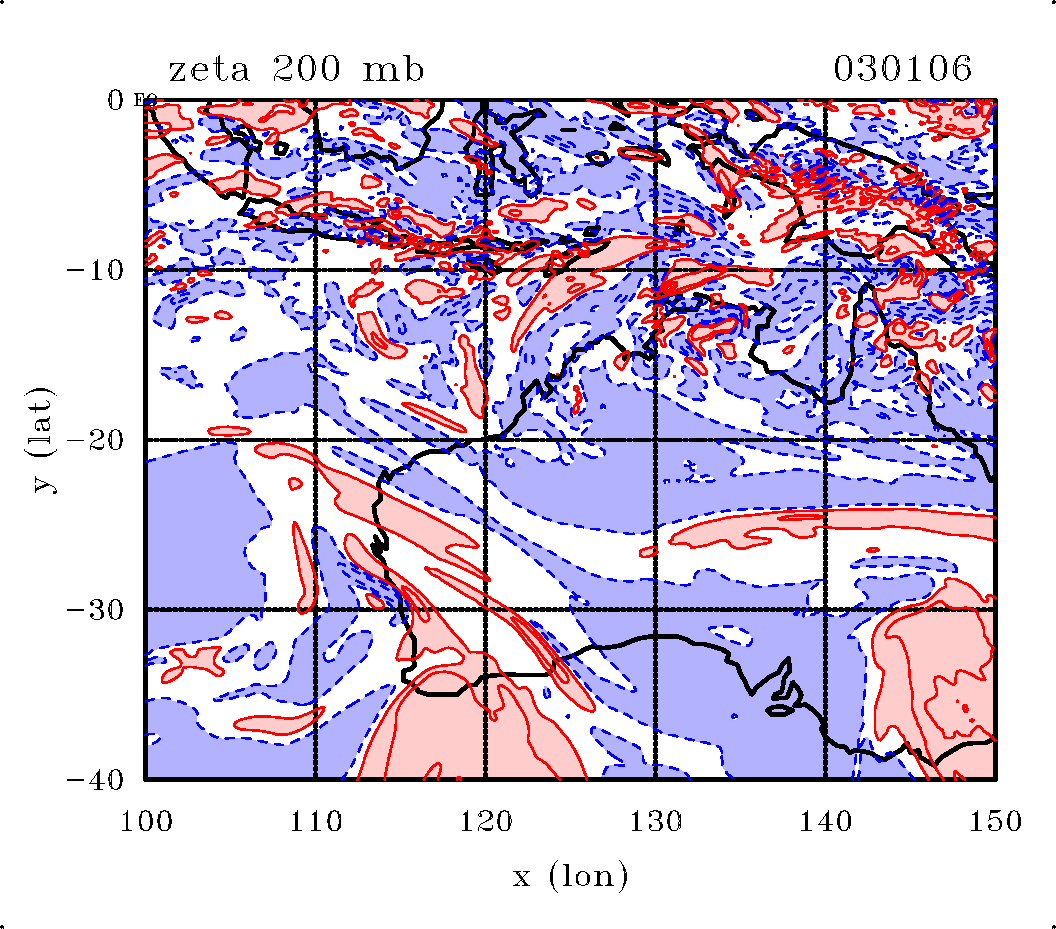
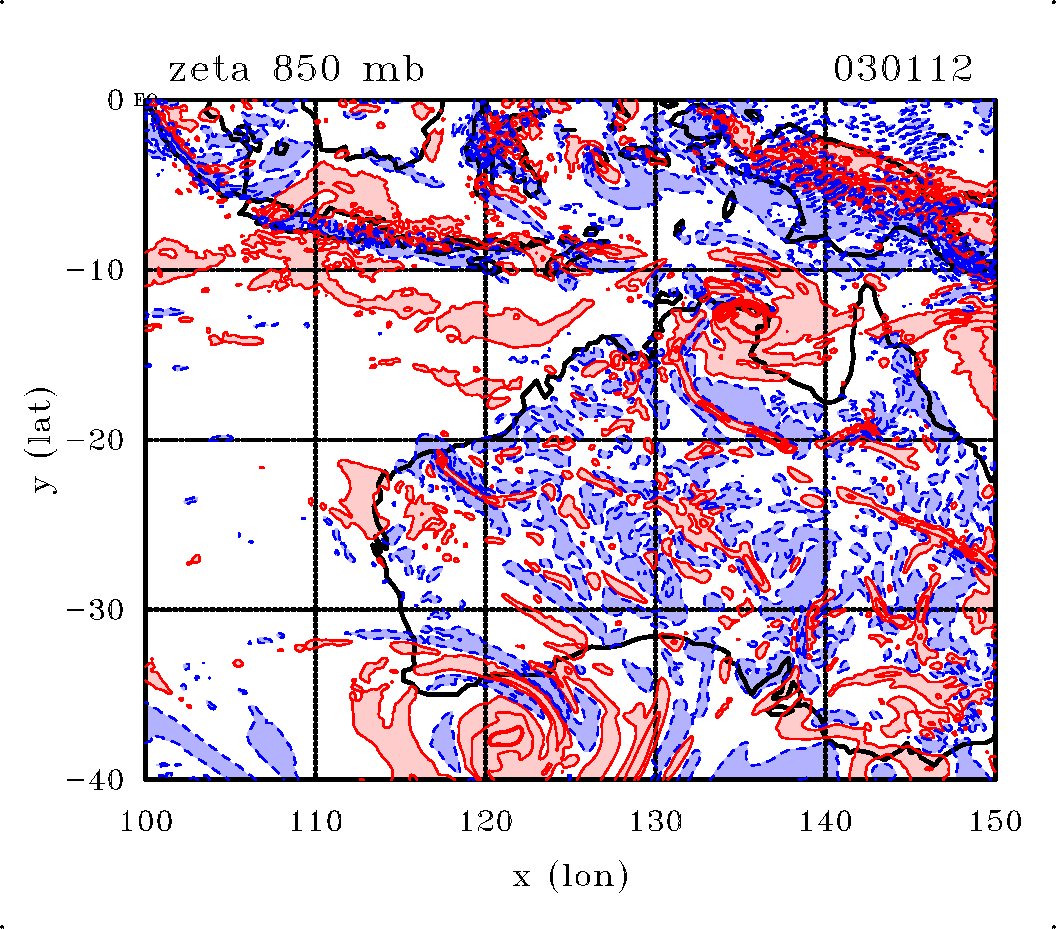
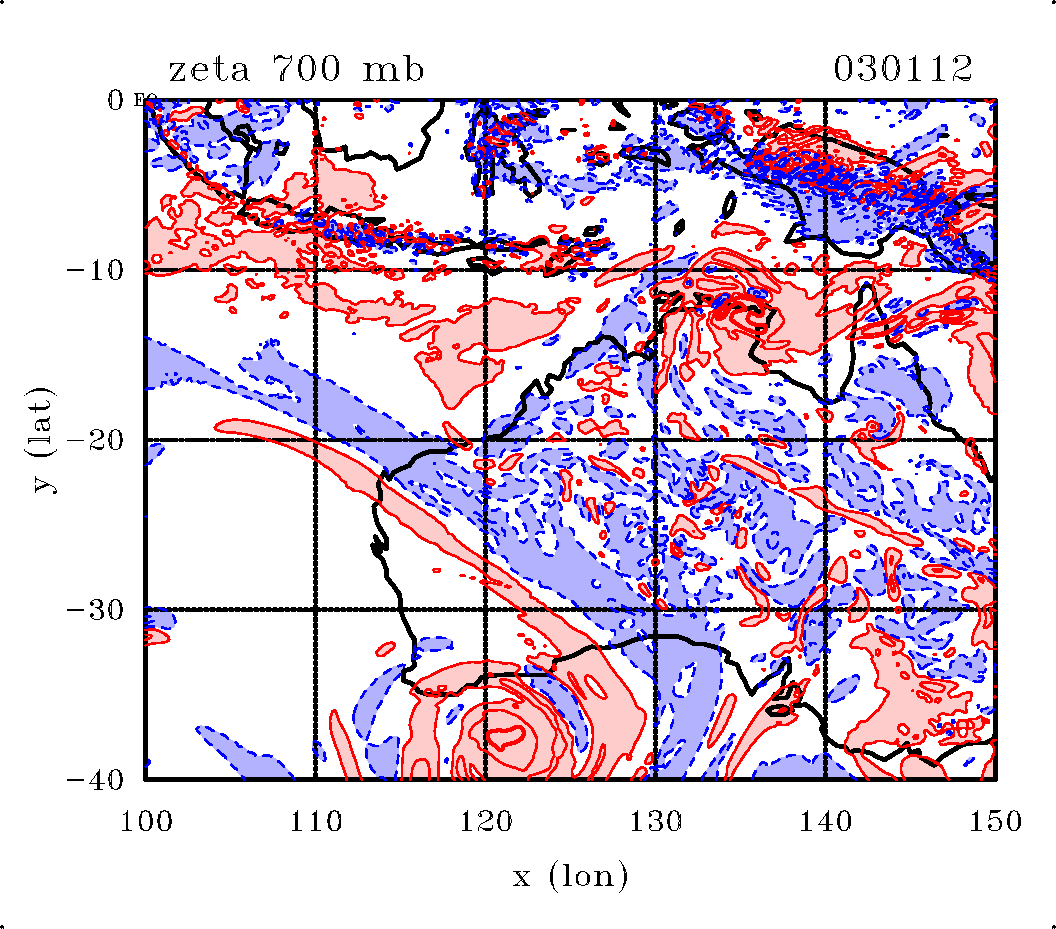
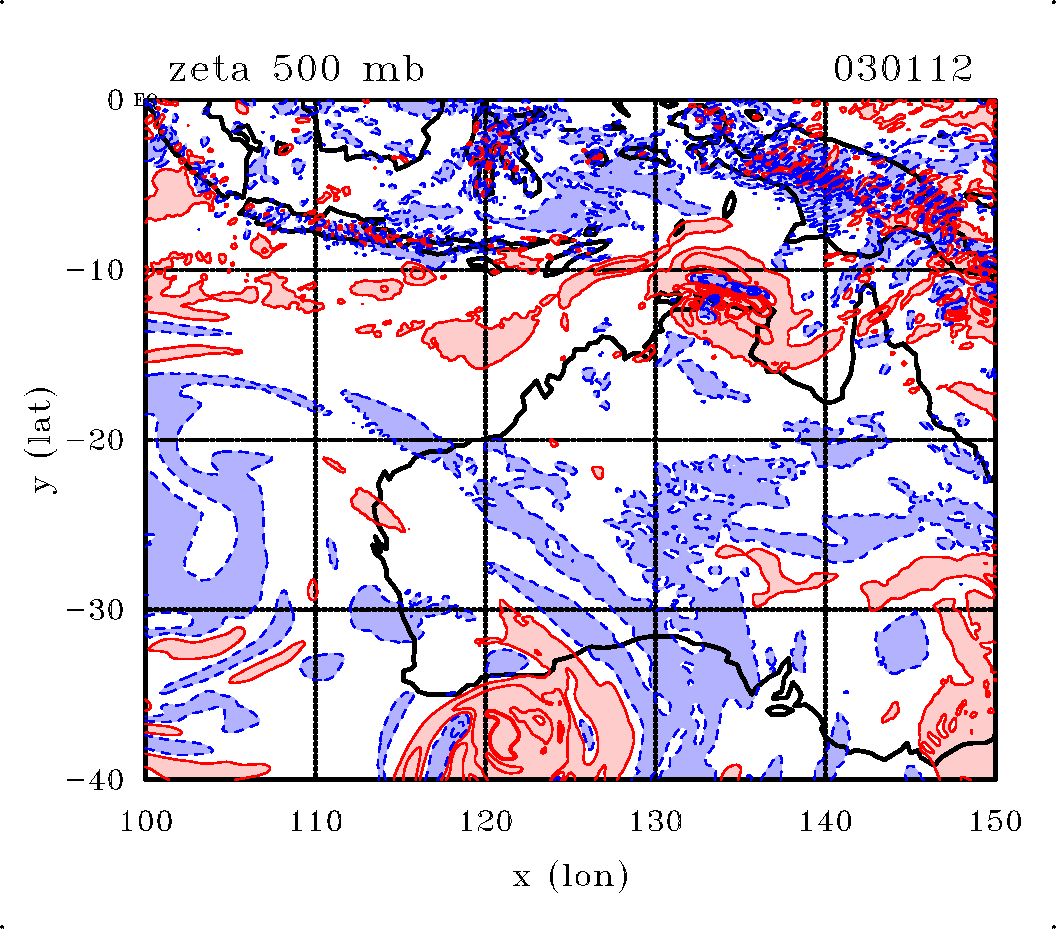
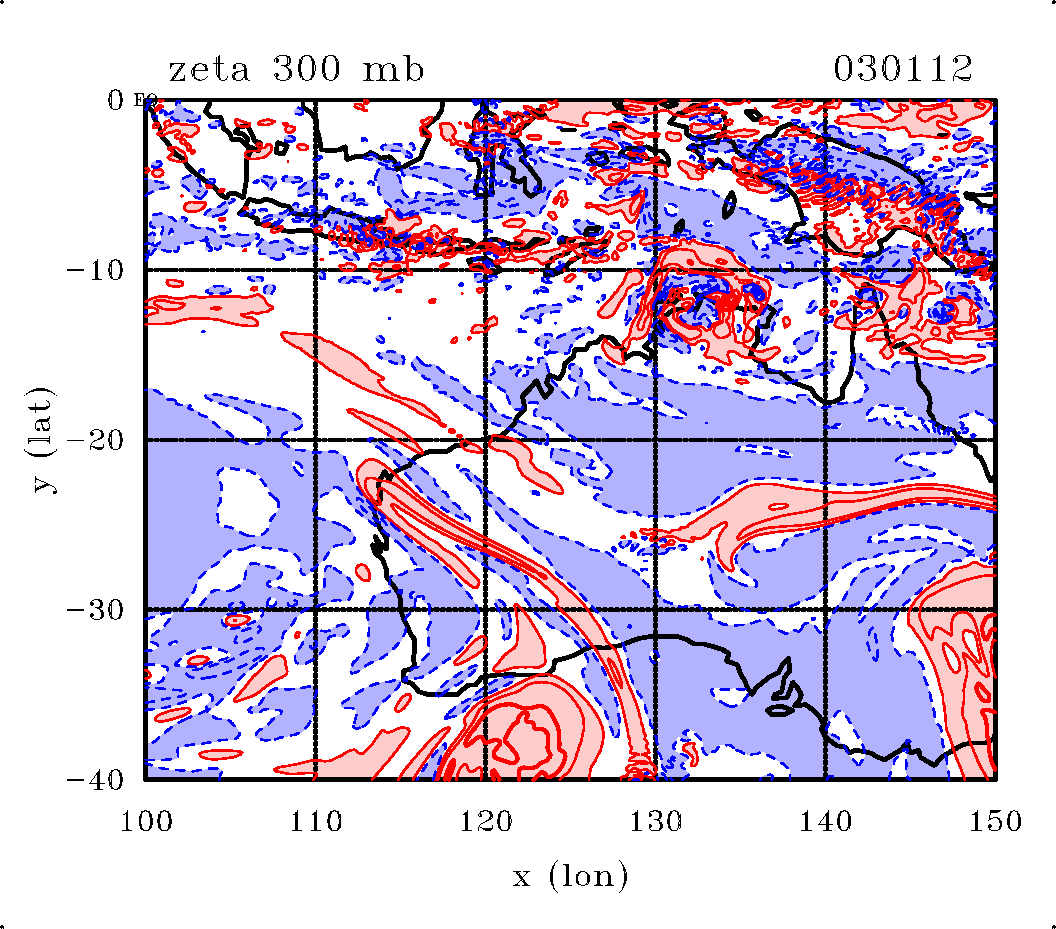
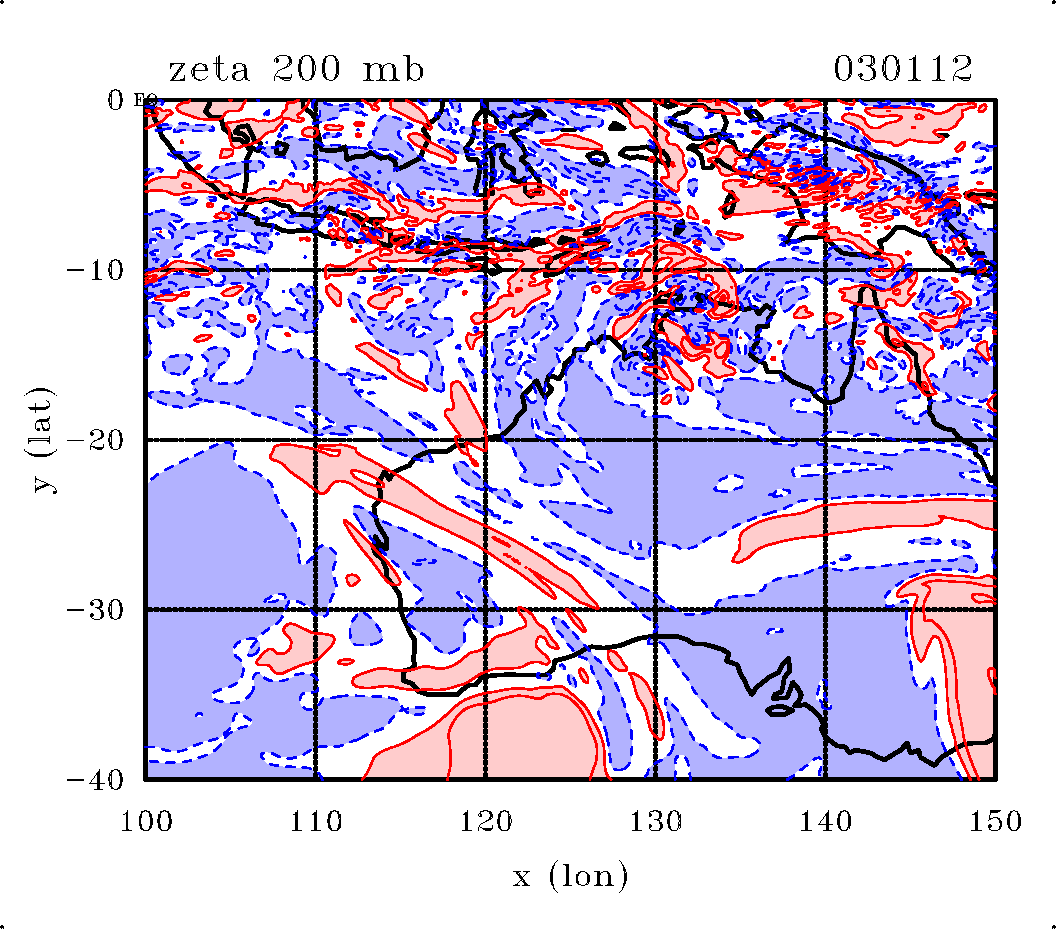
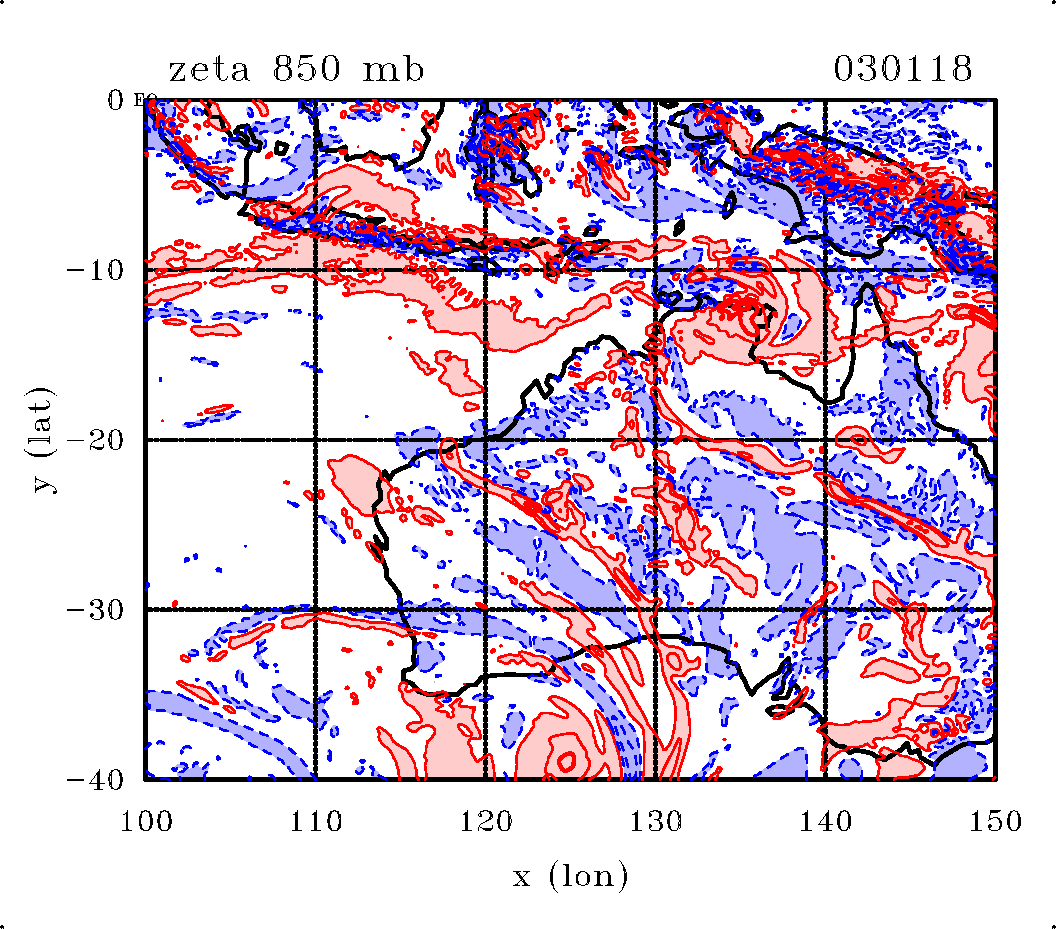
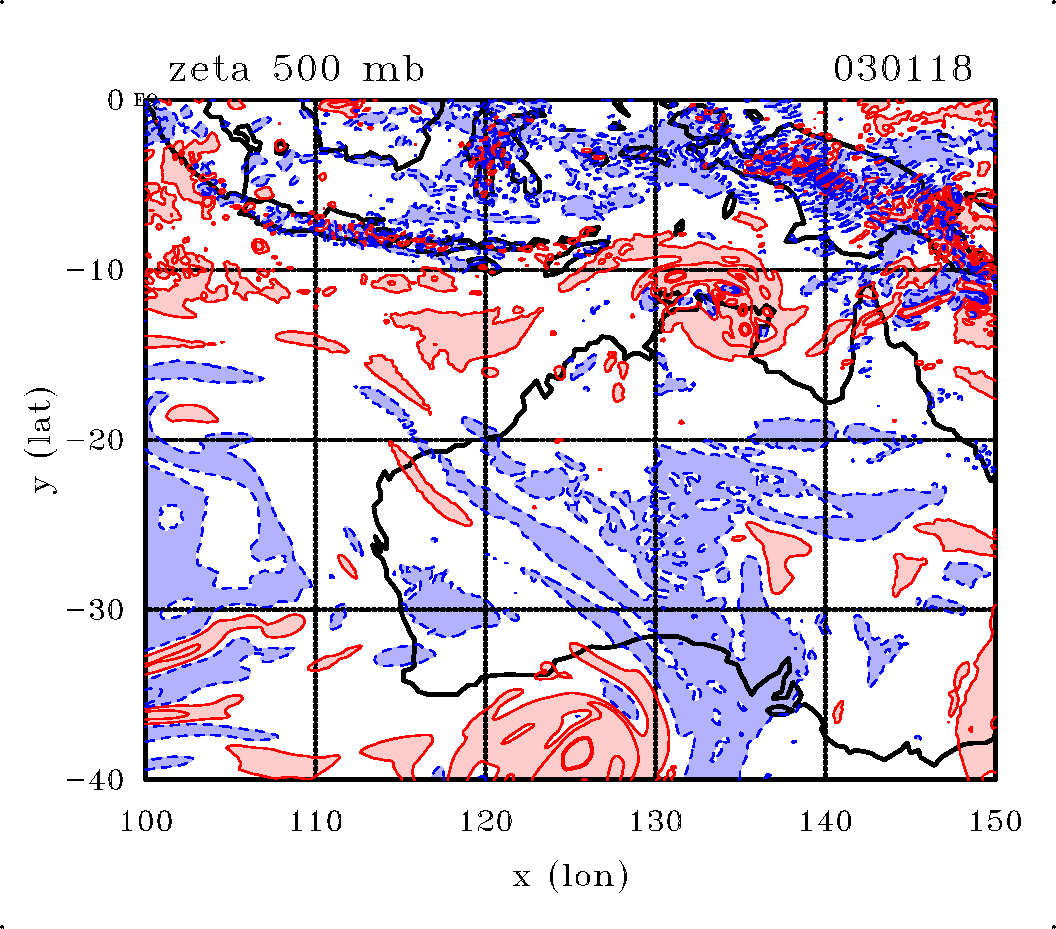
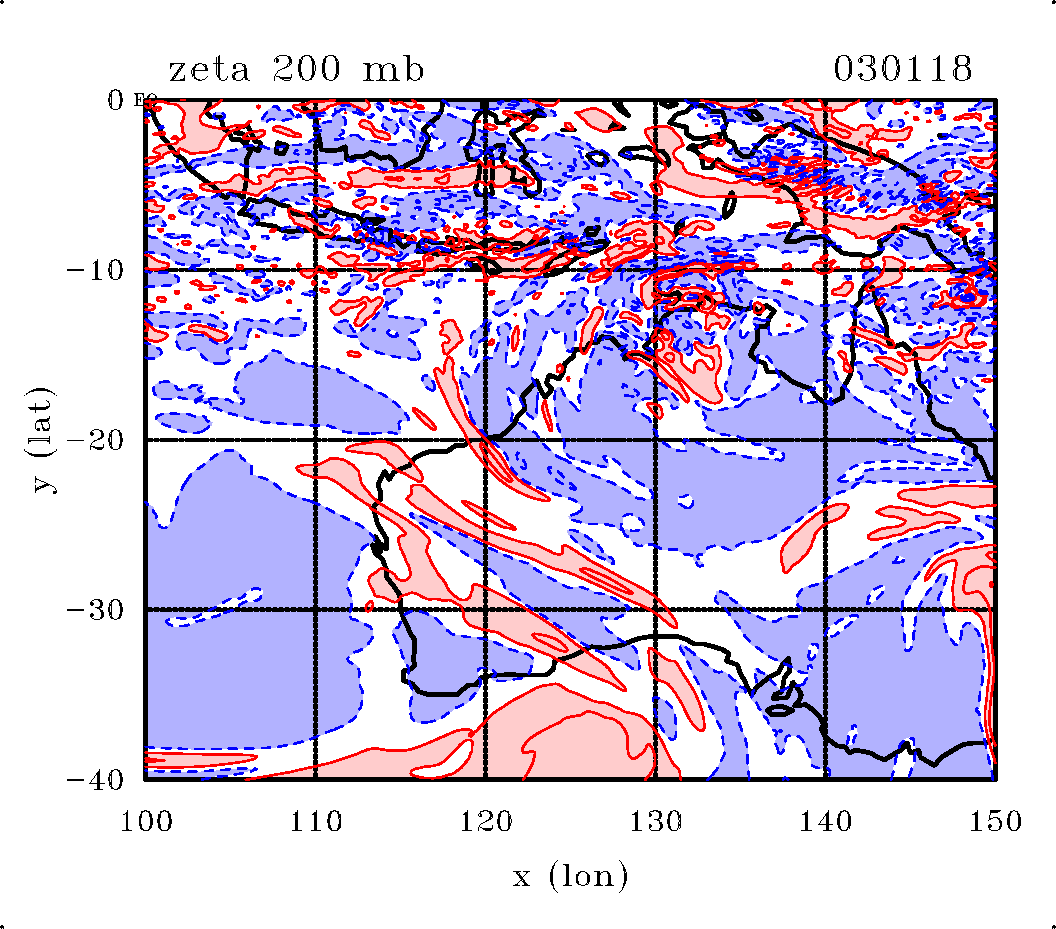
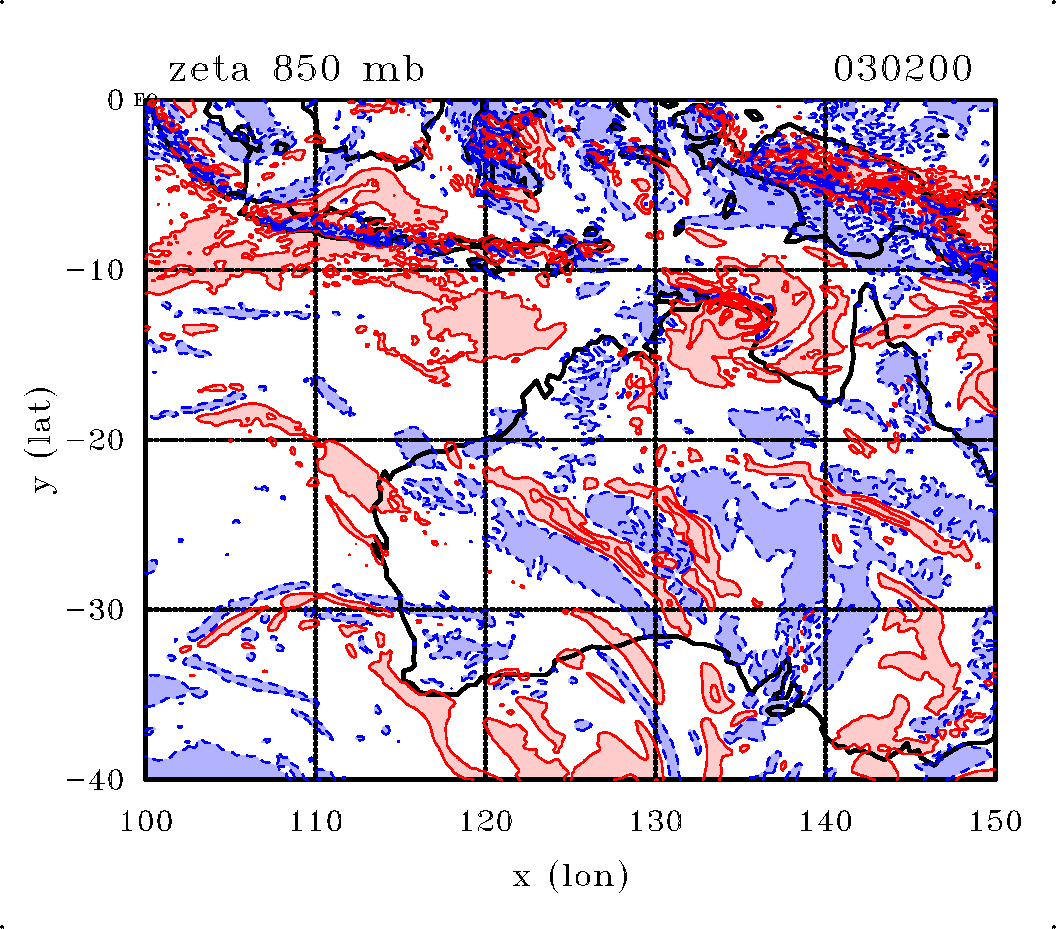
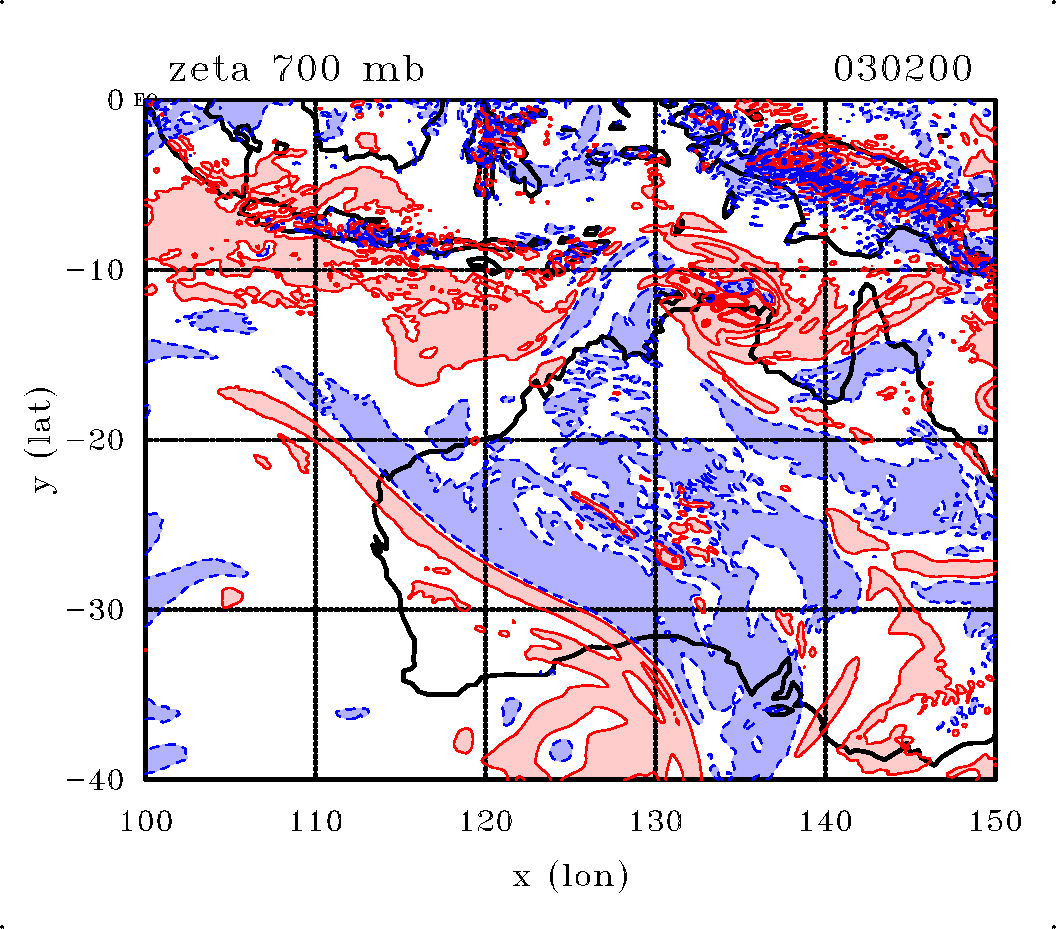
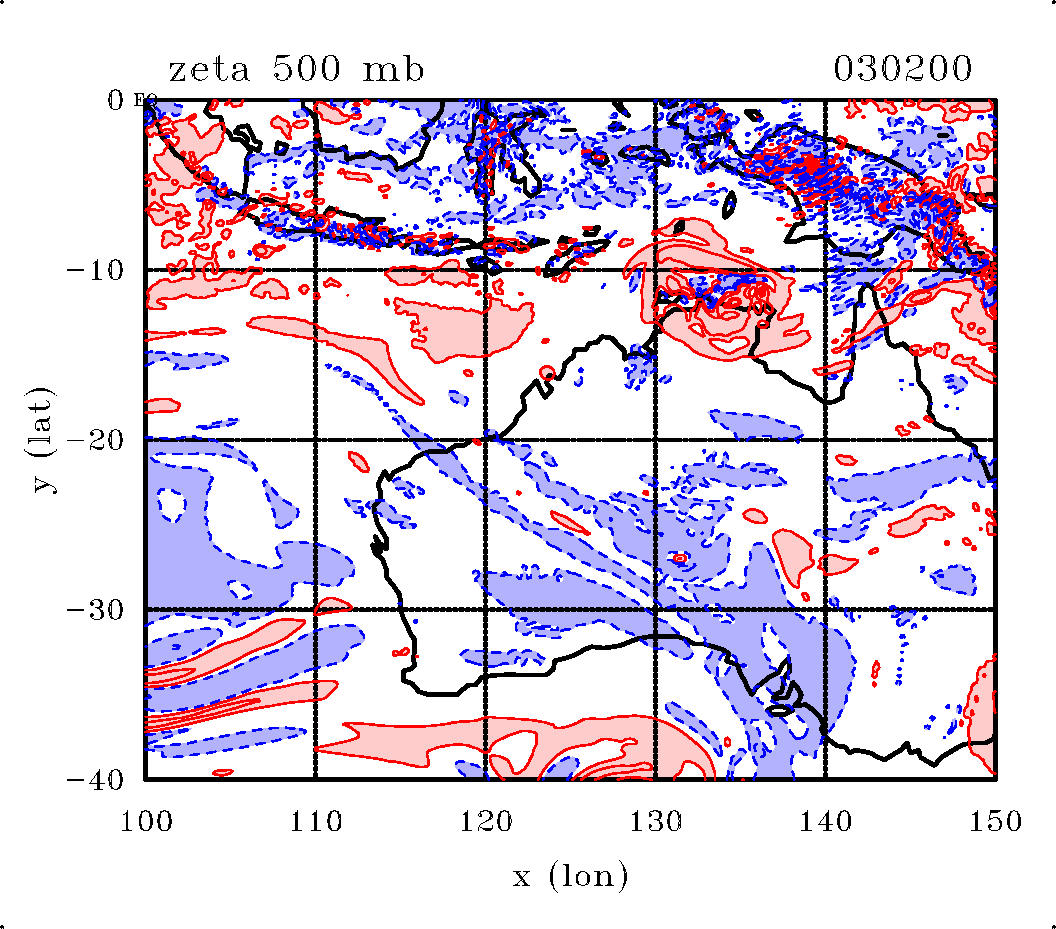
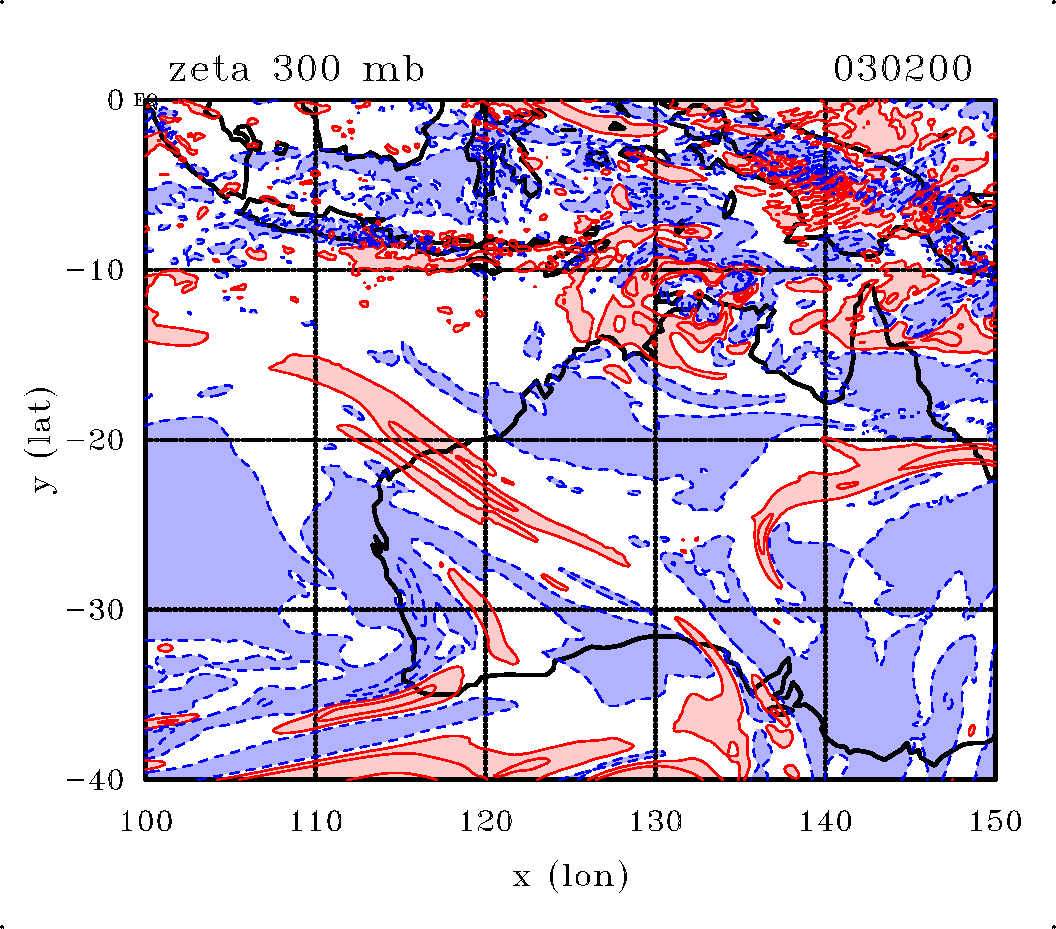
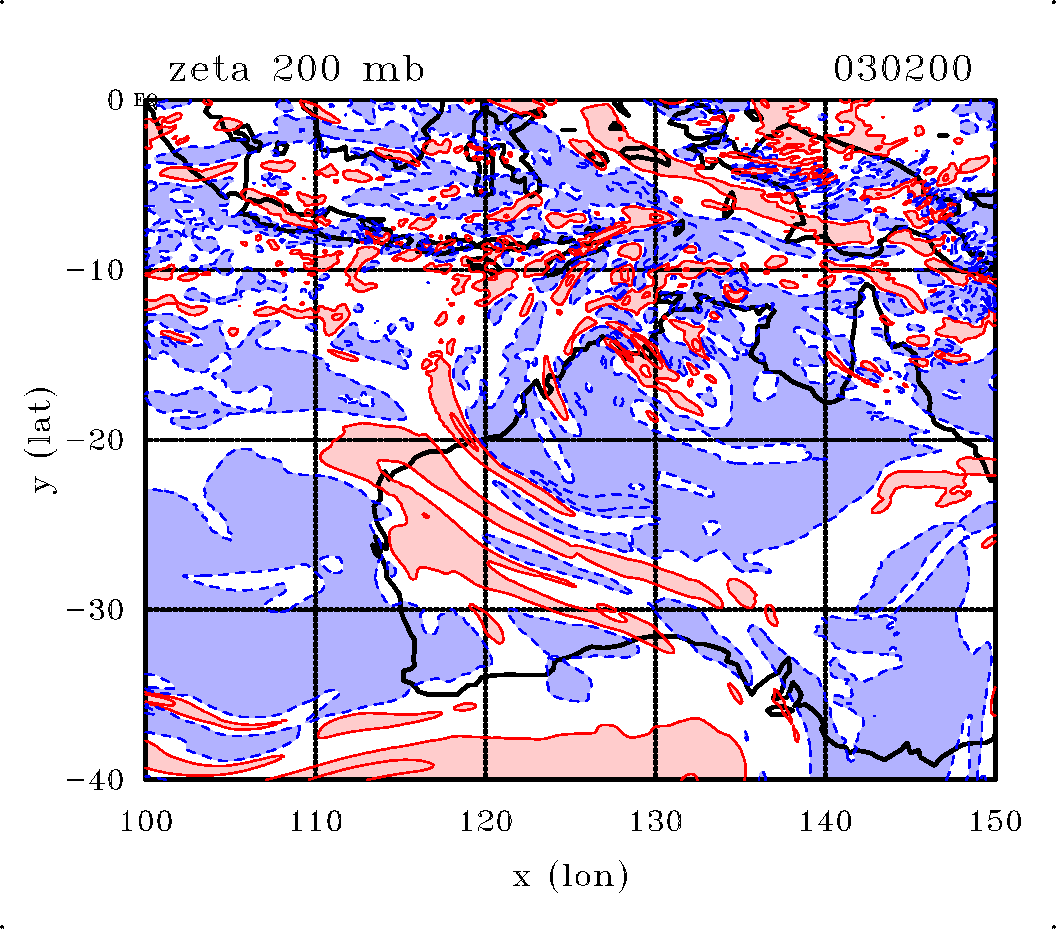
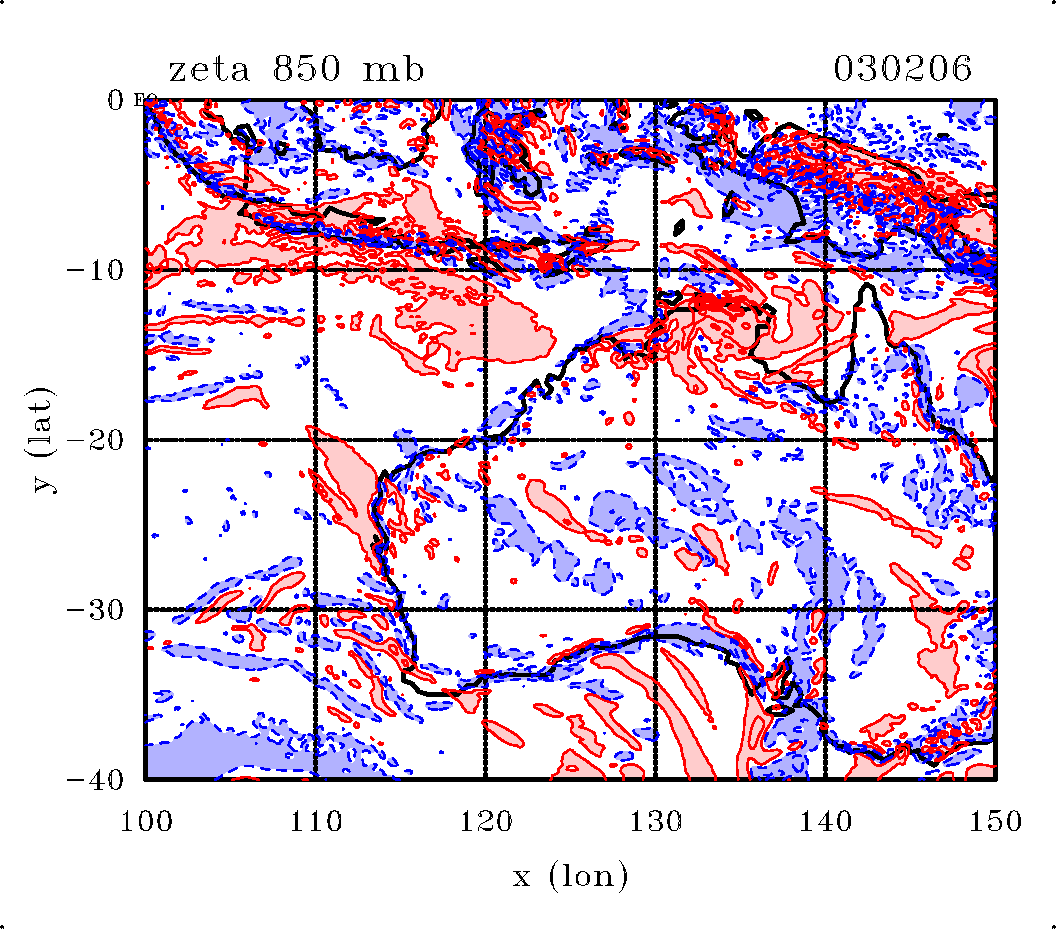
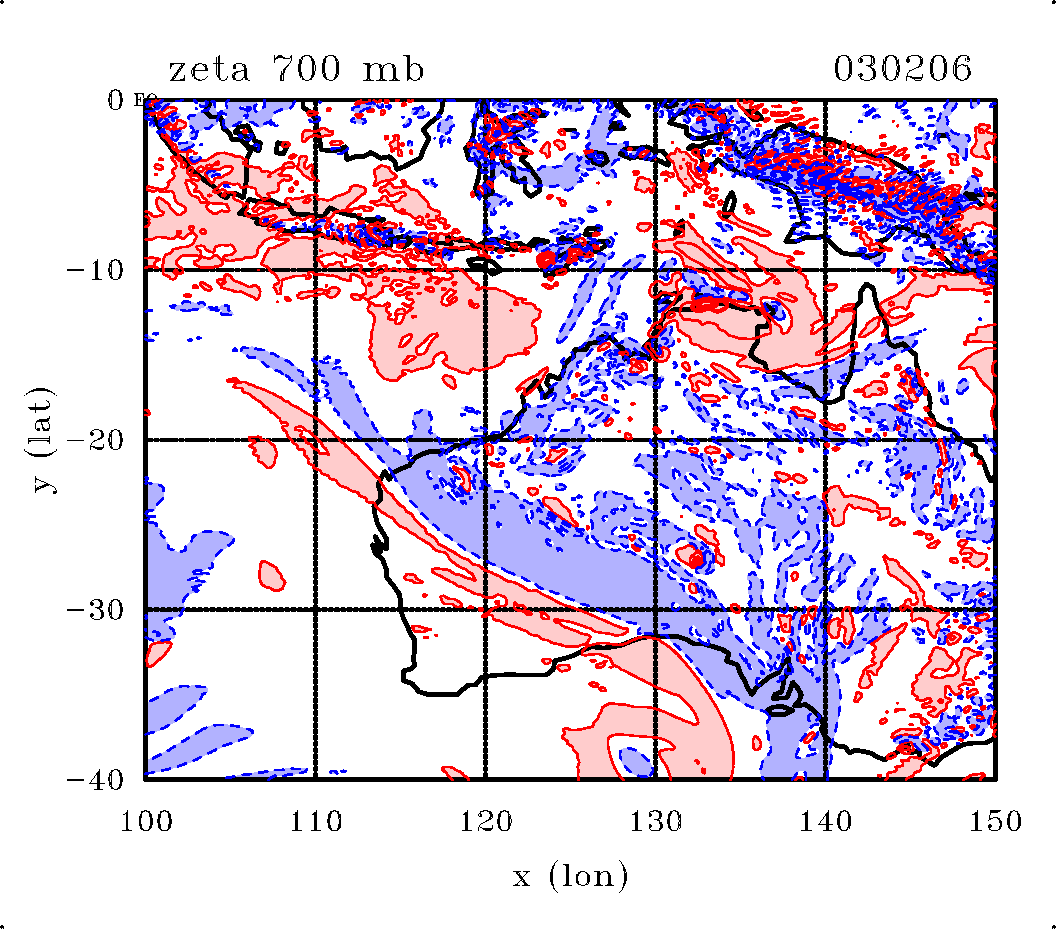
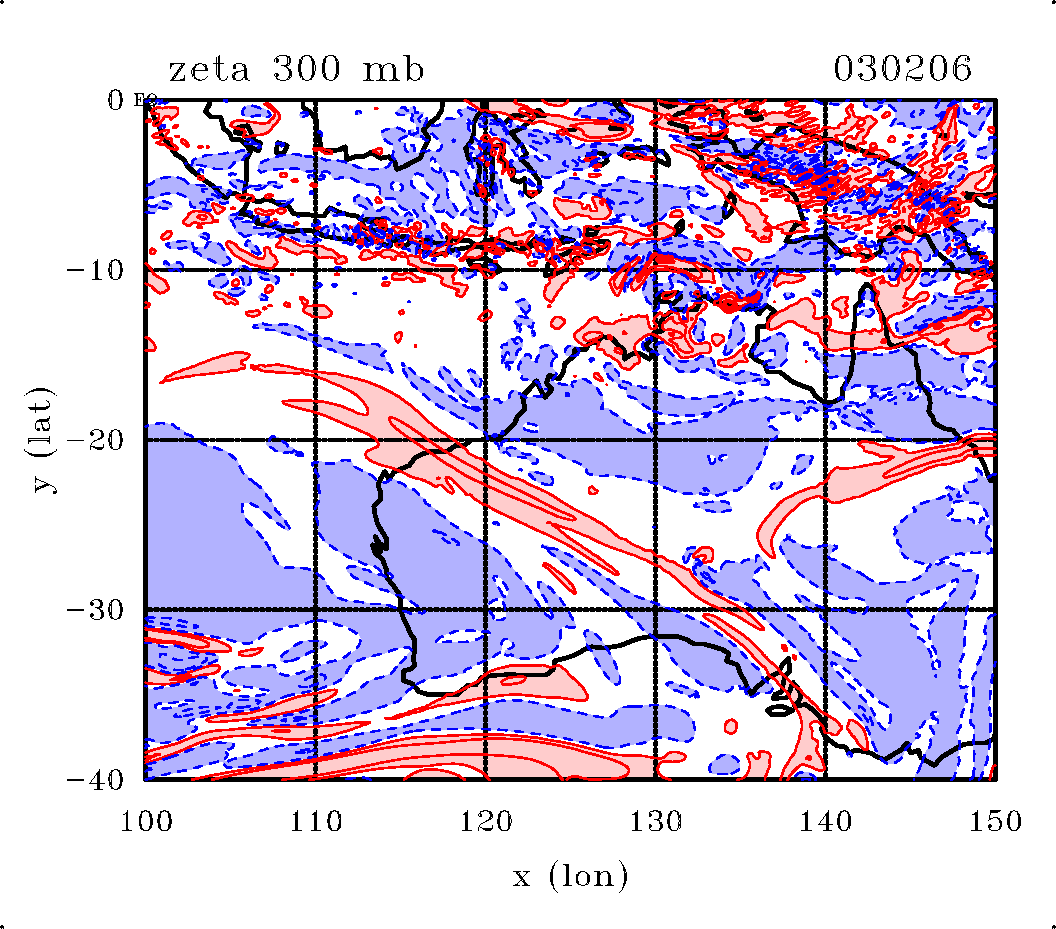
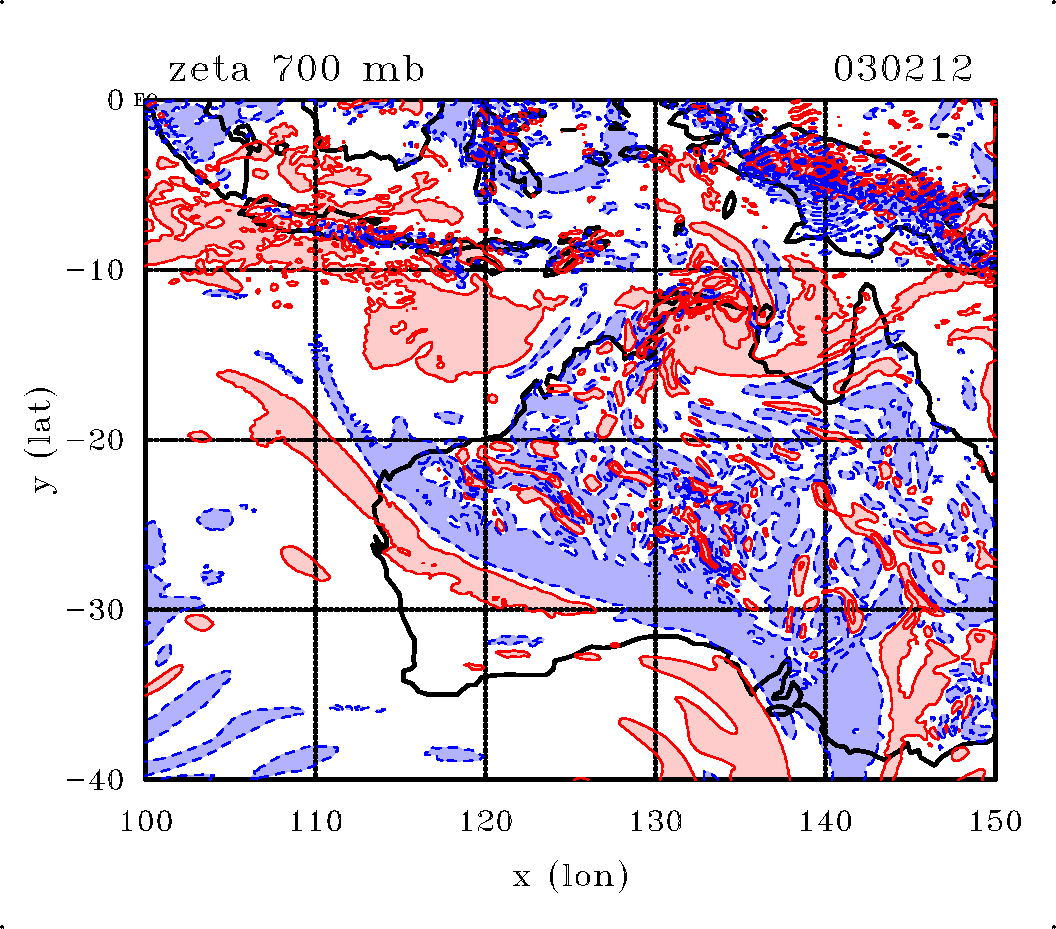
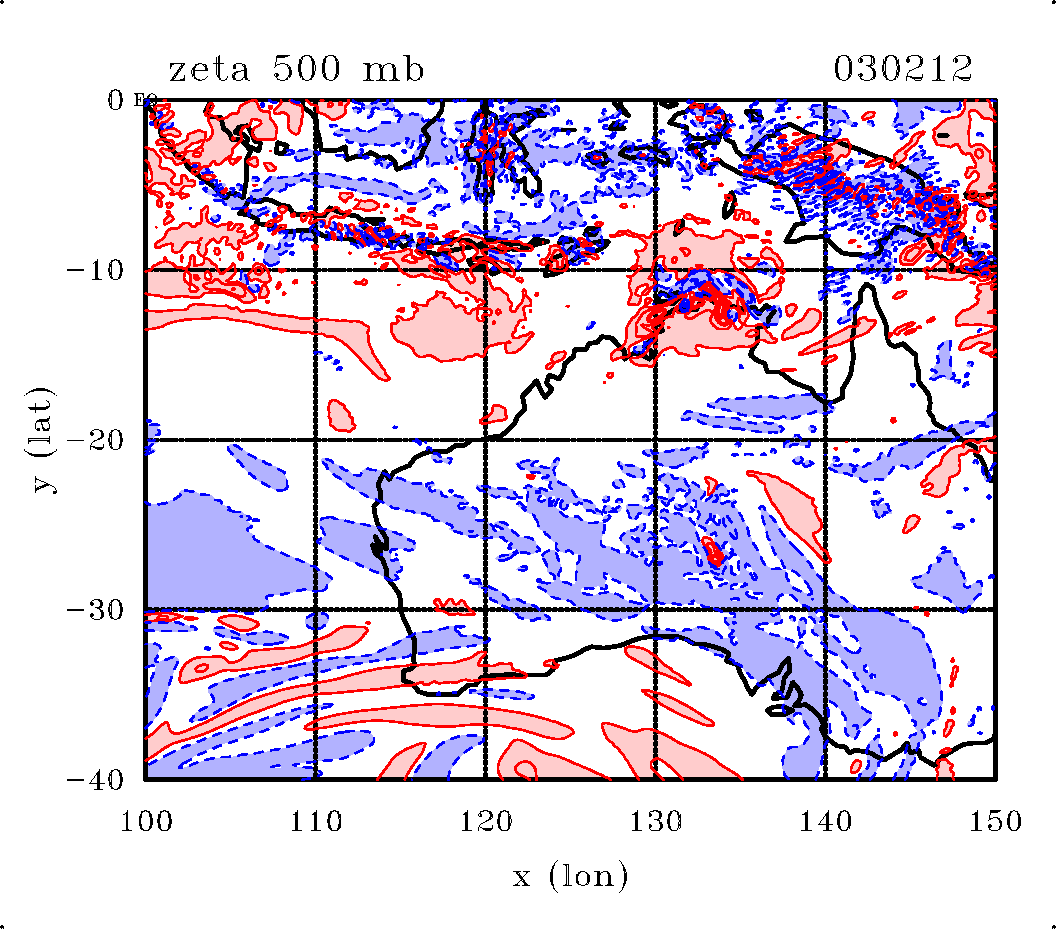
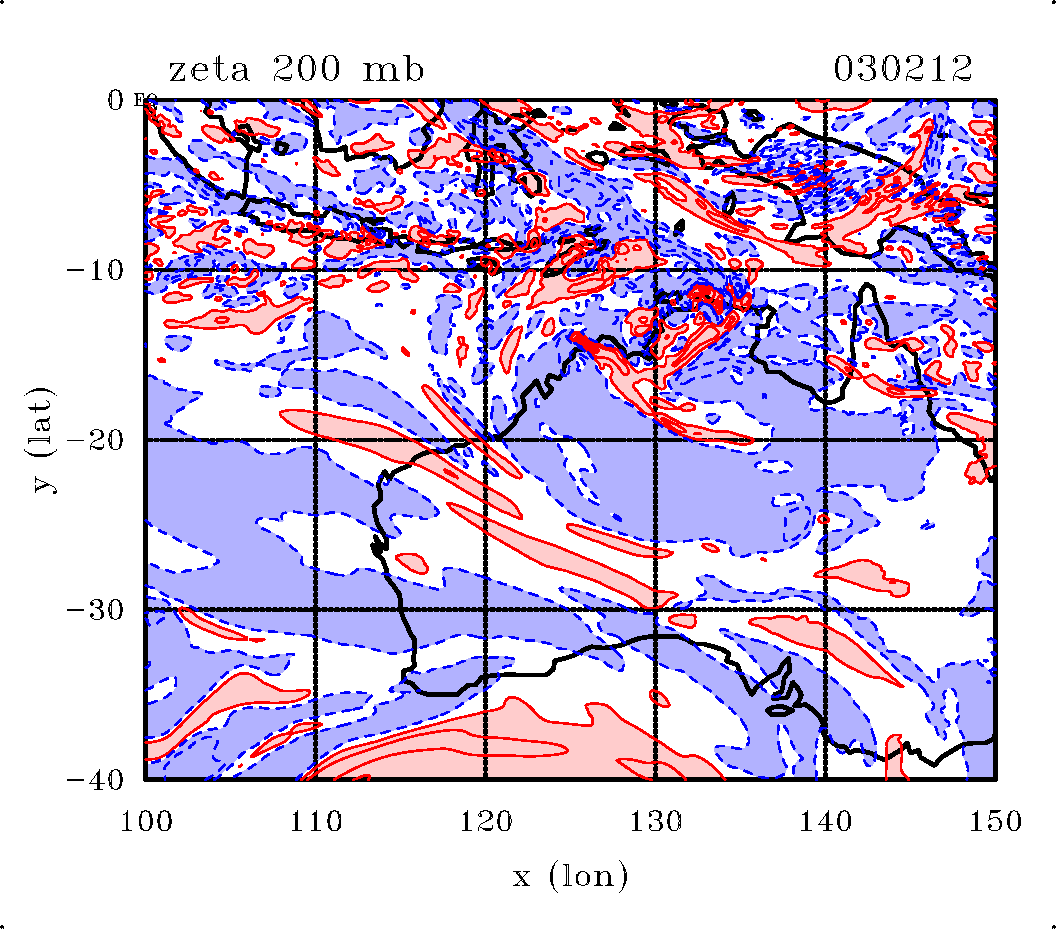
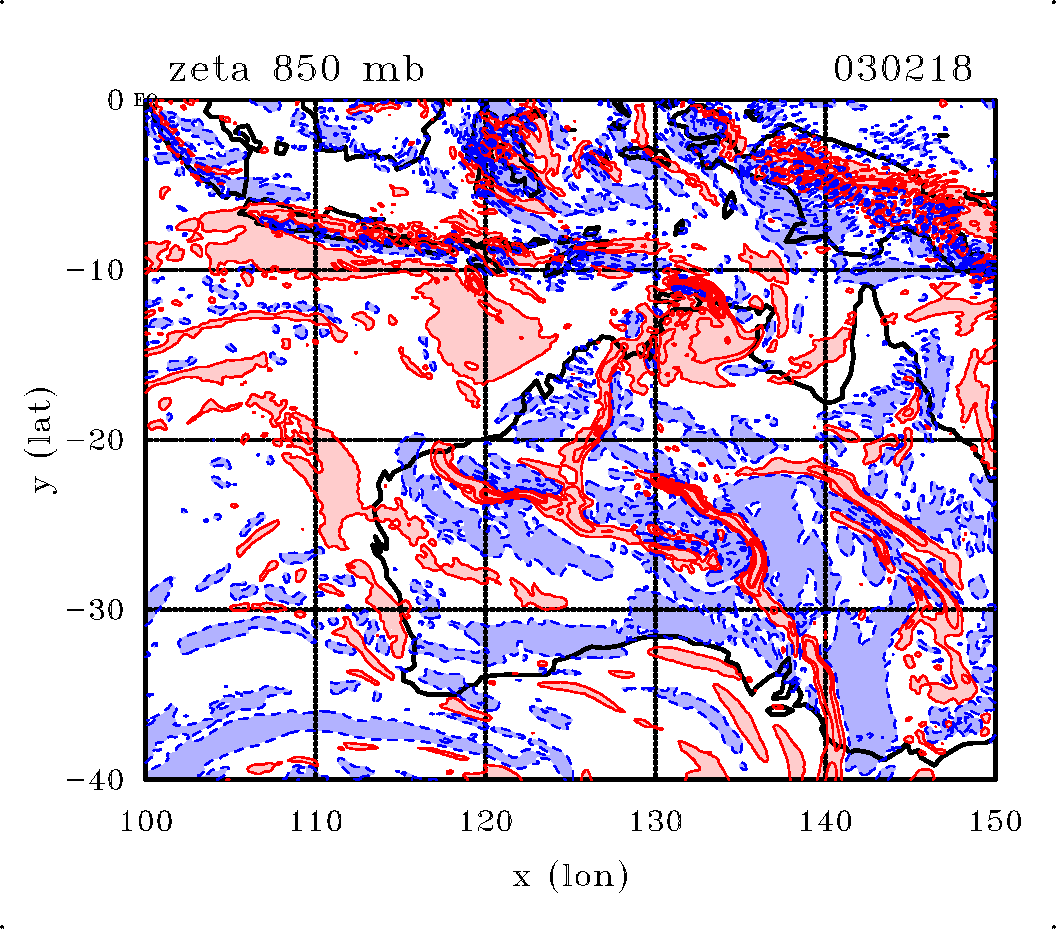
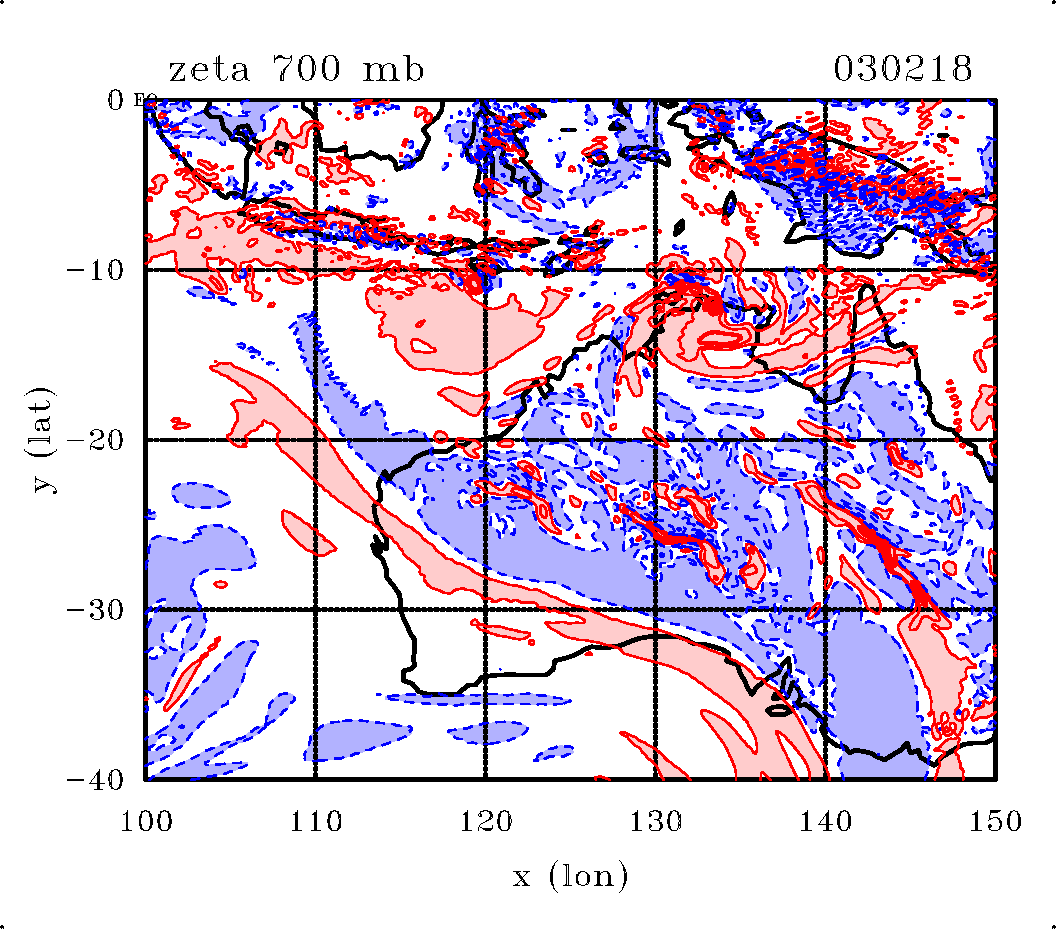
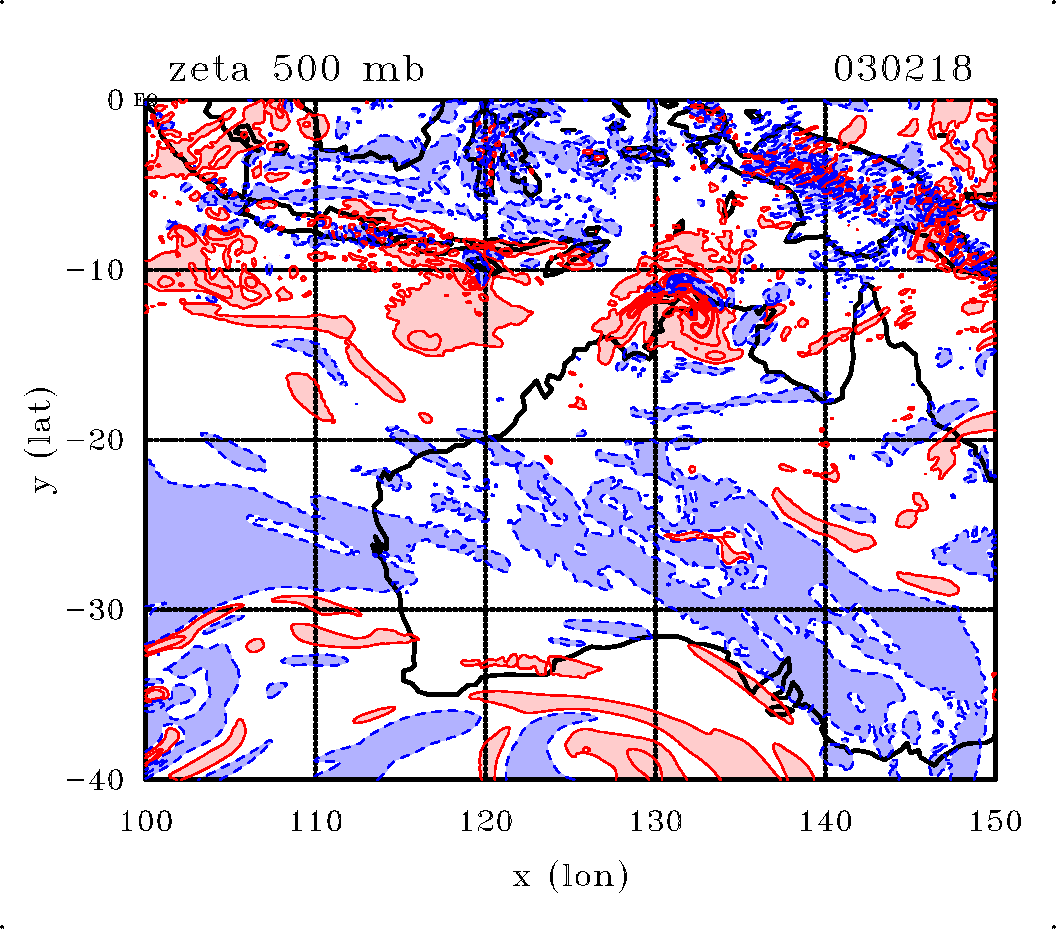
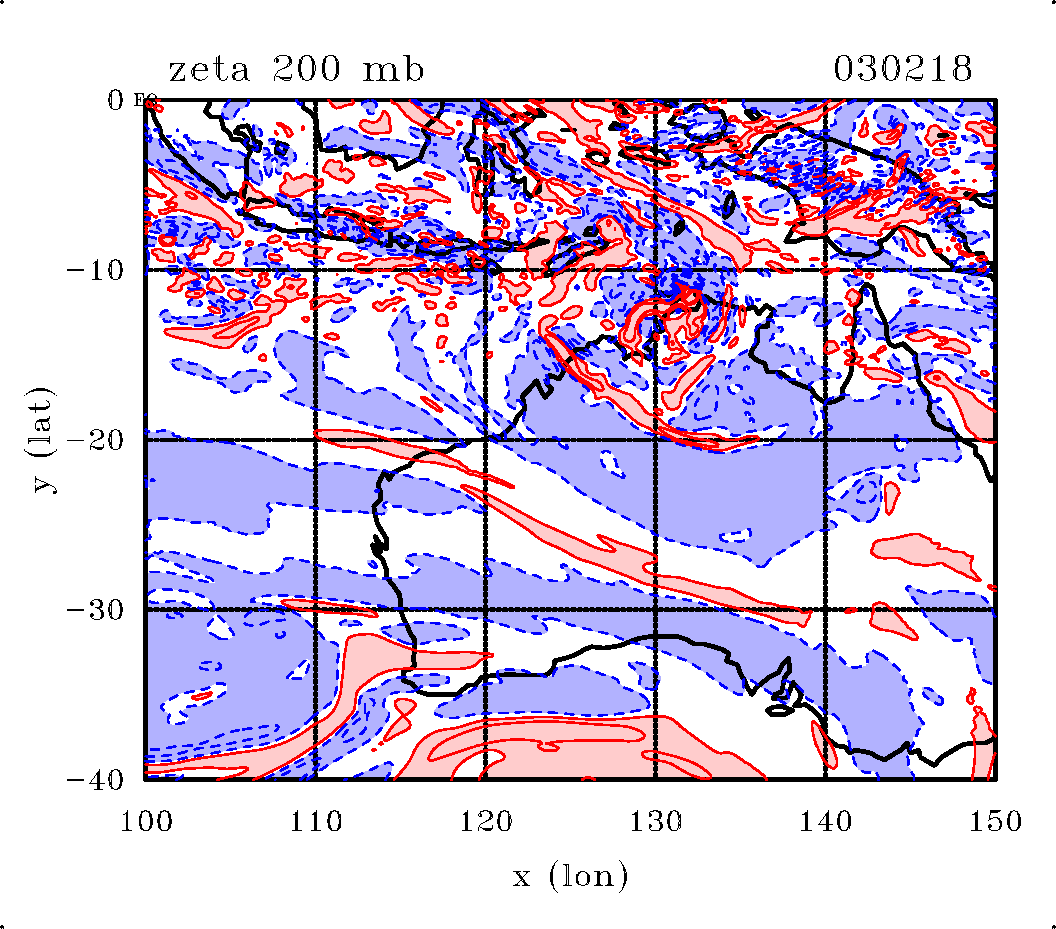
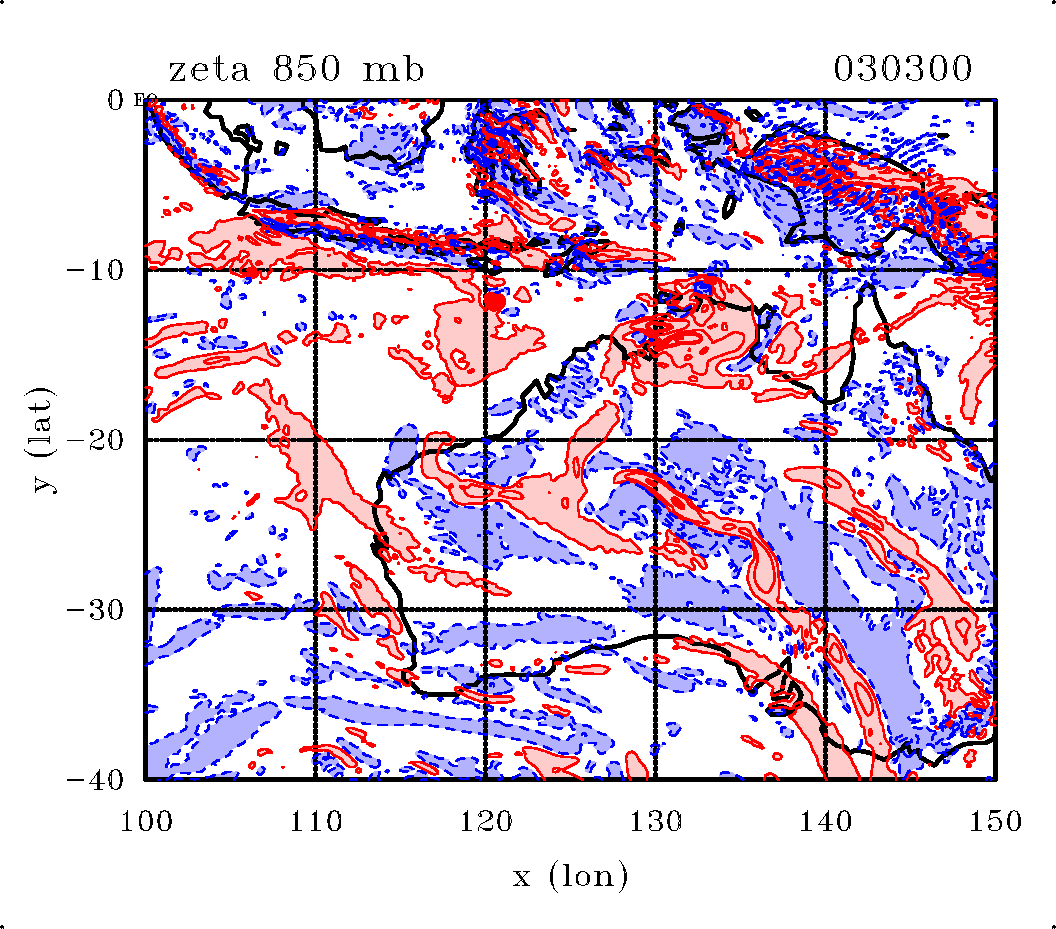
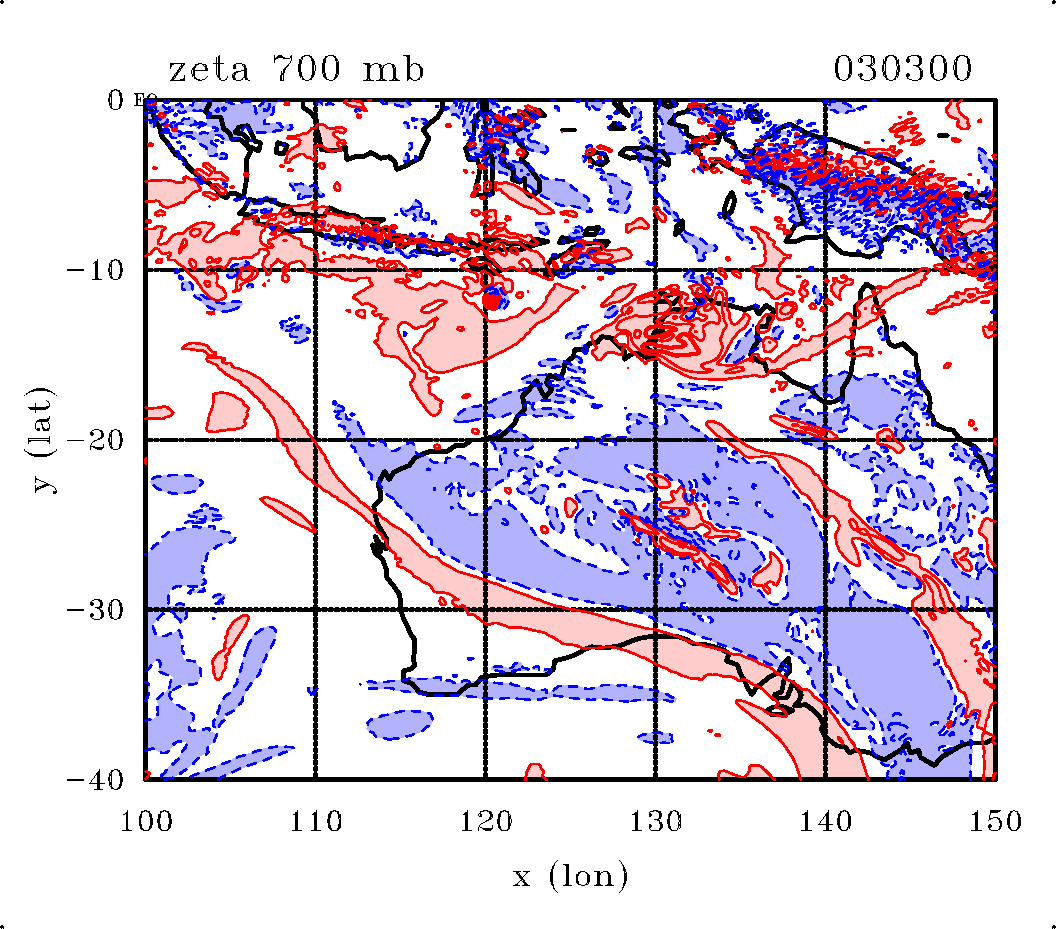
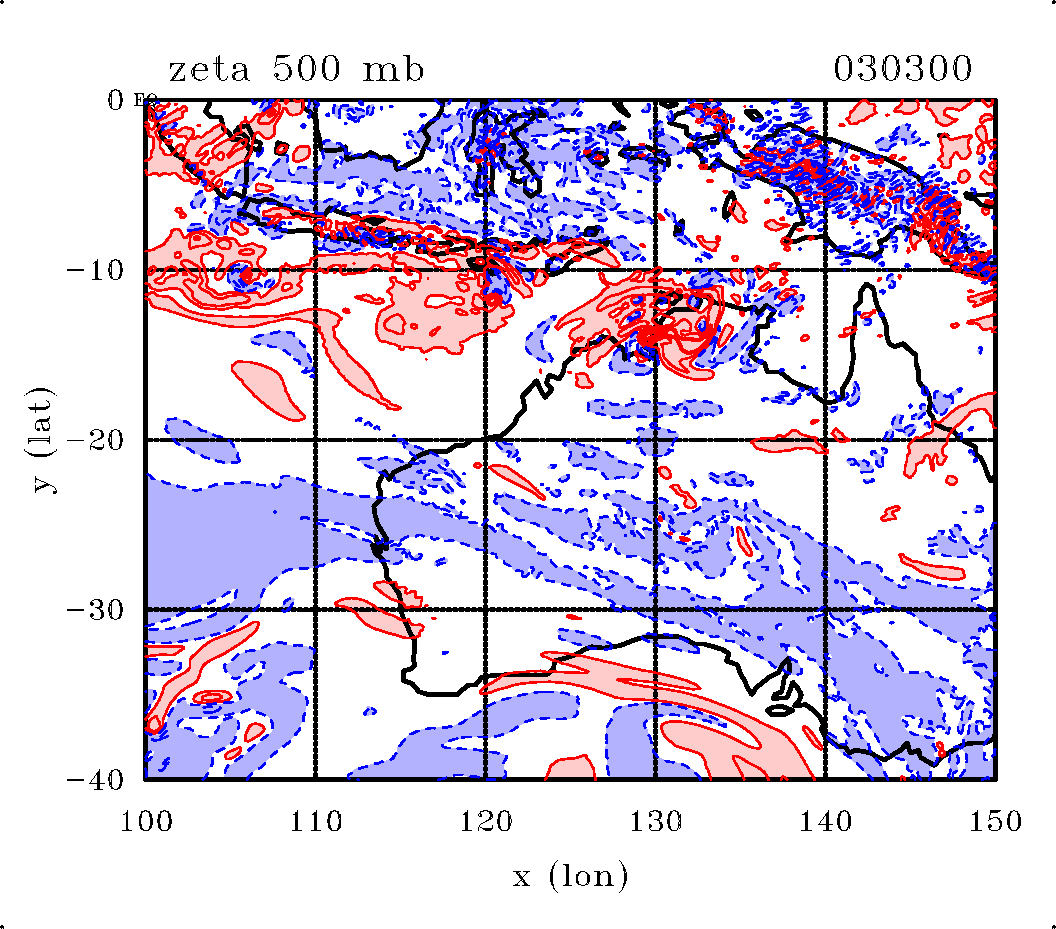
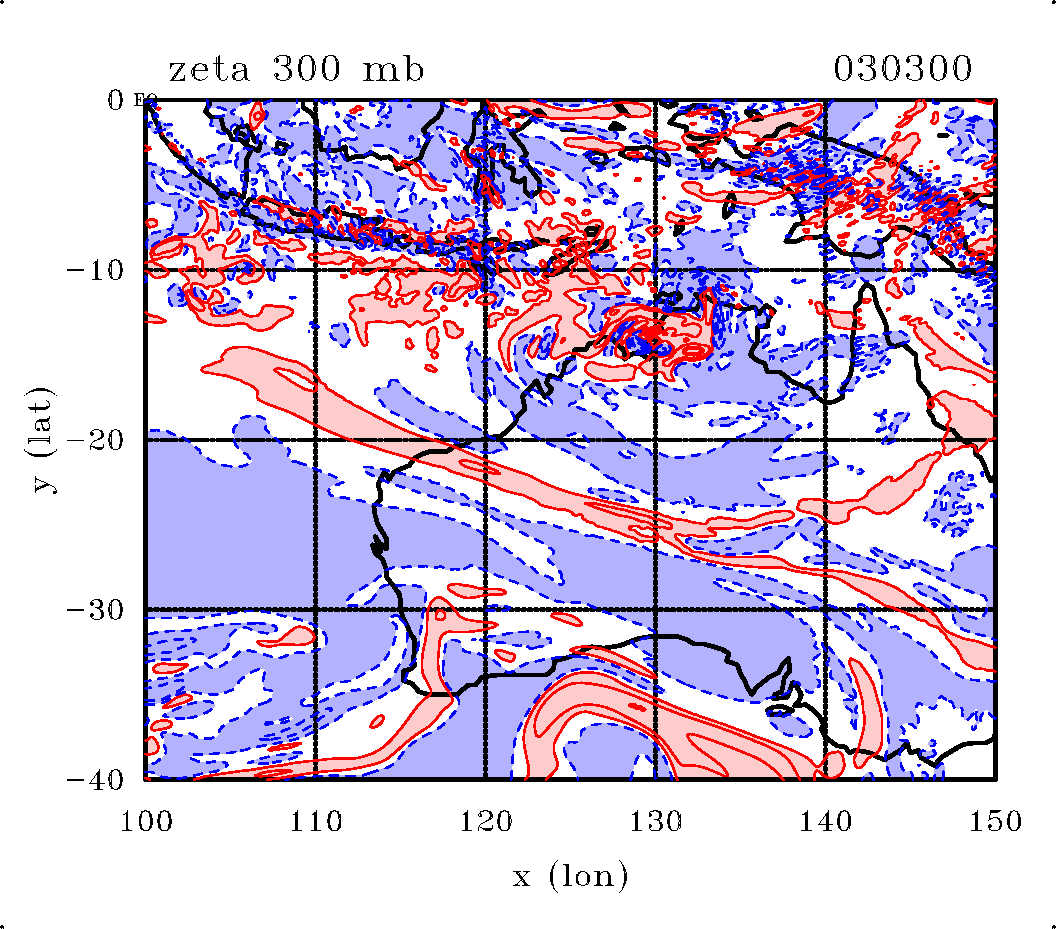
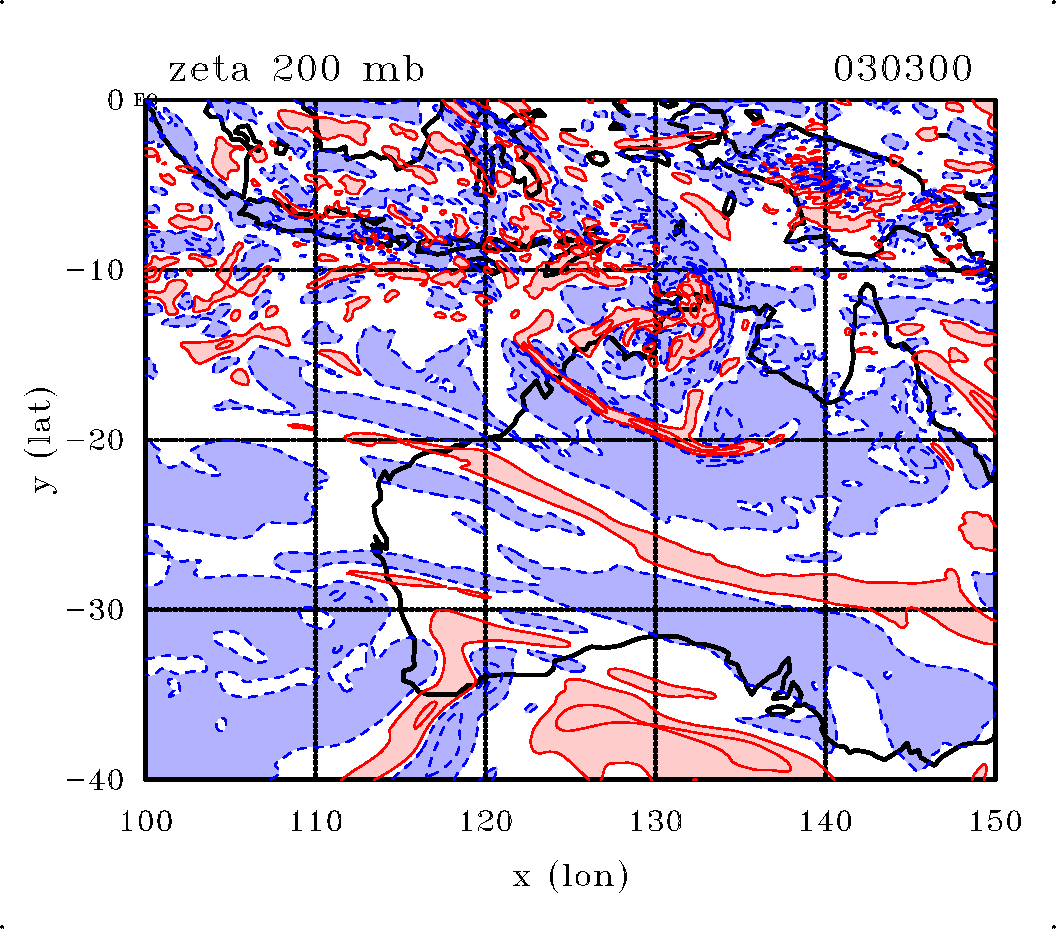
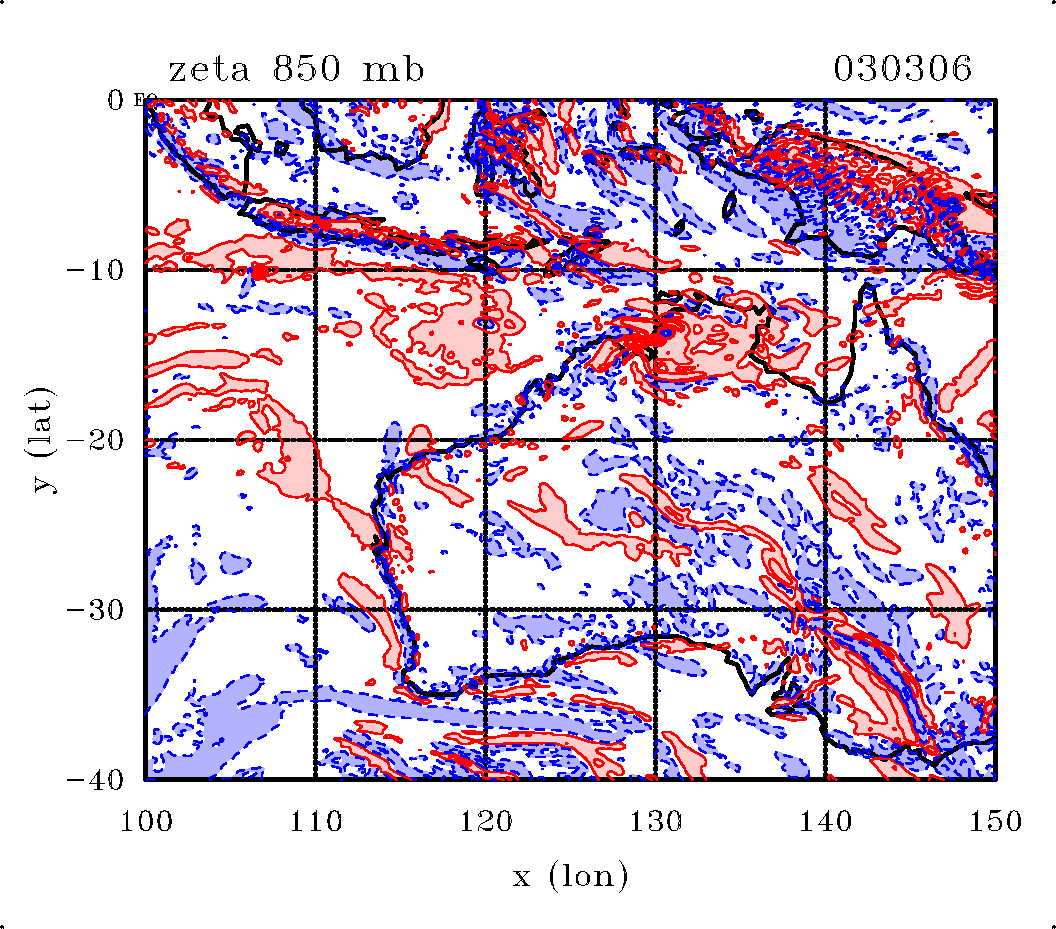
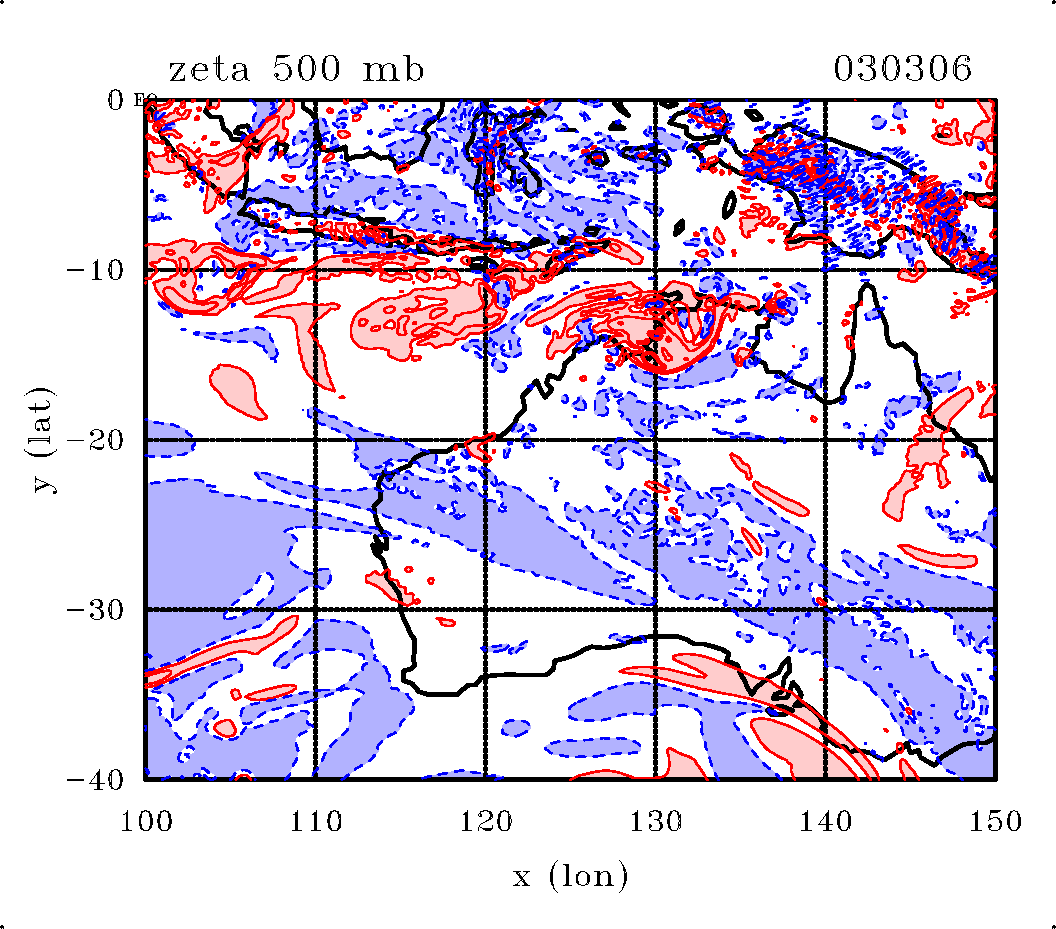
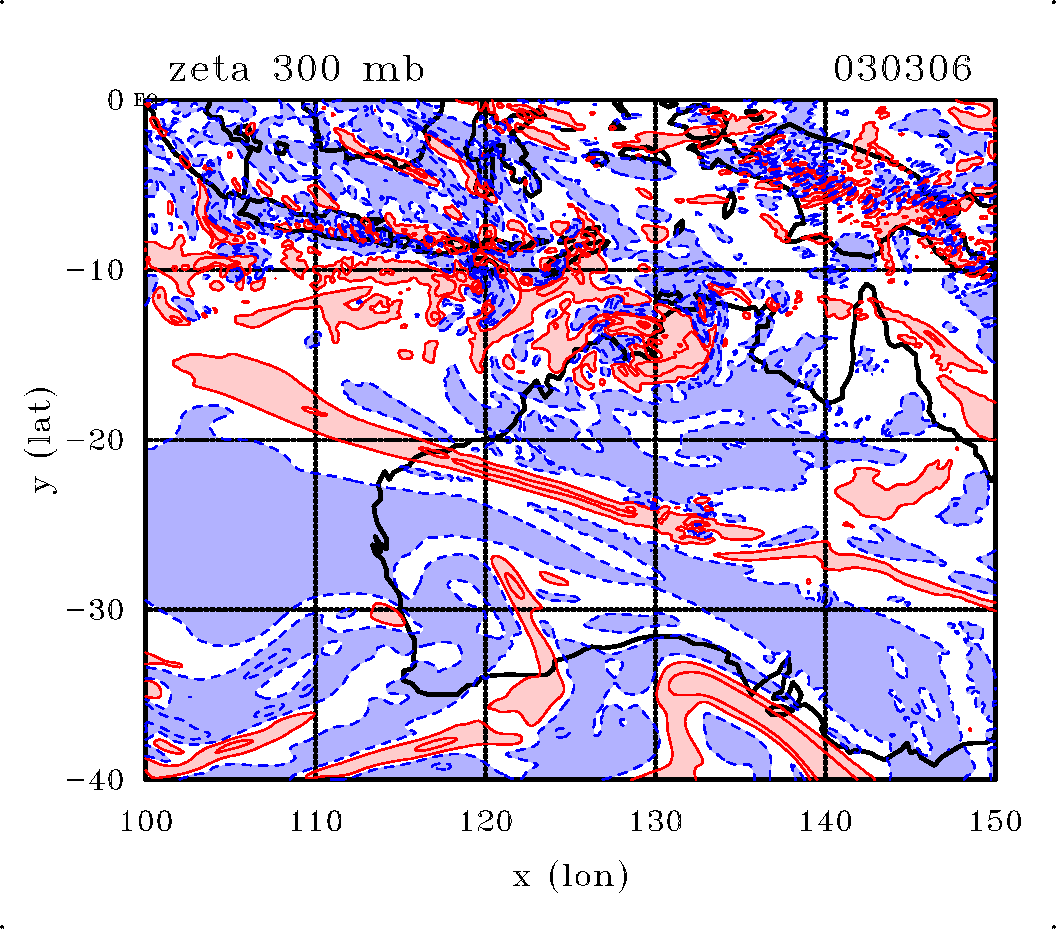
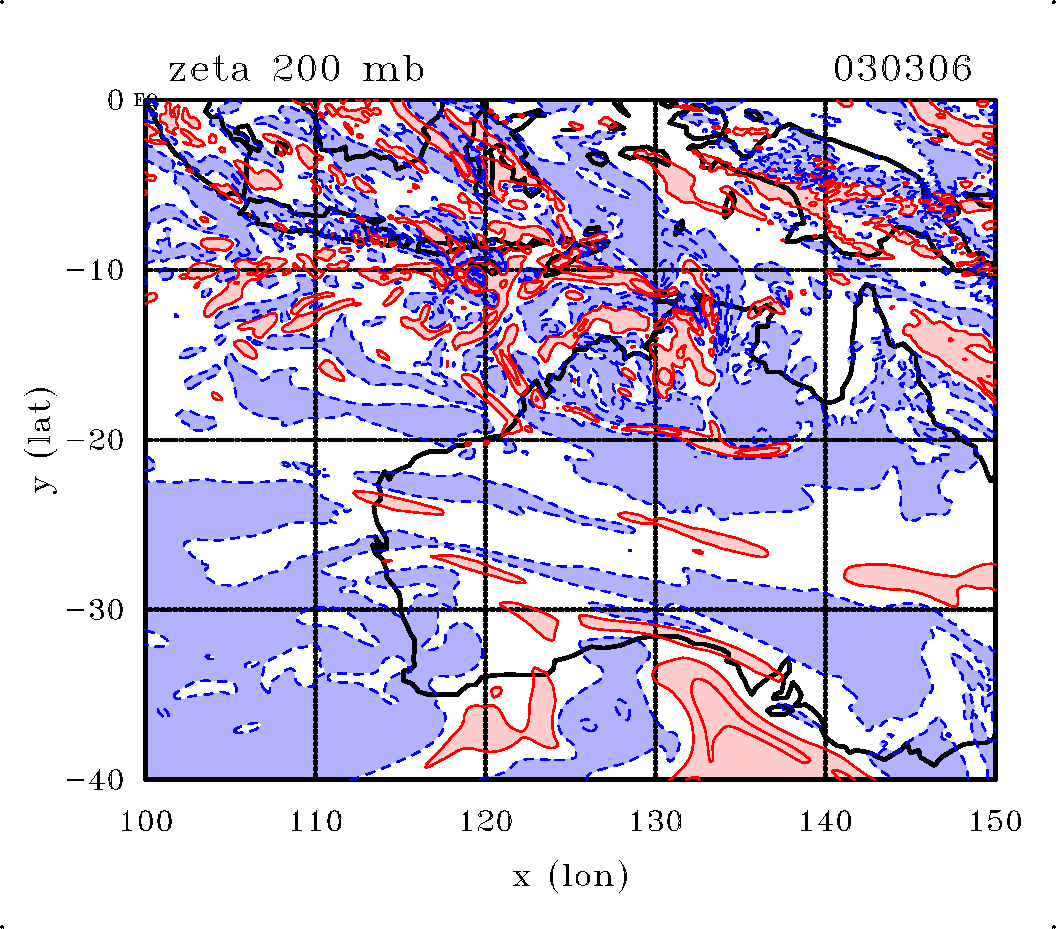
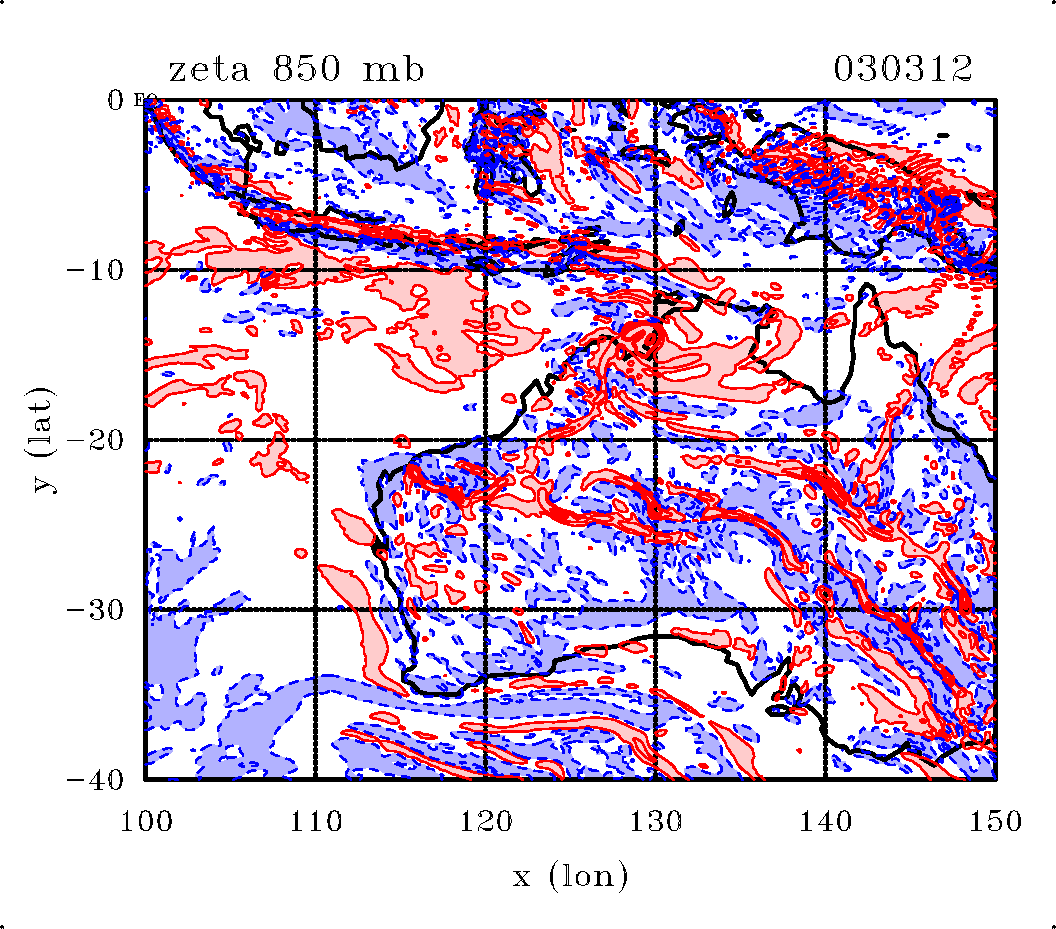
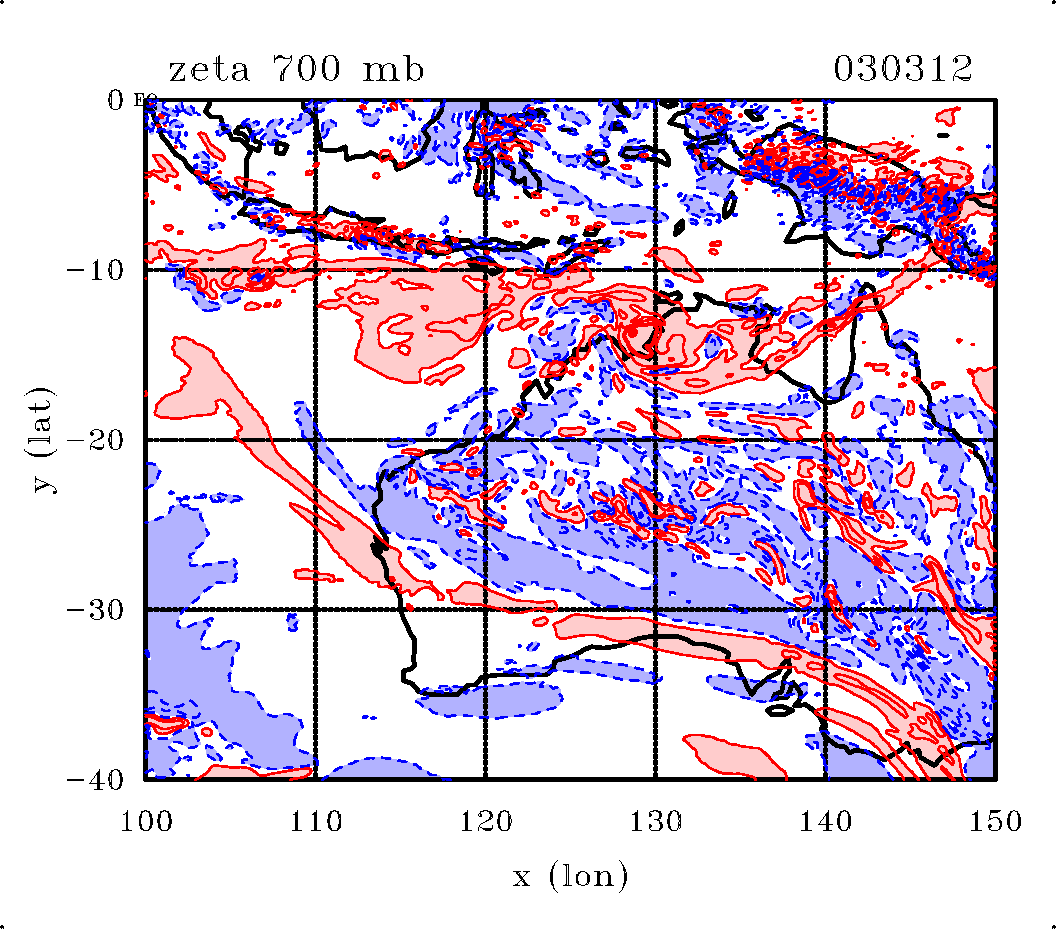
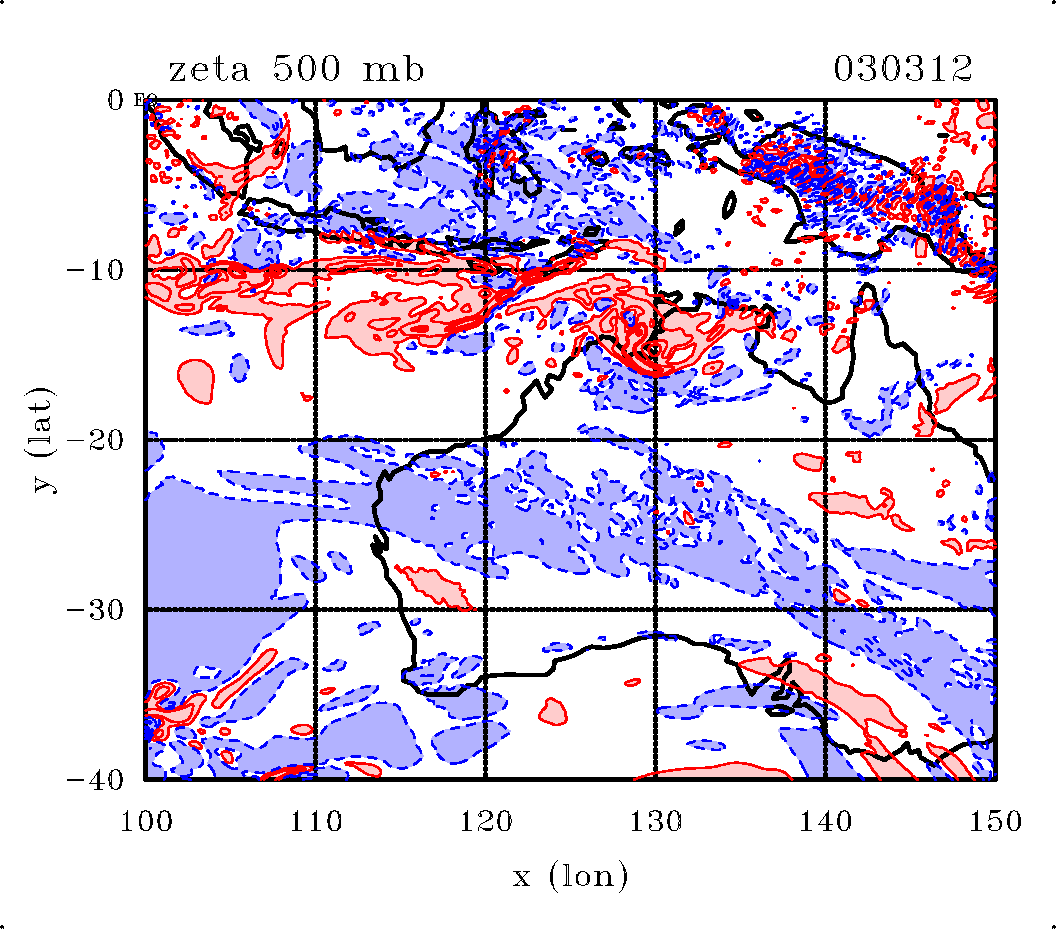
Tropical Cyclone George Feb 2007: Relative vorticity
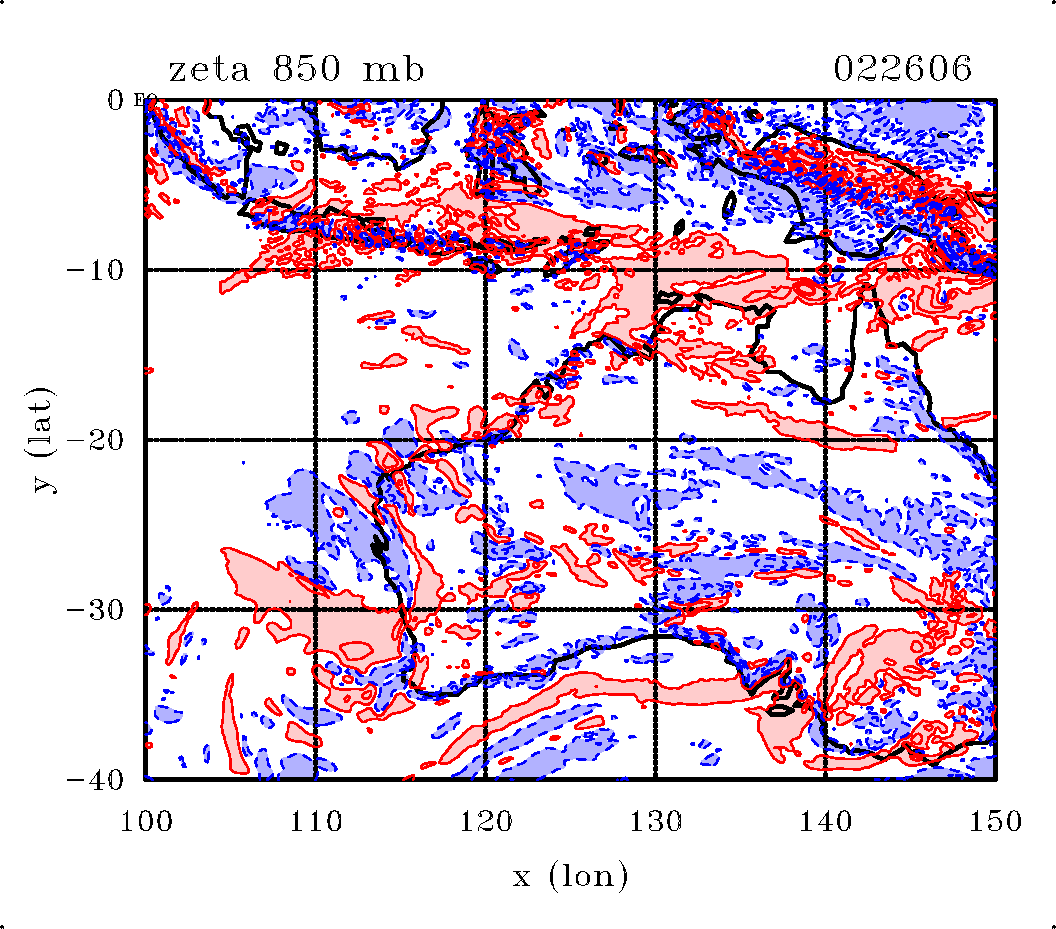
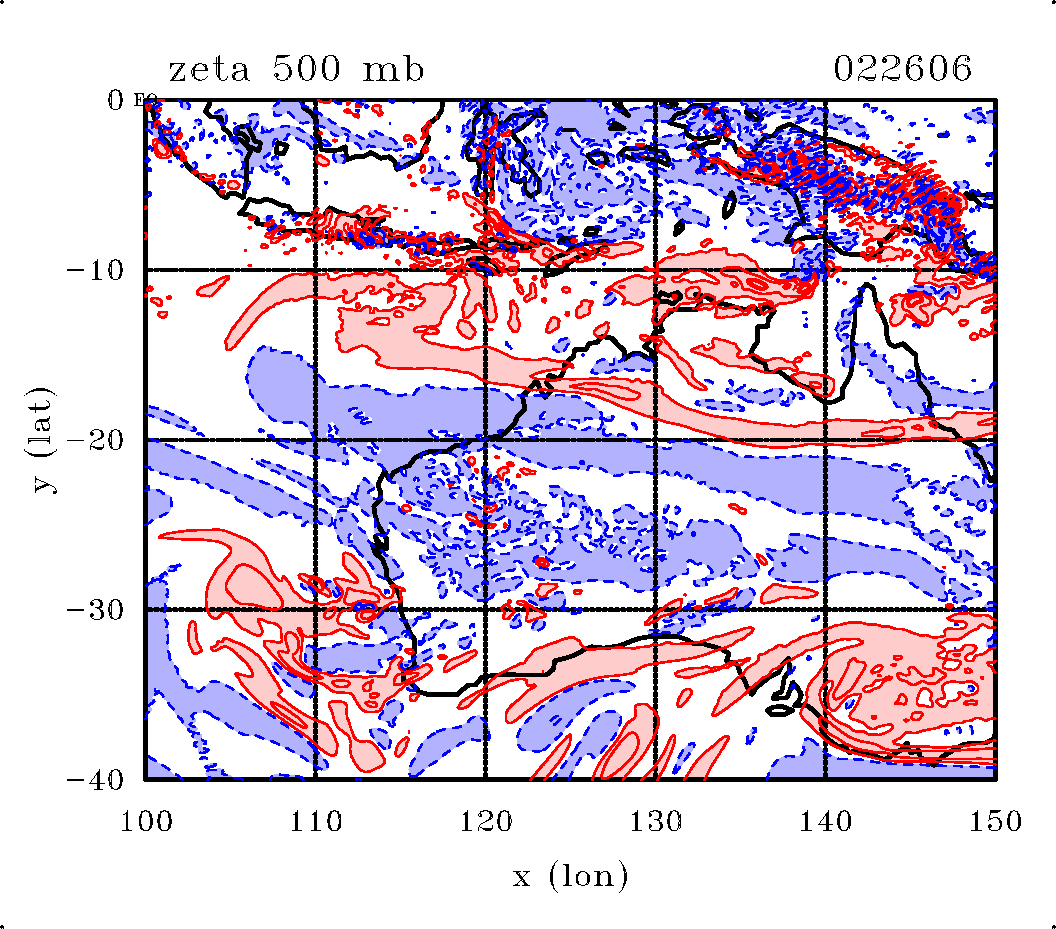
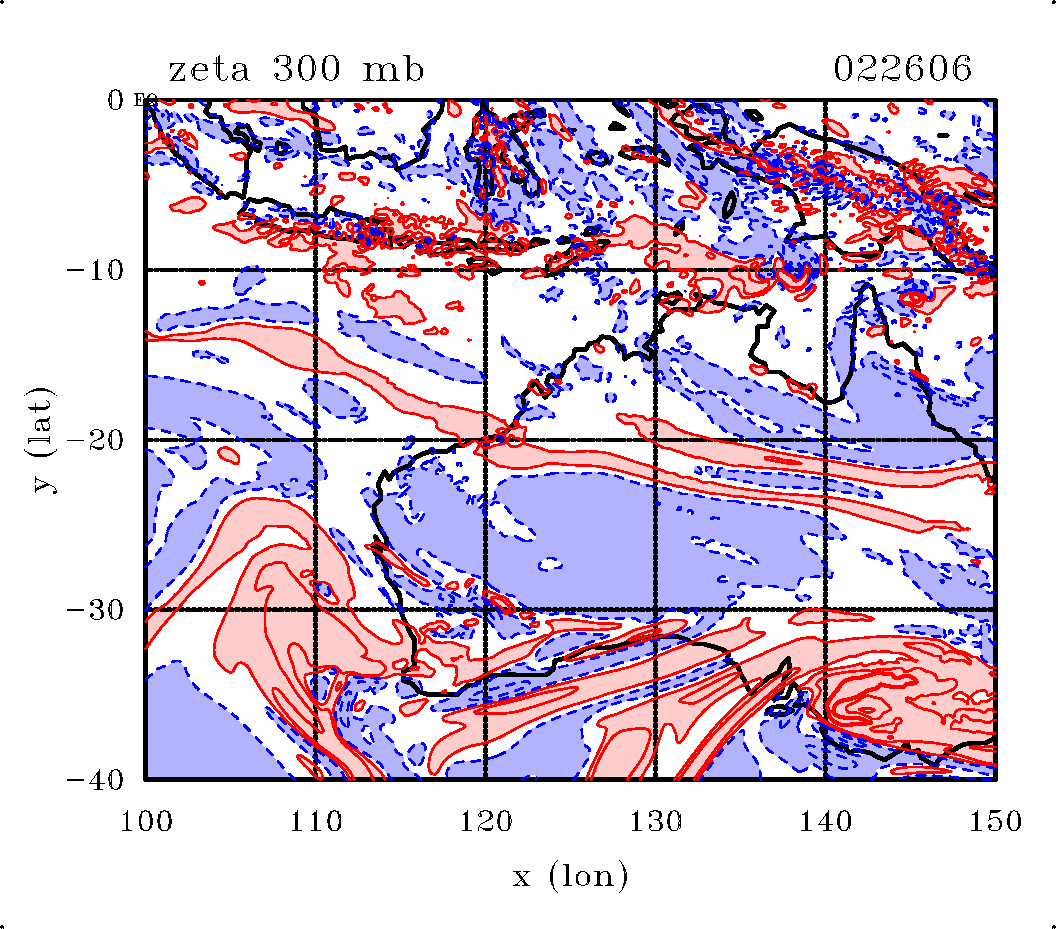
Vertical vorticity at selected pressure levels
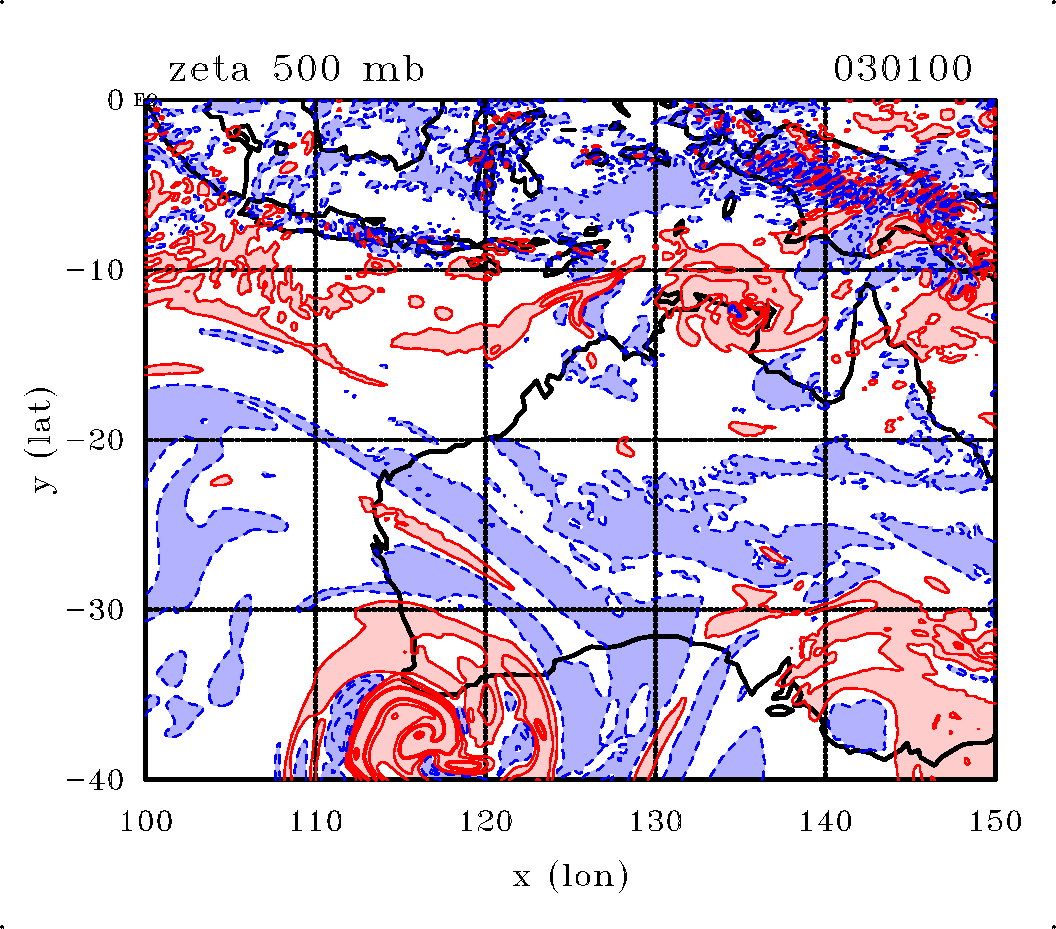
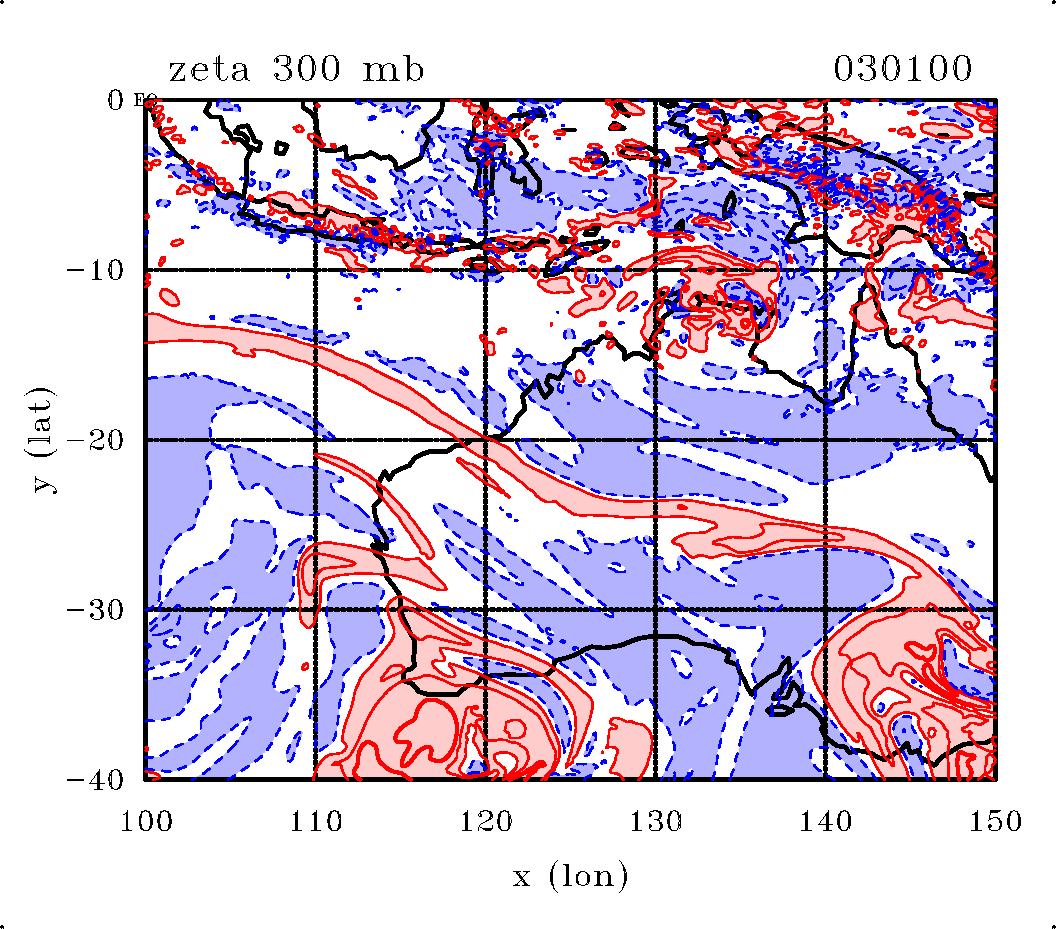
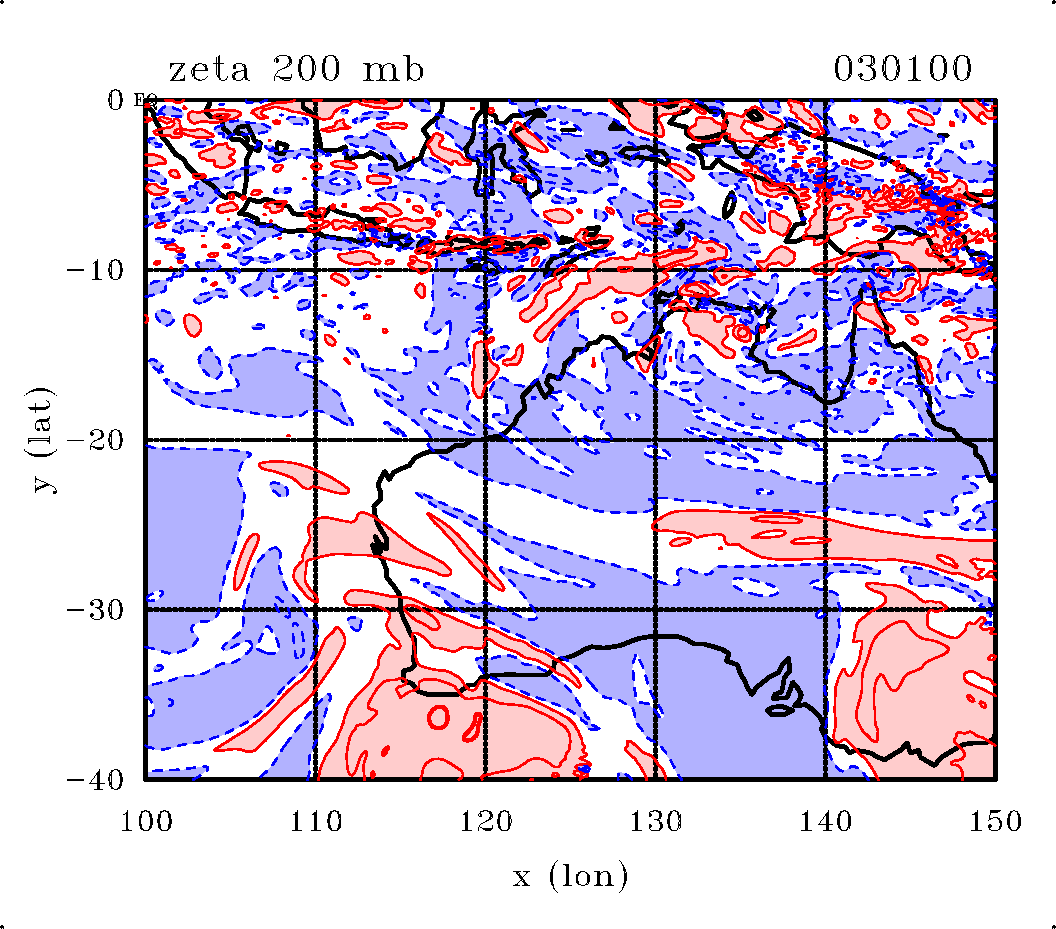
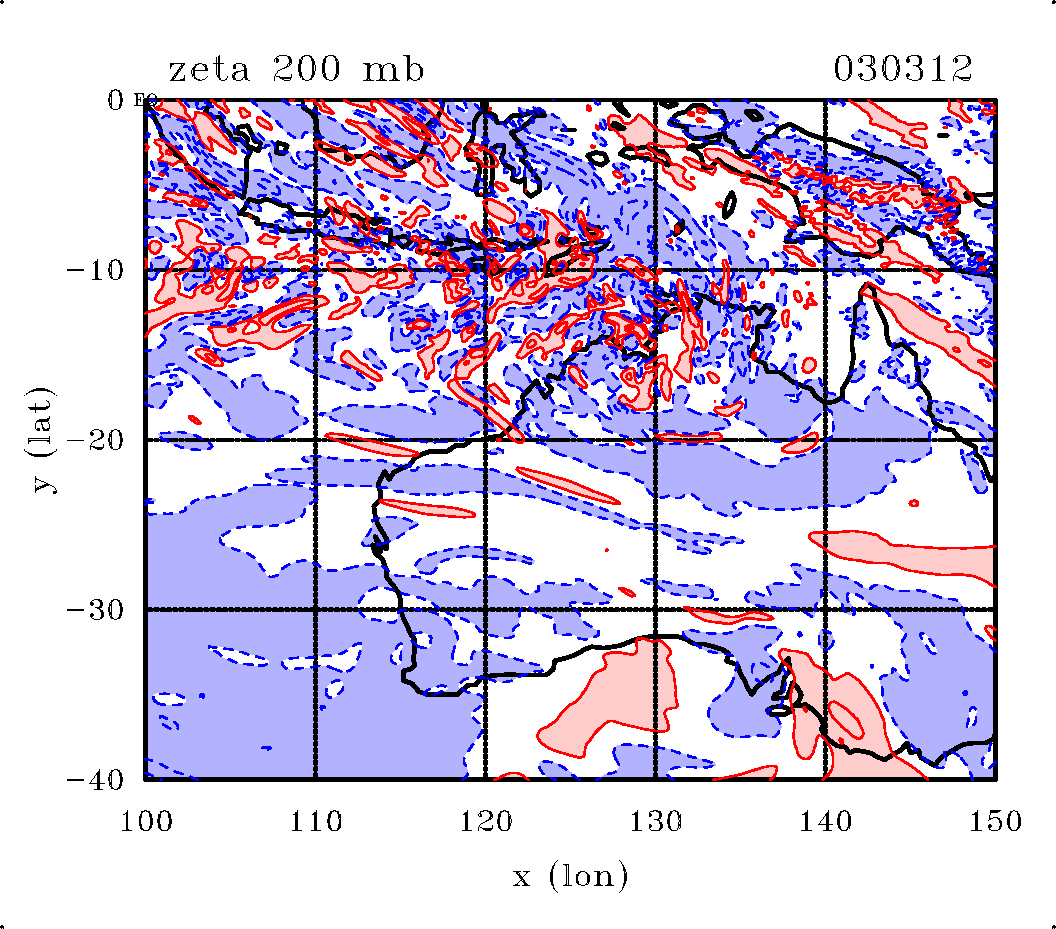
The following plots show contours of vertical vorticity during the genesis and mature stage of the disturbances. Contour levels are: thick contours 10-4 s-1 s-1; thin contours 2*10-5 s-1; Negative contours blue/dashed. Regions of cyclonic > 2*10-5 s-1 are shaded pink; regions of anticyclonic vorticity < -2*10-5 s-1 shaded light blue.
 |  |
 |  |
 | " />
|
 |  |
 |  |
 | " />
|
 |  |
 |  |
 | " />
|
 |  |
 |  |
 | " />
|
 |  |
 |  |
 | " />
|
 |  |
 |  |
 | " />
|
 |  |
 |  |
 | " />
|
 |  |
 |  |
 | " />
|
 |  |
 |  |
 | " />
|
 |  |
 |  |
 | " />
|
 |  |
 |  |
 | " />
|
 |  |
 |  |
 | " />
|
 |  |
 |  |
 | " />
|
 |  |
 |  |
 | " />
|
 |  |
 |  |
 | " />
|
 |  |
 |  |
 | " />
|
 |  |
 |  |
 | " />
|
 |  |
 |  |
 | " />
|
 |  |
 |  |
 | " />
|
 |  |
 |  |
 | " />
|
 |  |
 |  |
 | " />
|
 |  |
 |  |
 | " />
|
 |  |
 |  |
 | " />
|
 |  |
 |  |
 | " />
|
 |  |
 |  |
 | " />
|
 |  |
 |  |
 | " />
|
 |  |
 |  |
 | " />
Copyright © Roger Smith