Tropical Cyclone George Feb 2007
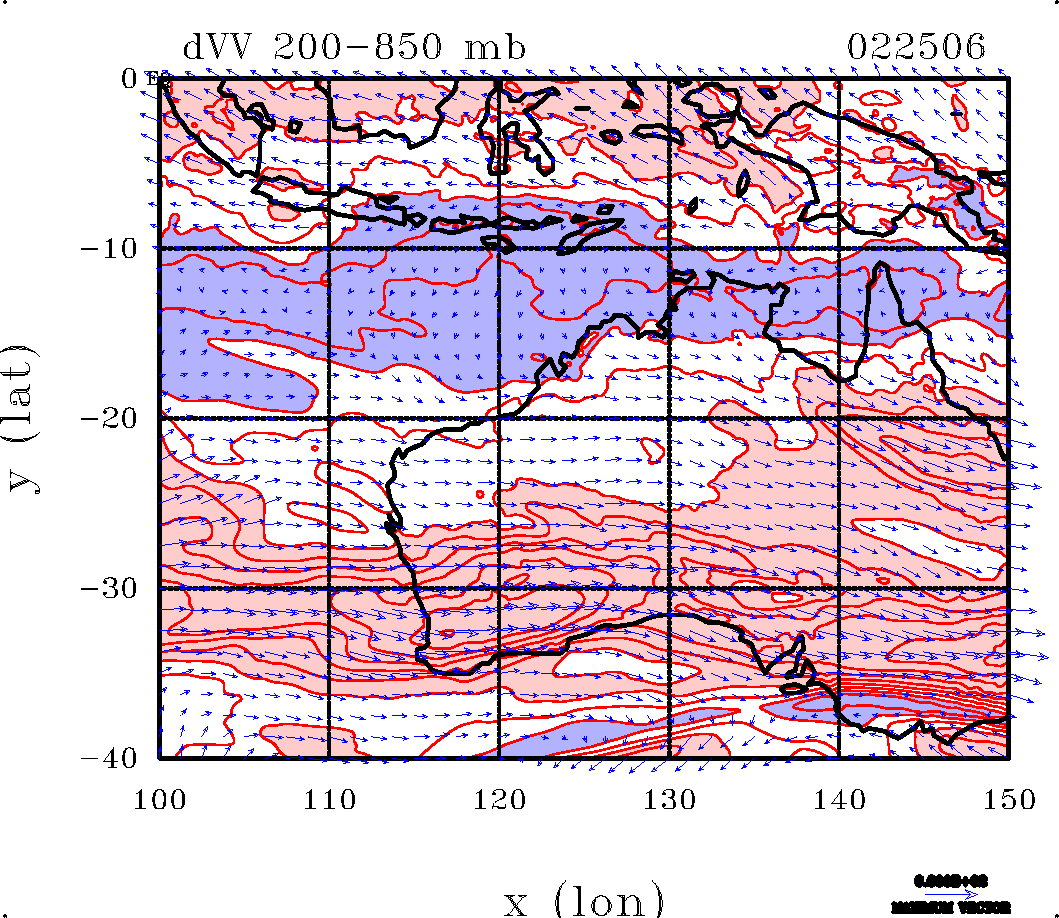
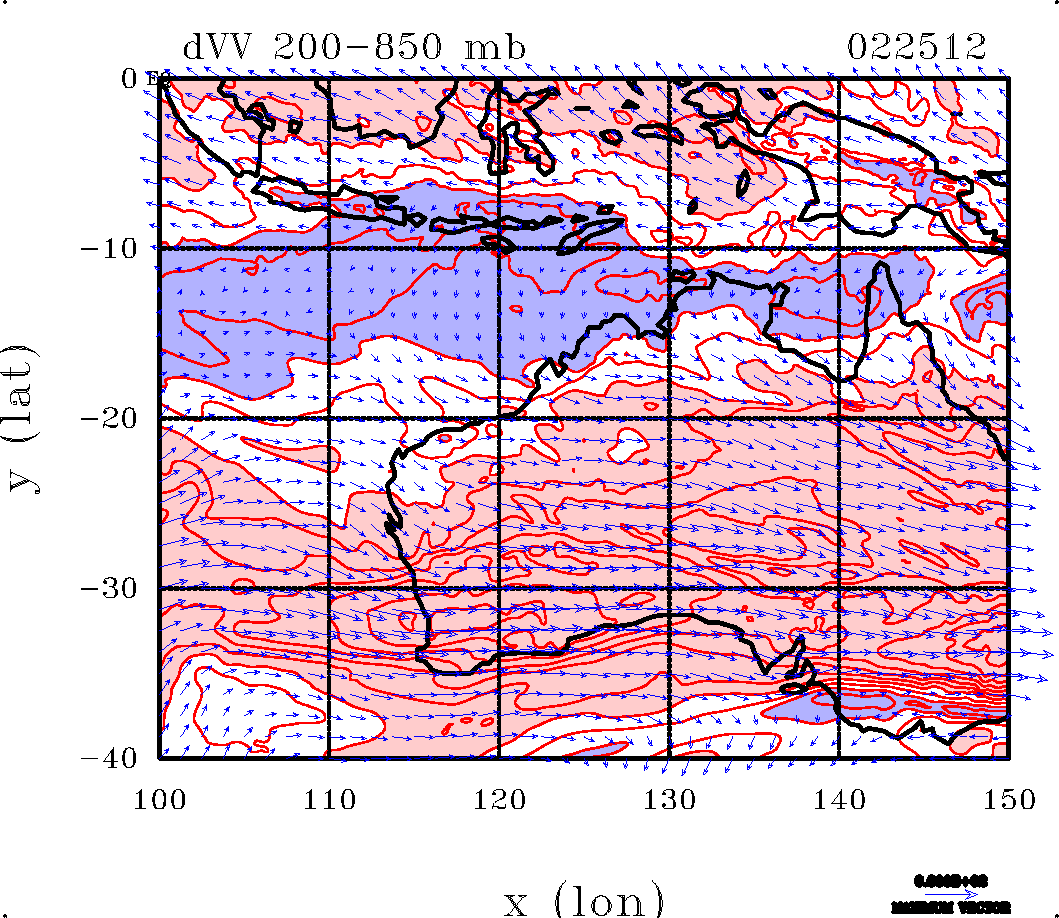
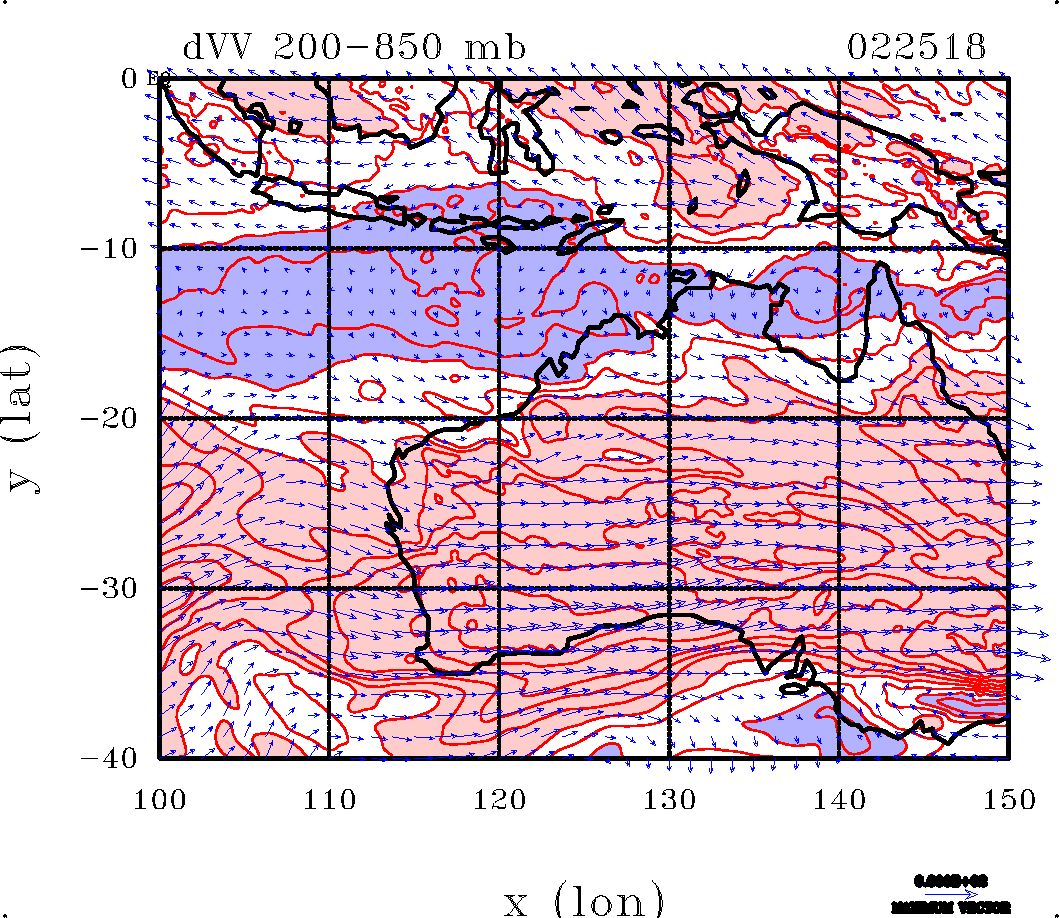
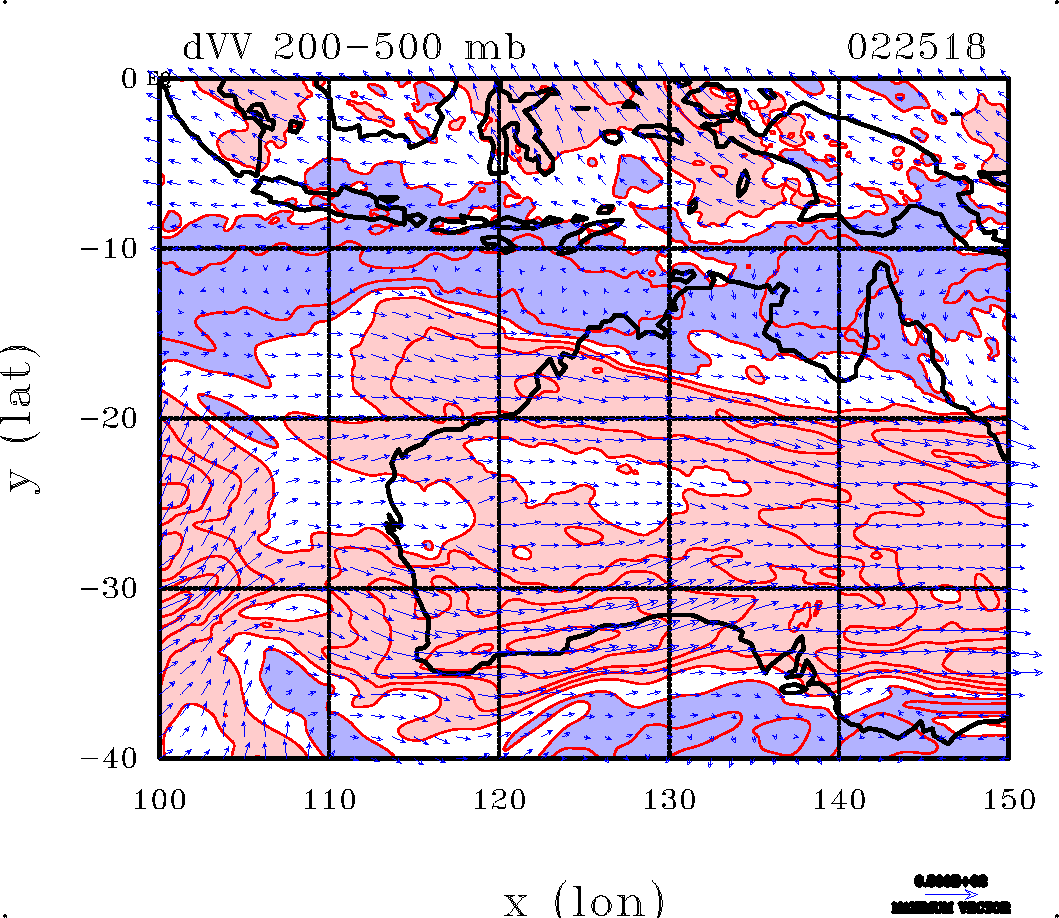
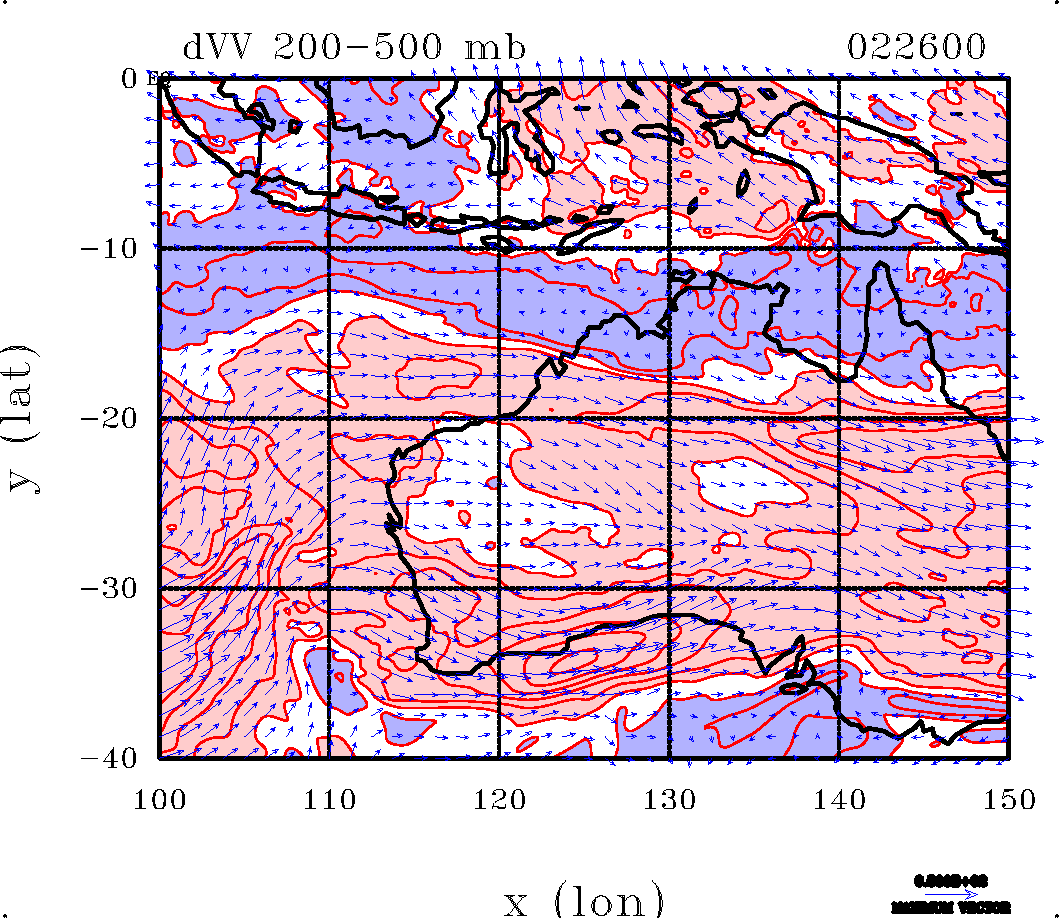
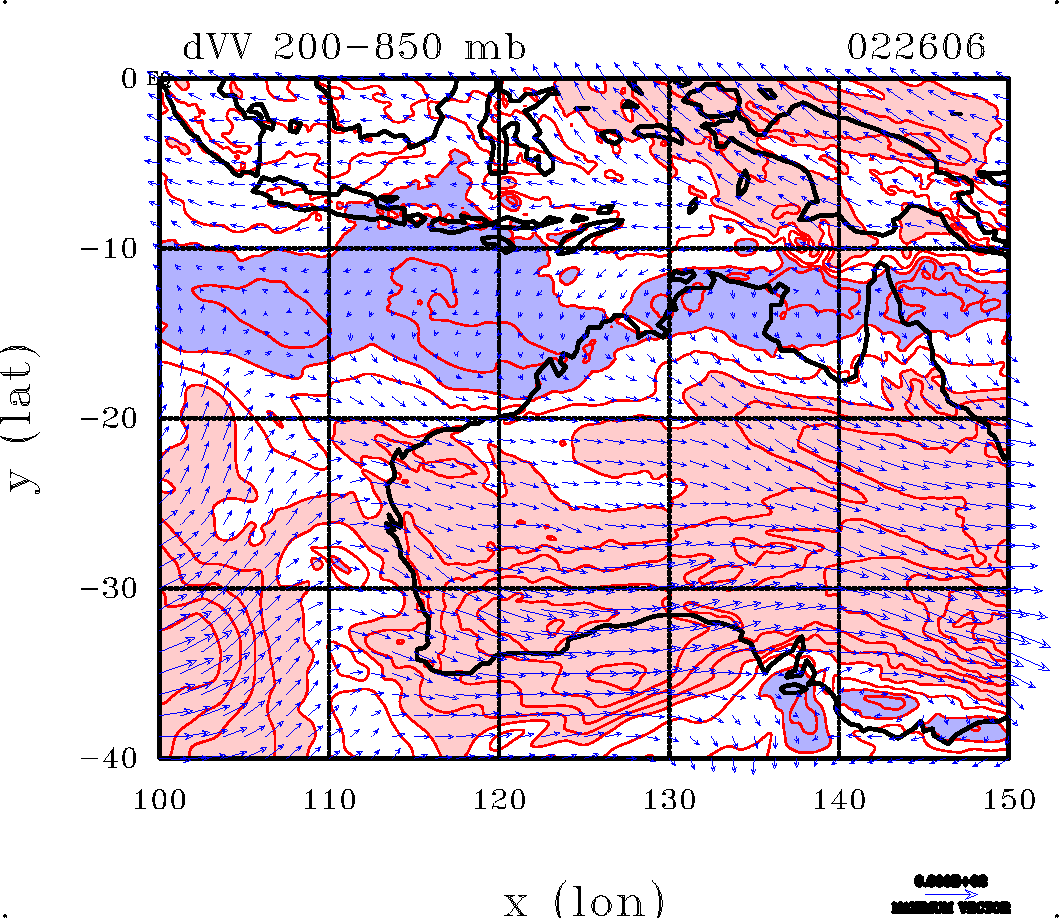
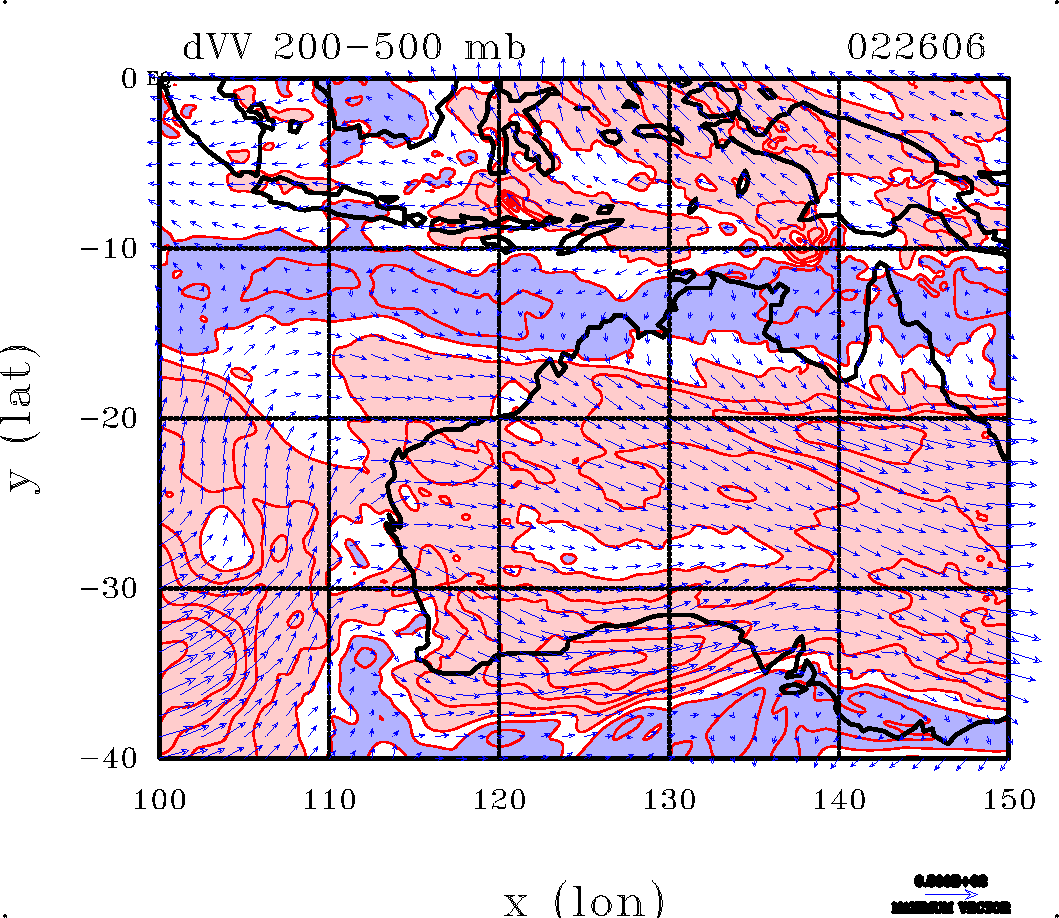
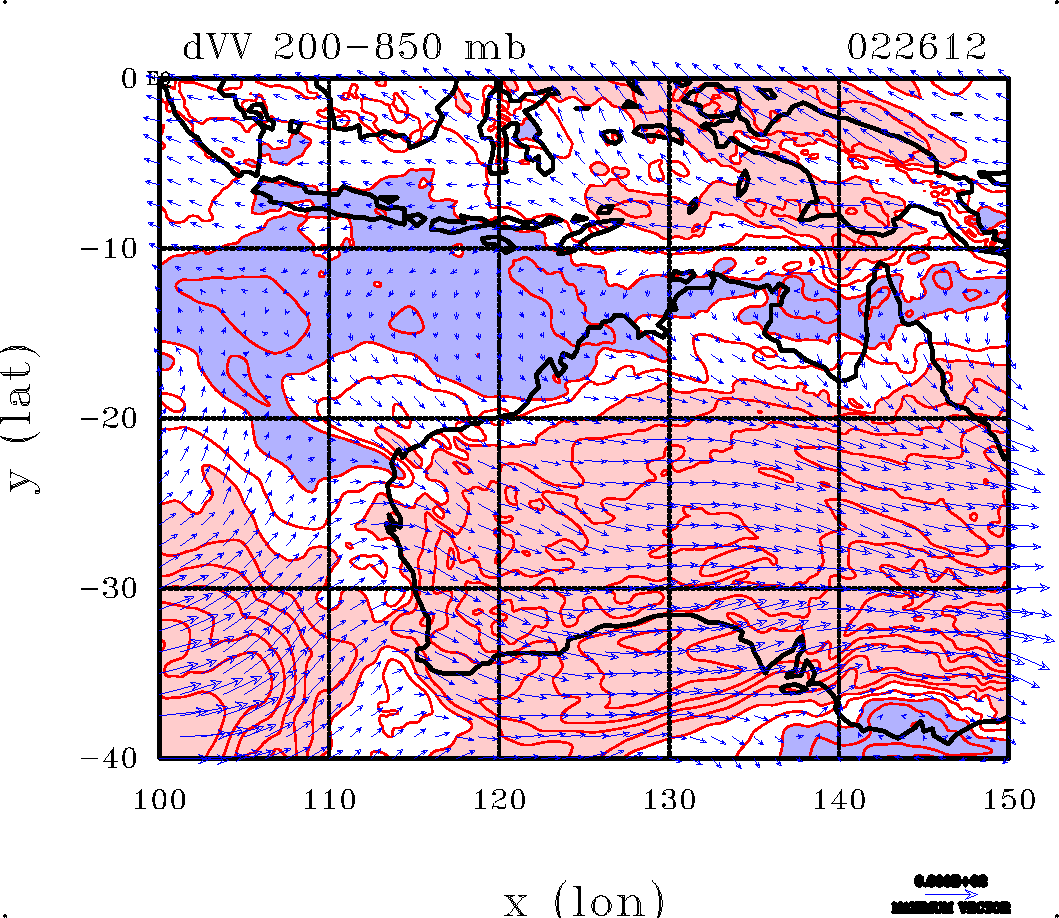
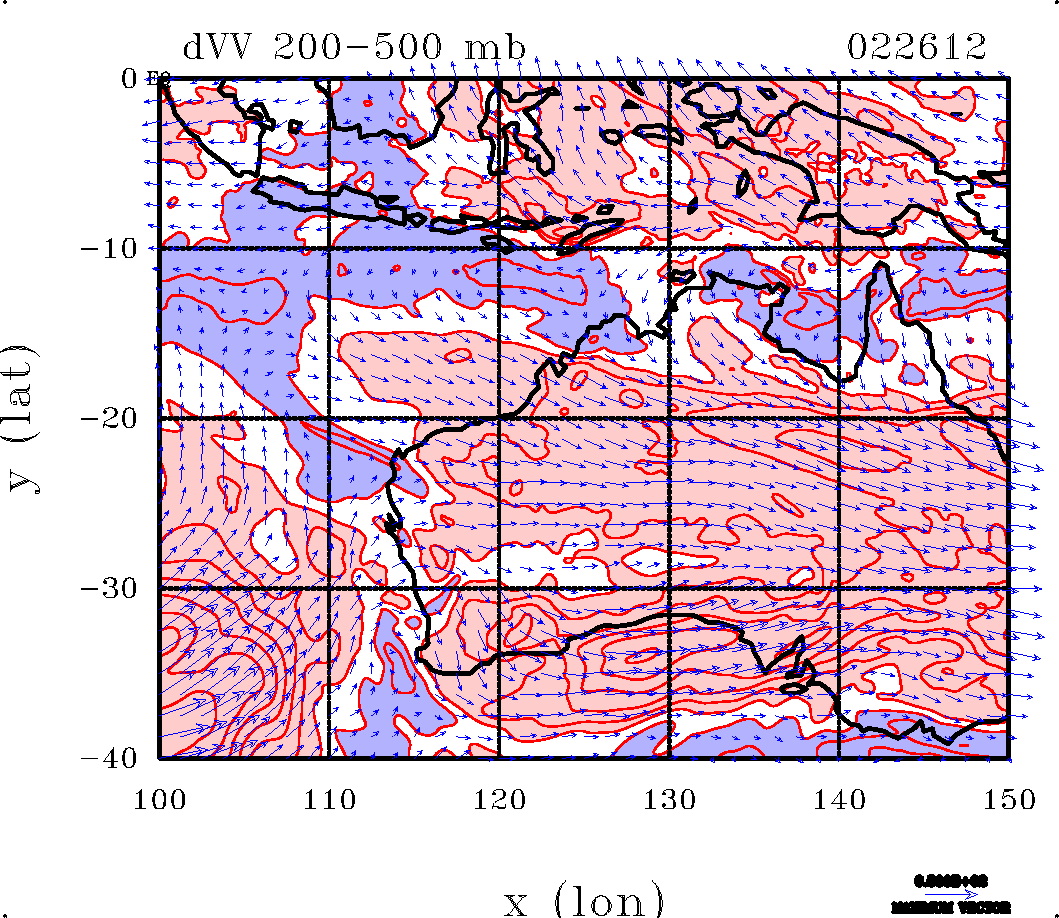
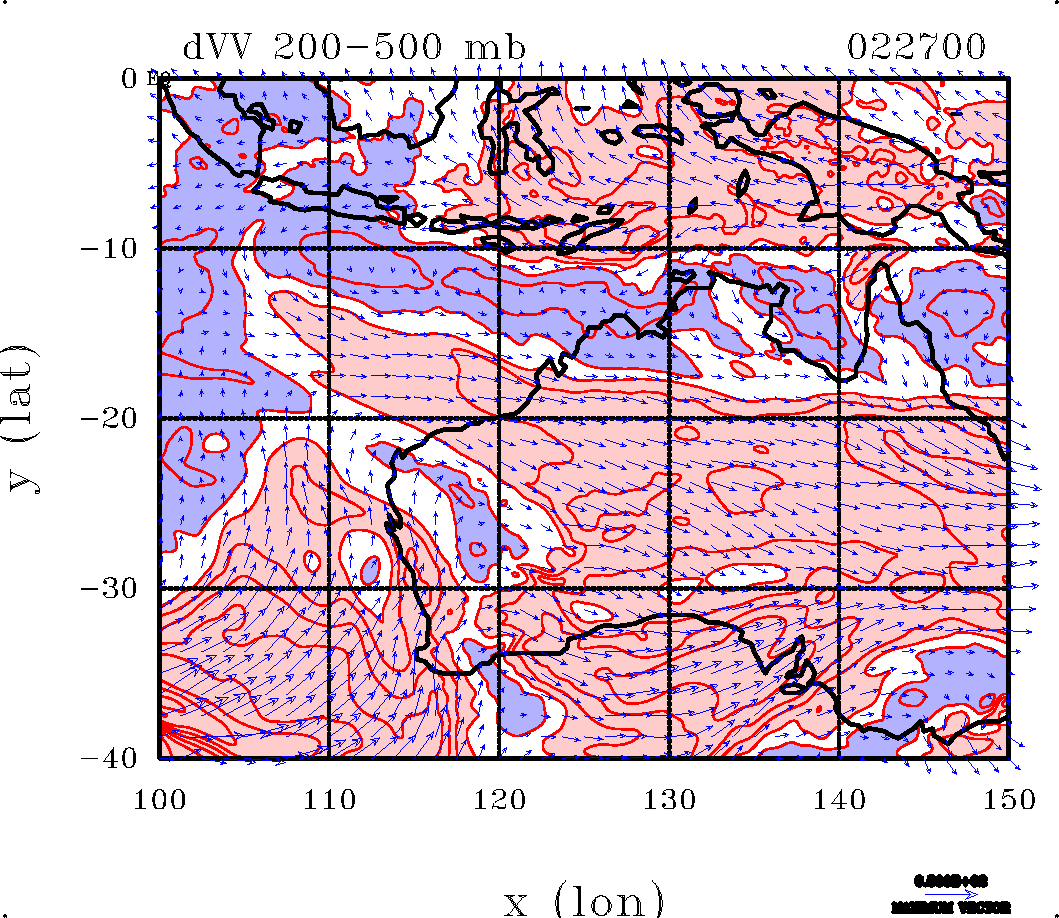
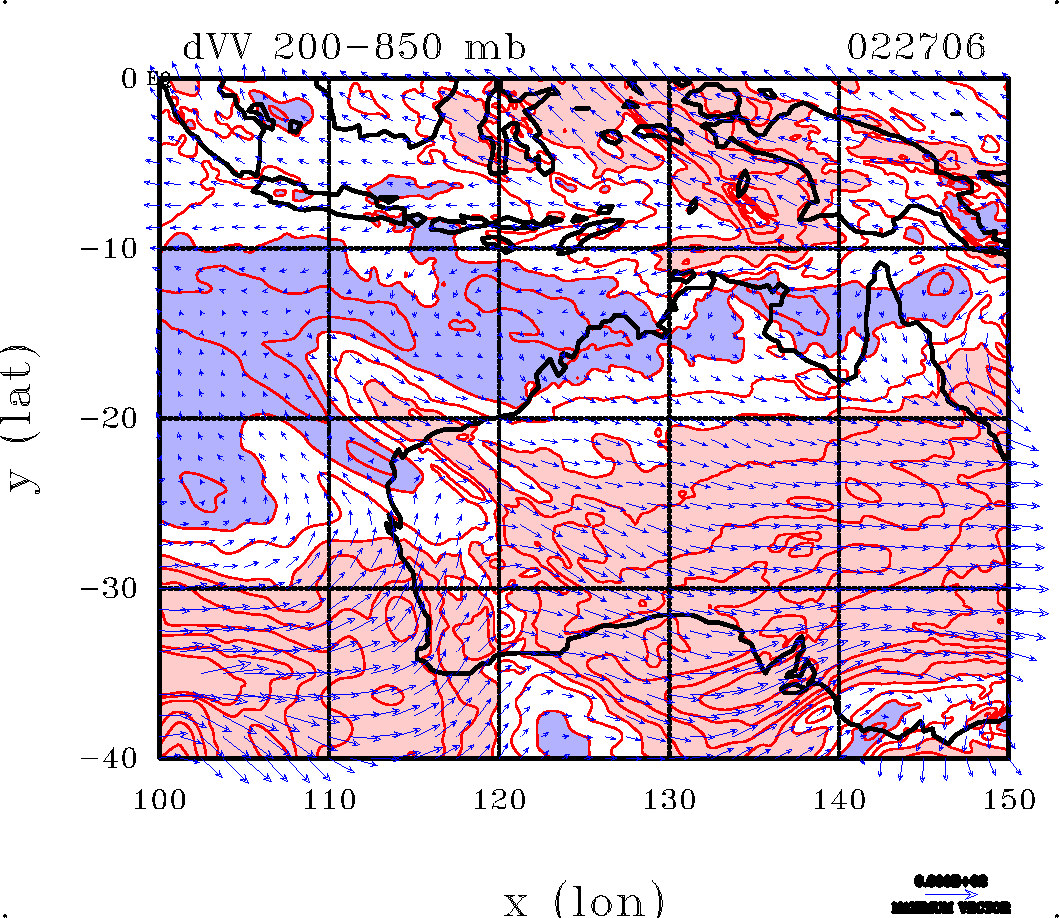
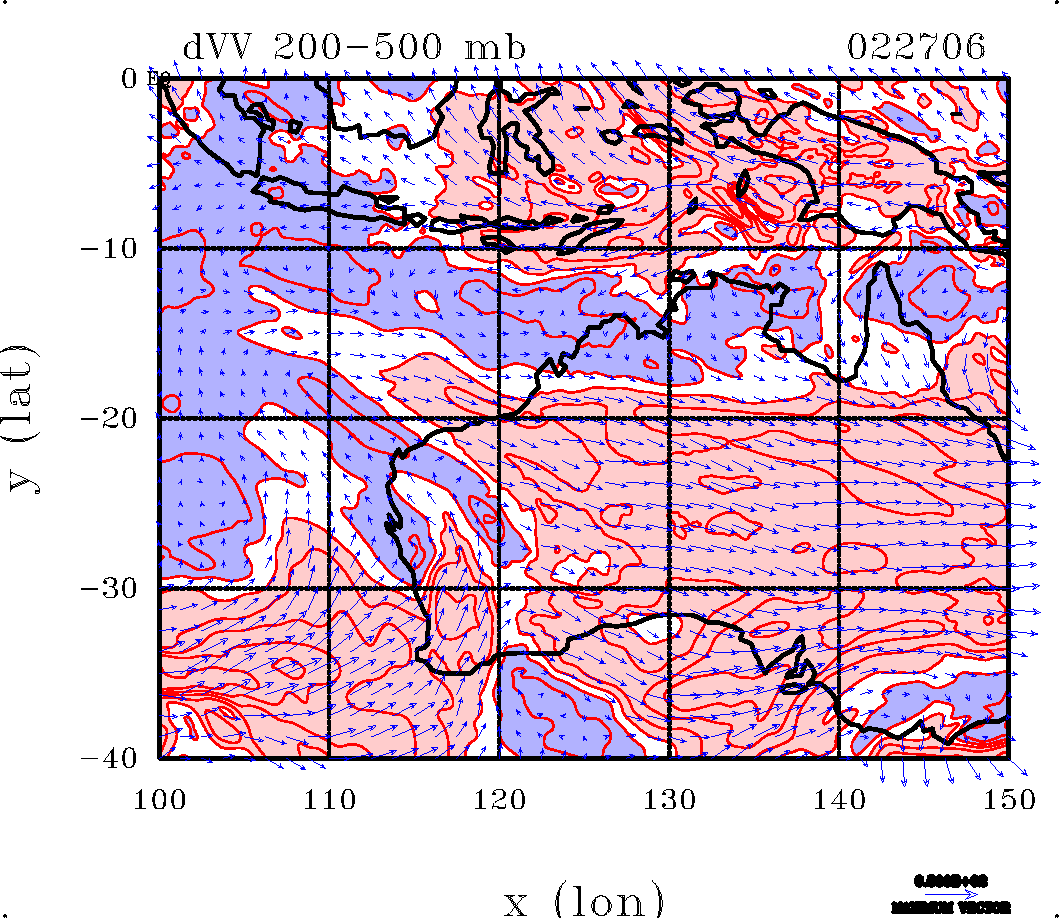
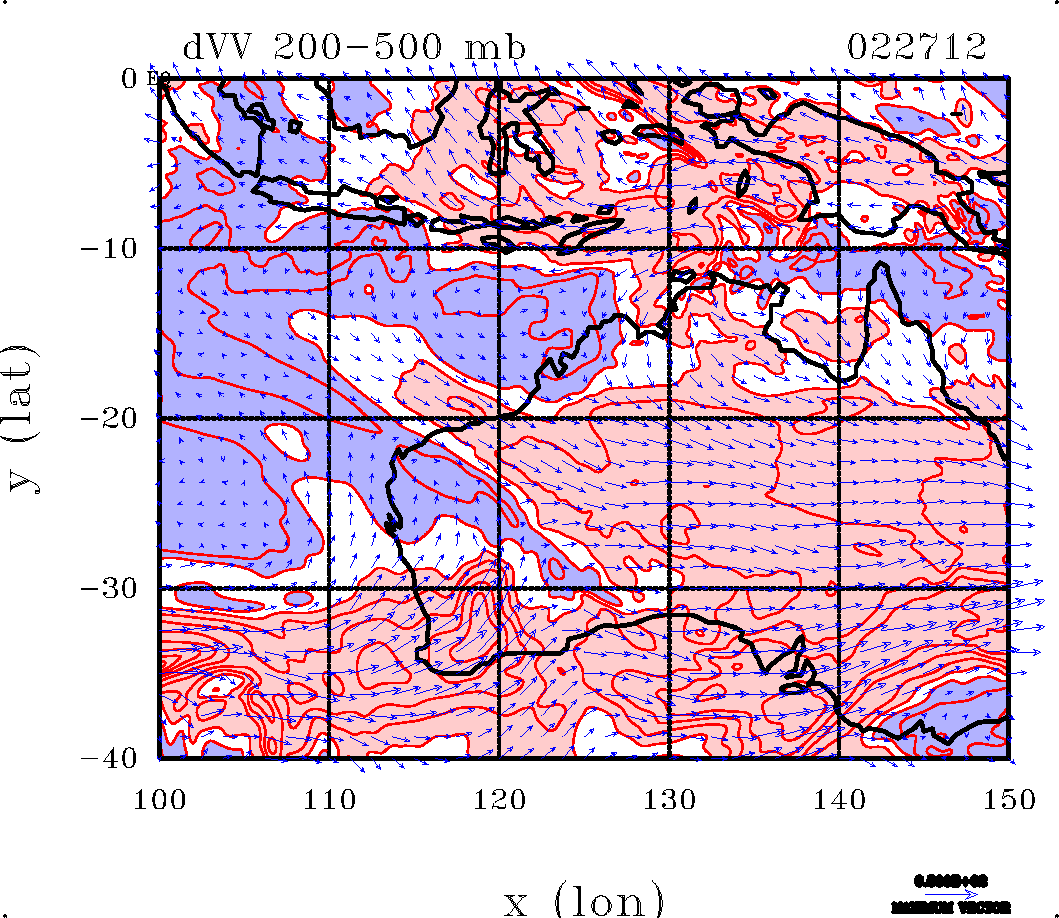
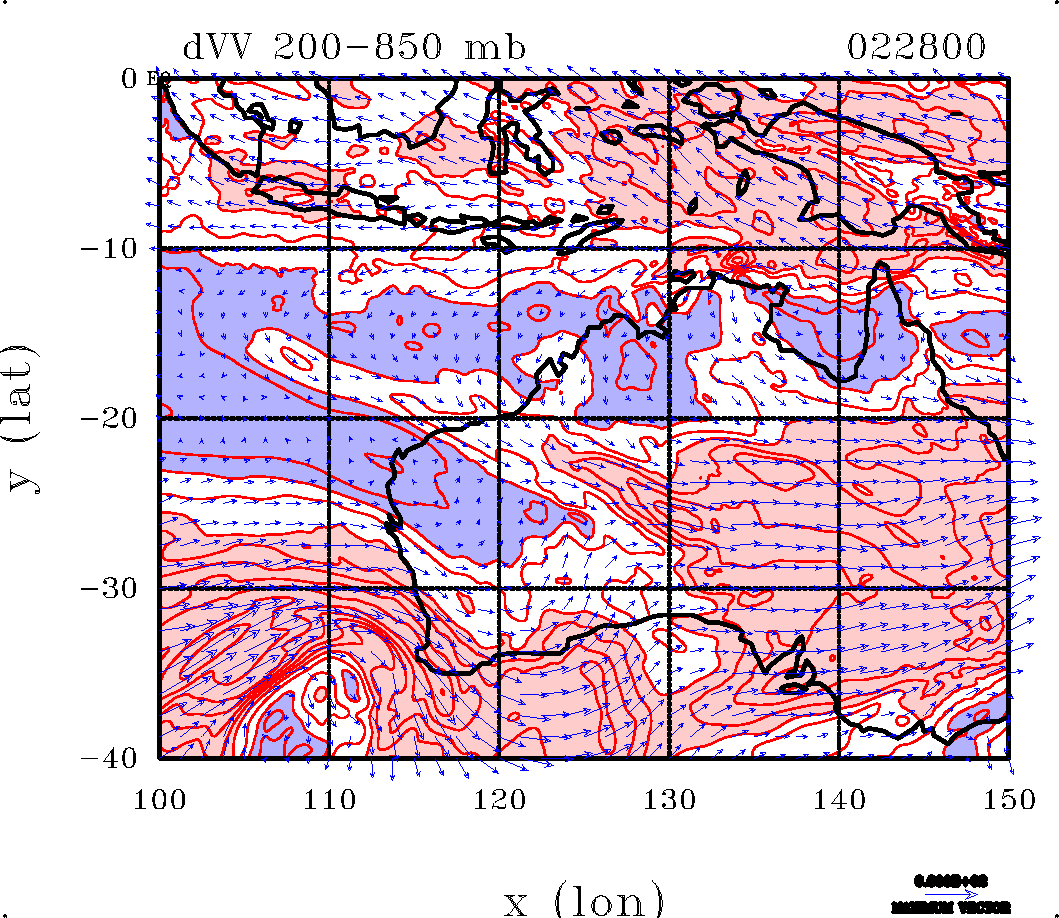
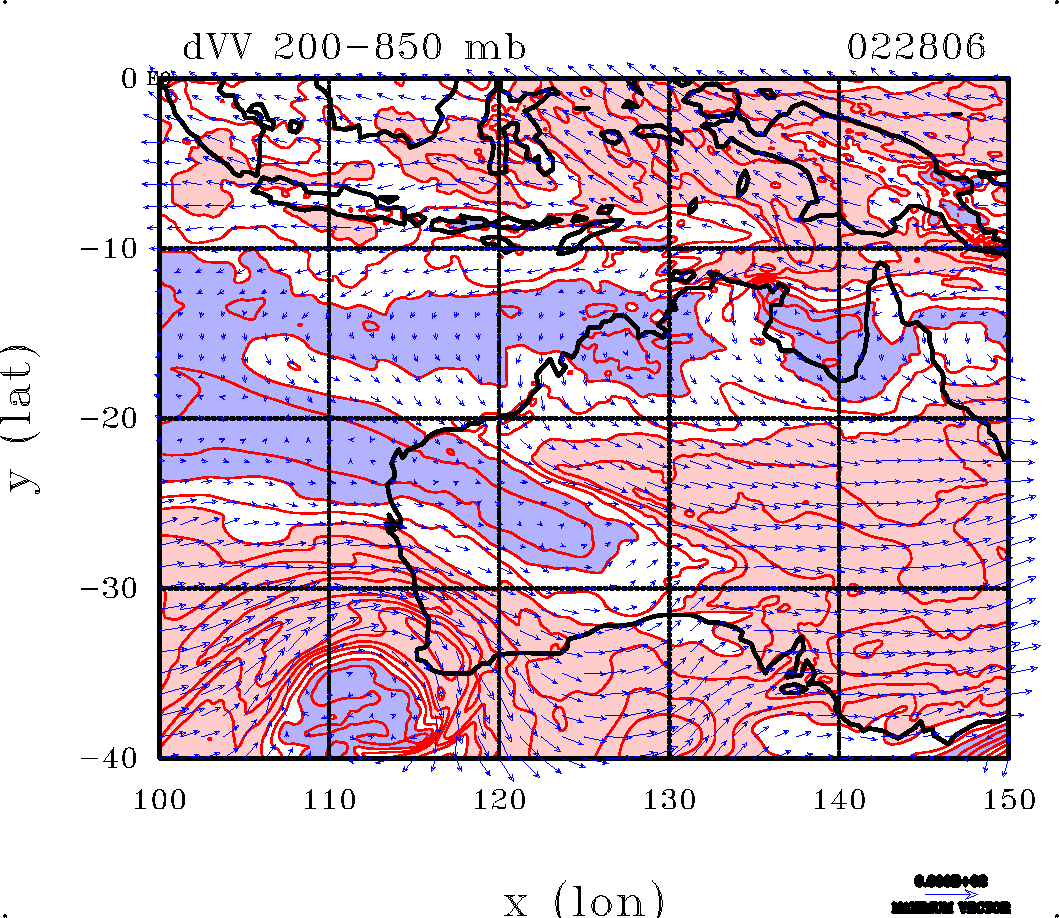
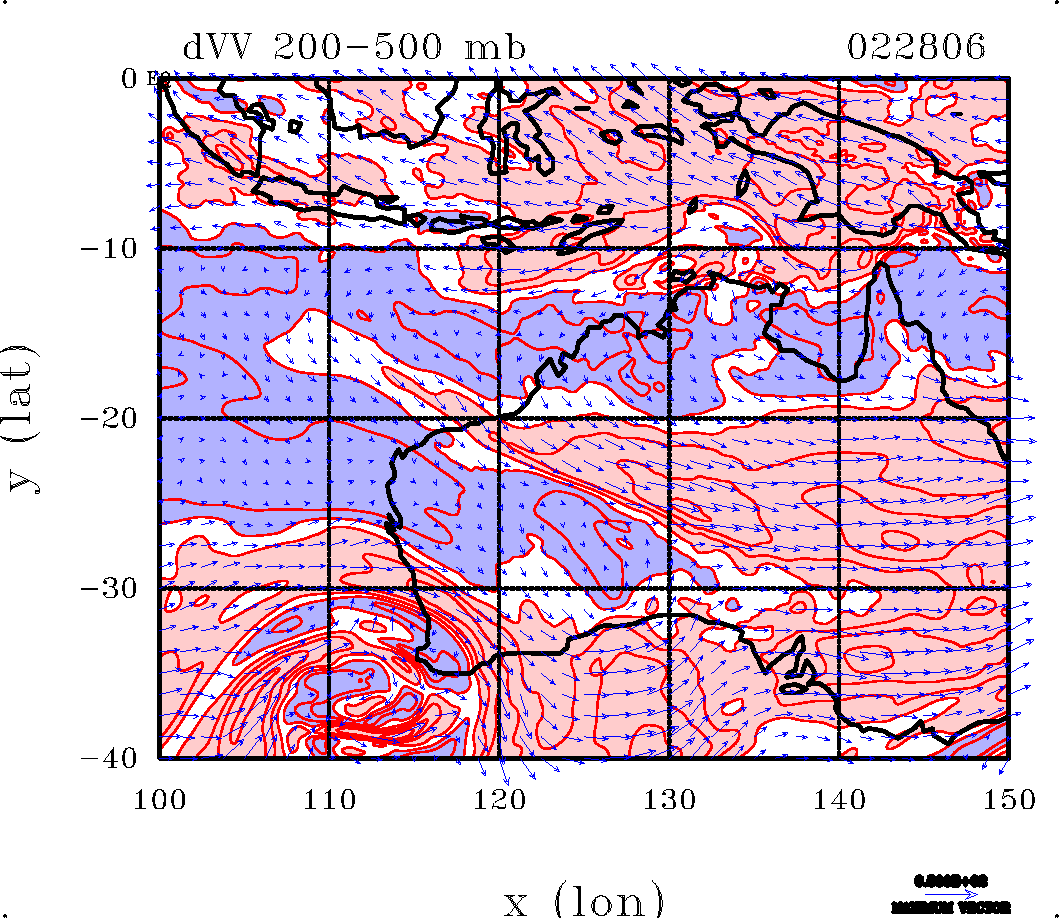
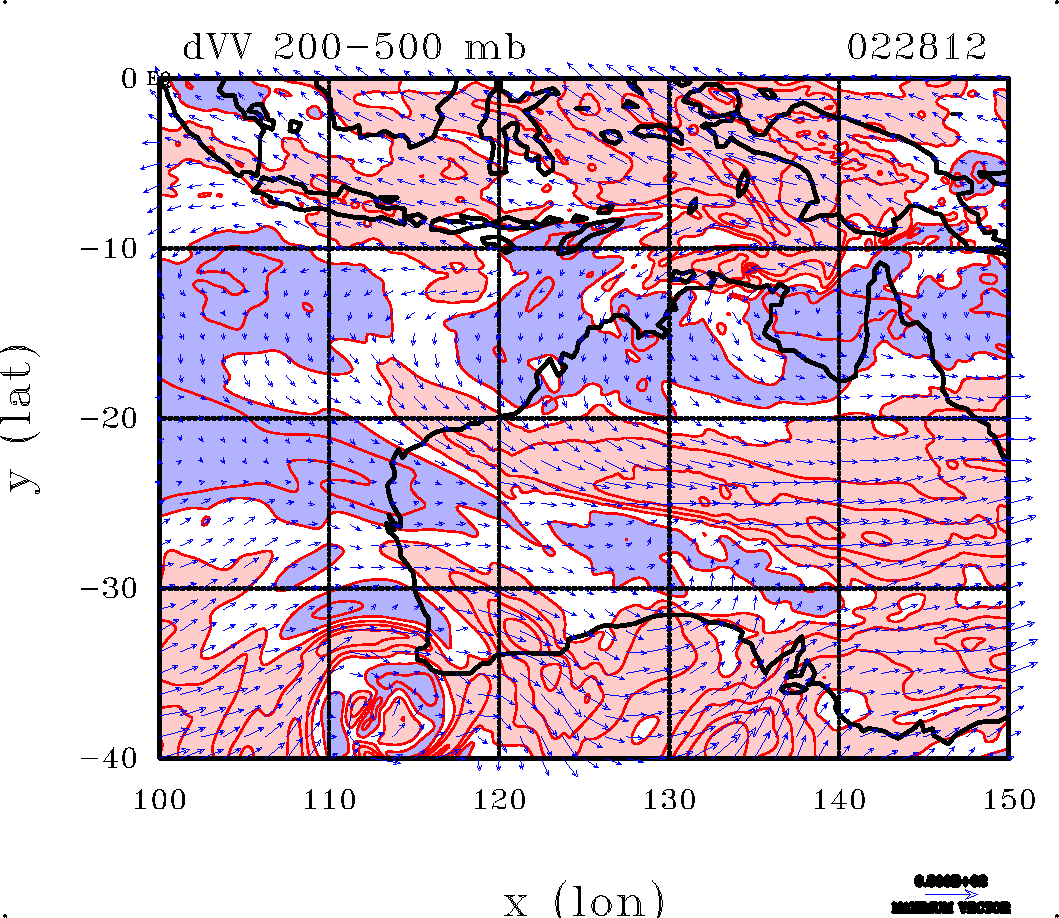
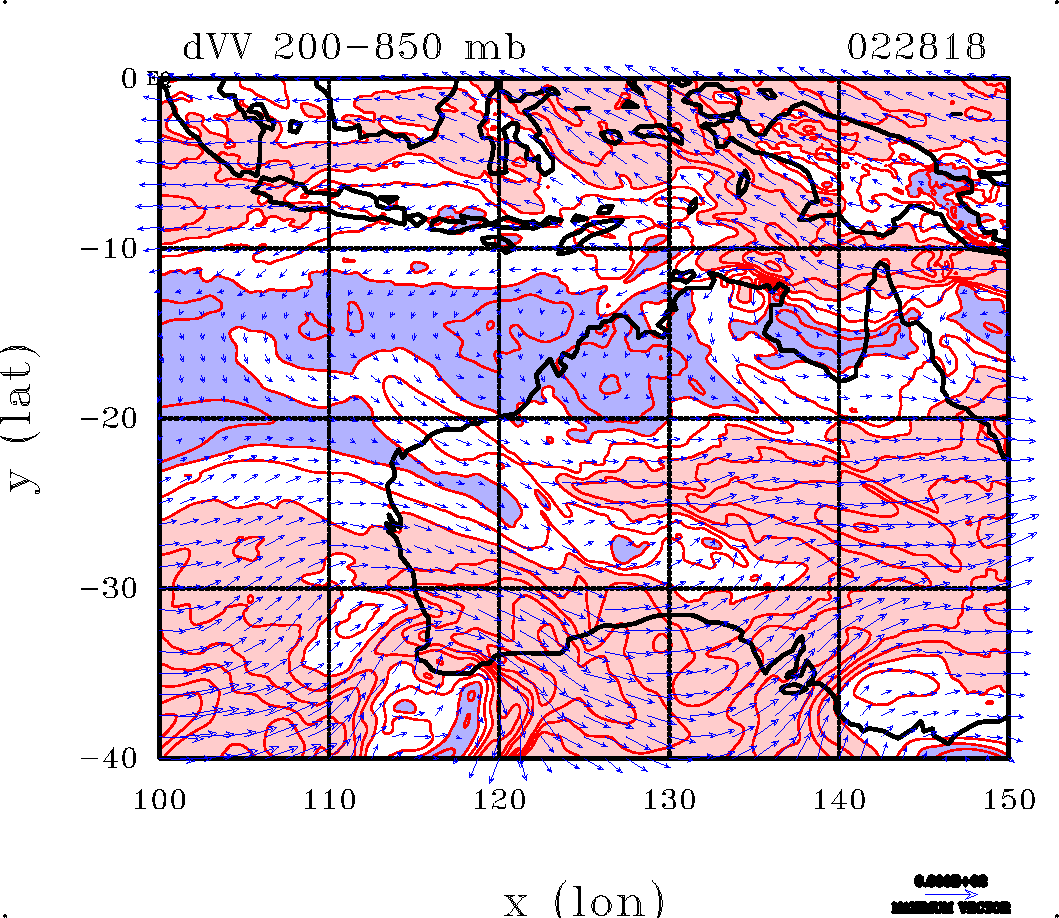
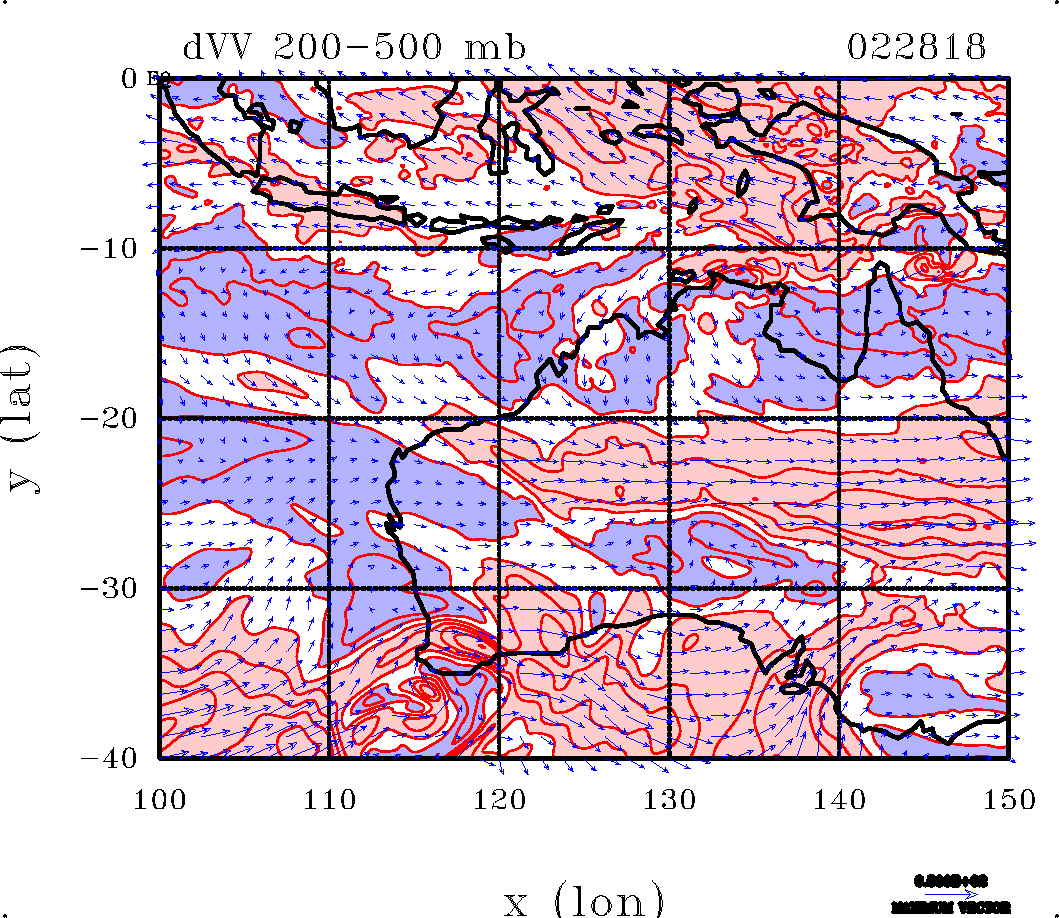
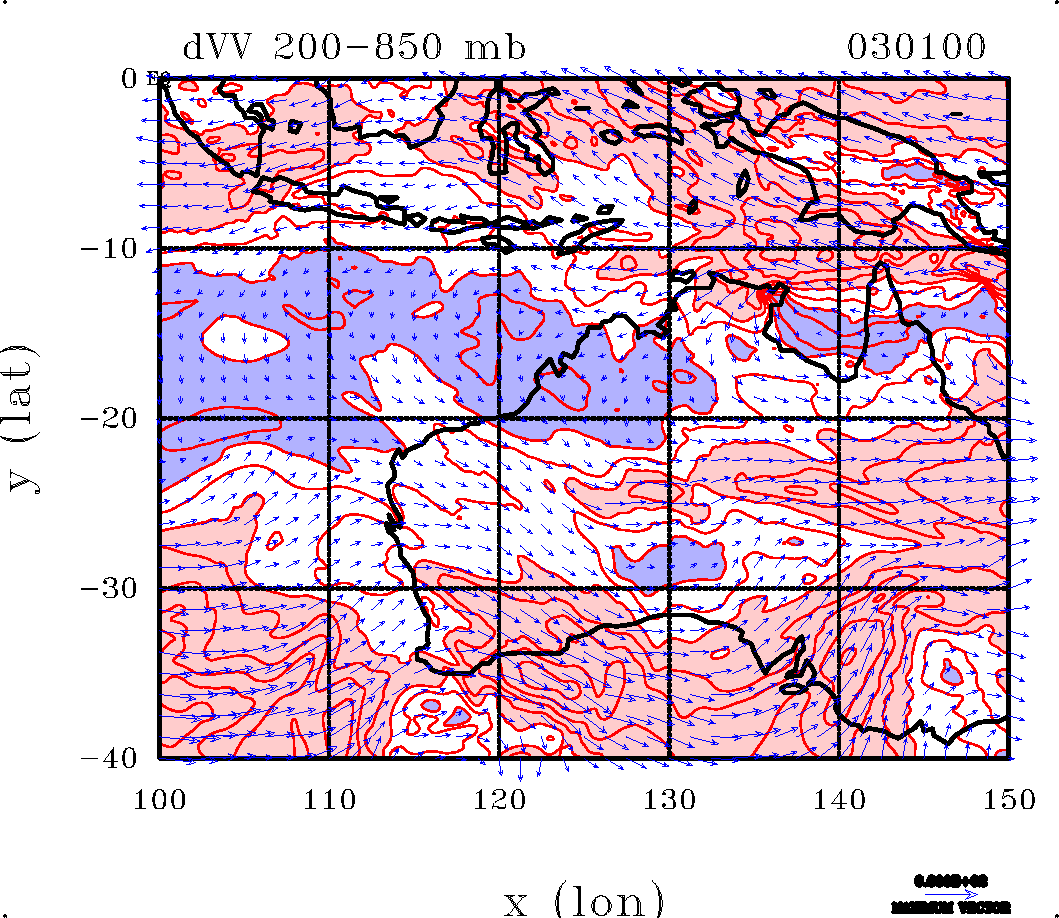
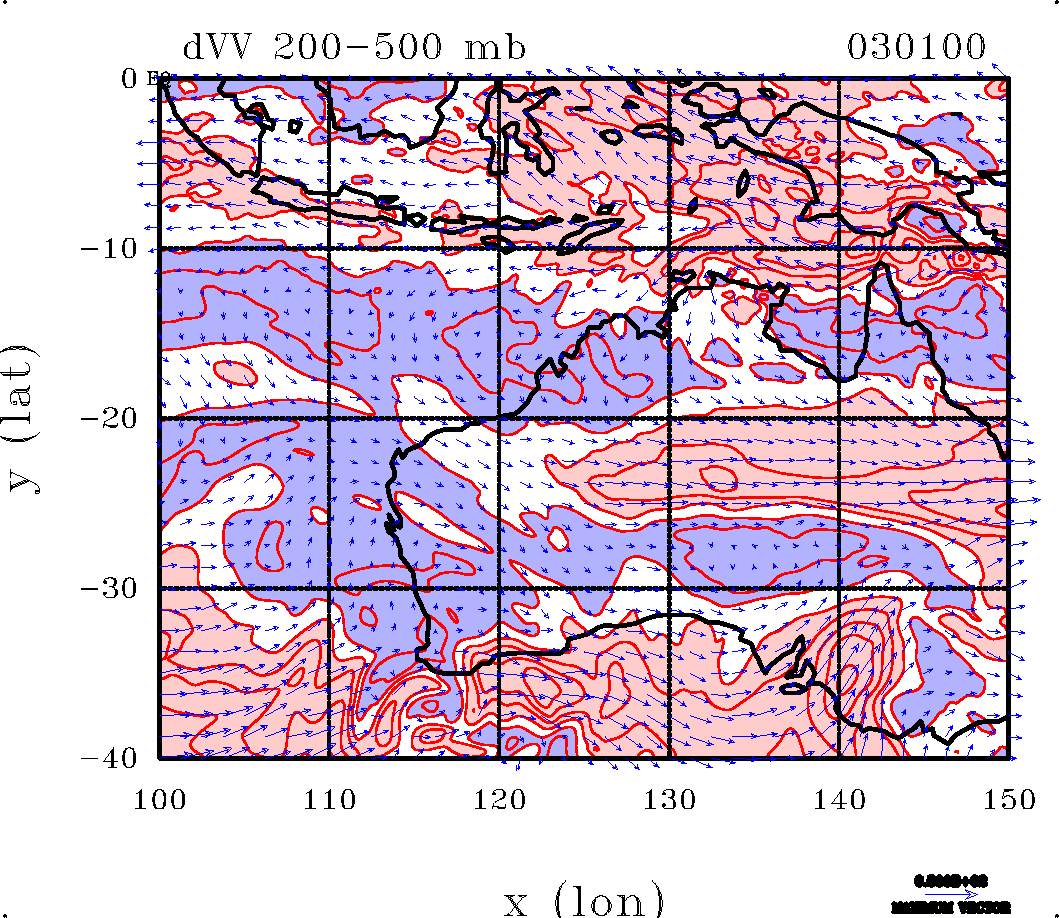
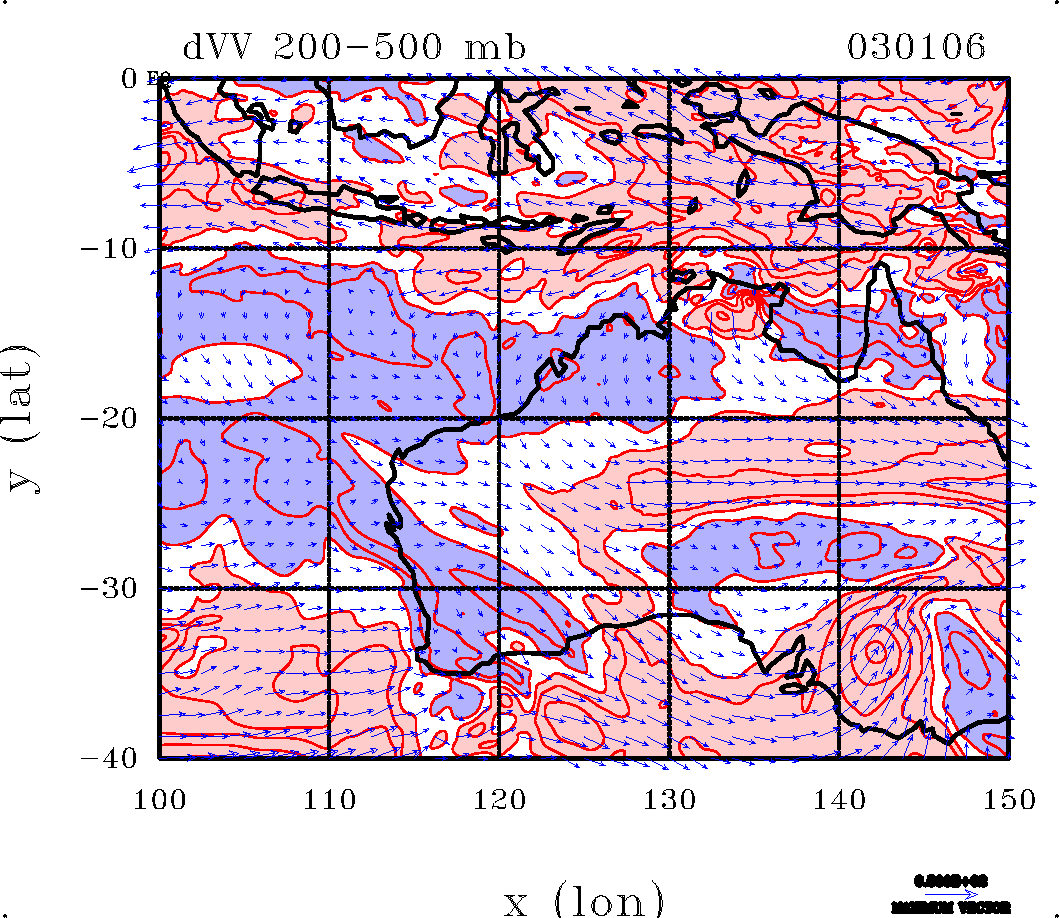
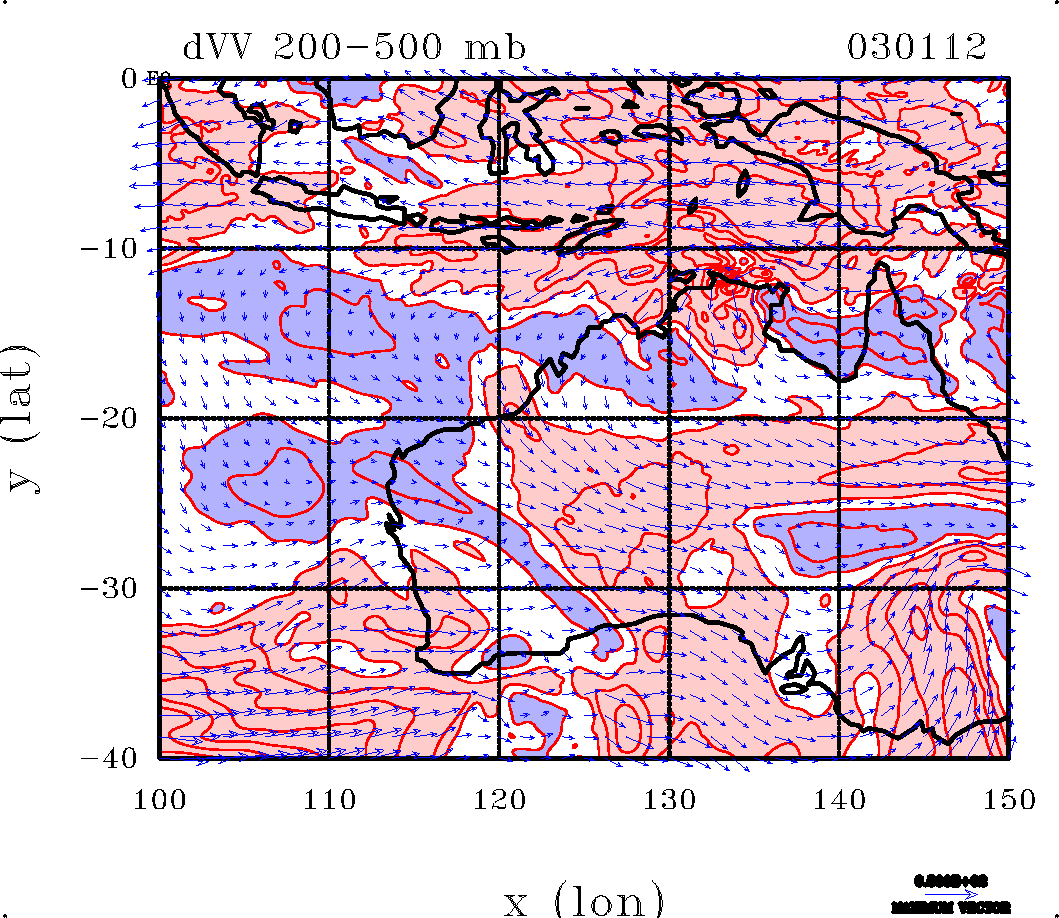
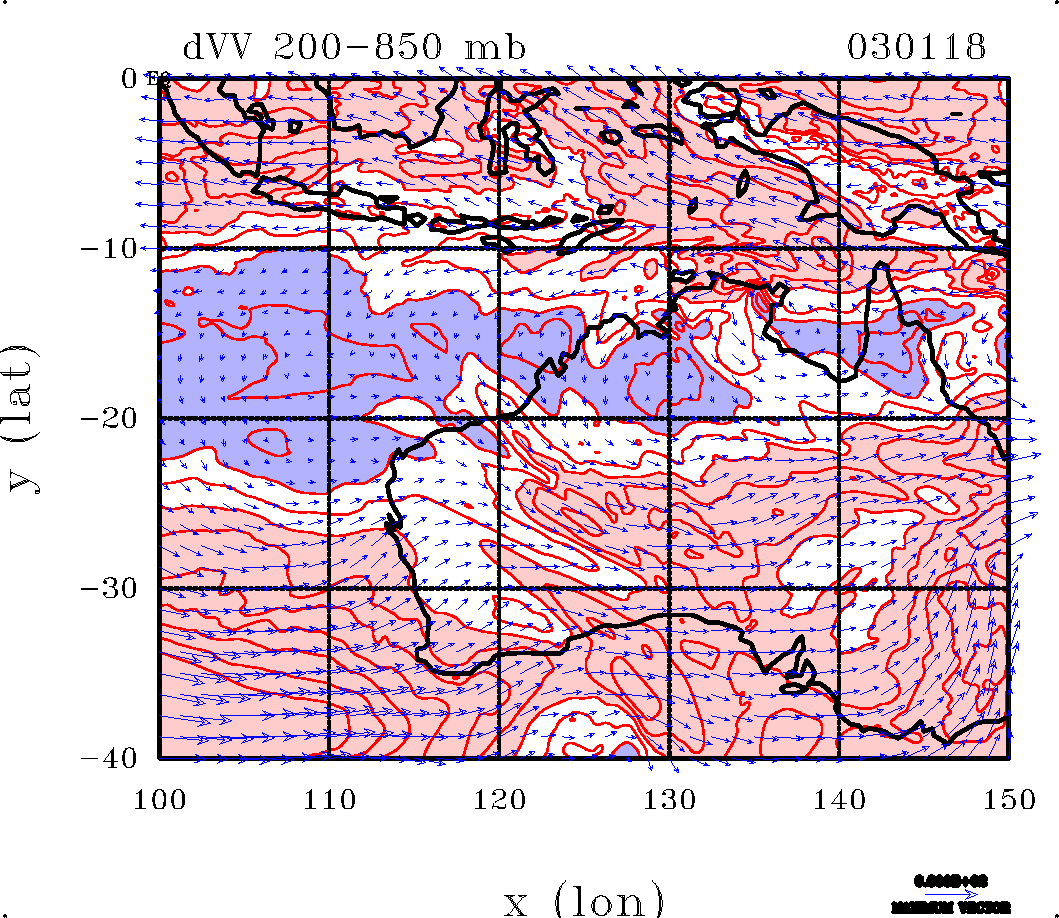
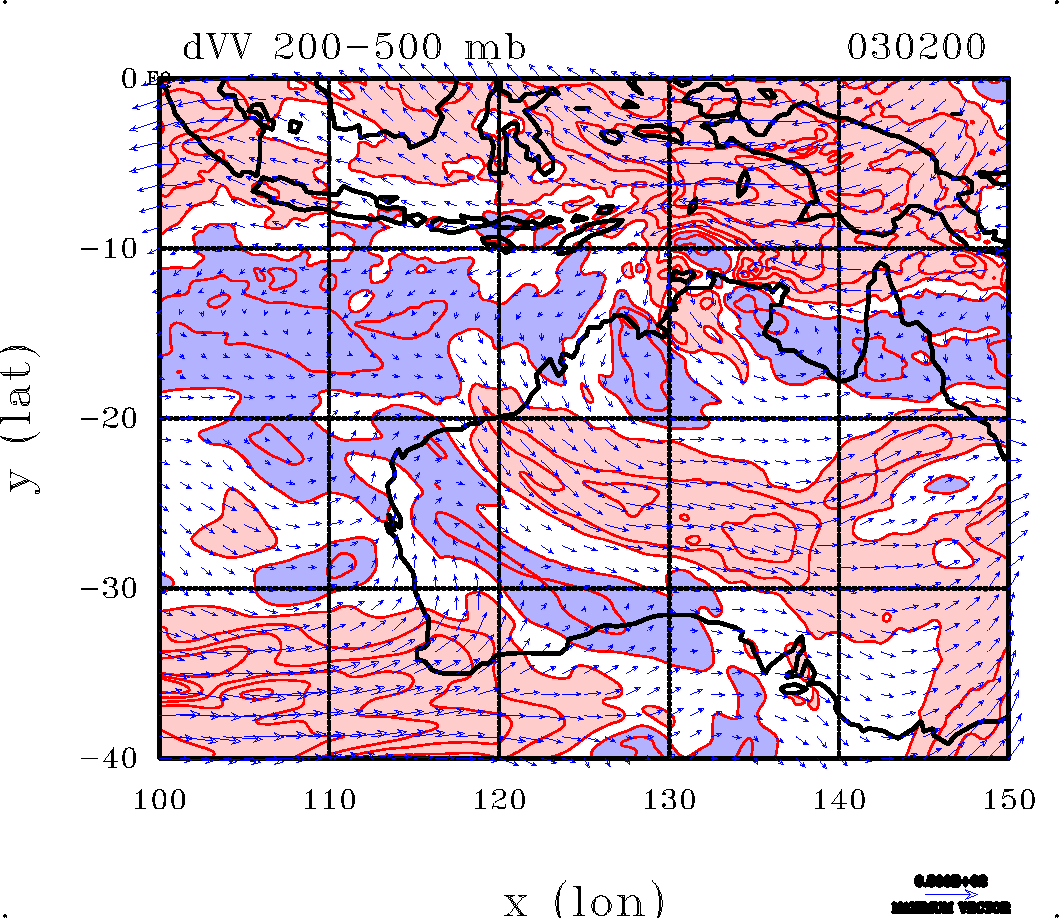
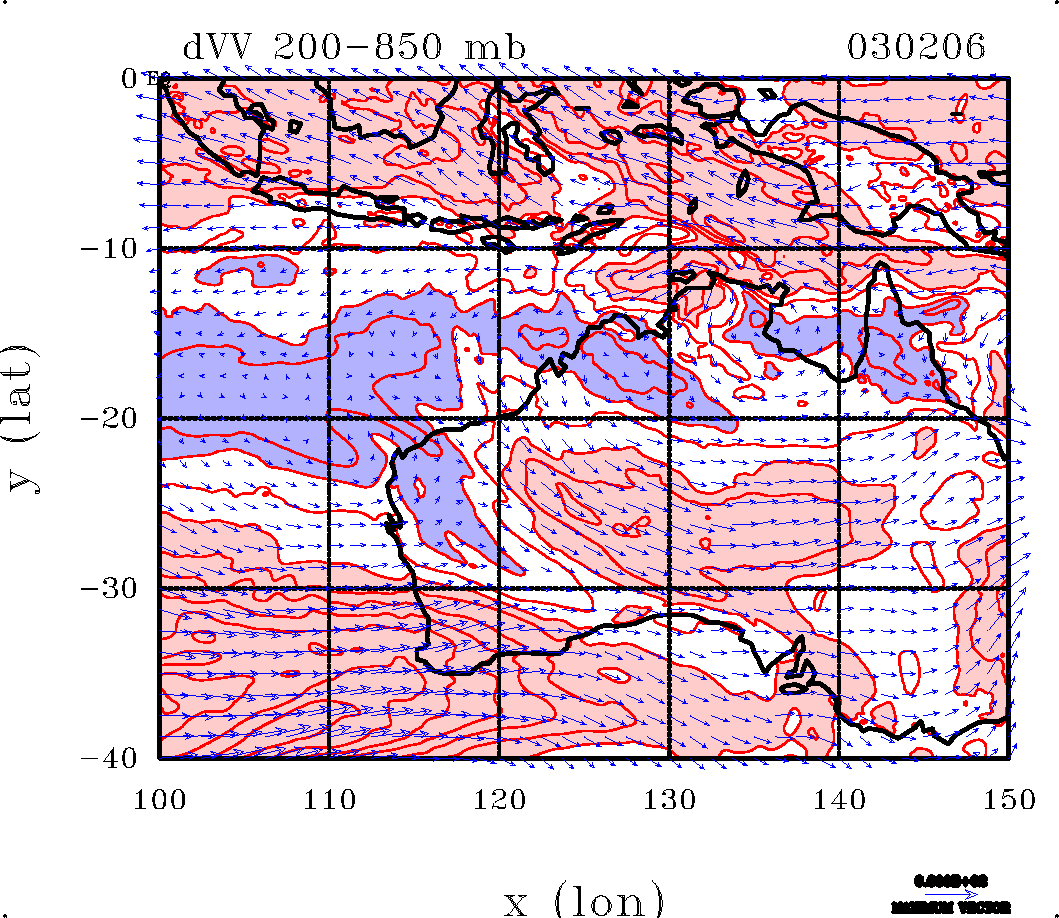
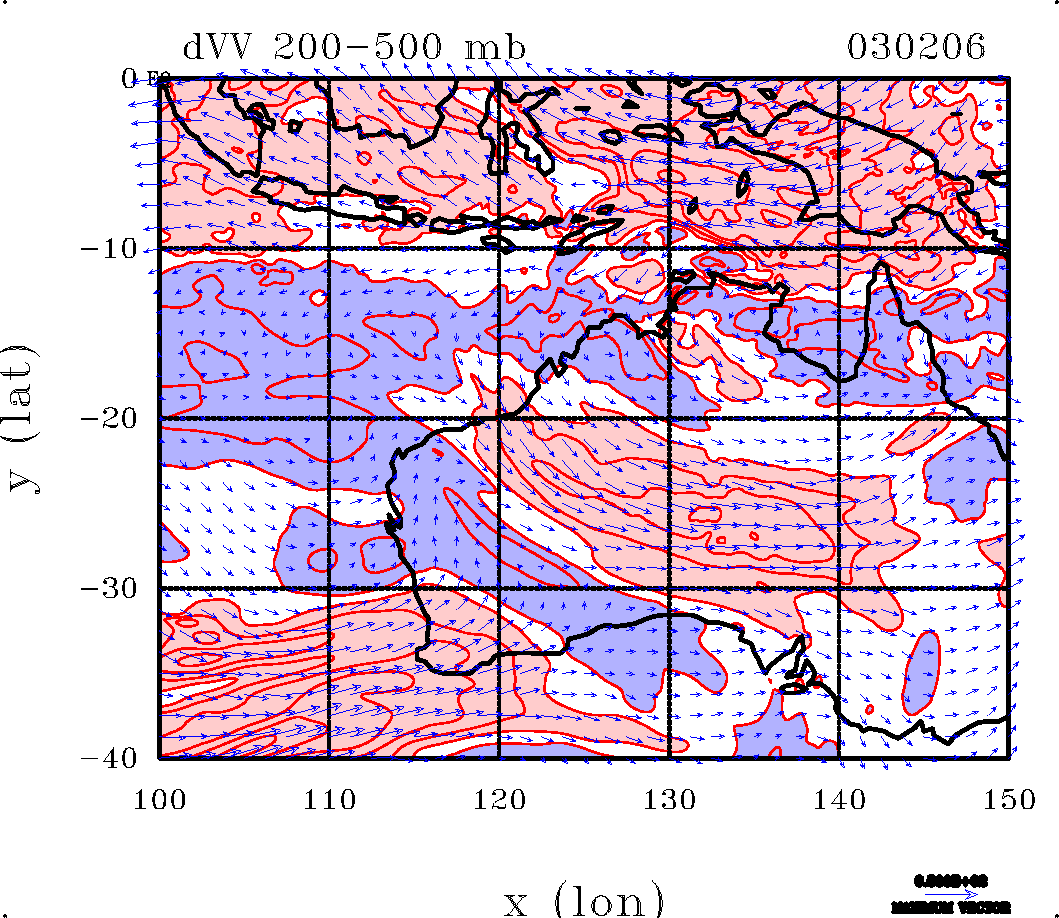
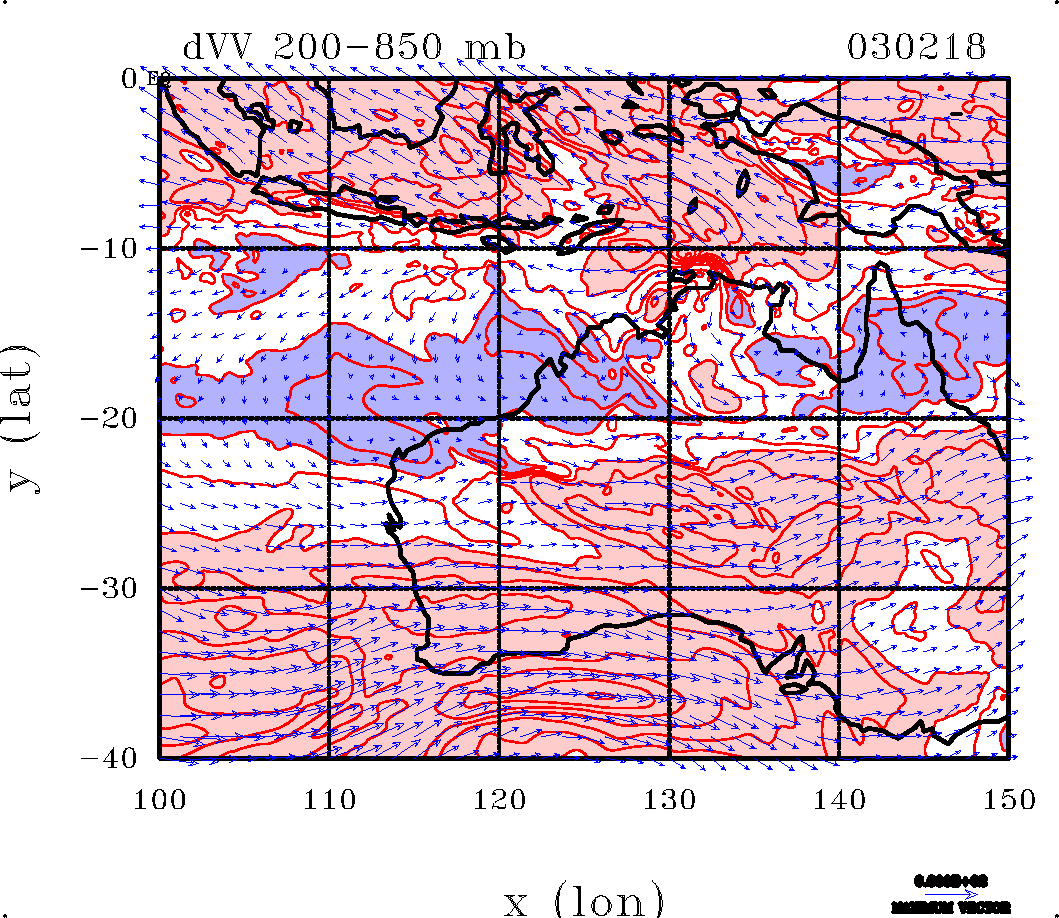
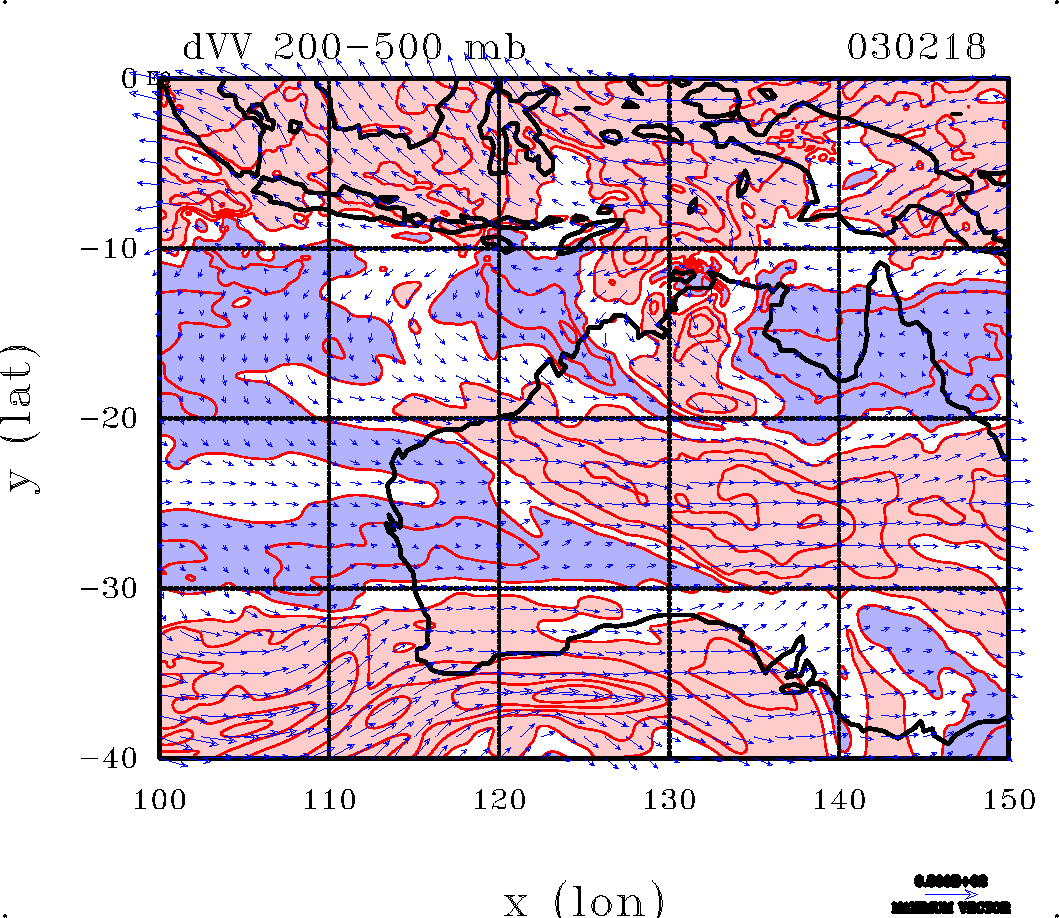
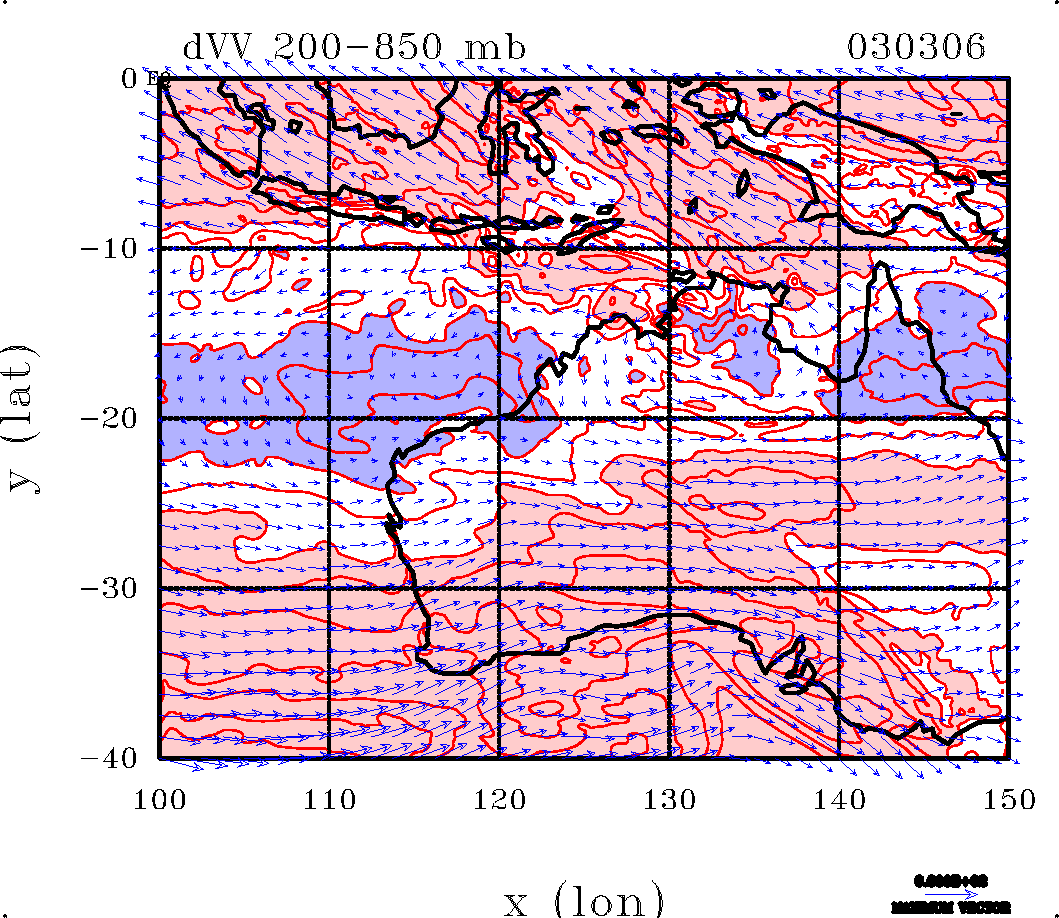
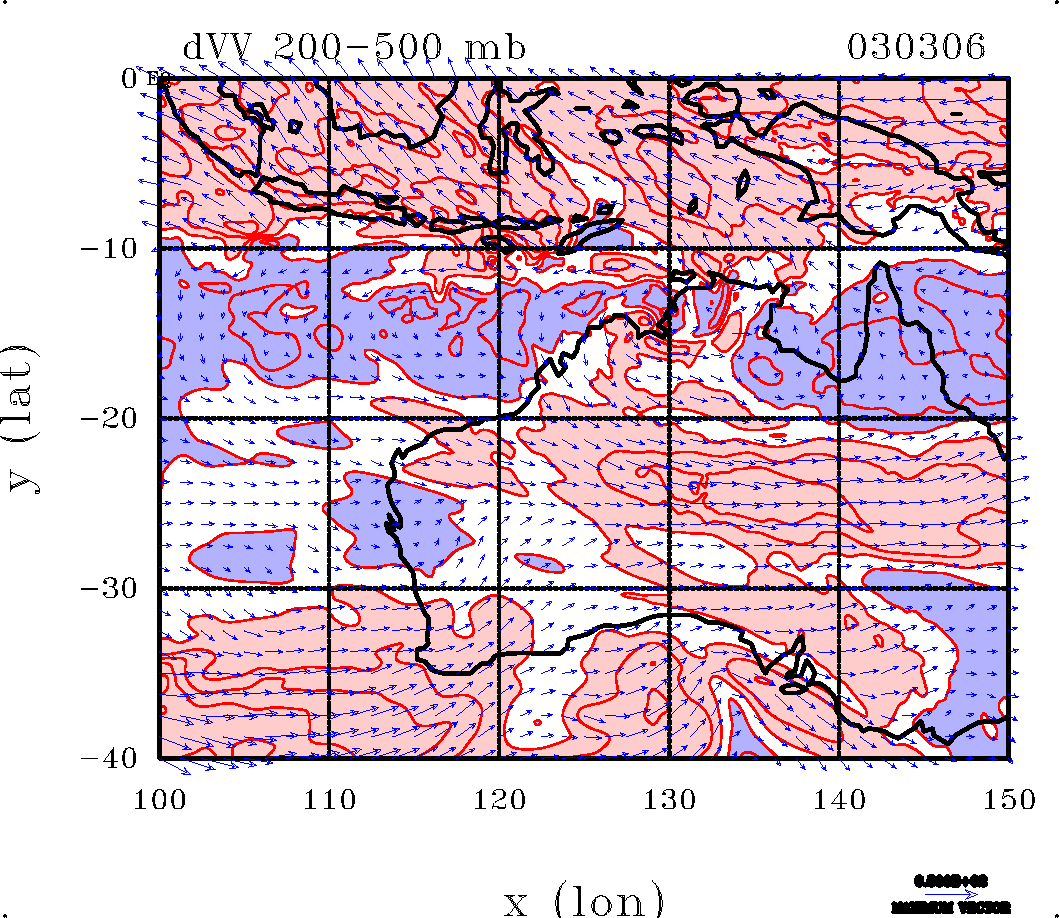
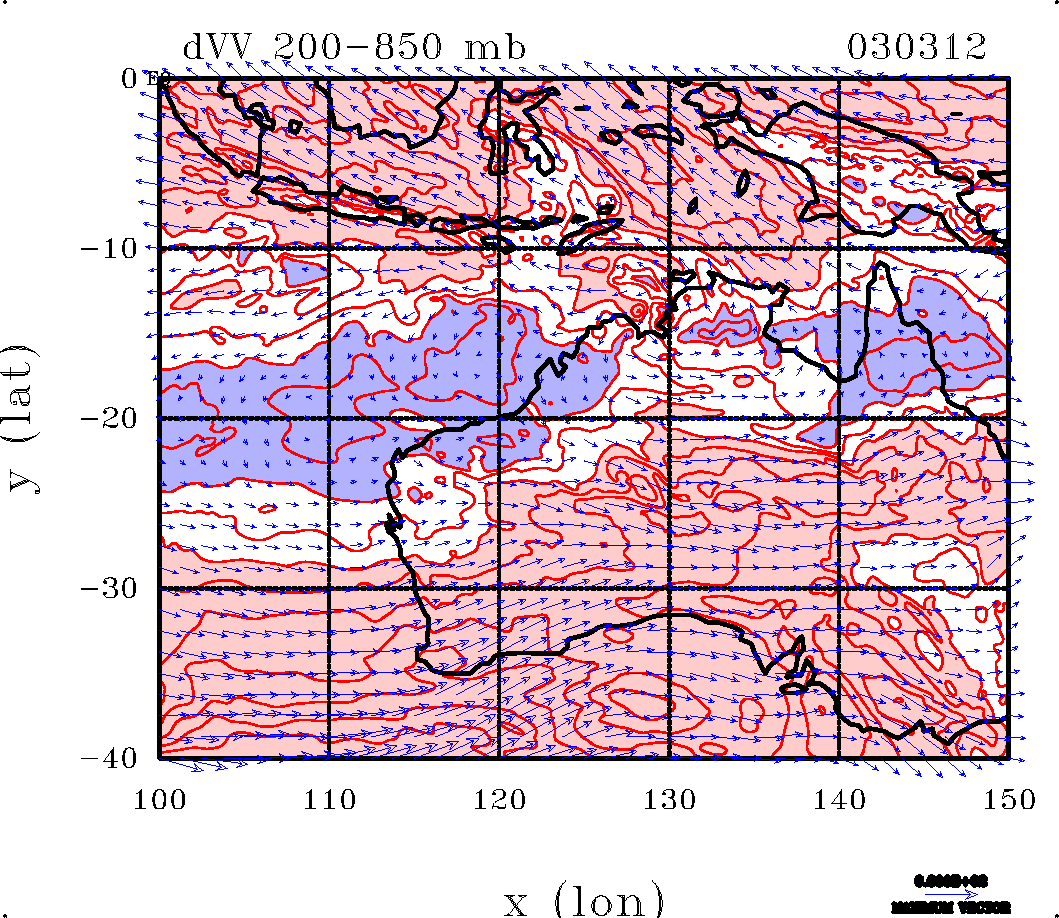
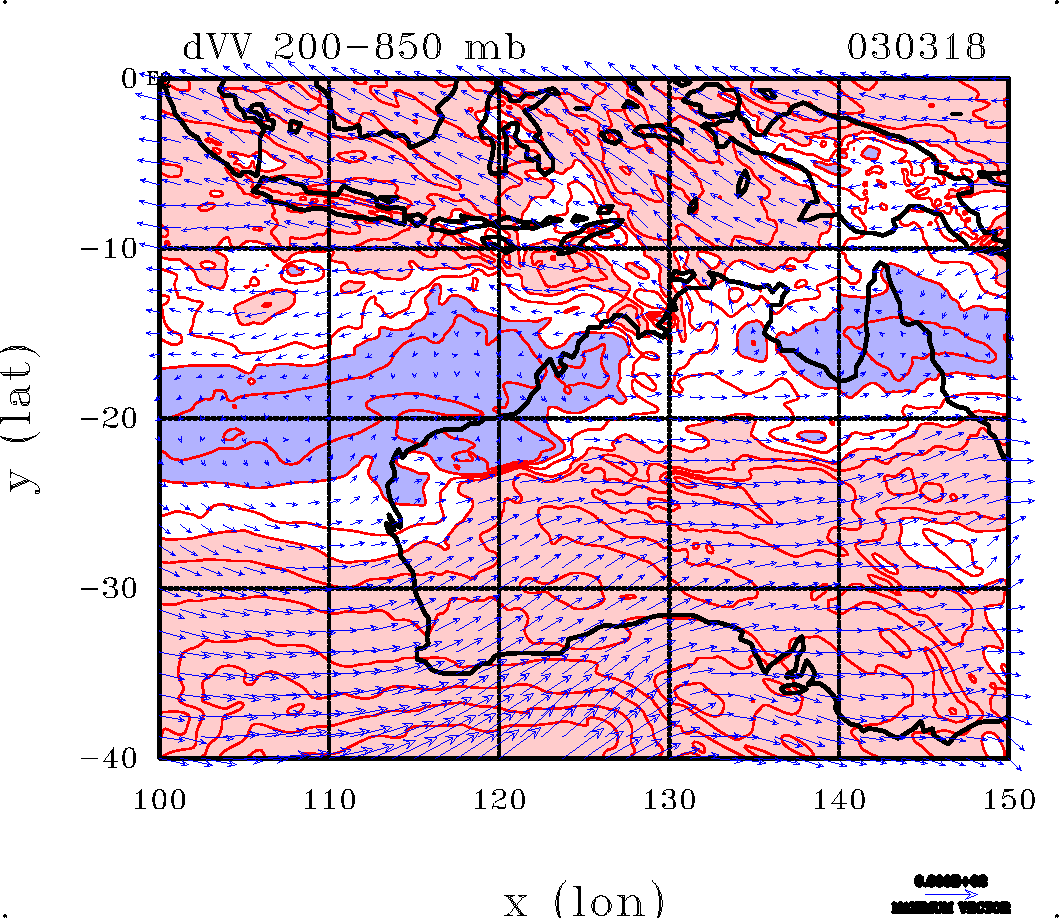
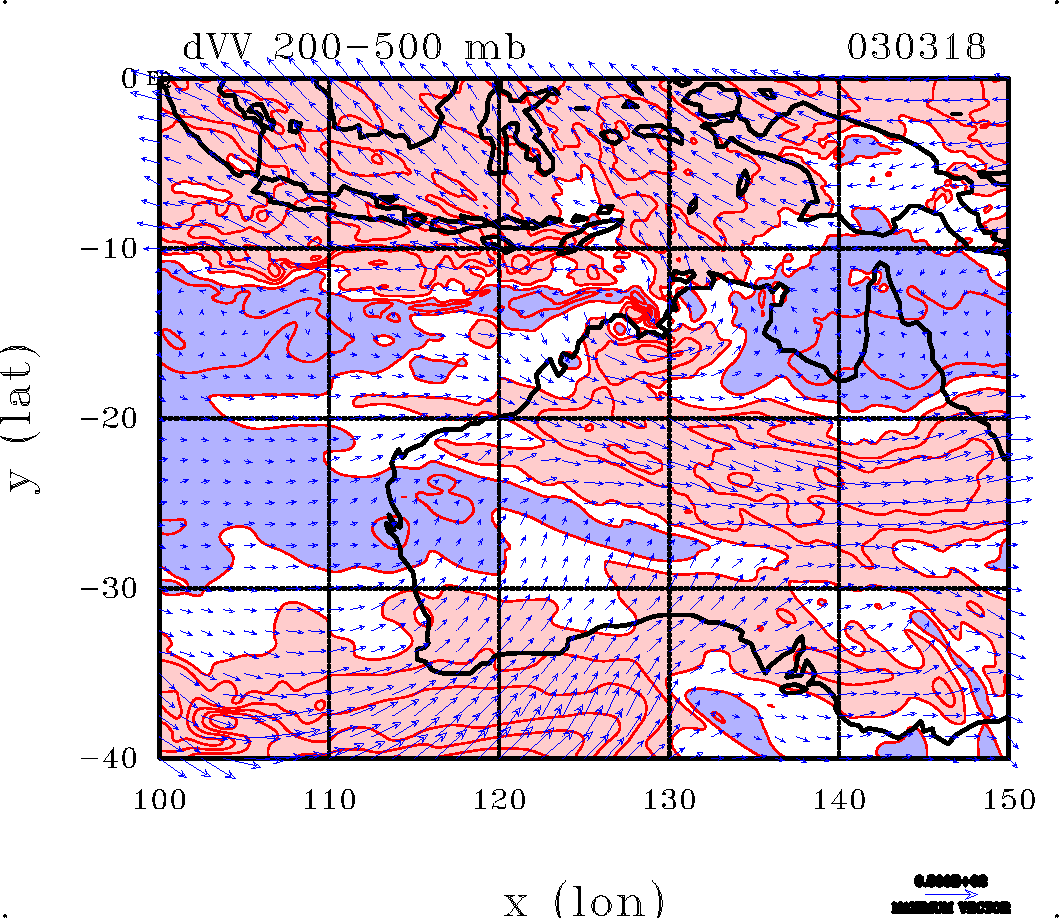
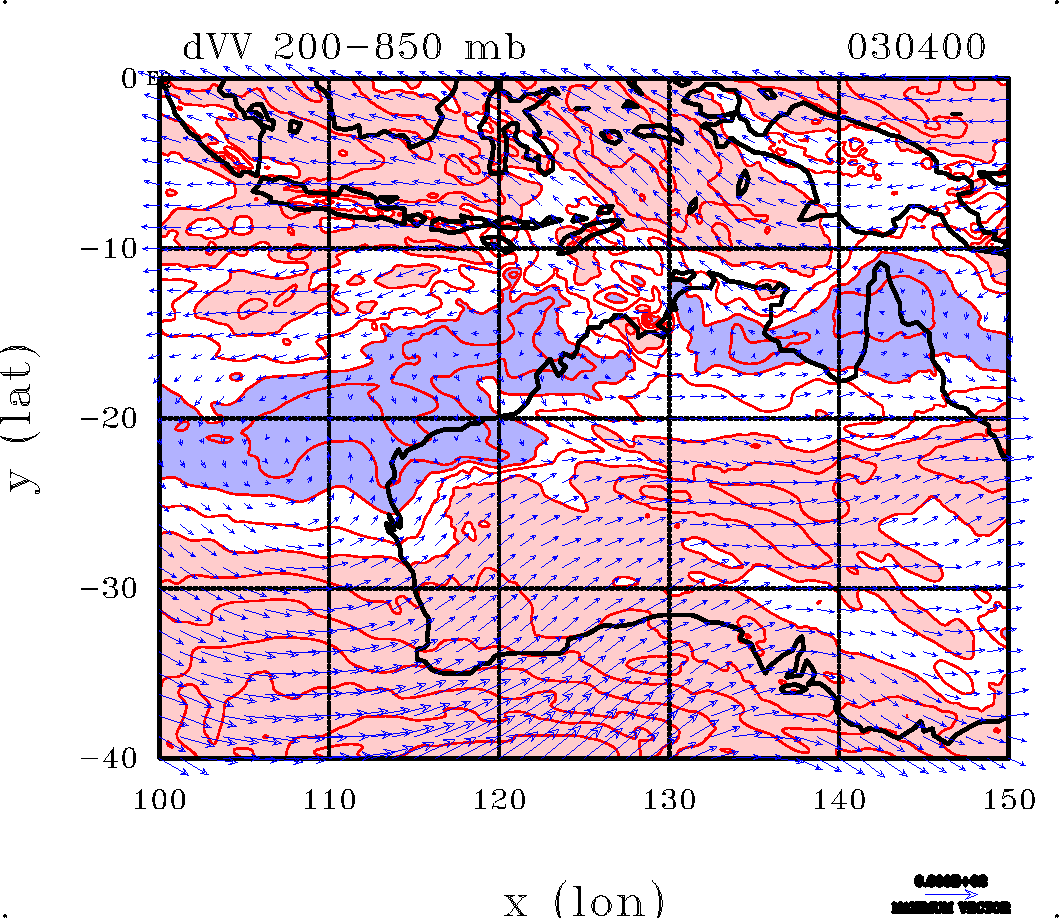
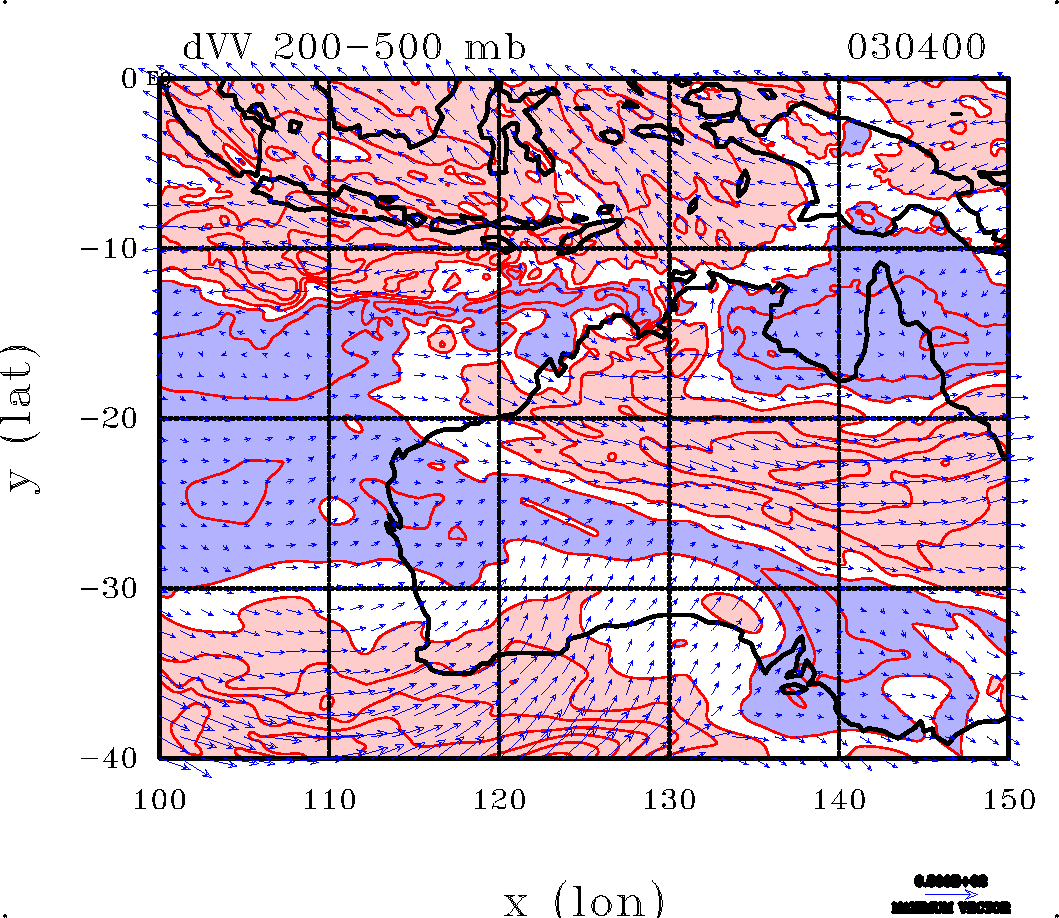
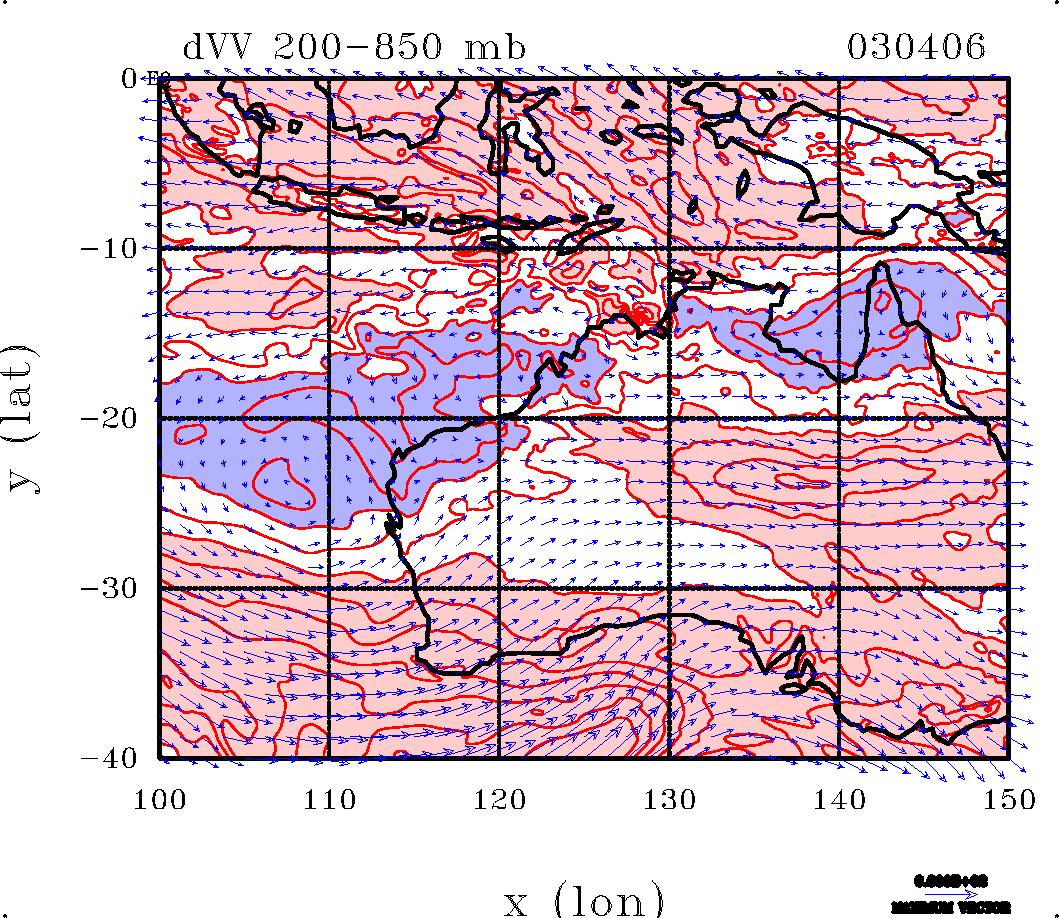
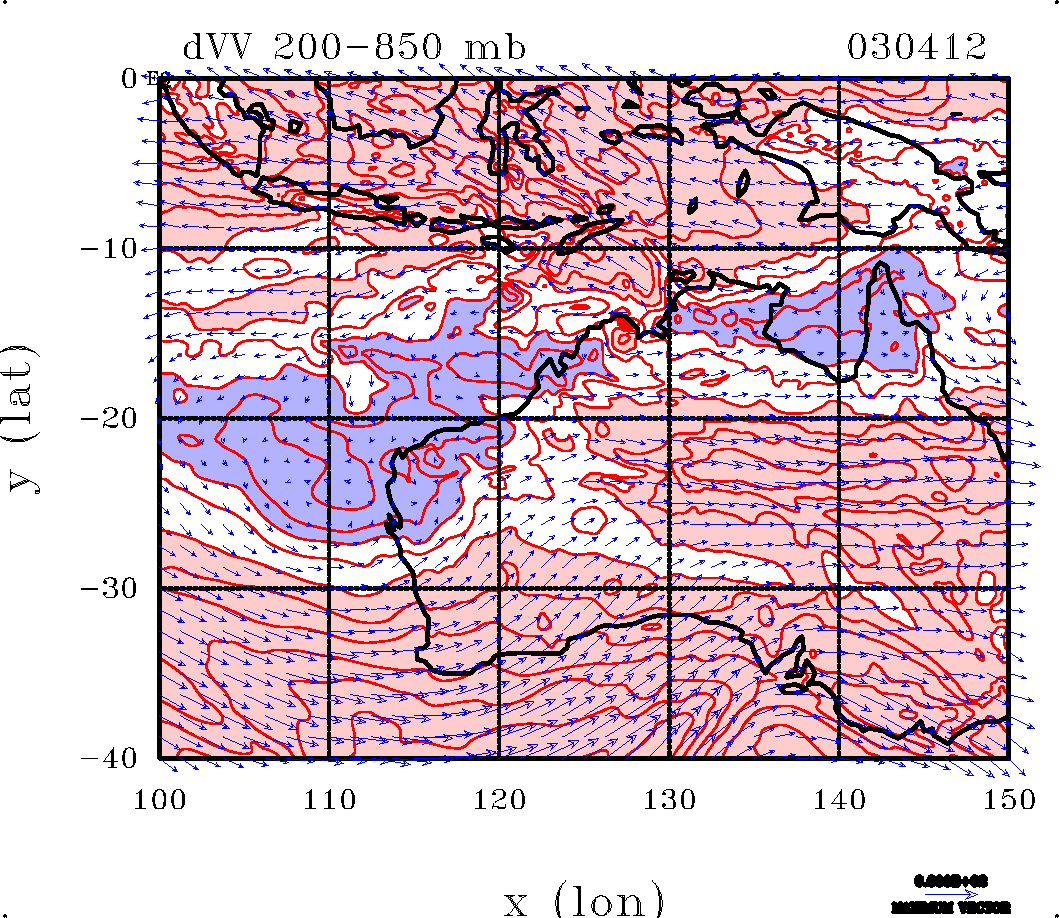
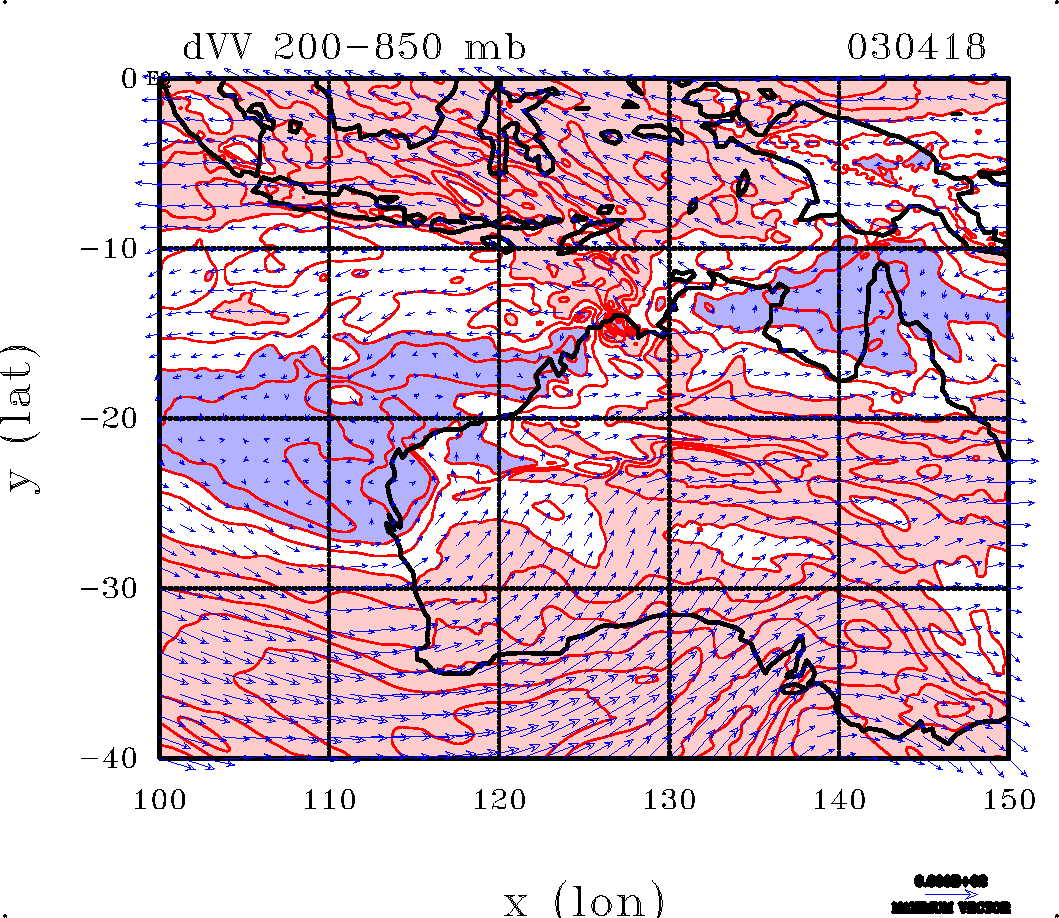
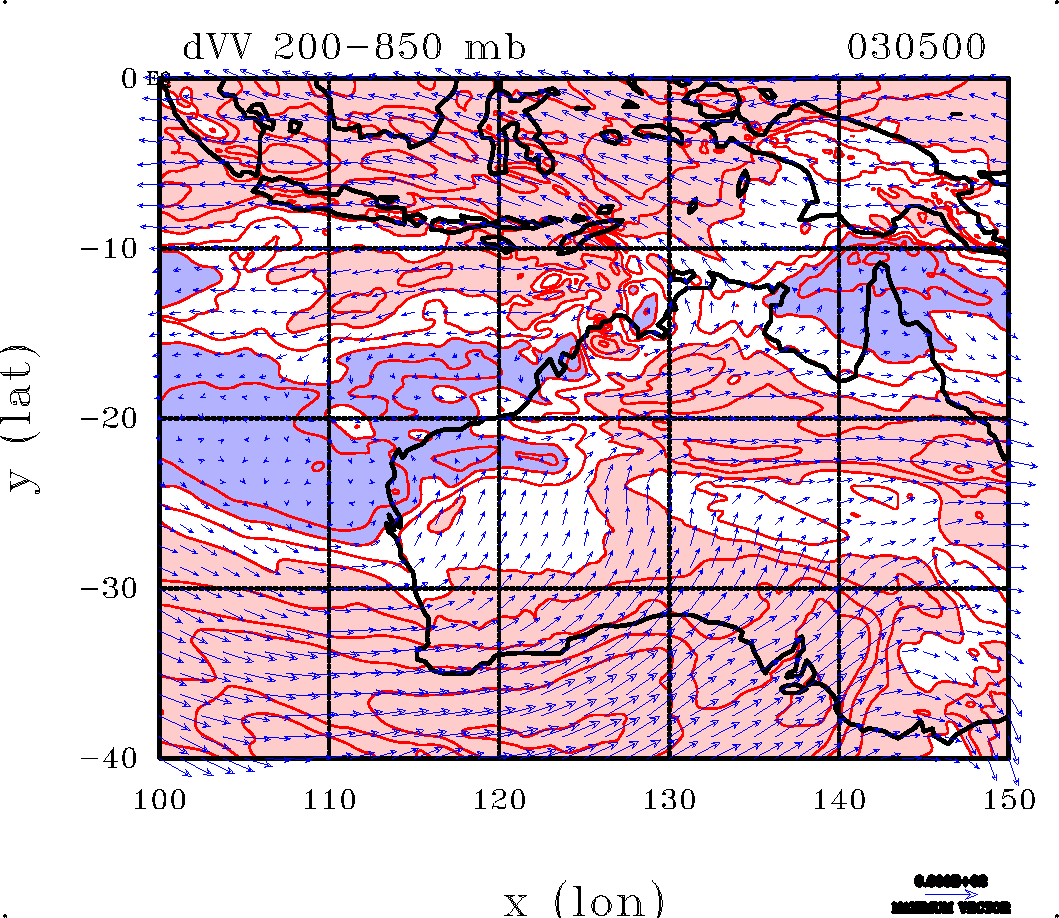
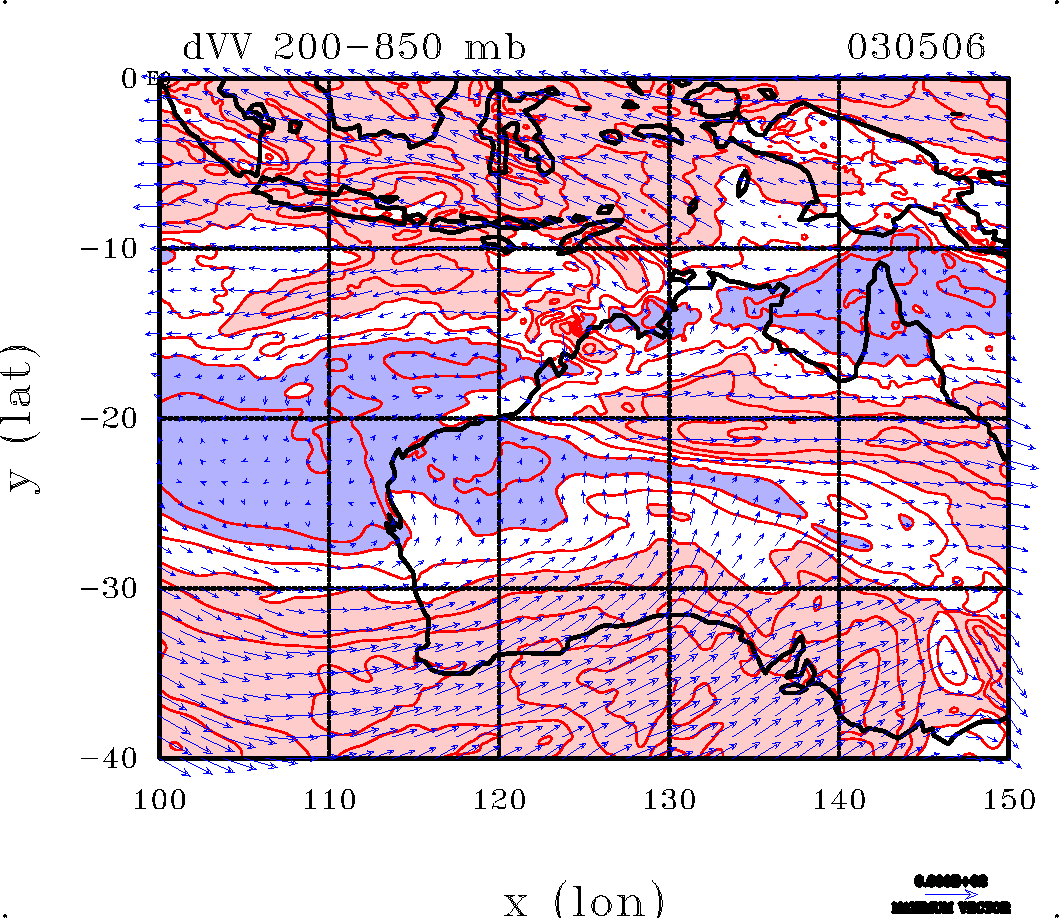
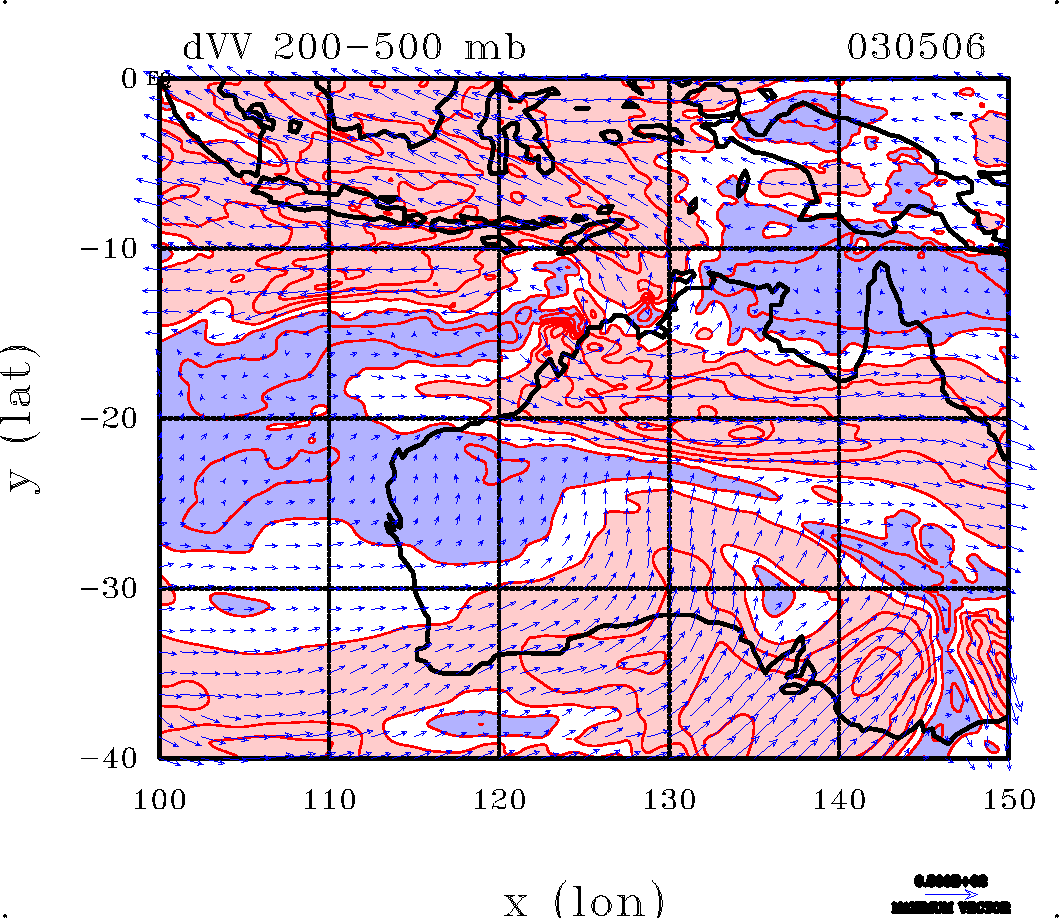
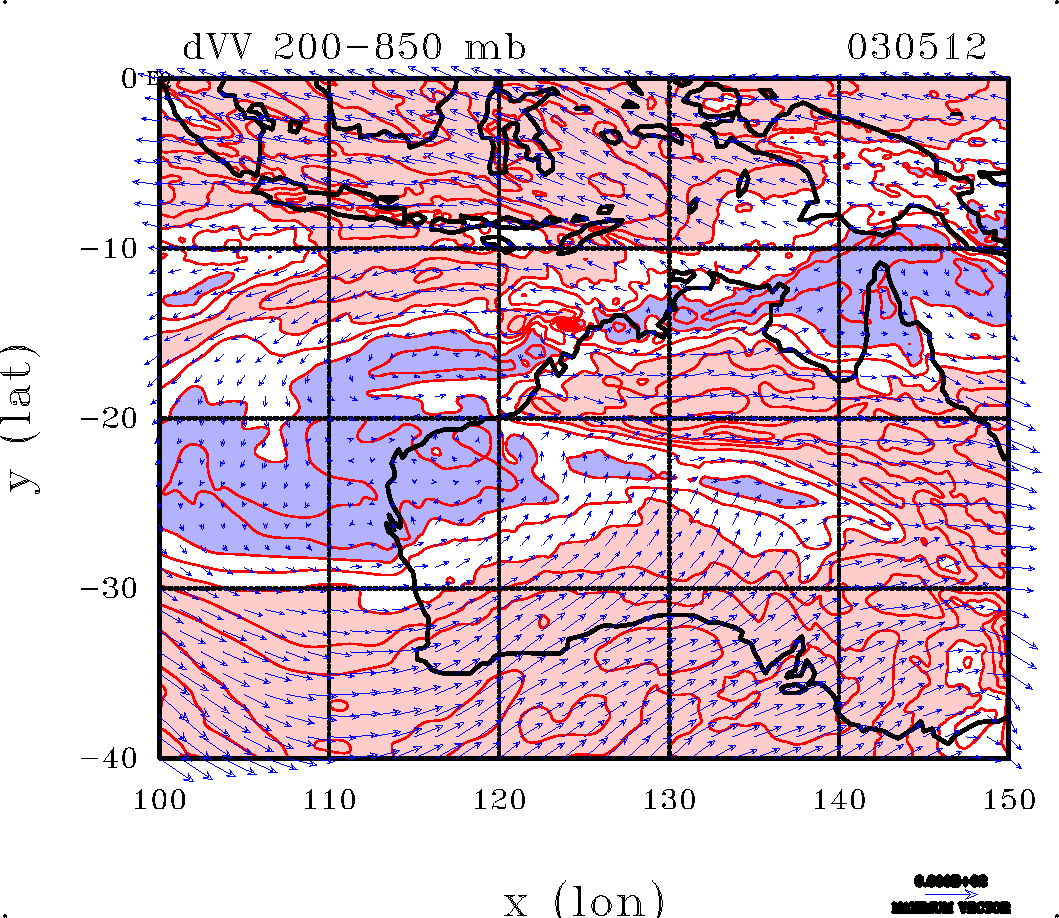
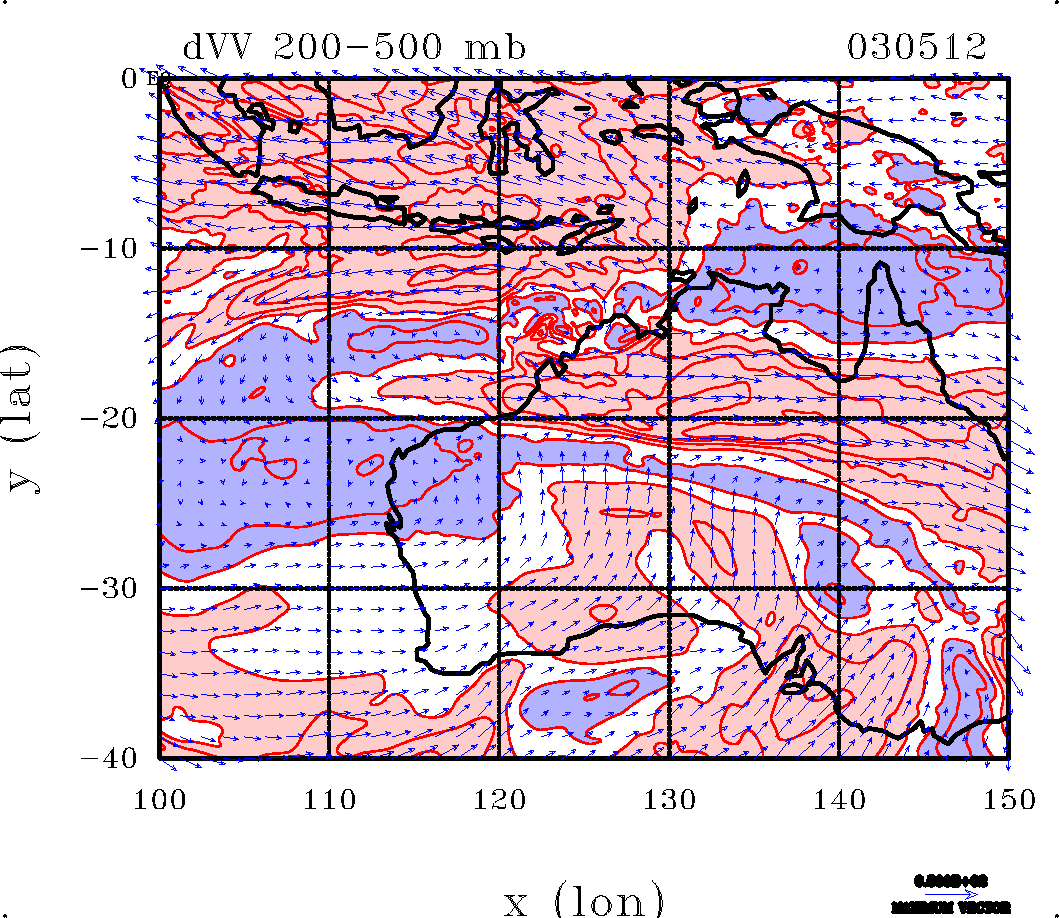
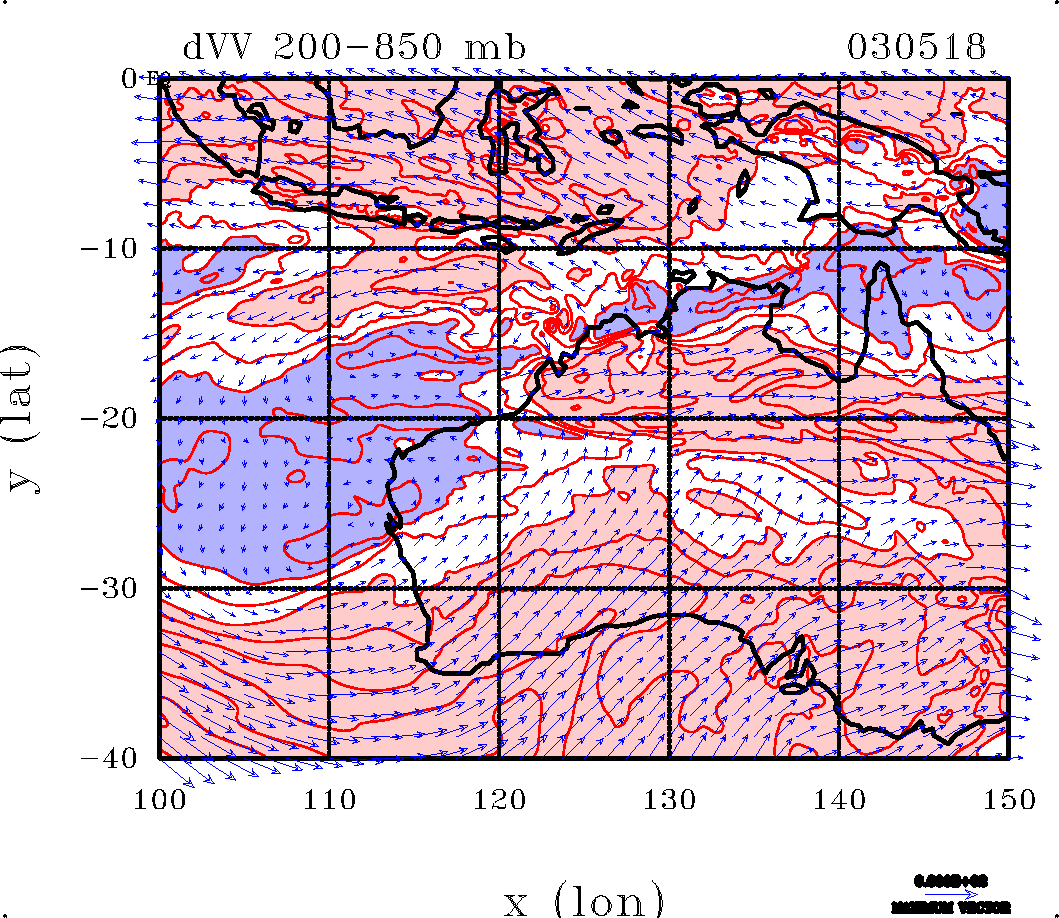
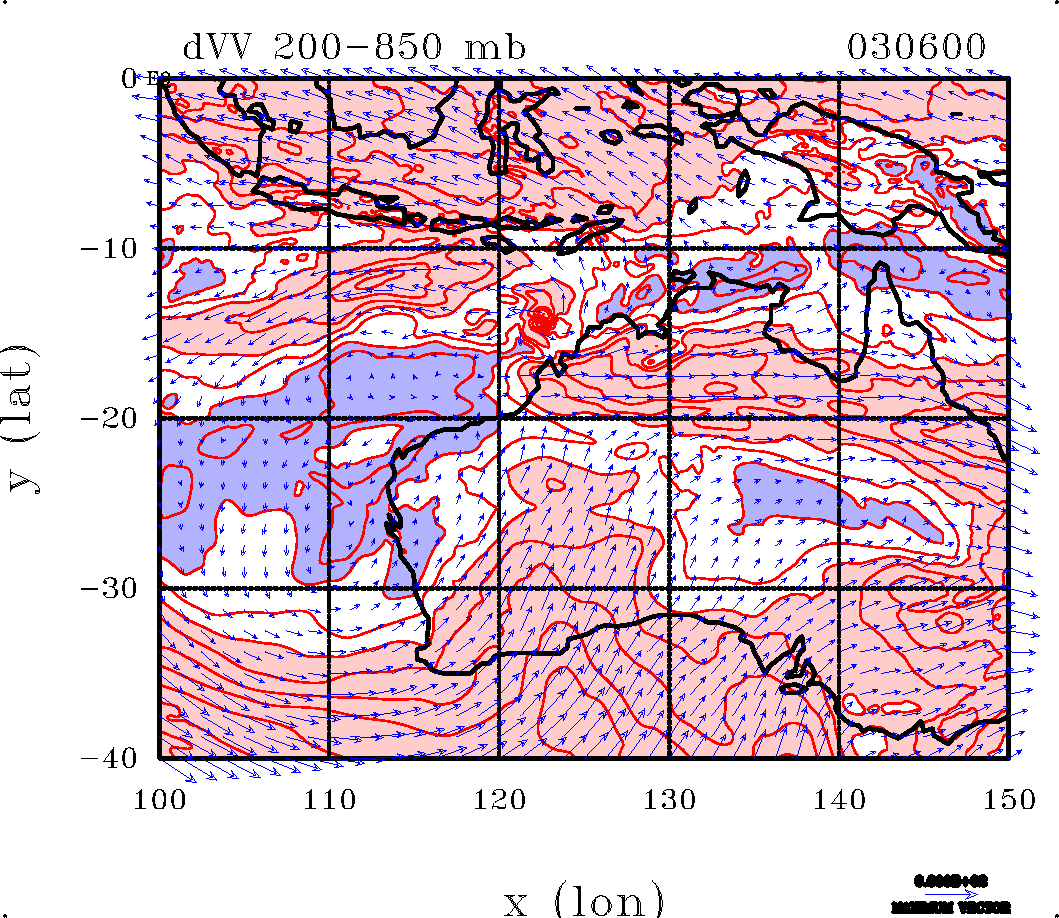
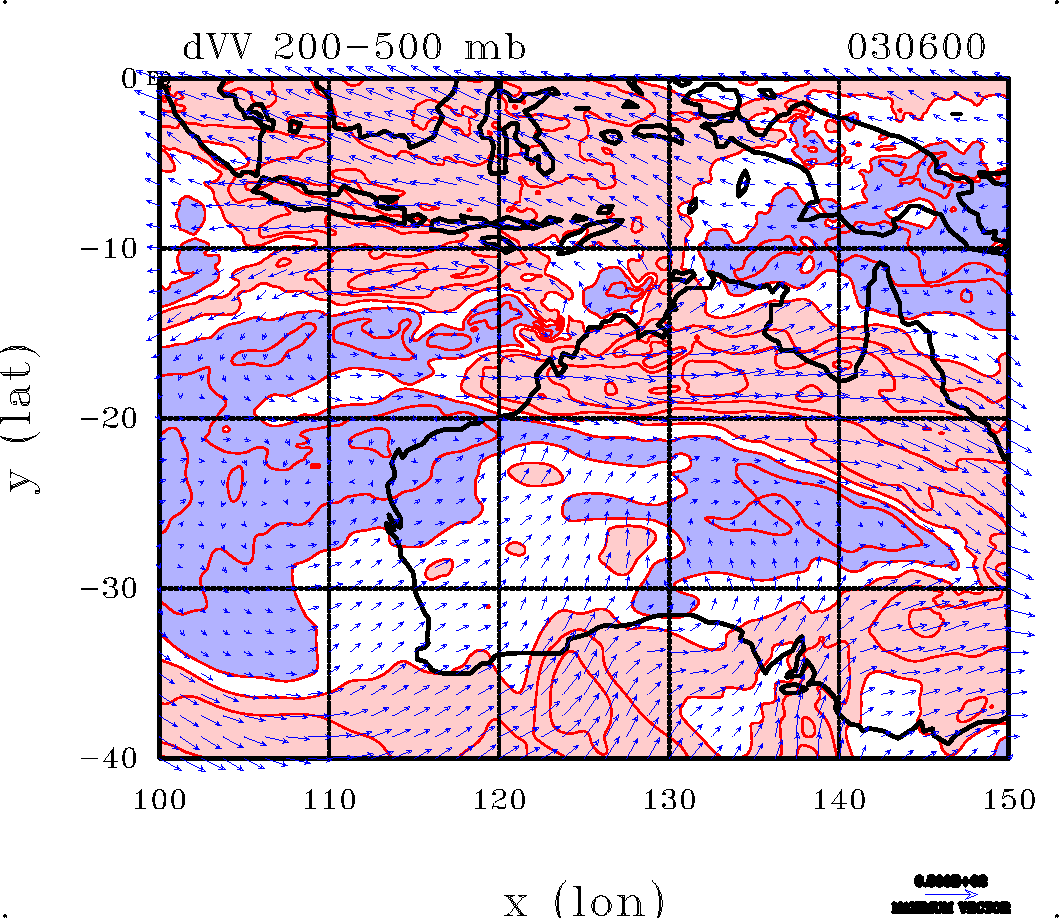
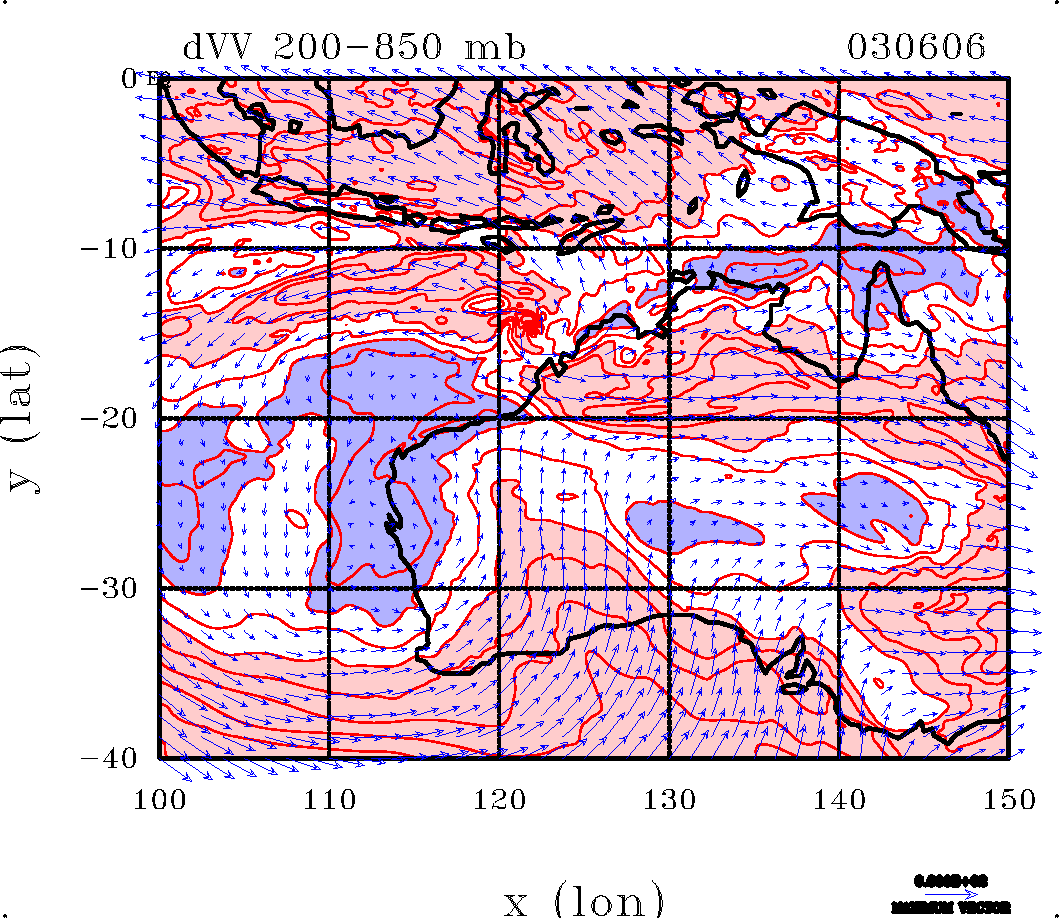
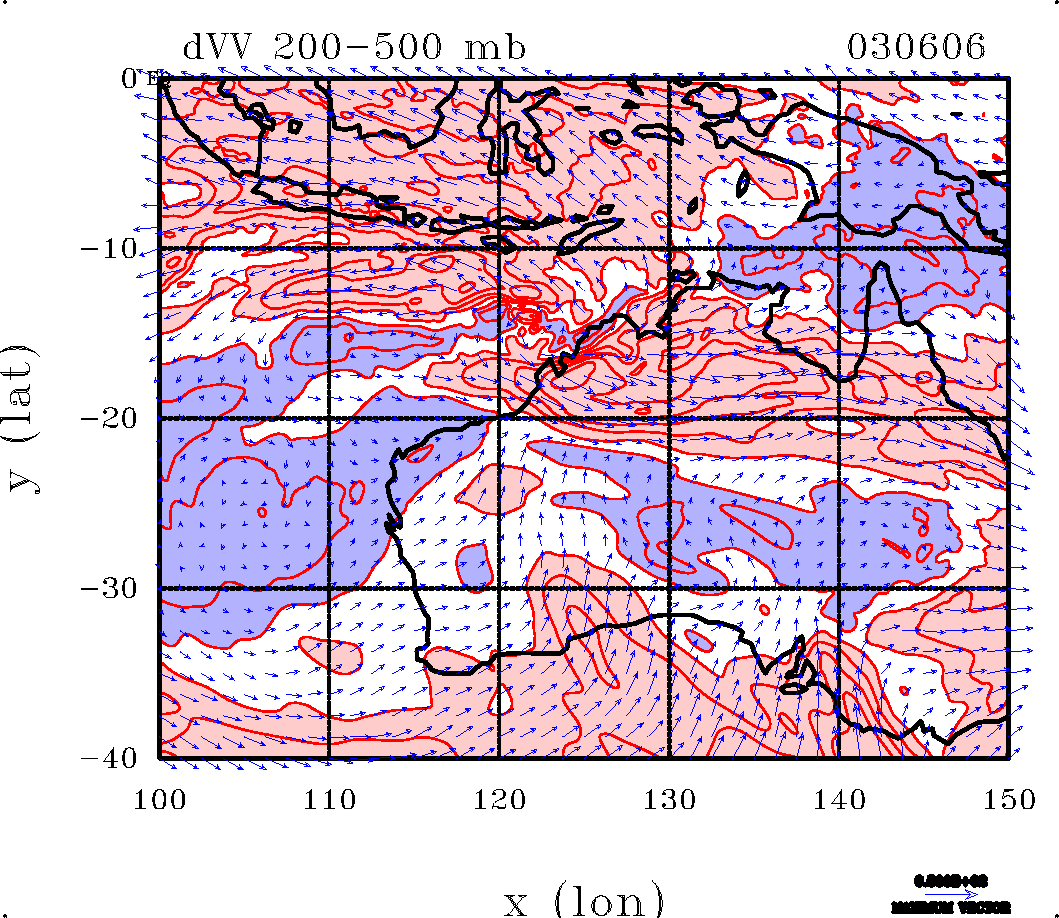
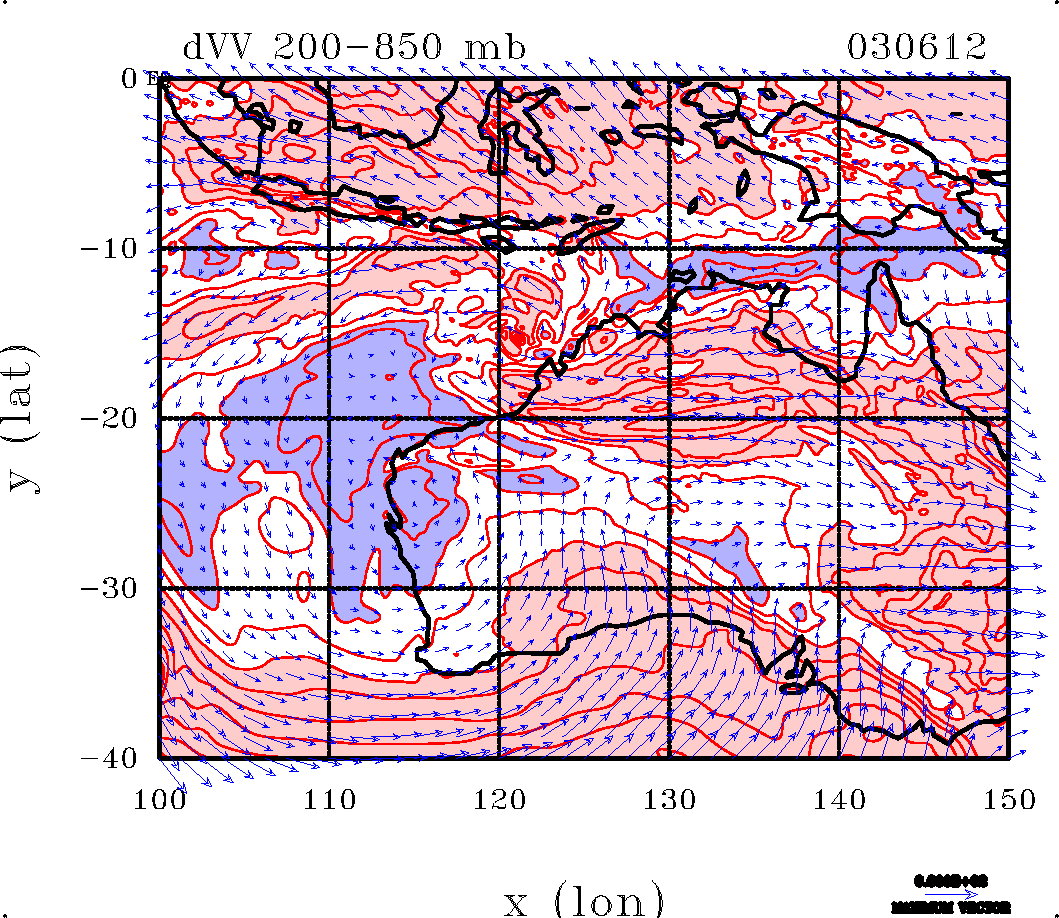
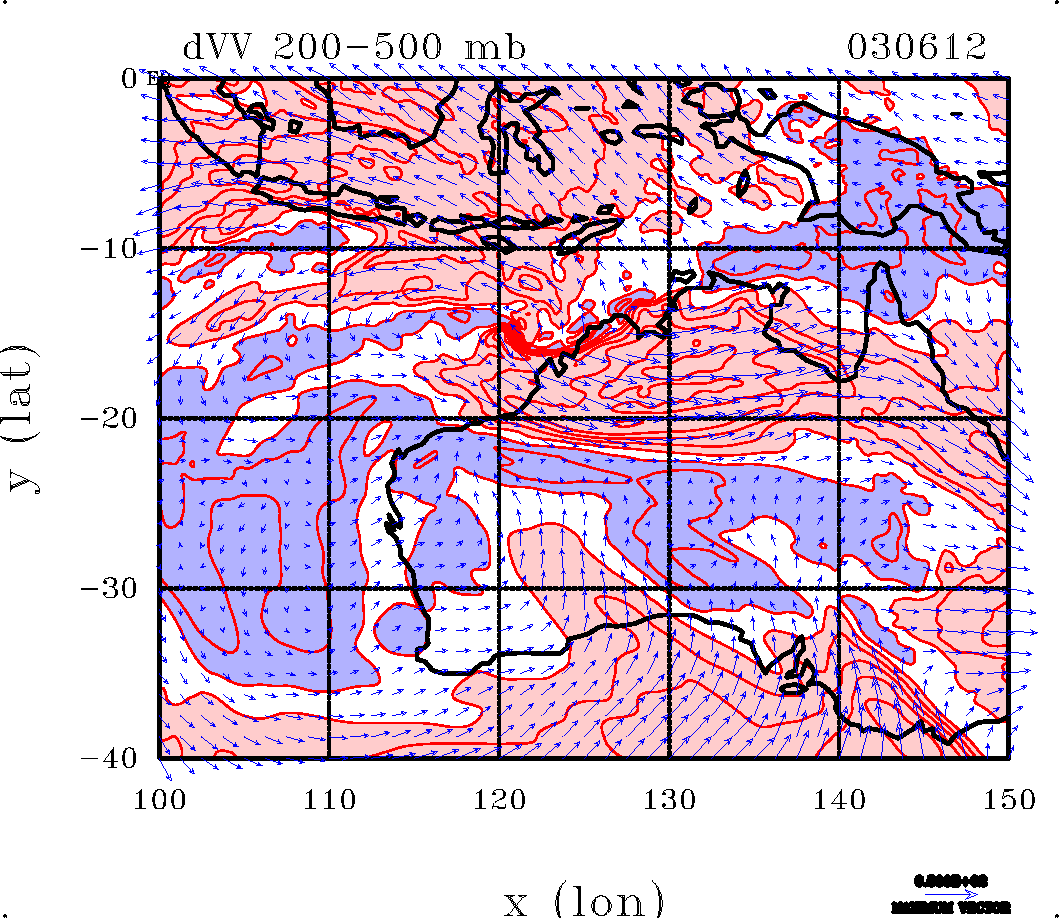
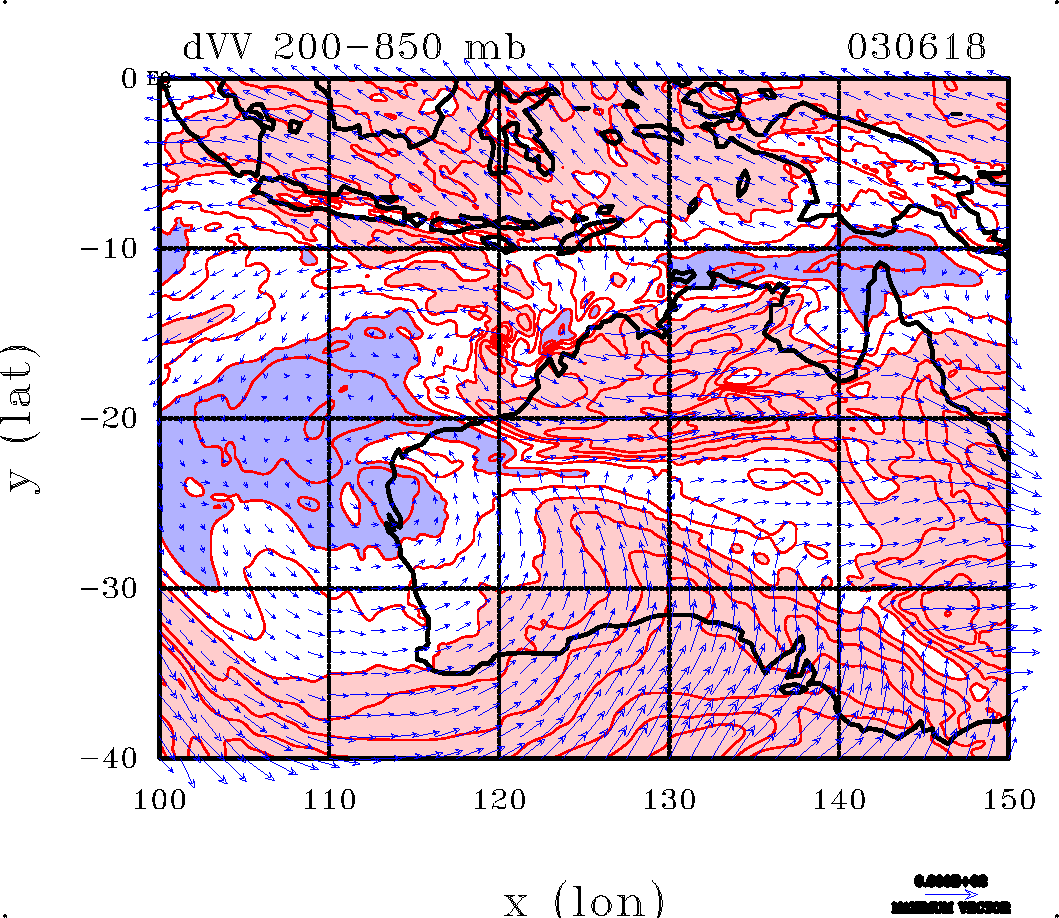
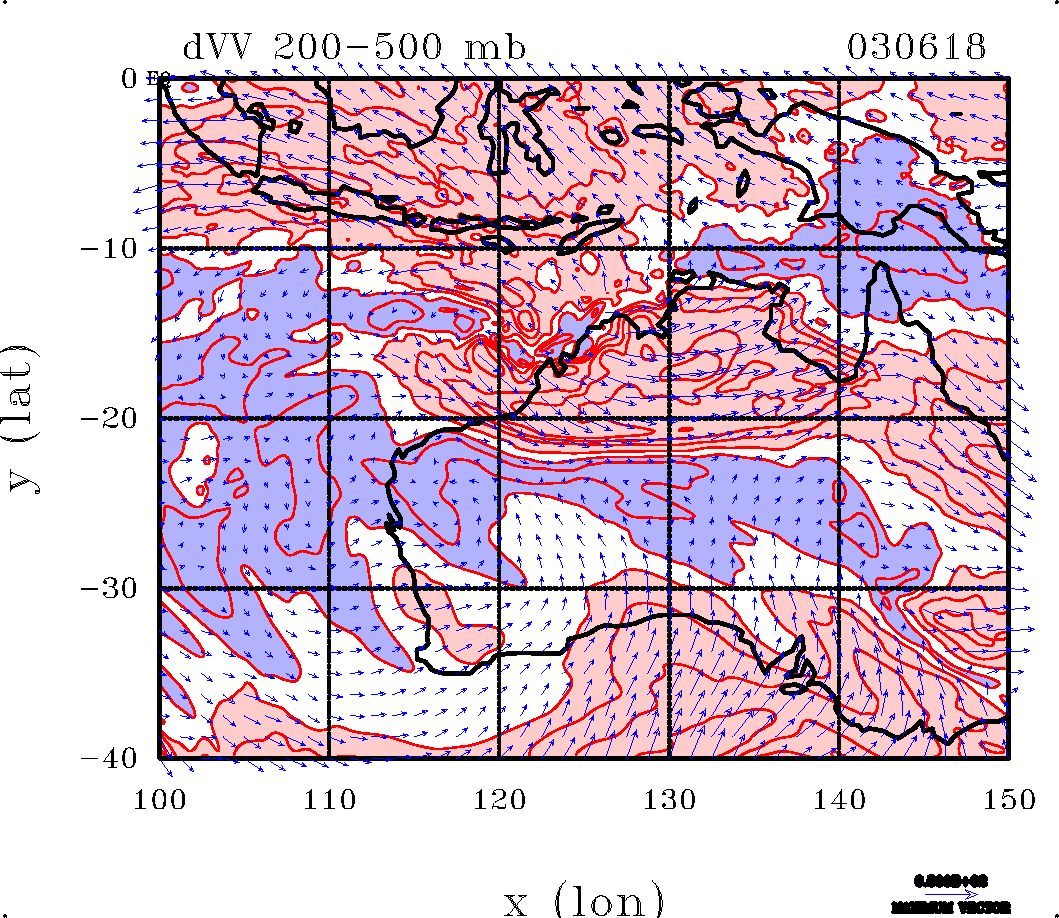
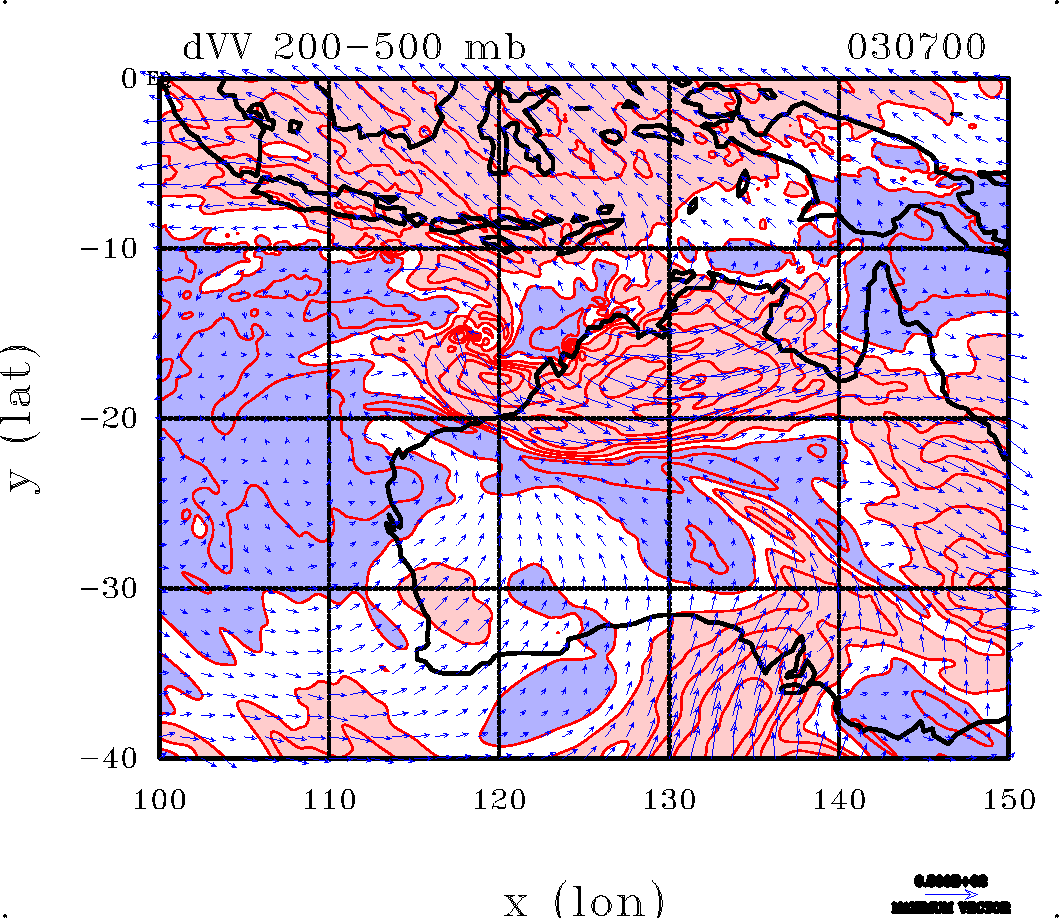
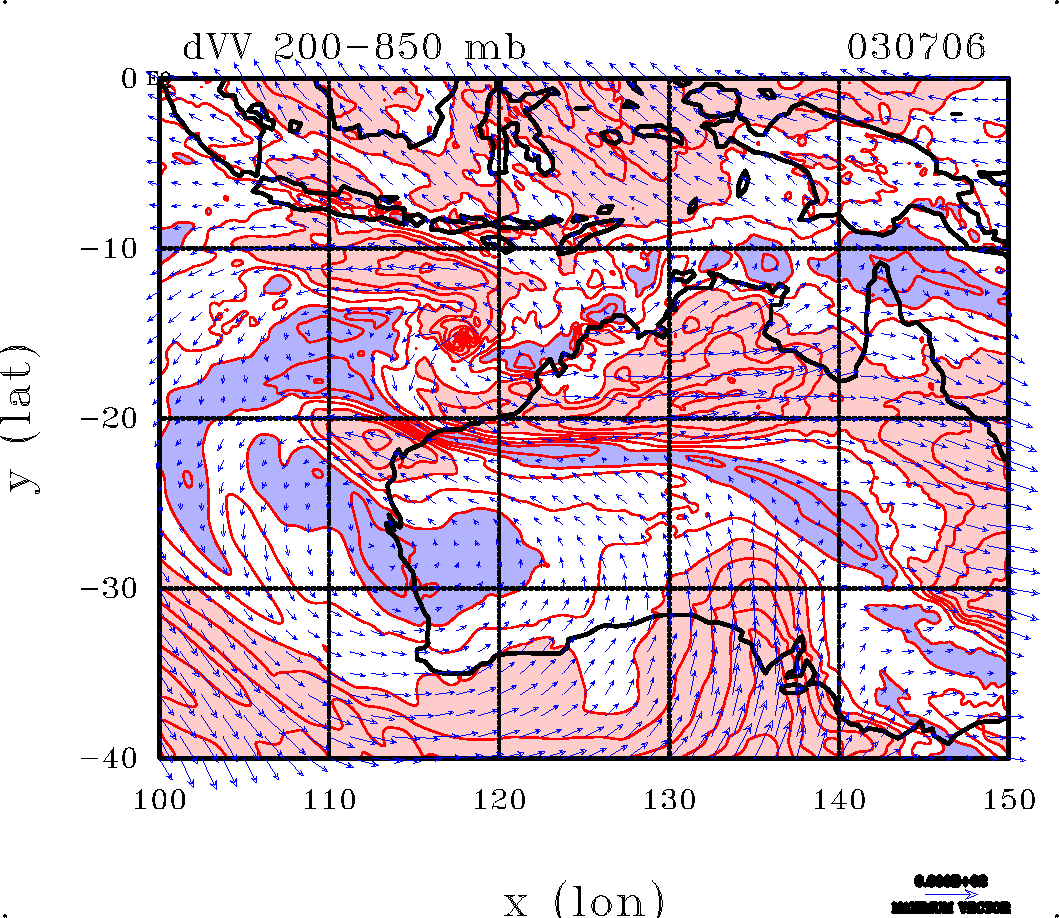
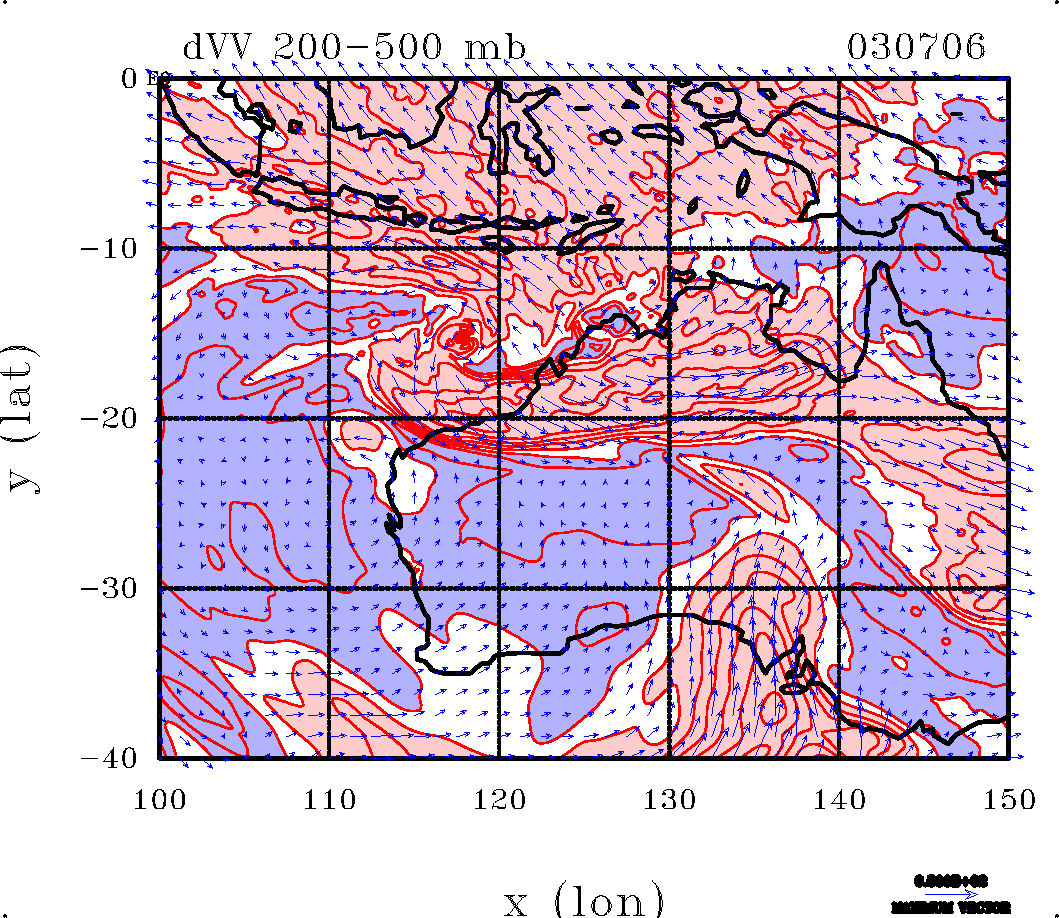
Wind vectors and contours of the zonal wind component at selected pressure levels
The following plots show wind vectors and contours of the zonal velocity component during the genesis and mature stage of the disturbance. Contour levels for the zonal wind are 5 m s-1 up to 500 mb and 10 m s-1 at 200 mb. Regions of westerly zonal wind speed > 5 m s-1 are shaded pink; regions of easterly zonal wind speed < -5 m s-1 shaded light blue. Negative contours blue/dashed.
 |  |
|
|
 |  |
|
|
 |  |
|
|
 |  |
|
|
 |  |
|
|
 |  |
|
|
 |  |
|
|
 |  |
|
|
 |  |
|
|
 |  |
|
|
 |  |
|
|
 |  |
|
|
 |  |
|
|
 |  |
|
|
 |  |
|
|
 |  |
|
|
 |  |
|
|
 |  |
|
|
 |  |
|
|
 |  |
|
|
 |  |
|
|
 |  |
|
|
 |  |
|
|
 |  |
|
|
 |  |
|
|
 |  |
|
|
 |  |
|
|
 |  |
|
|
 |  |
|
|
 |  |
|
|
 |  |
|
|
 |  |
|
|
 |  |
|
 |  |
|
|
 |  |
|
|
 |  |
|
|
 |  |
|
|
 |  |
|
|
 |  |
|
|
 |  |
|
|
 |  |
|
|
 |  |
|
Copyright © Roger Smith: Date 24 May 2014