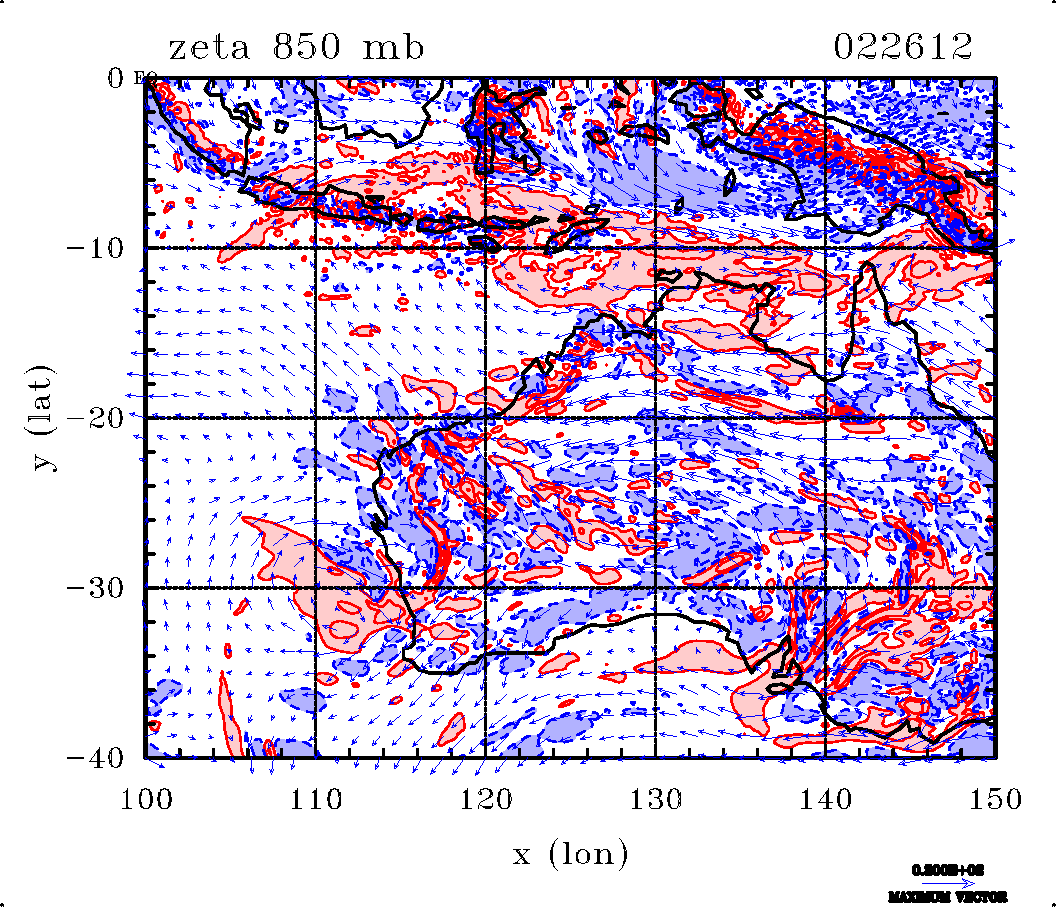
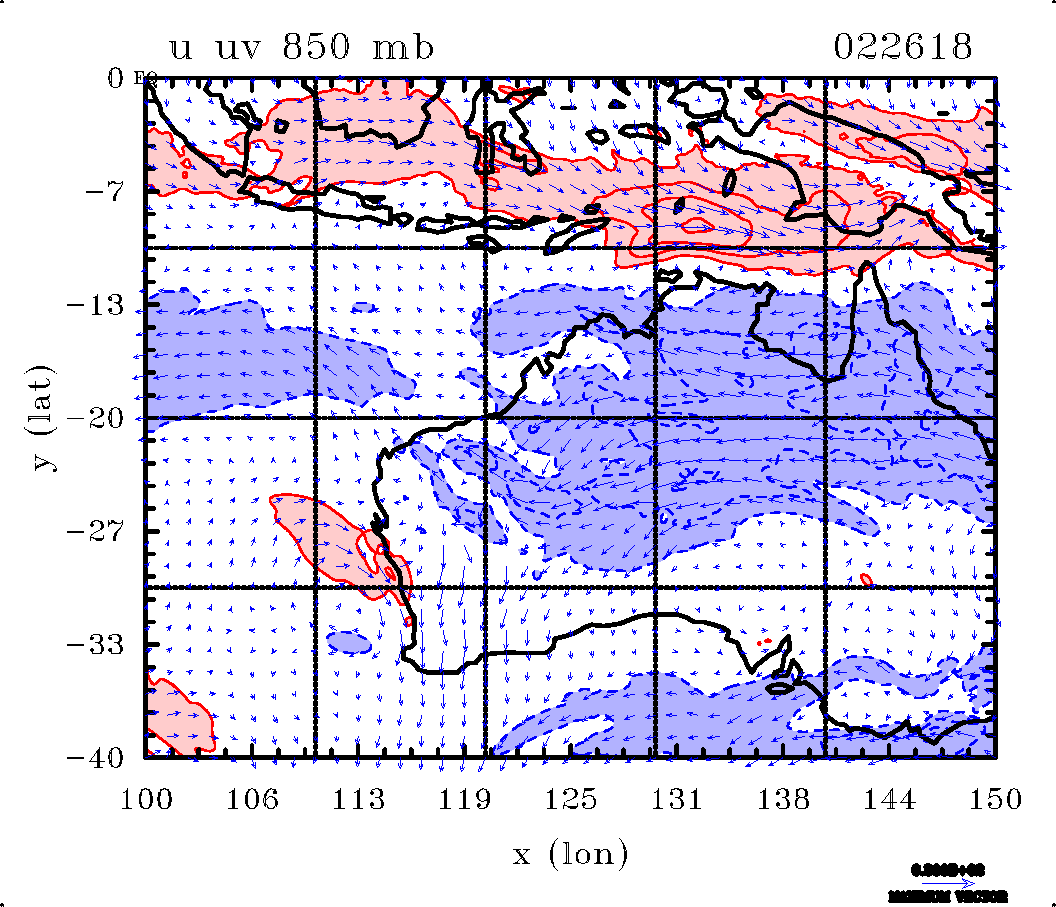
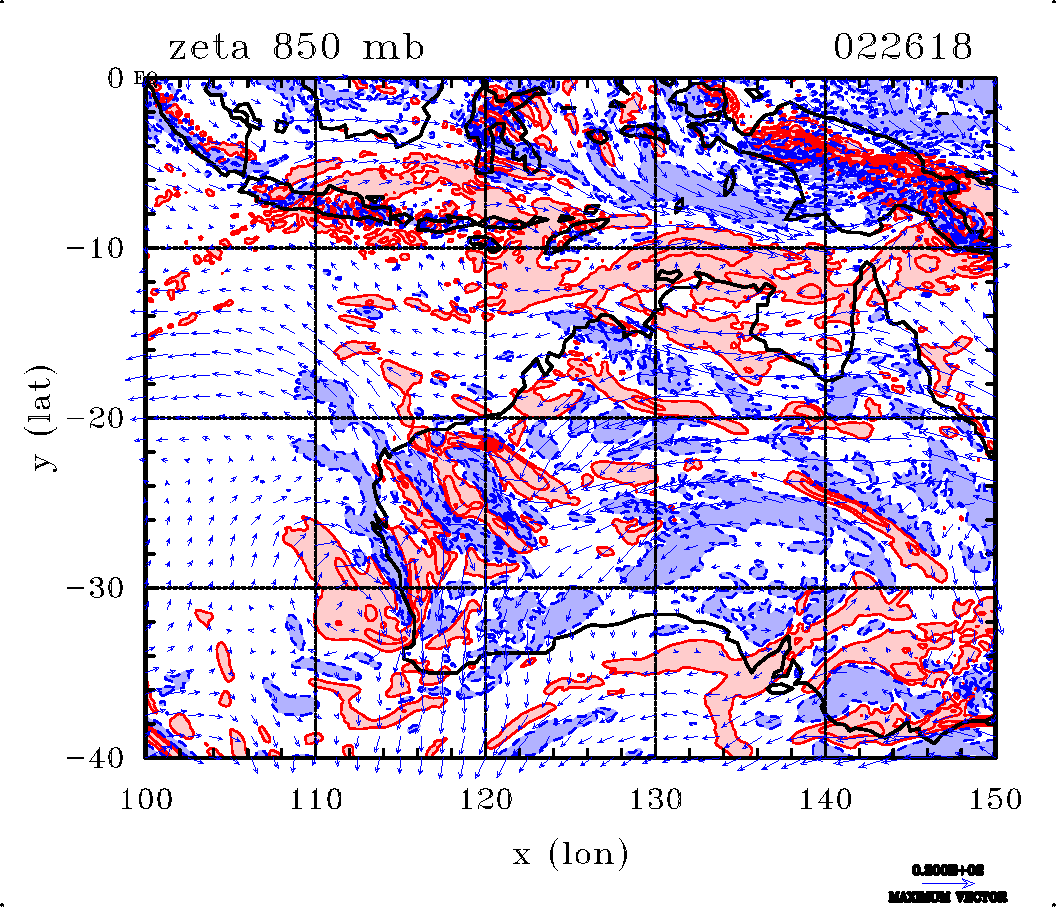
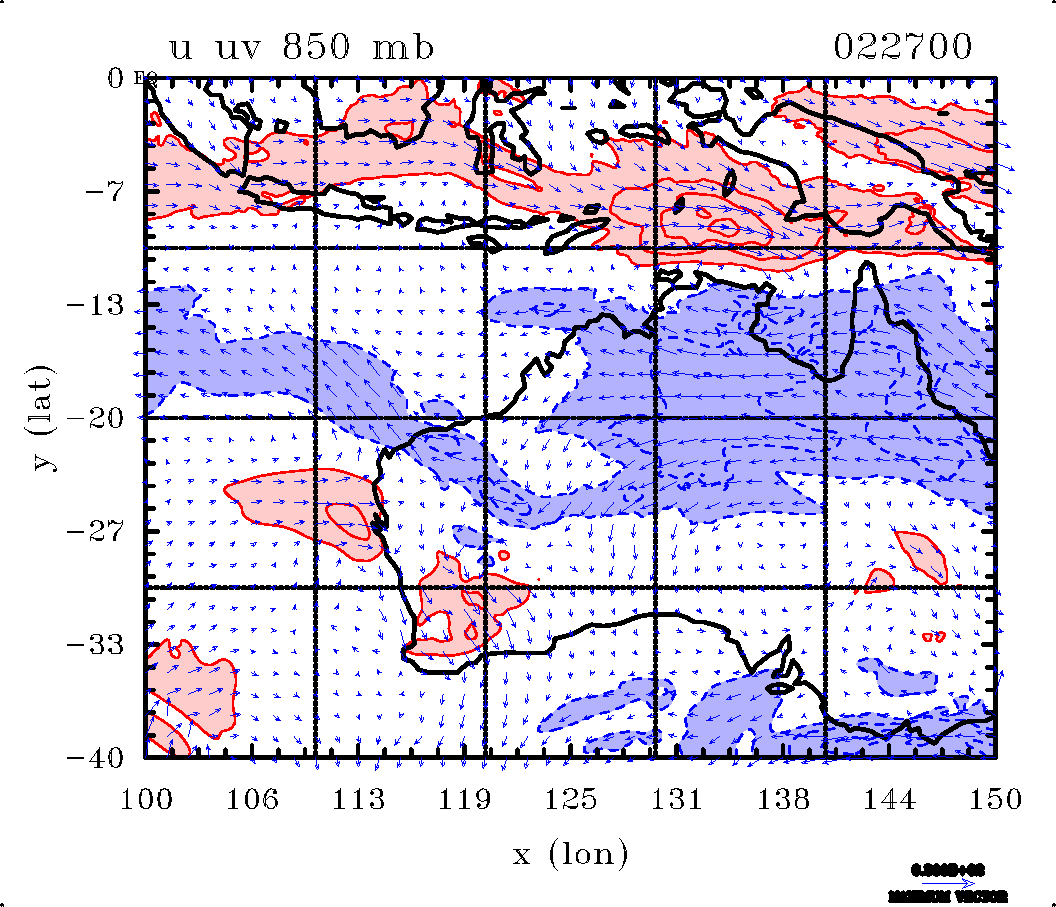
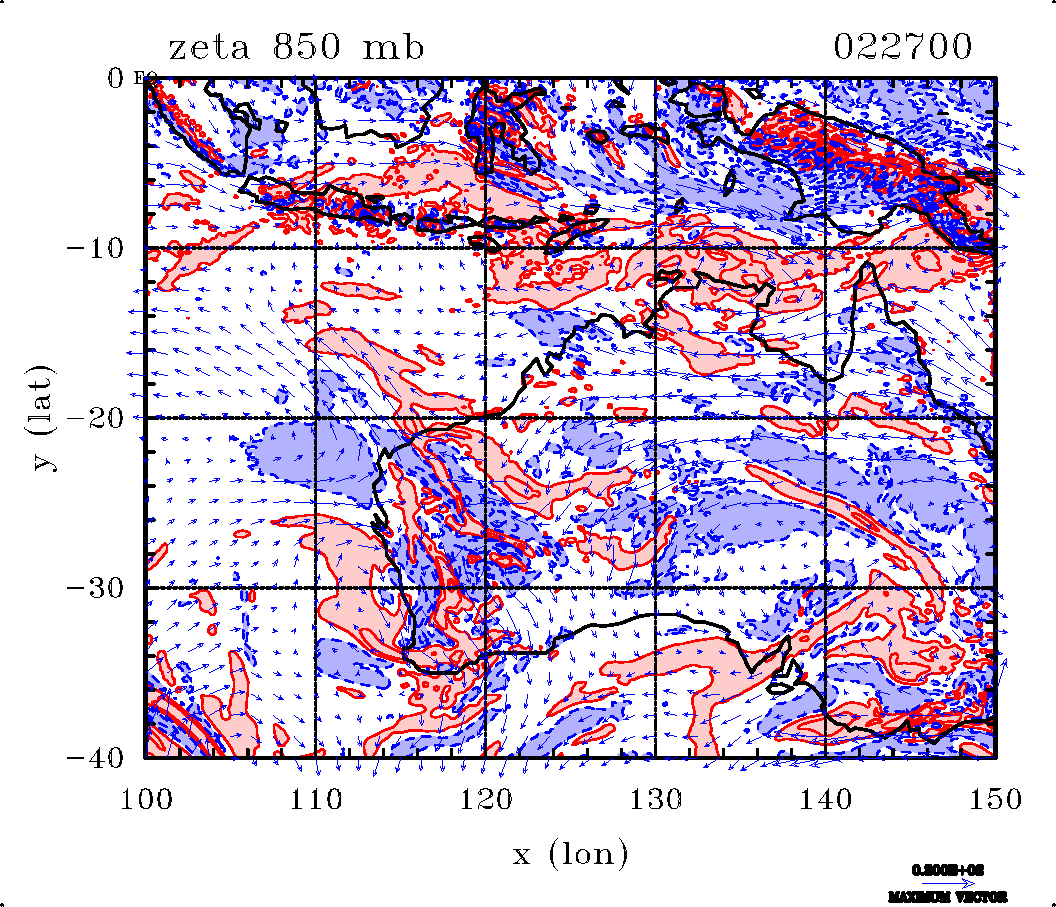
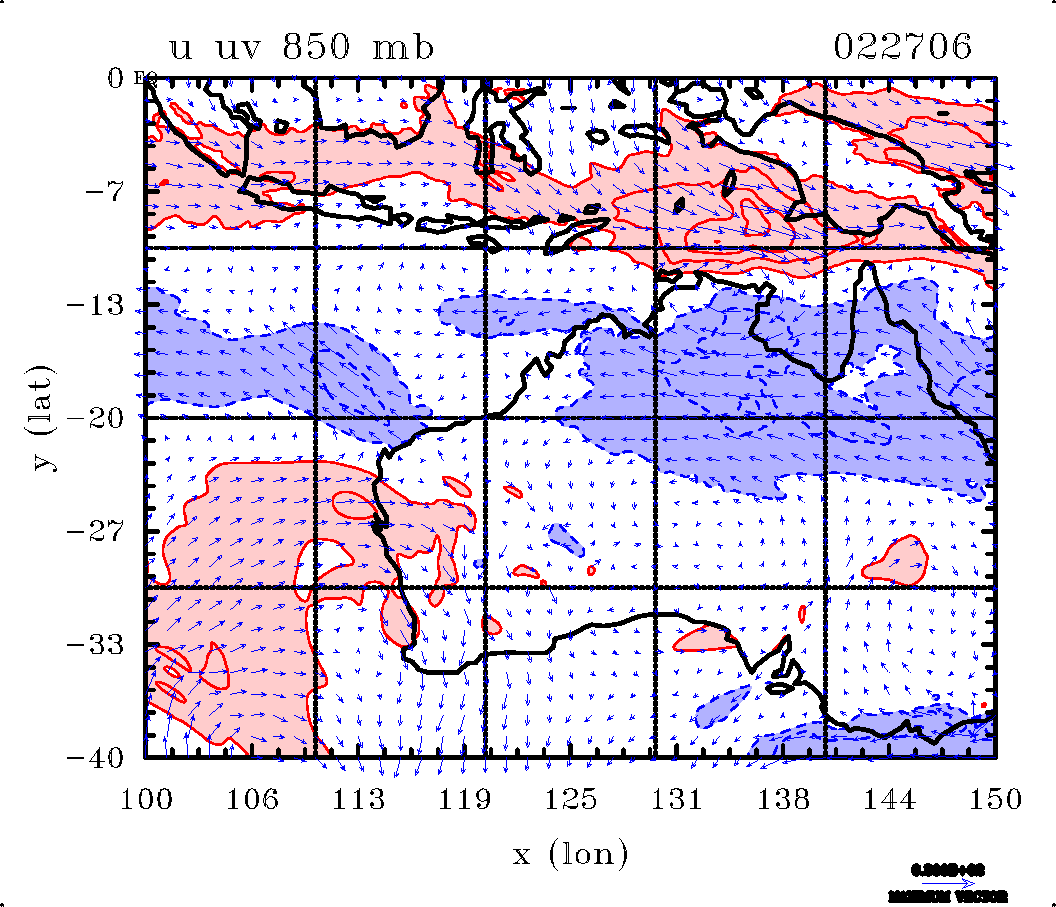
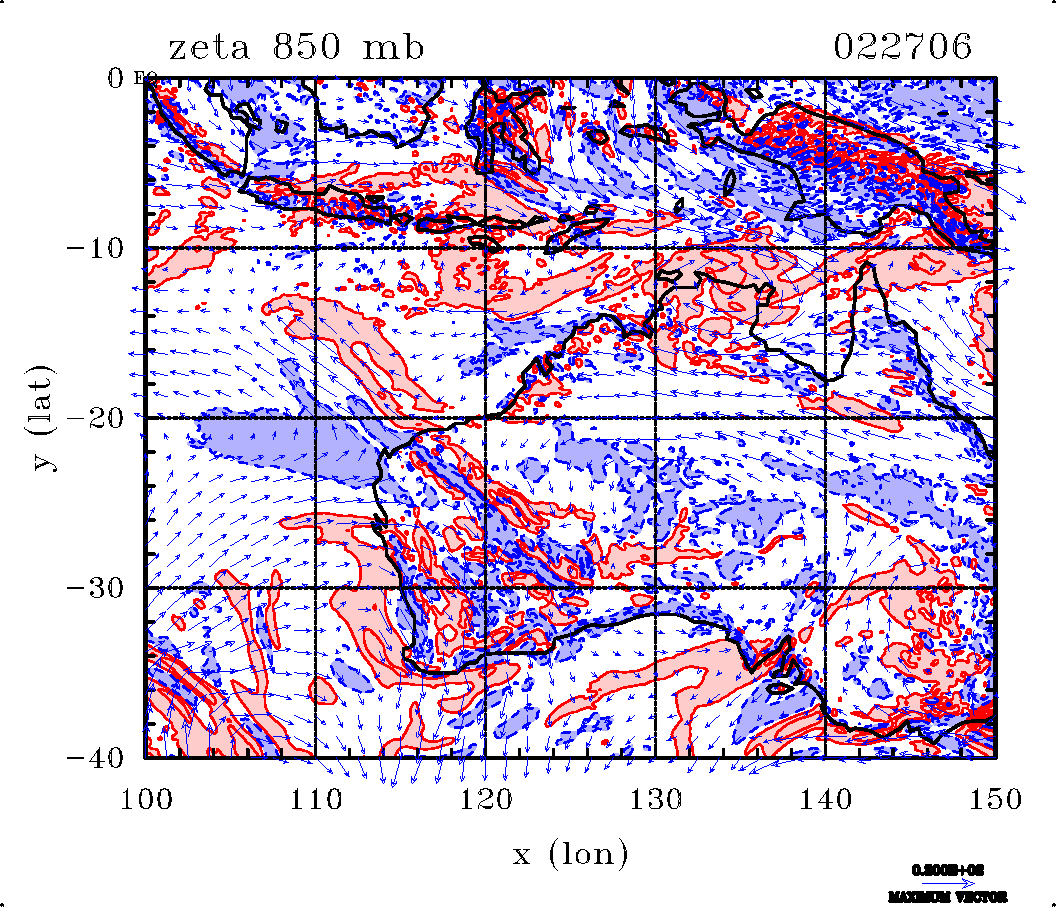
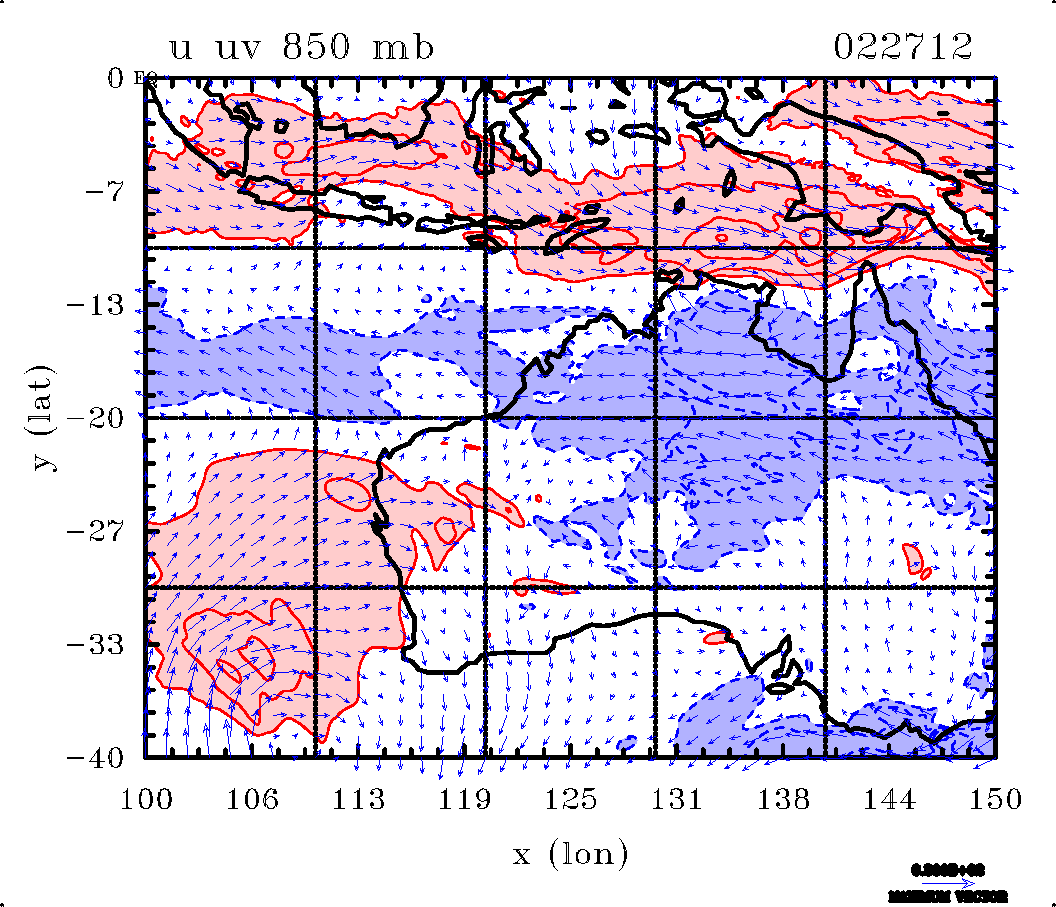
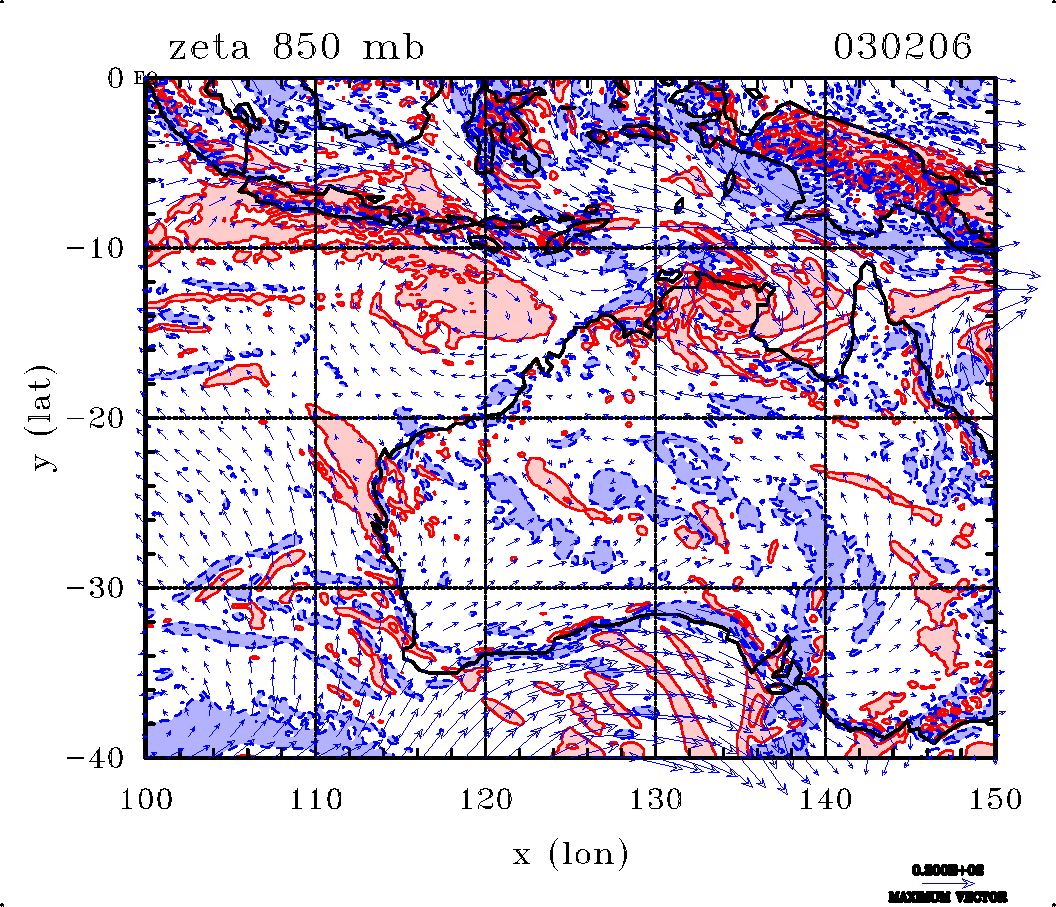
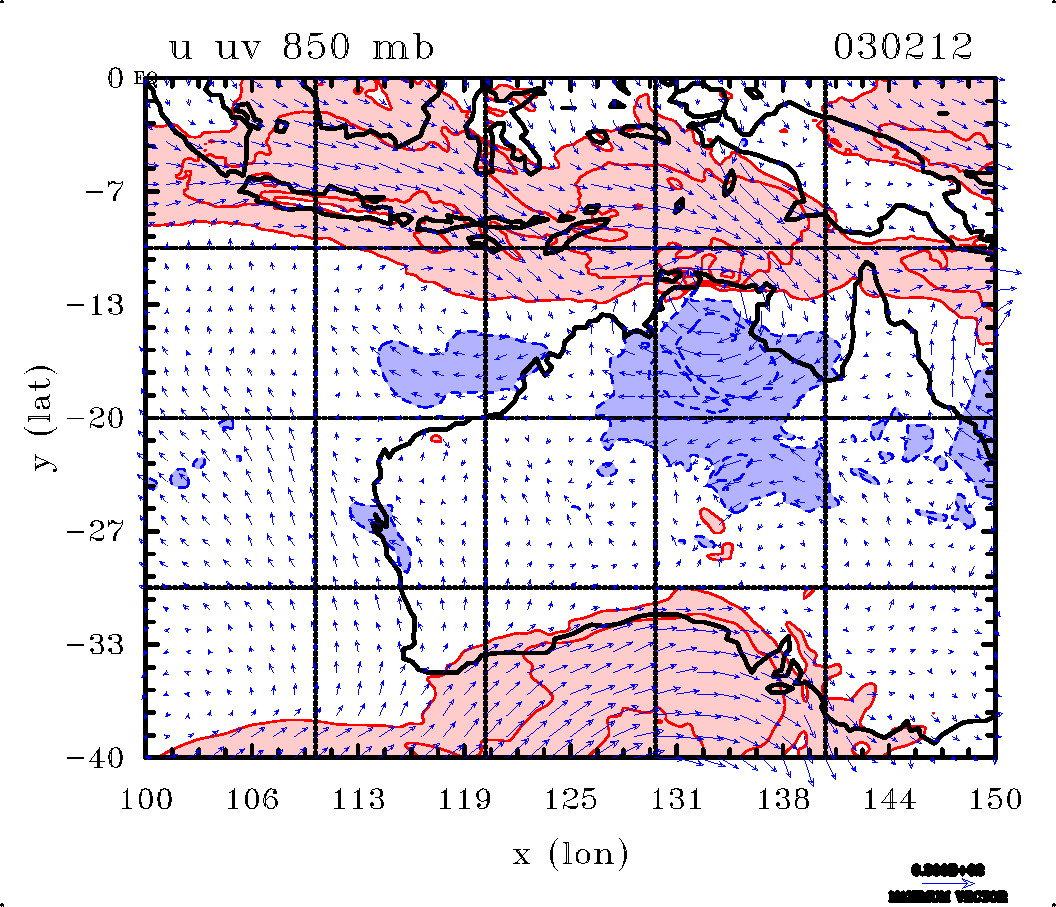
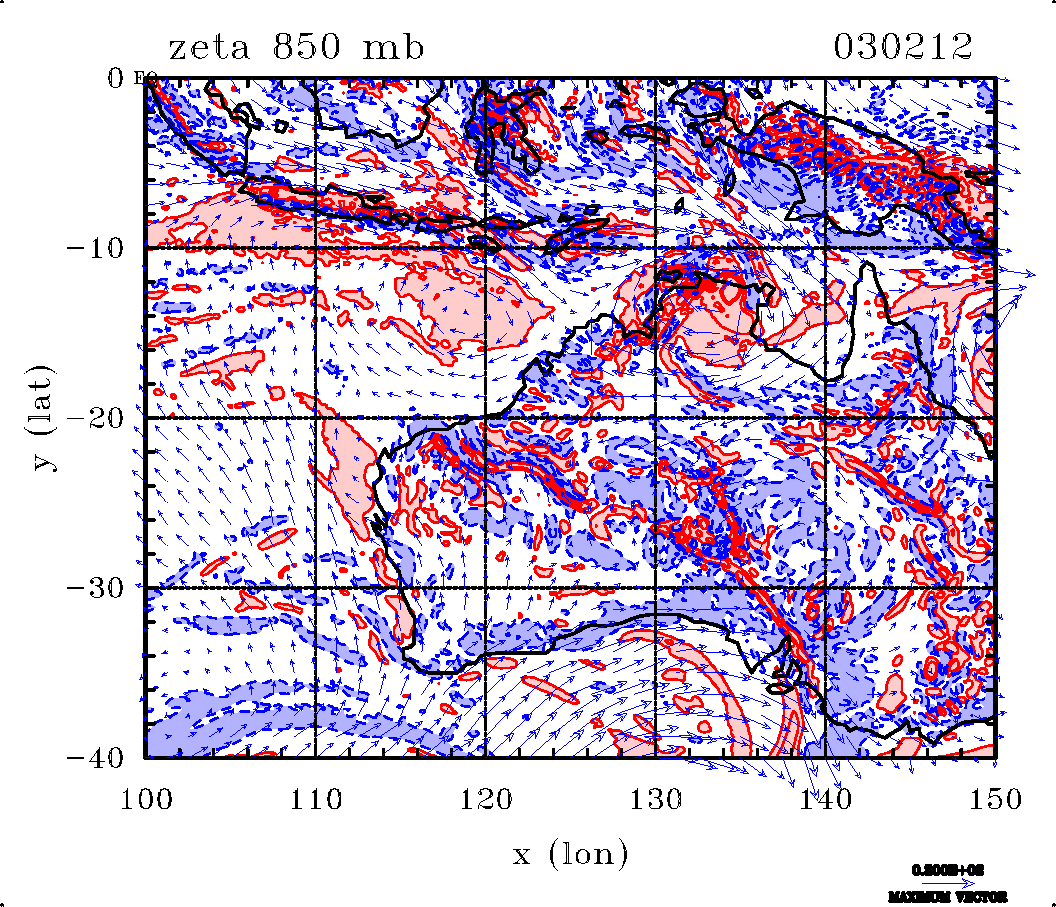
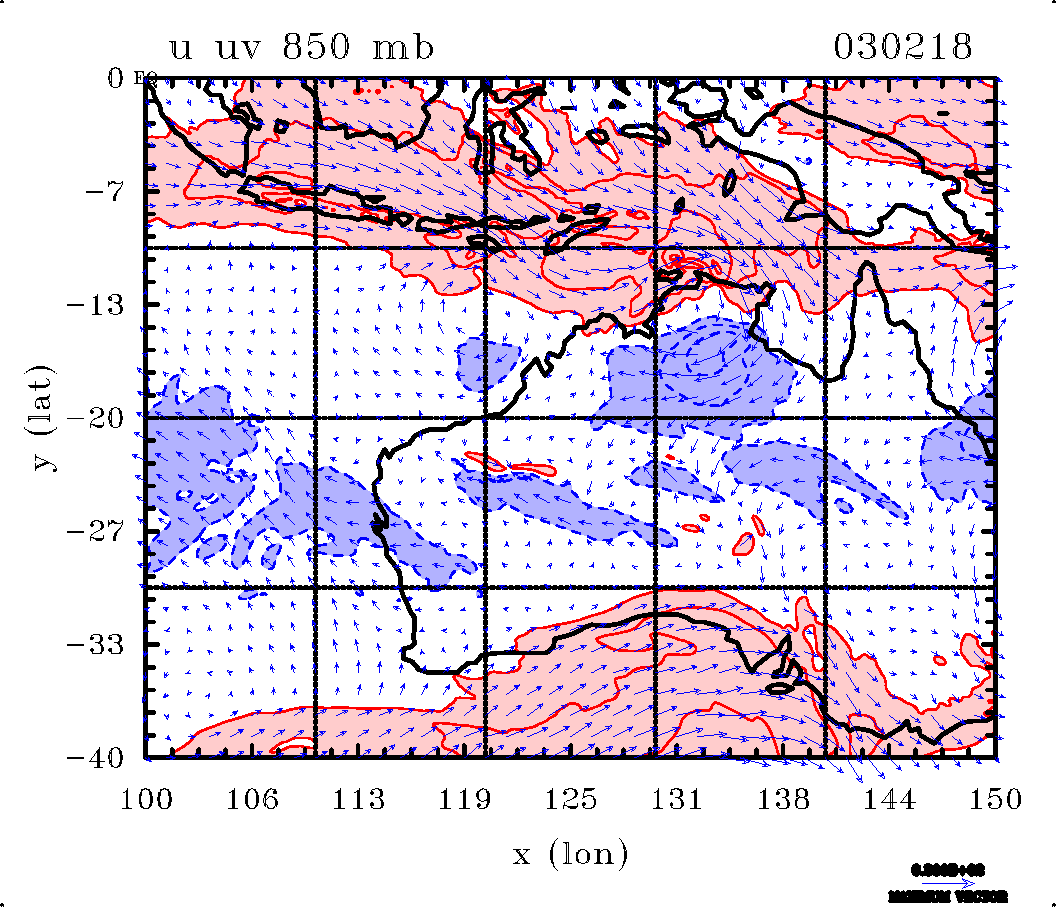
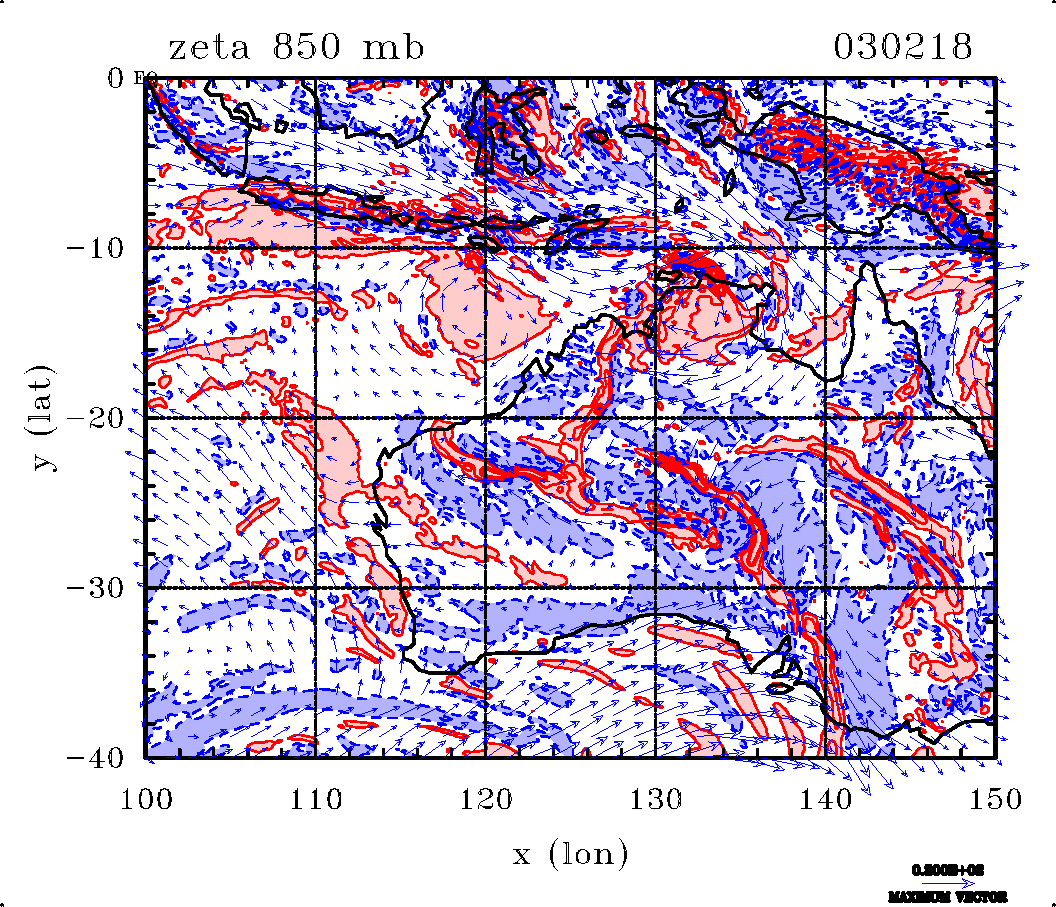
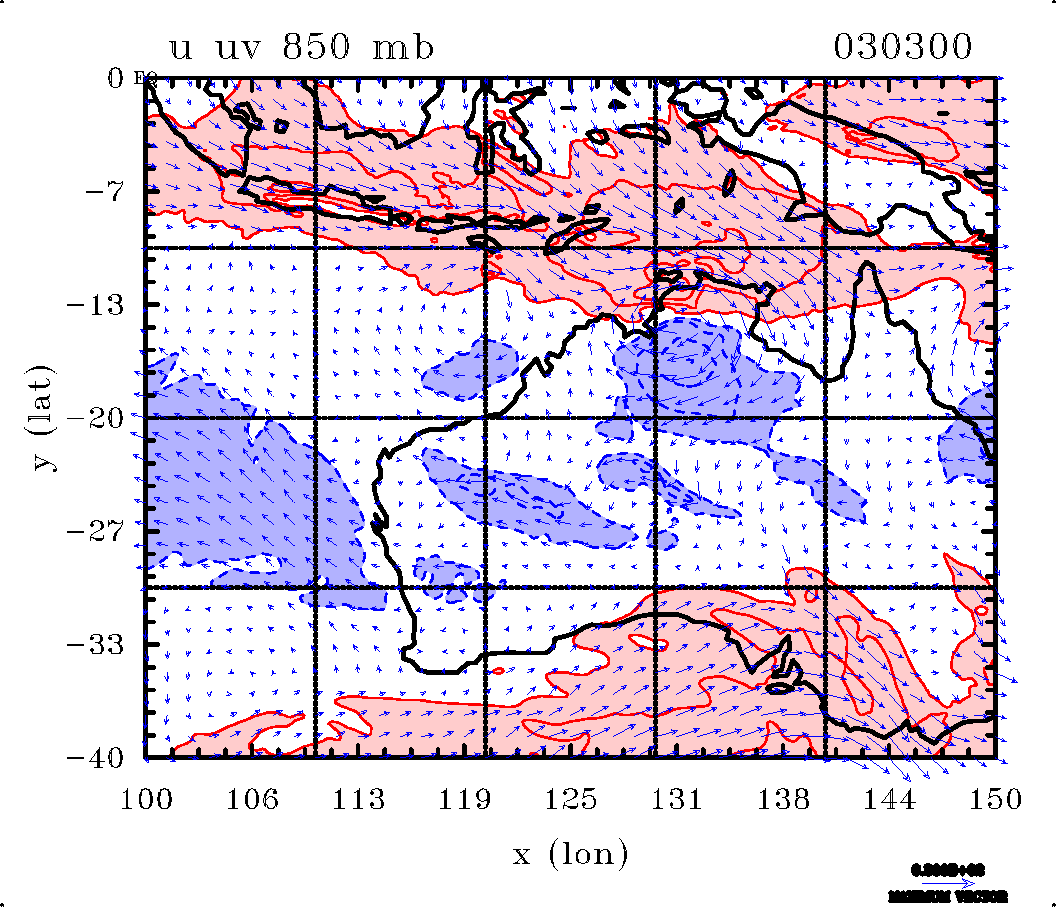
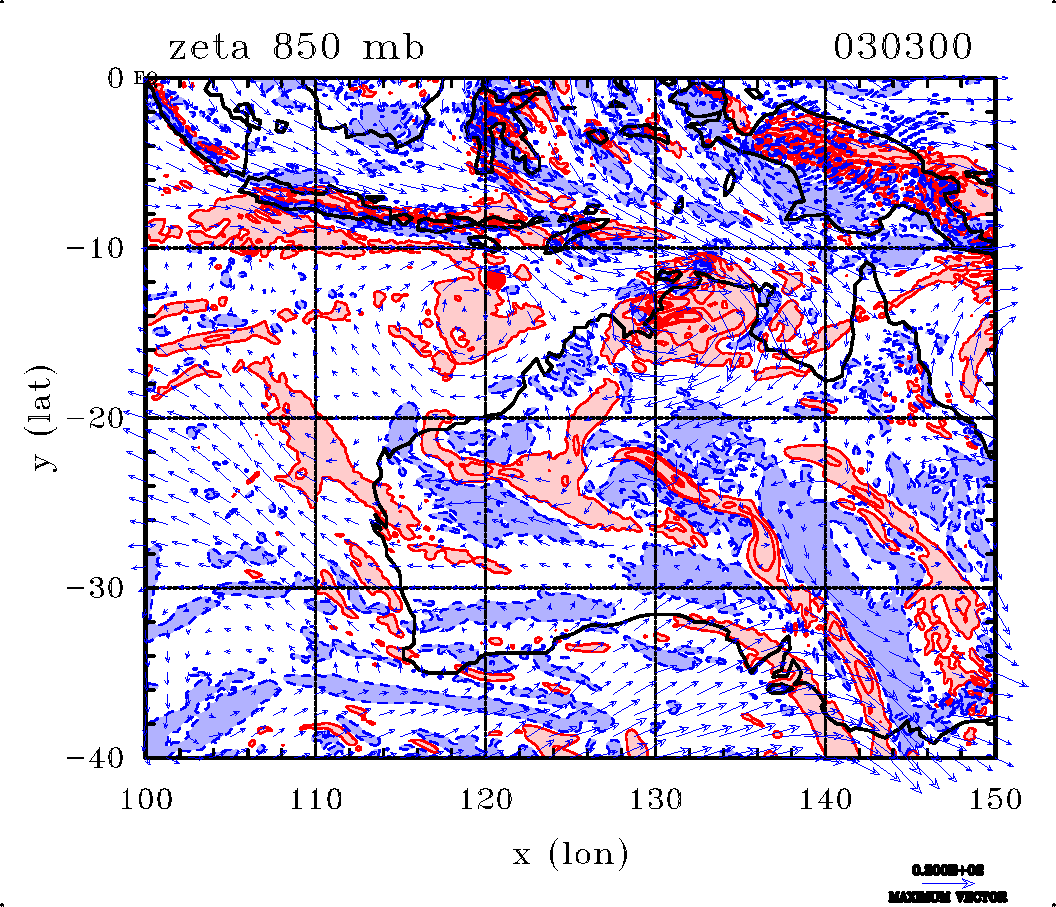
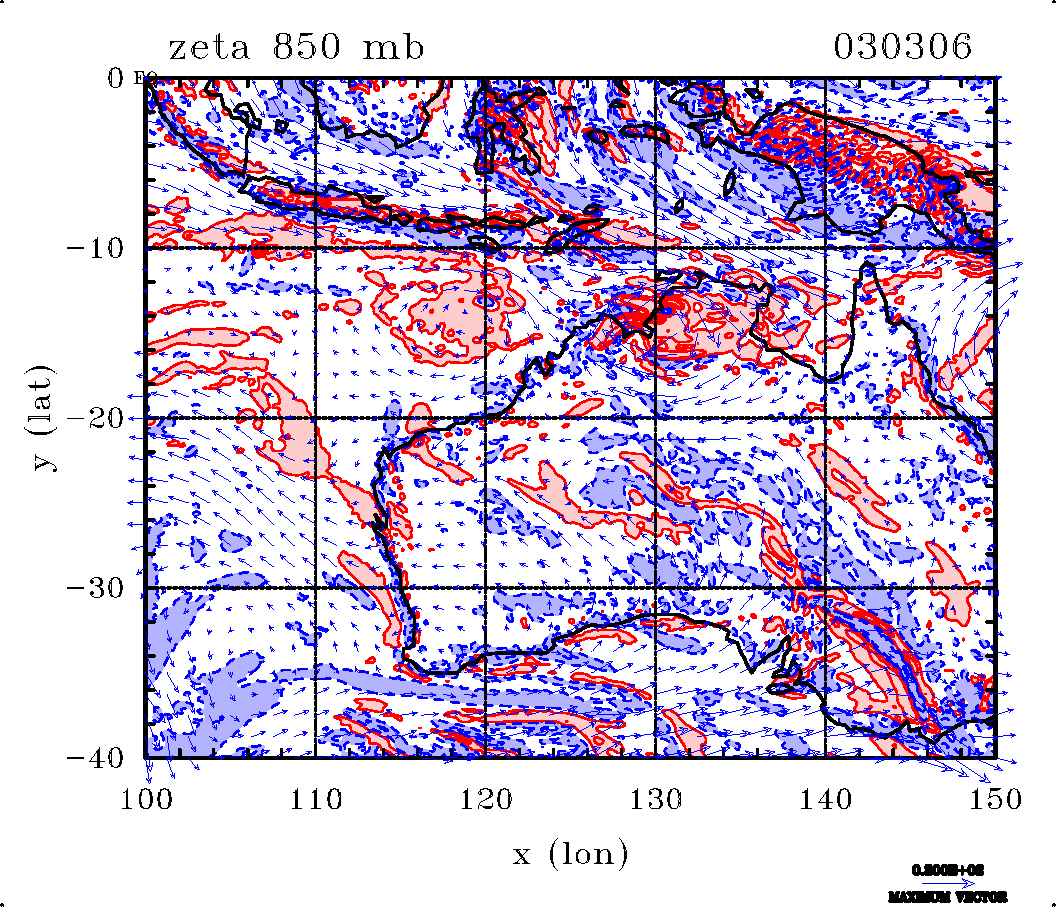
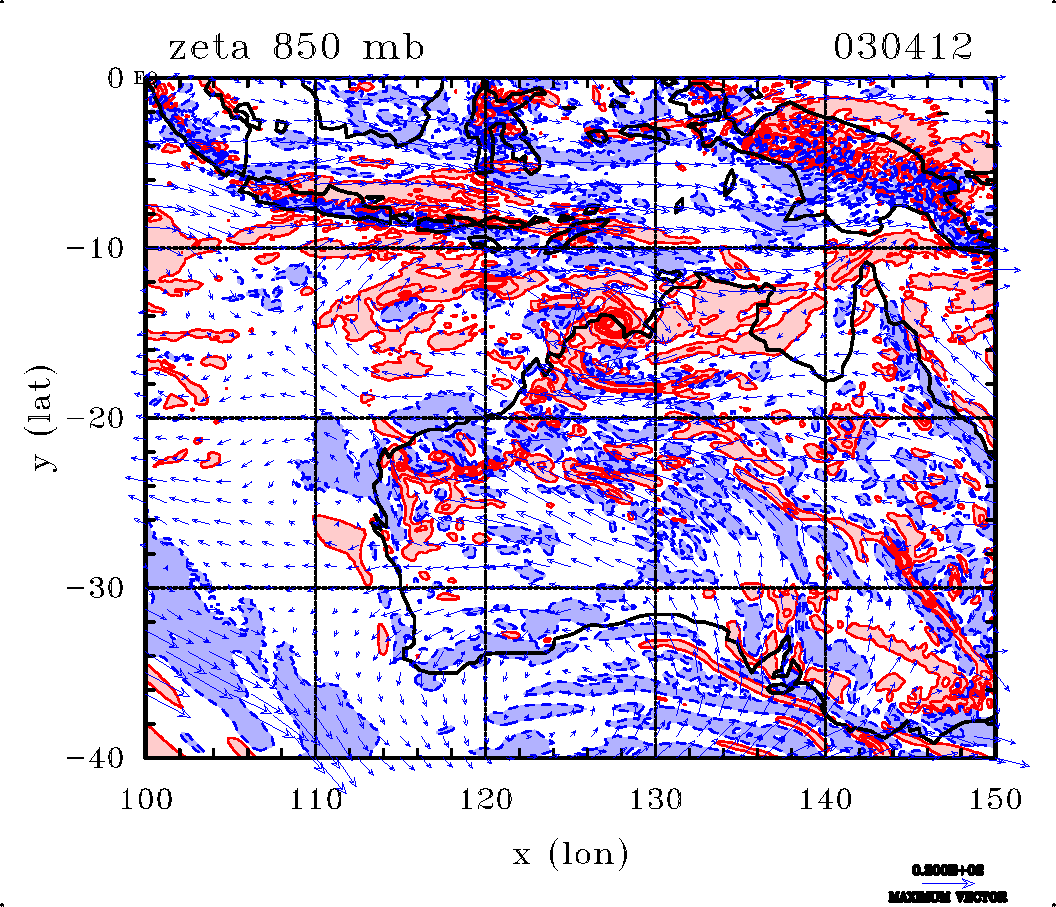
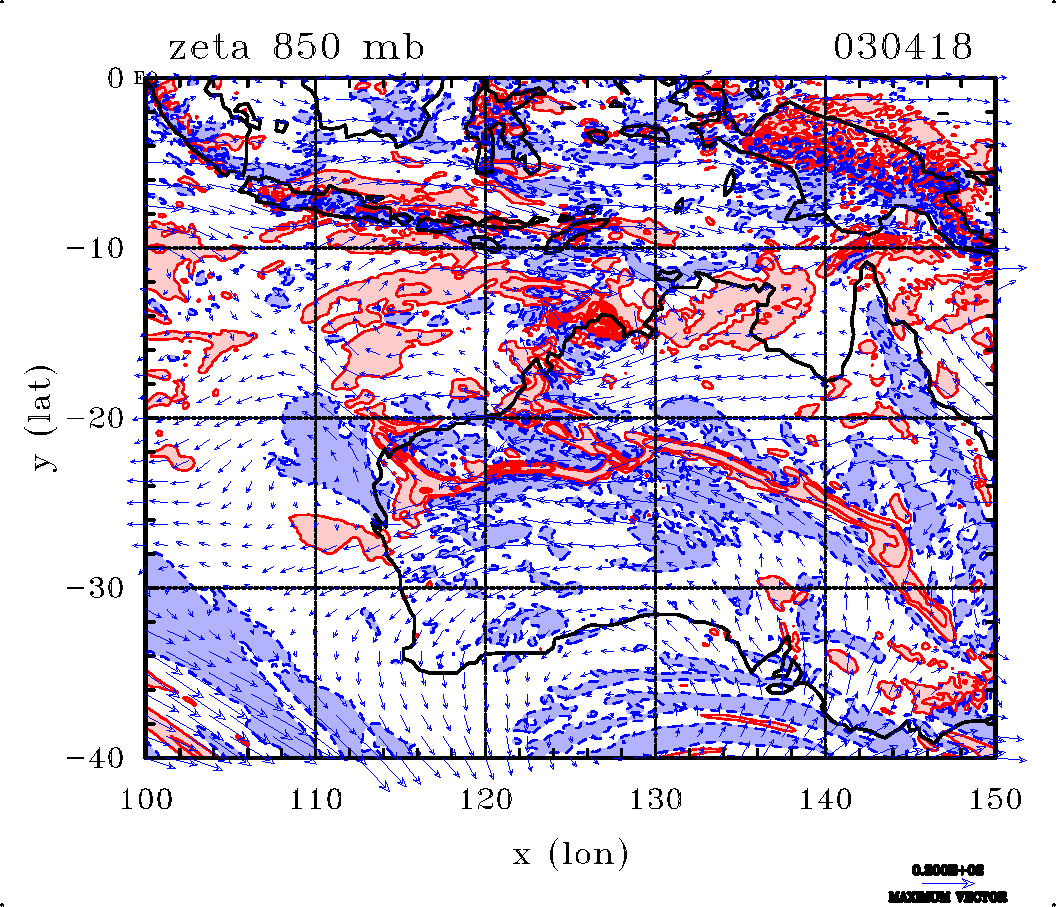
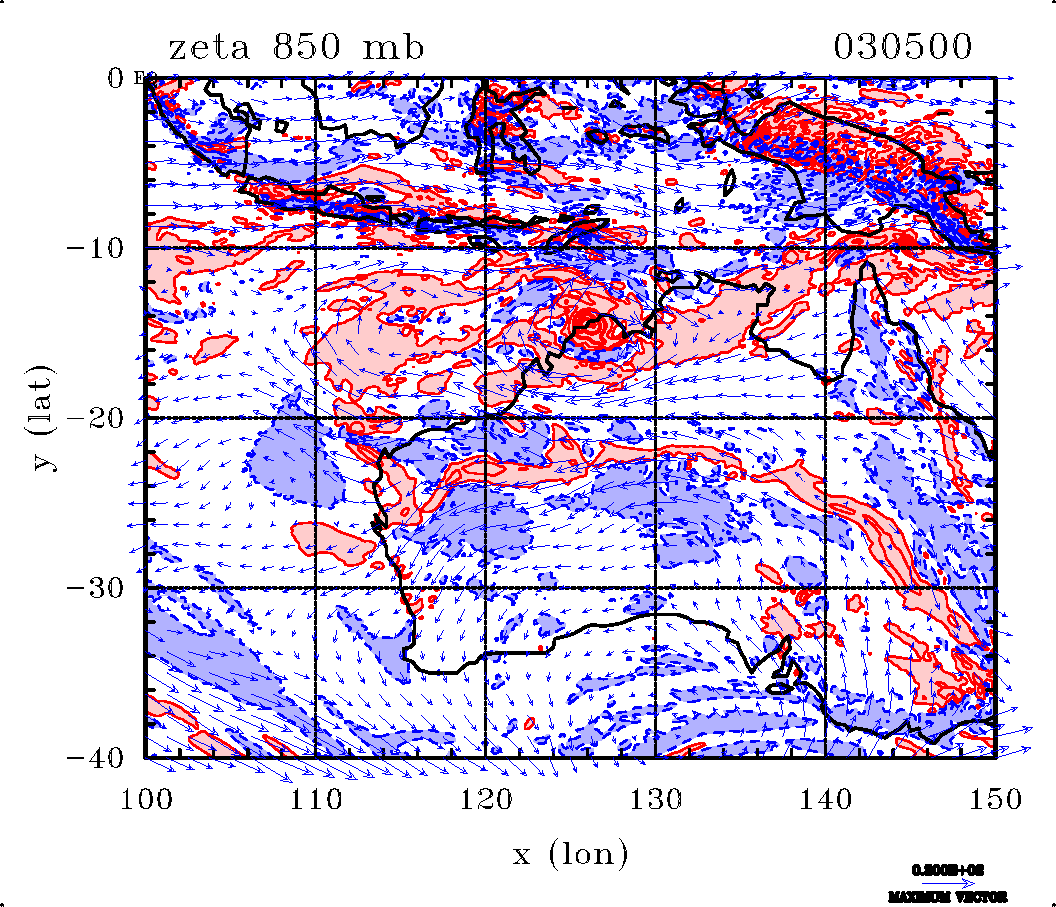
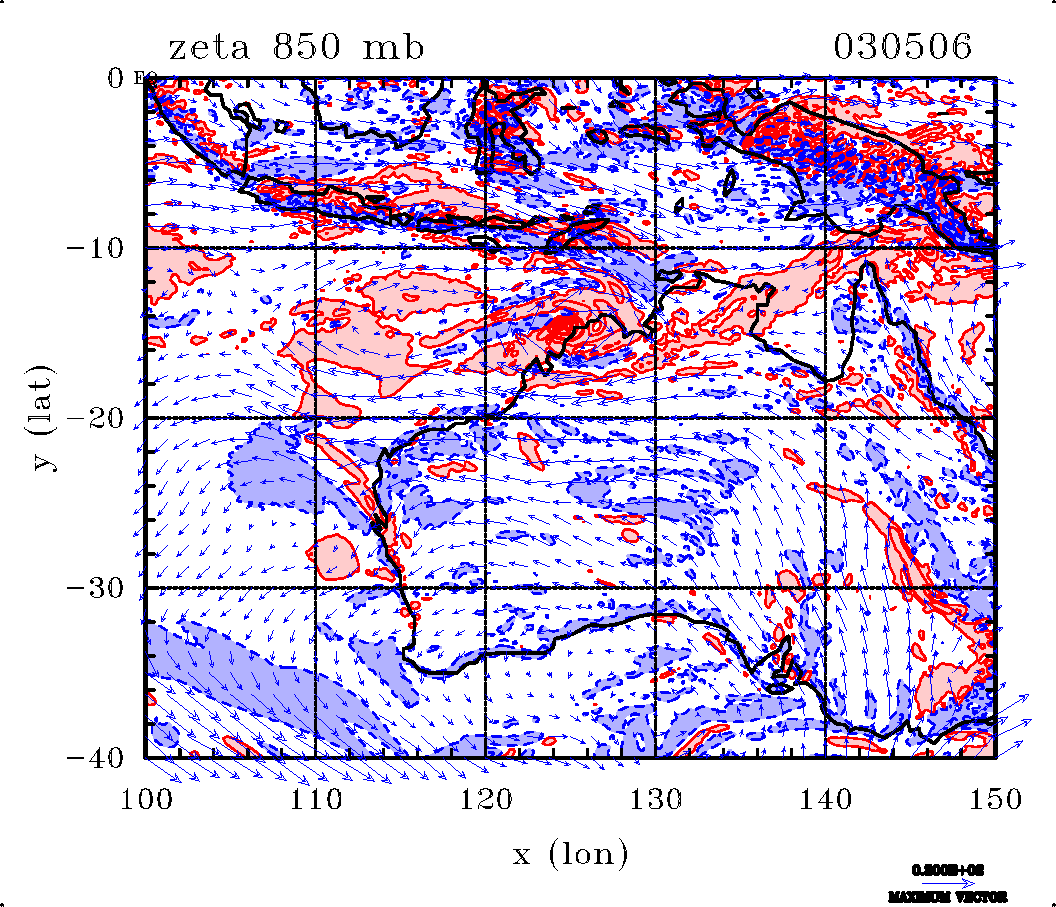
Genesis of TC George February 2007
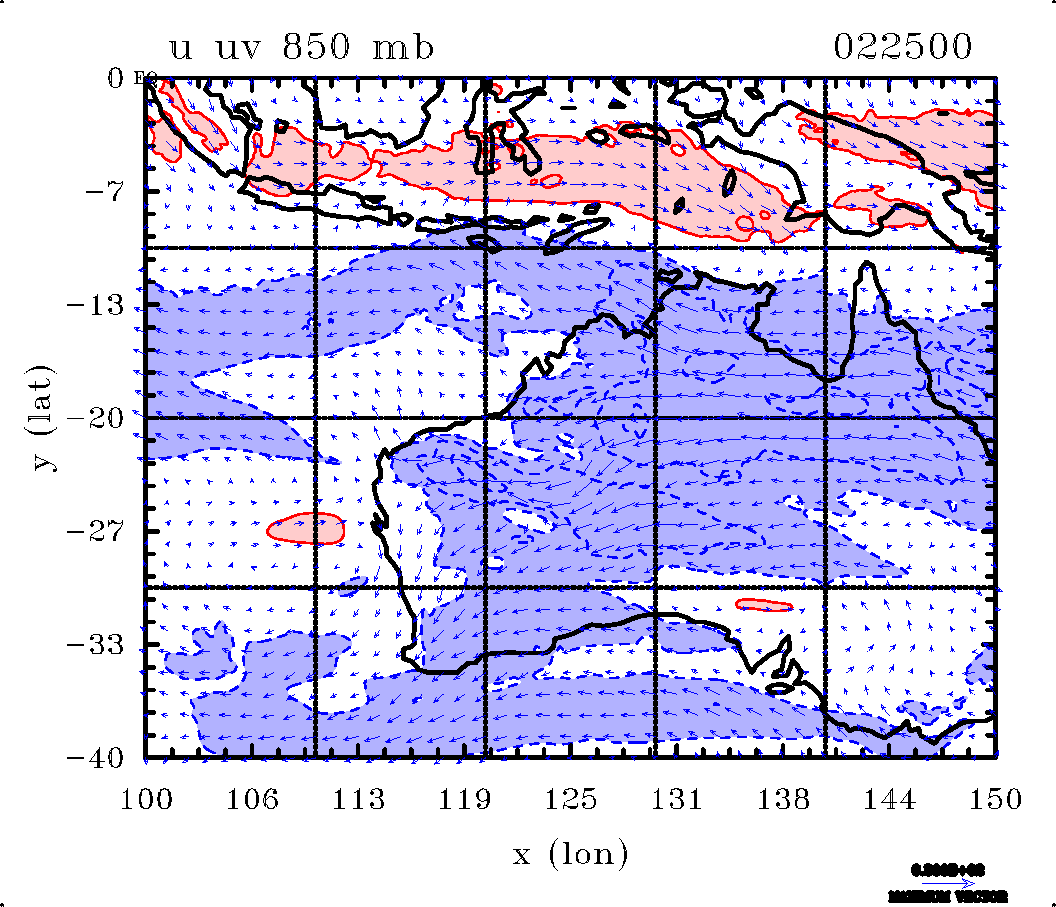
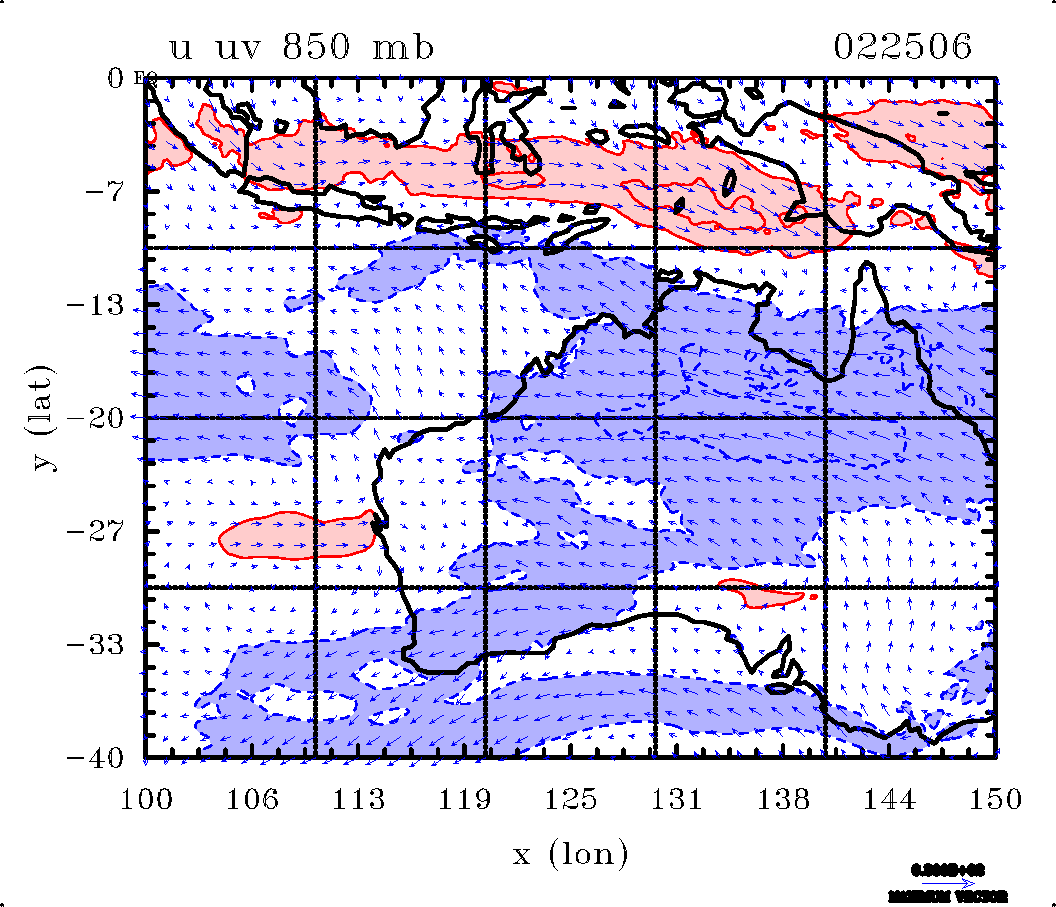
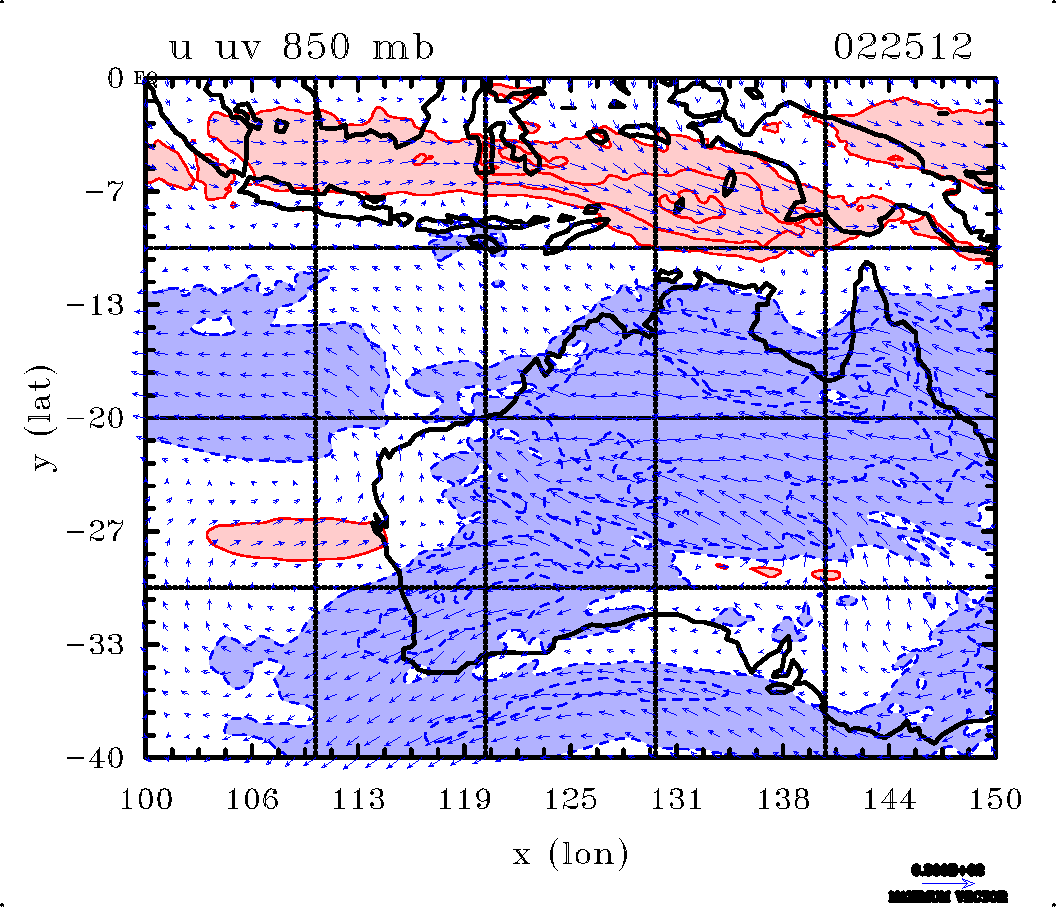
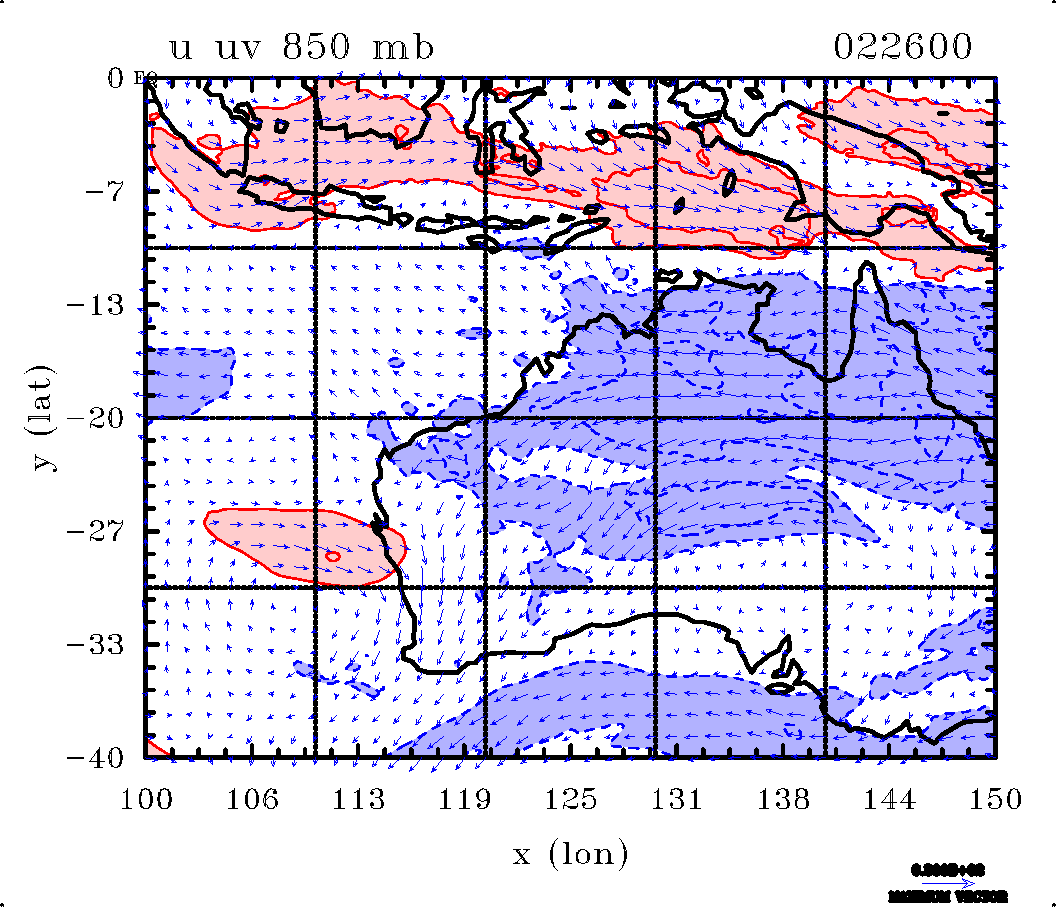
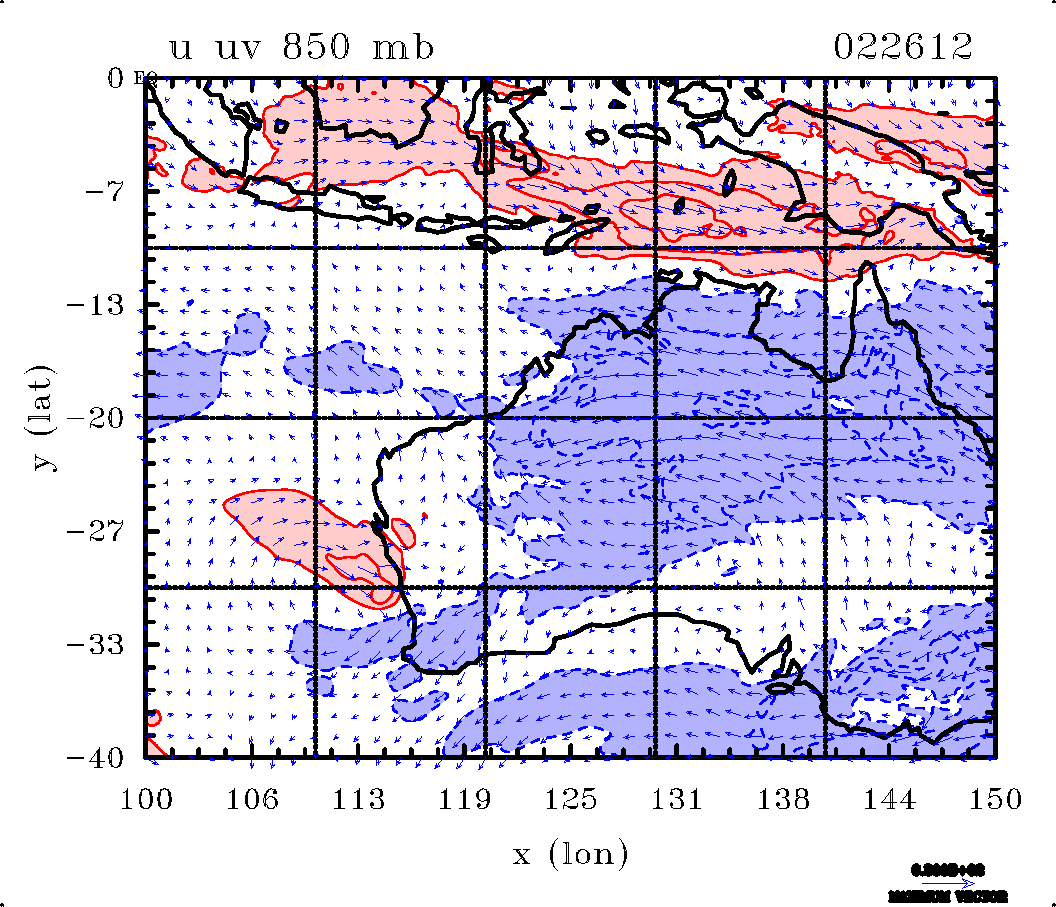
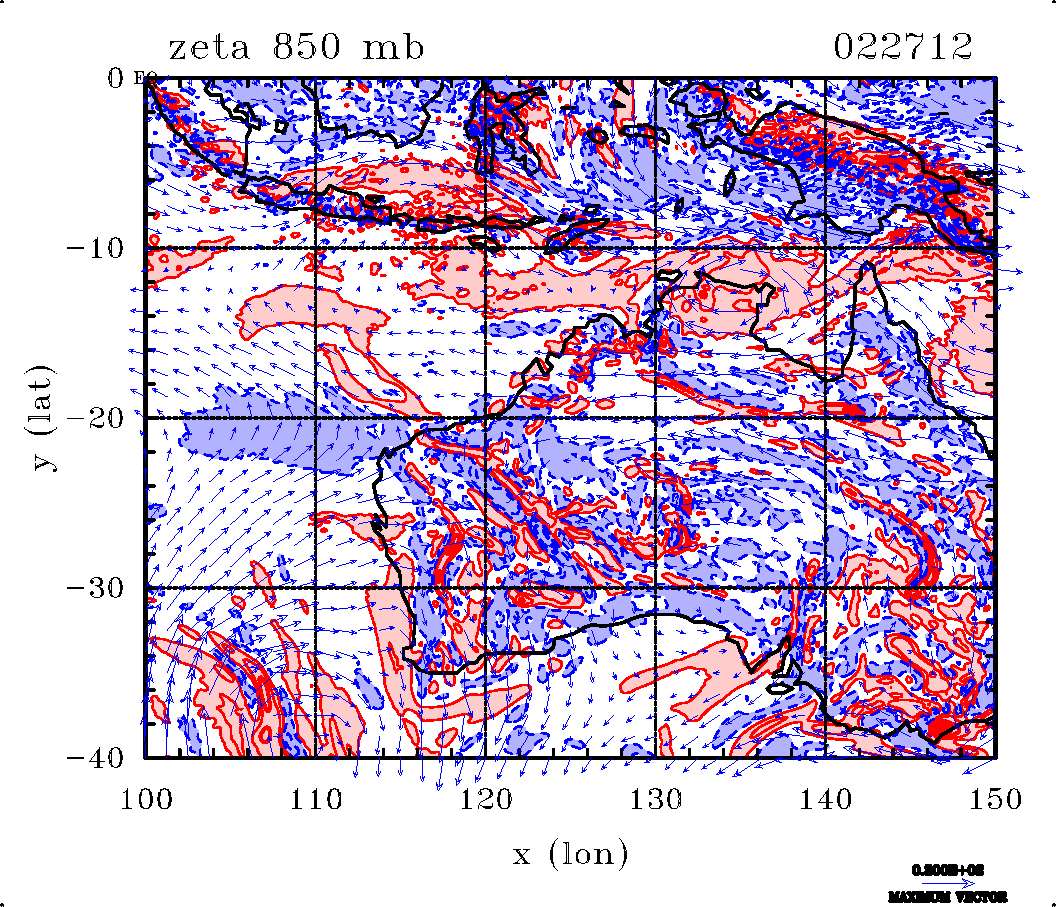
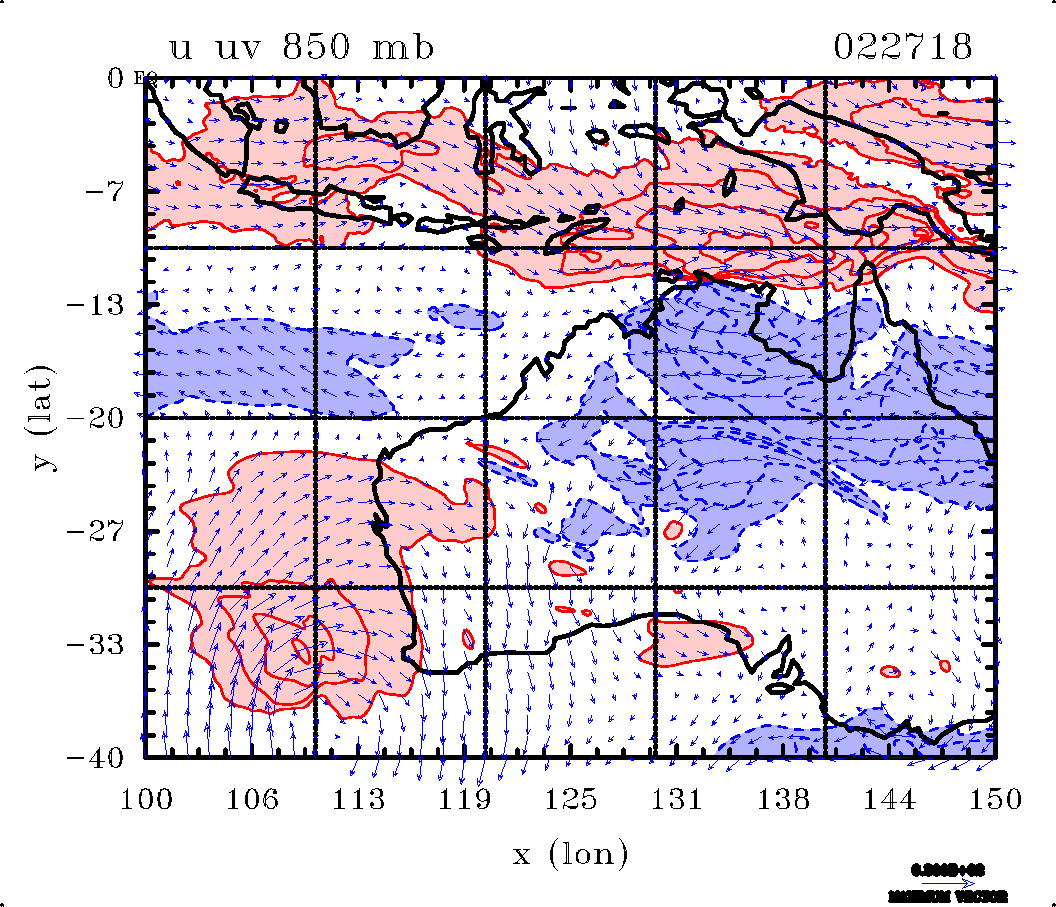
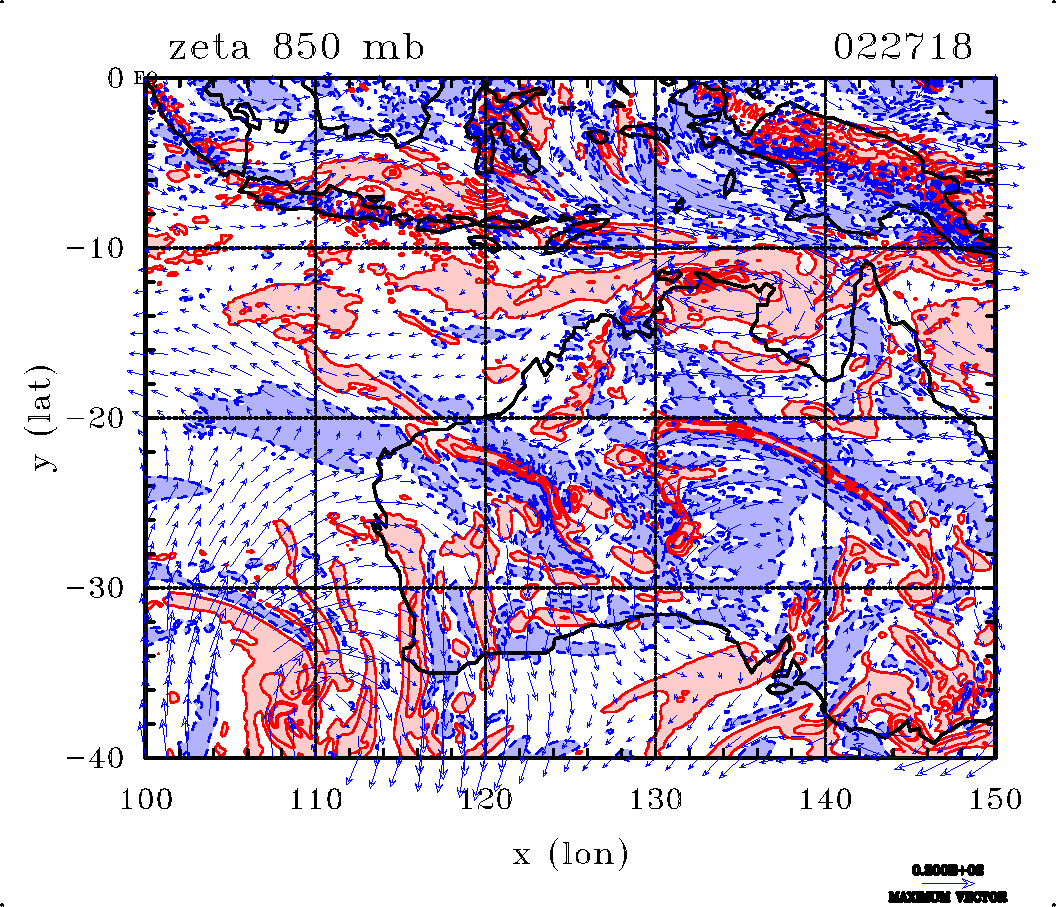
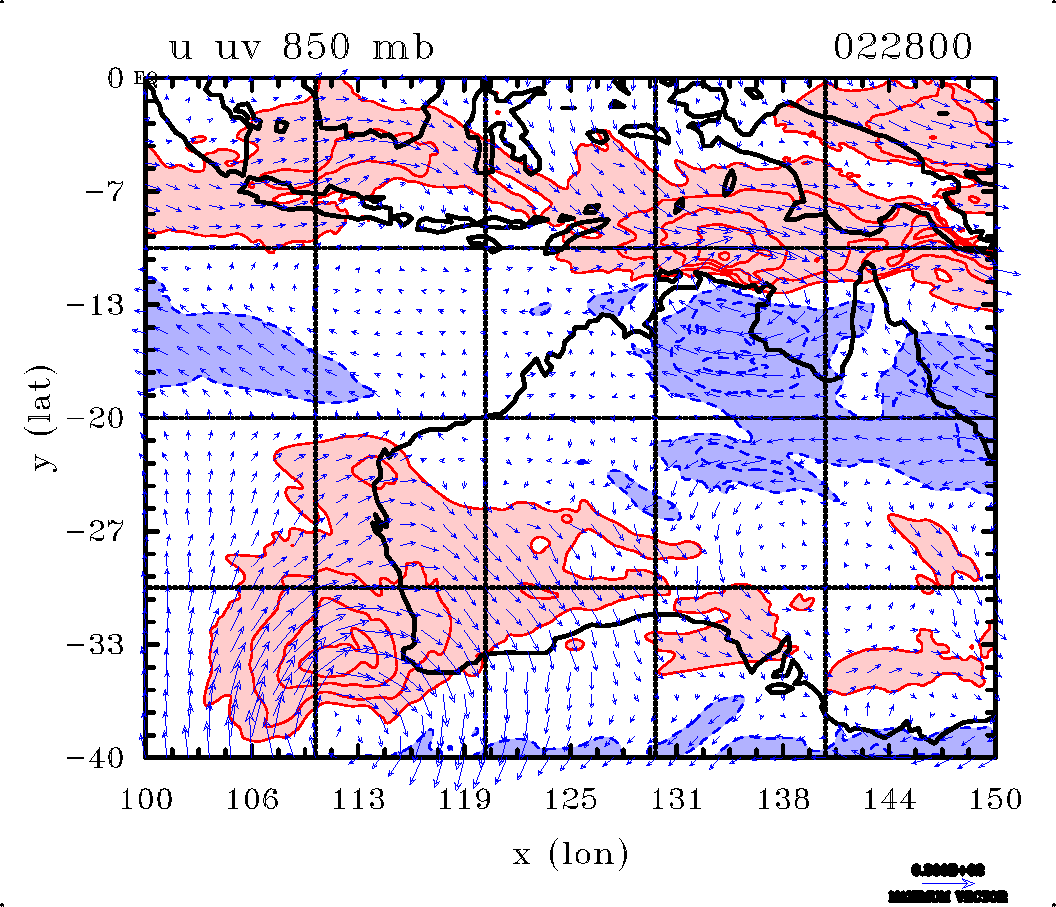
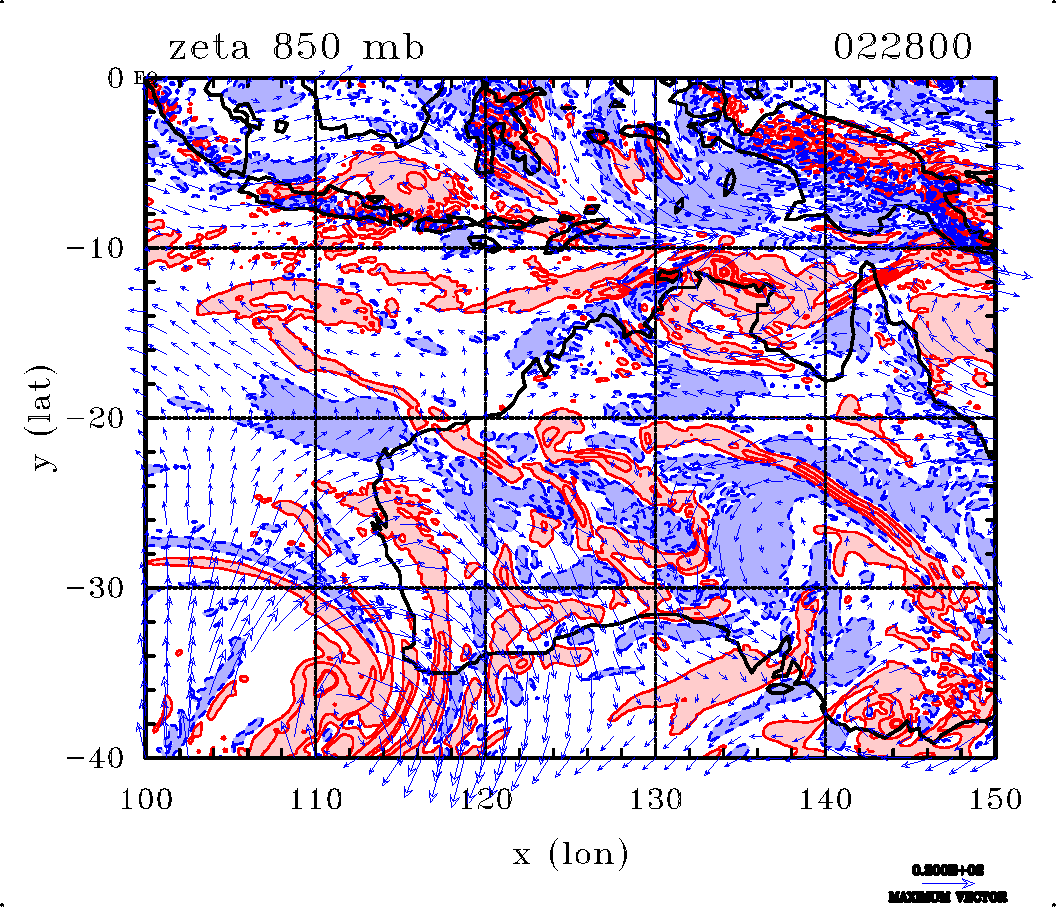
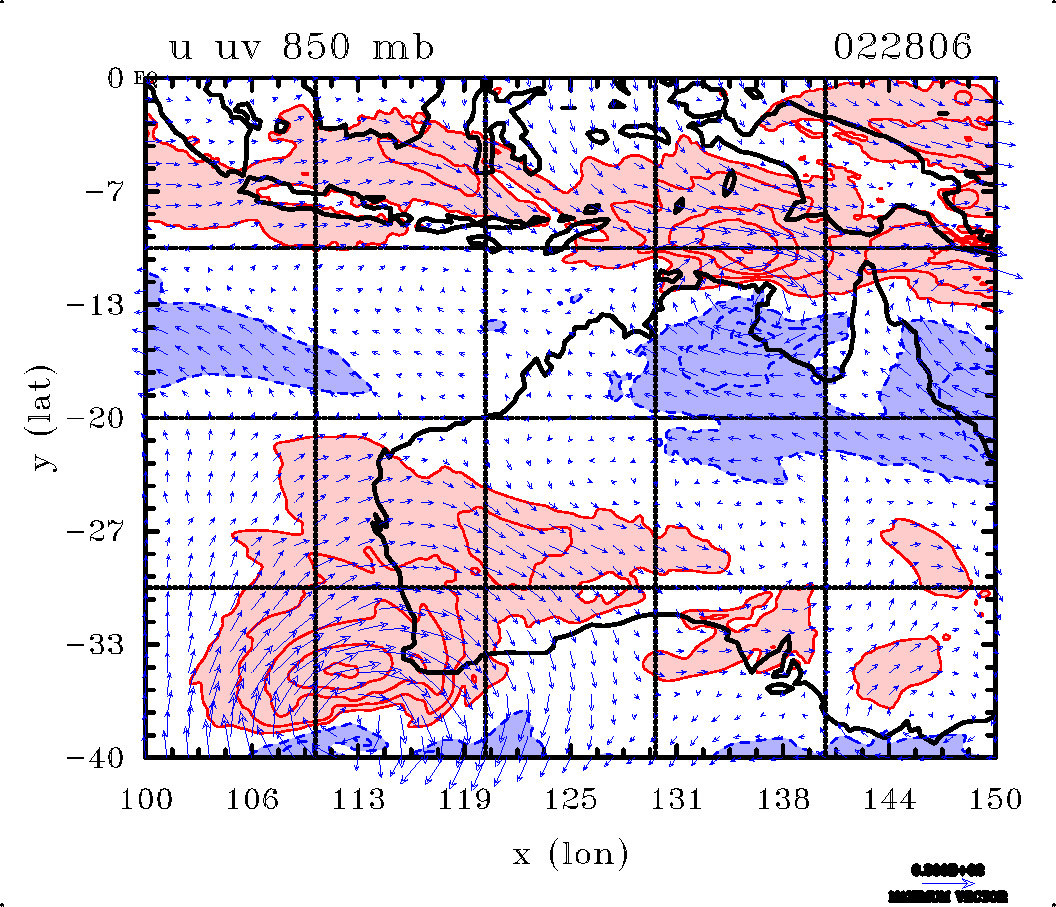
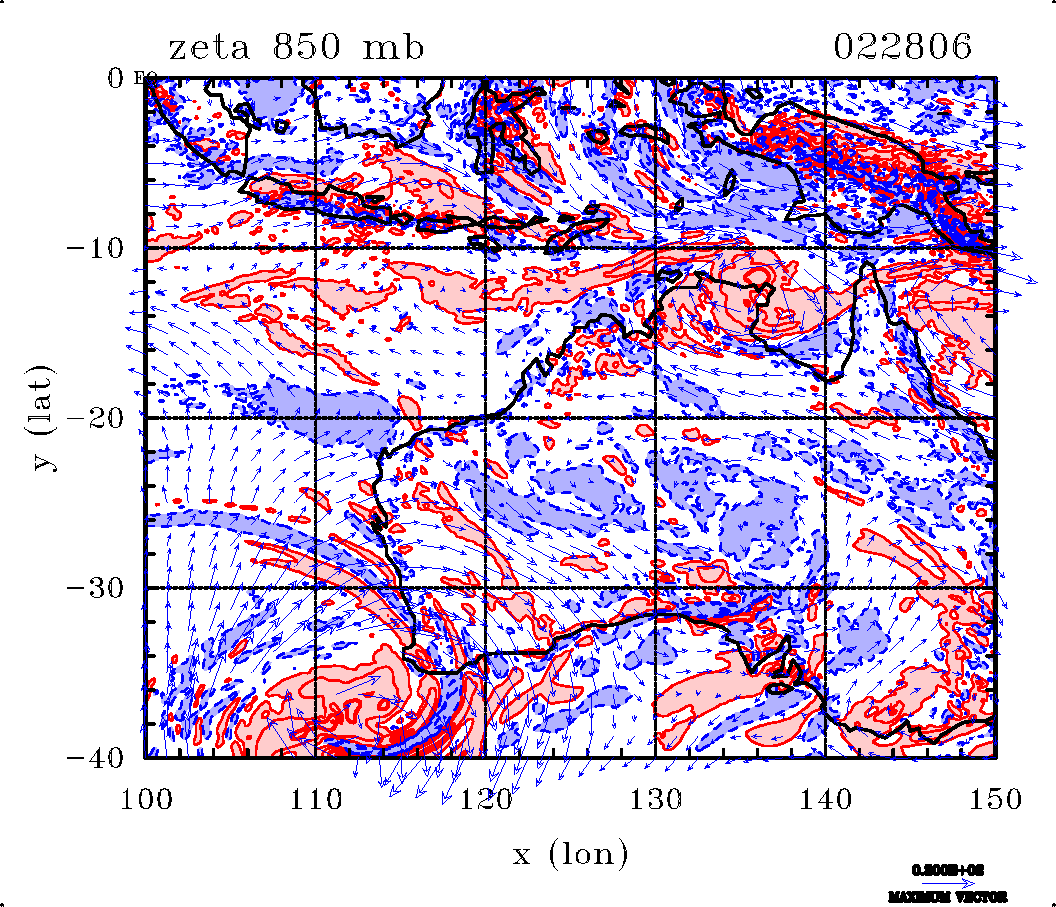
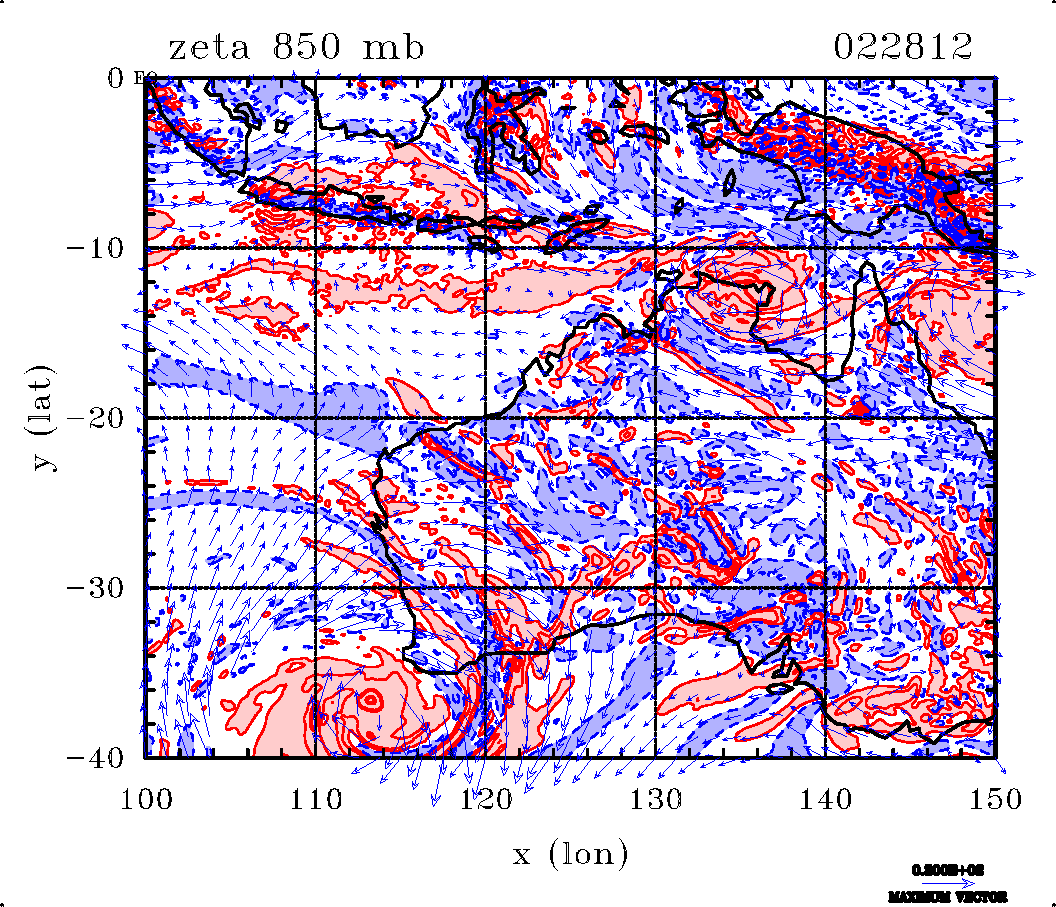
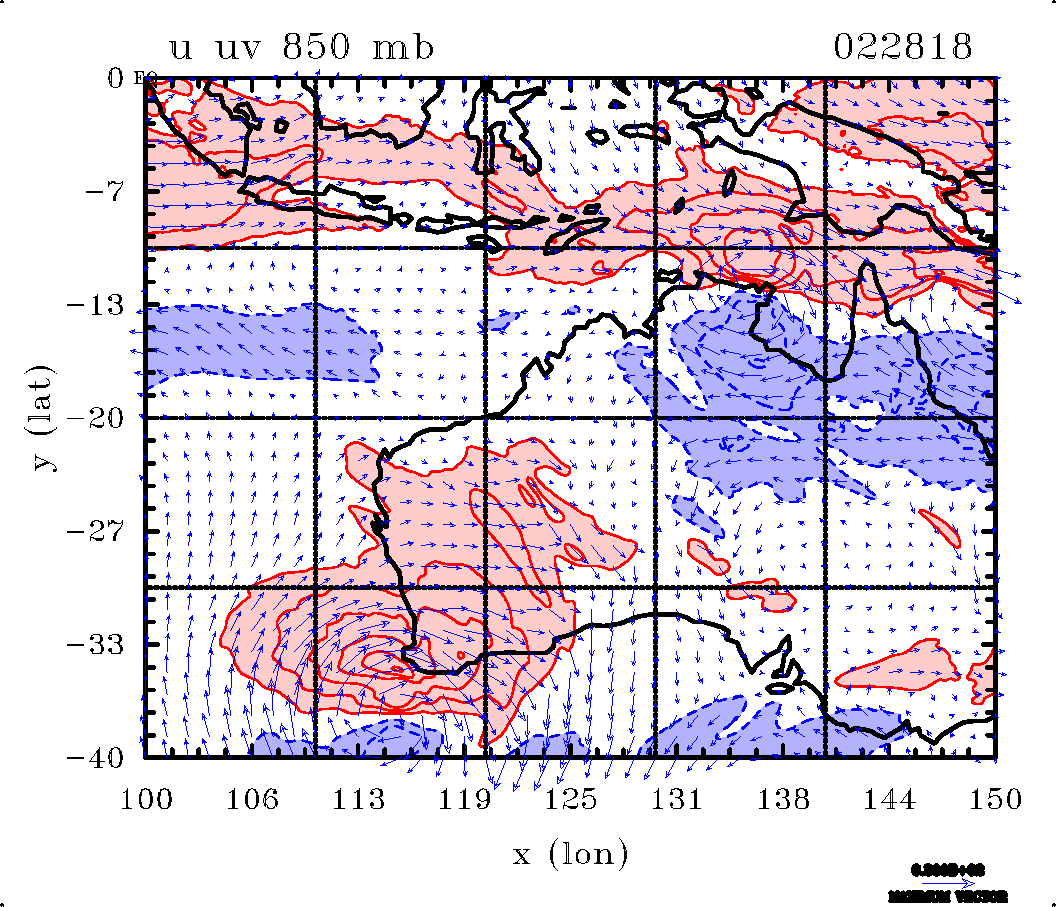
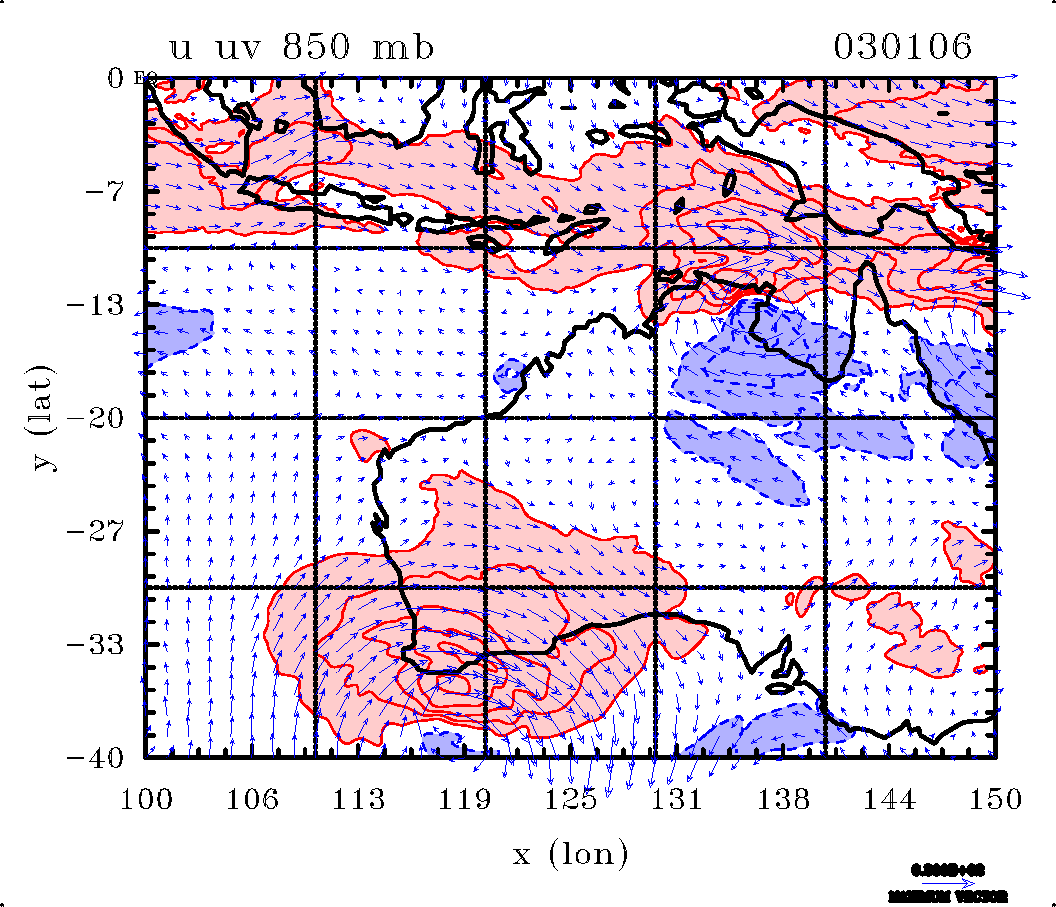
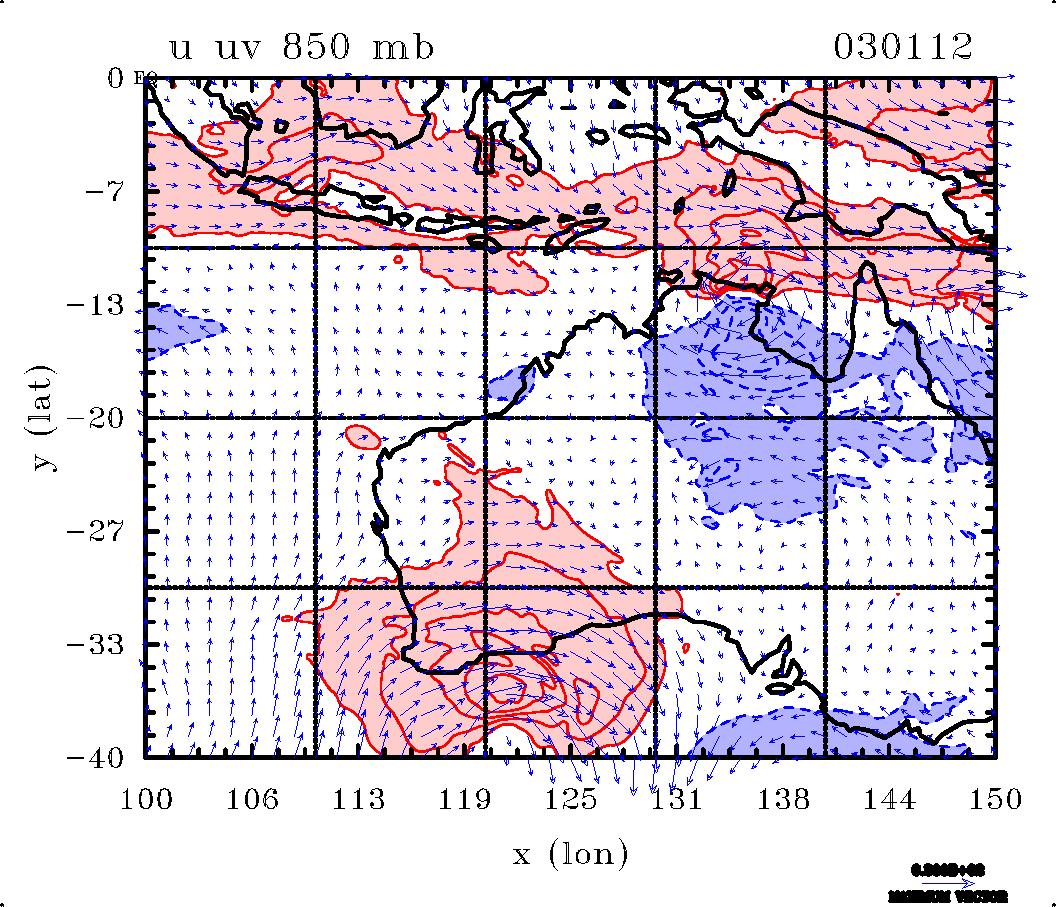
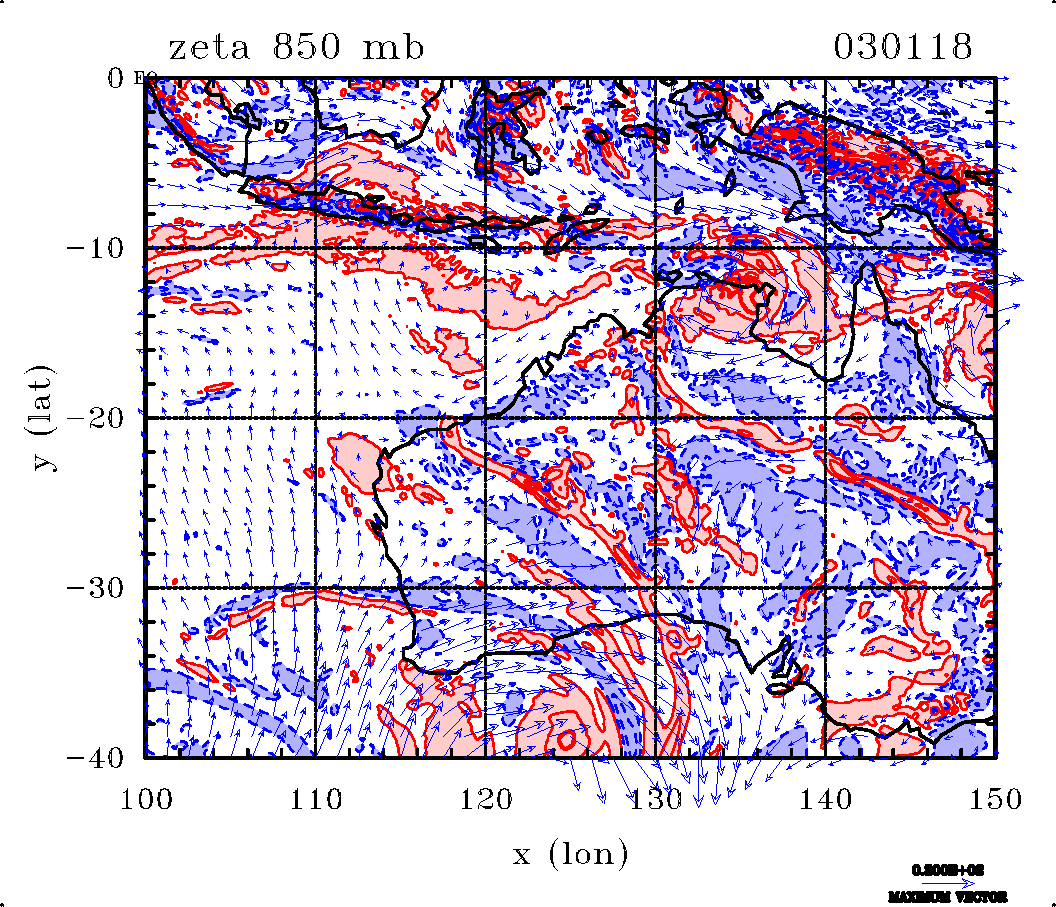
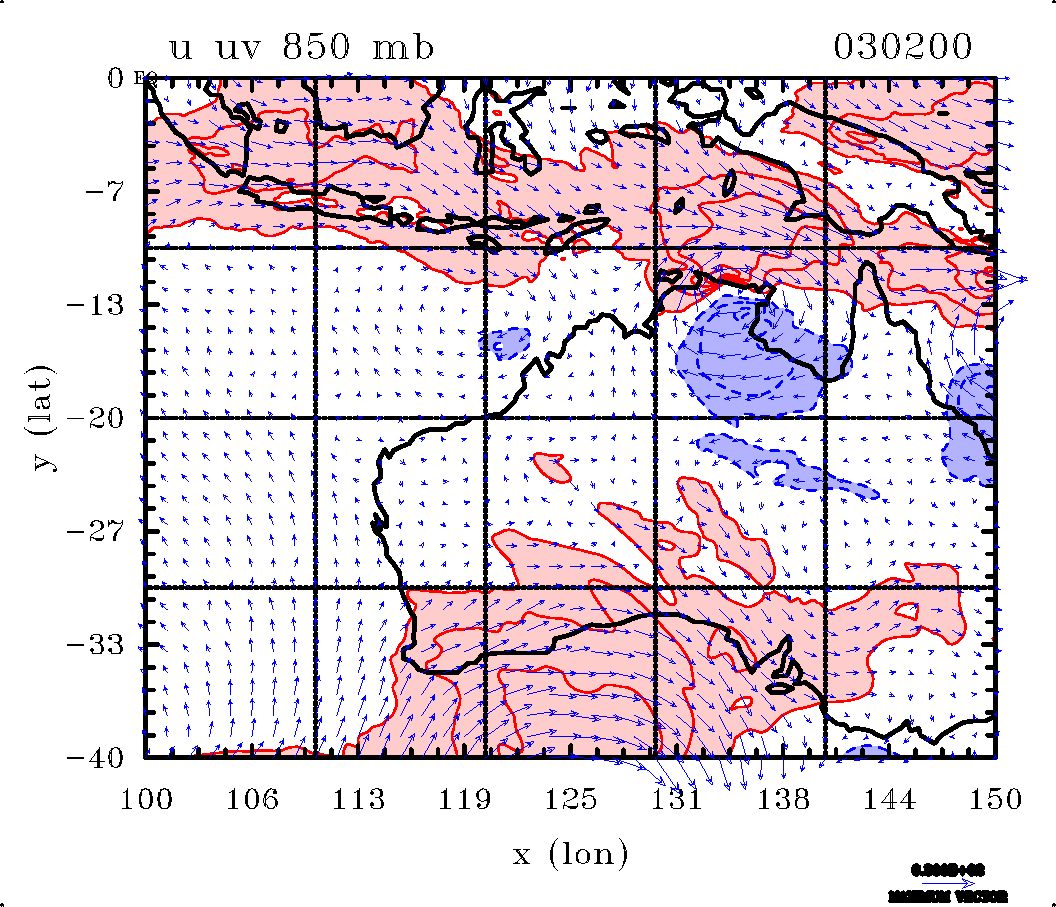
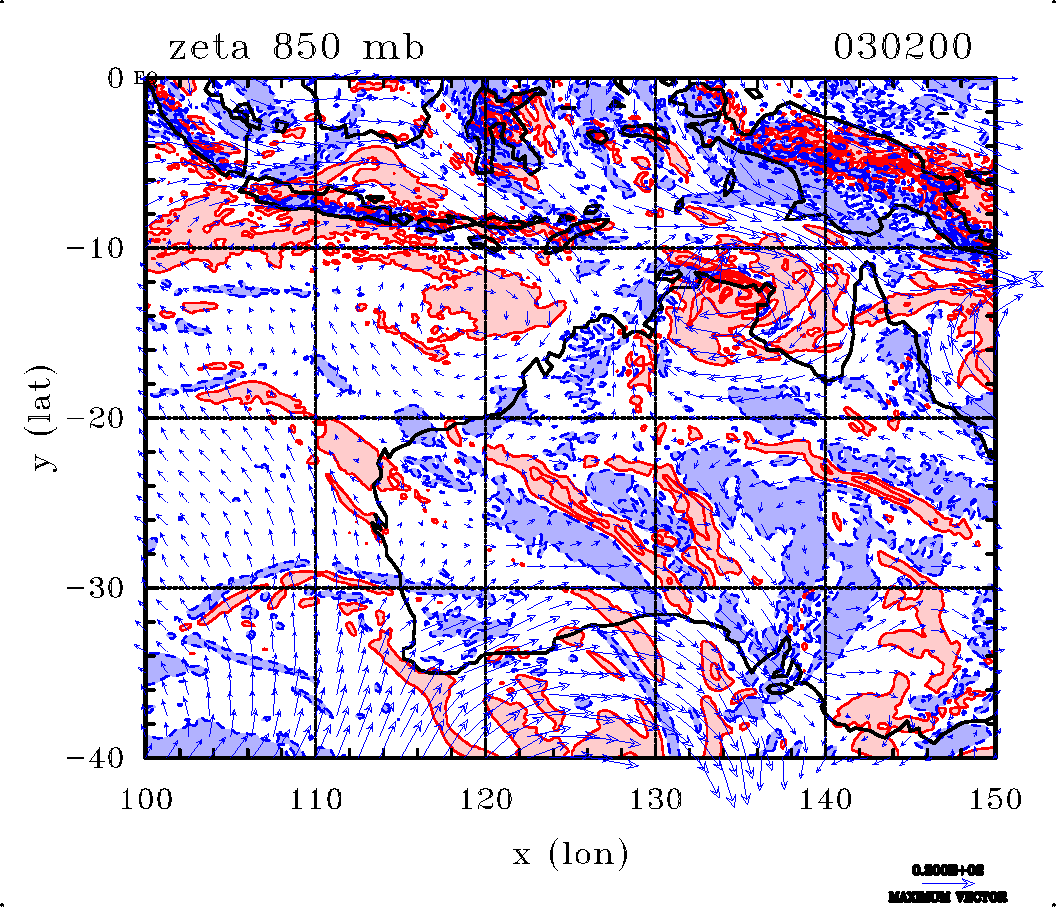
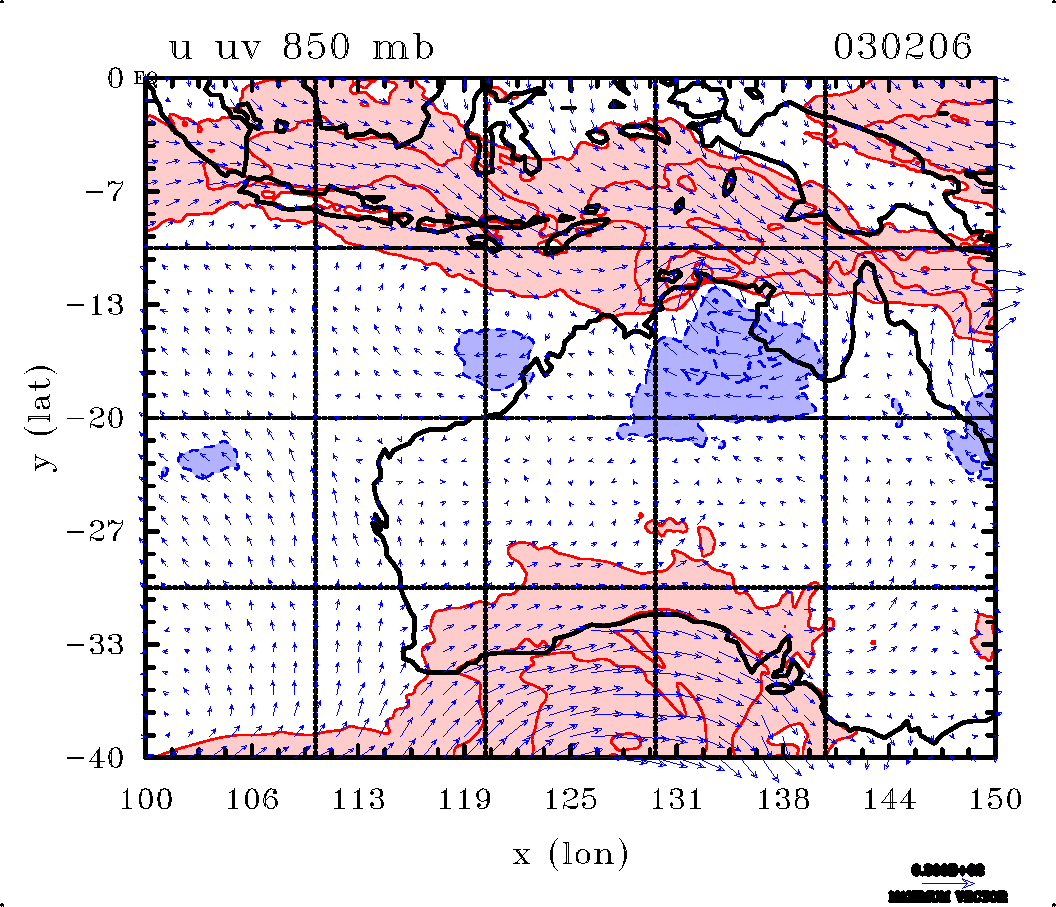
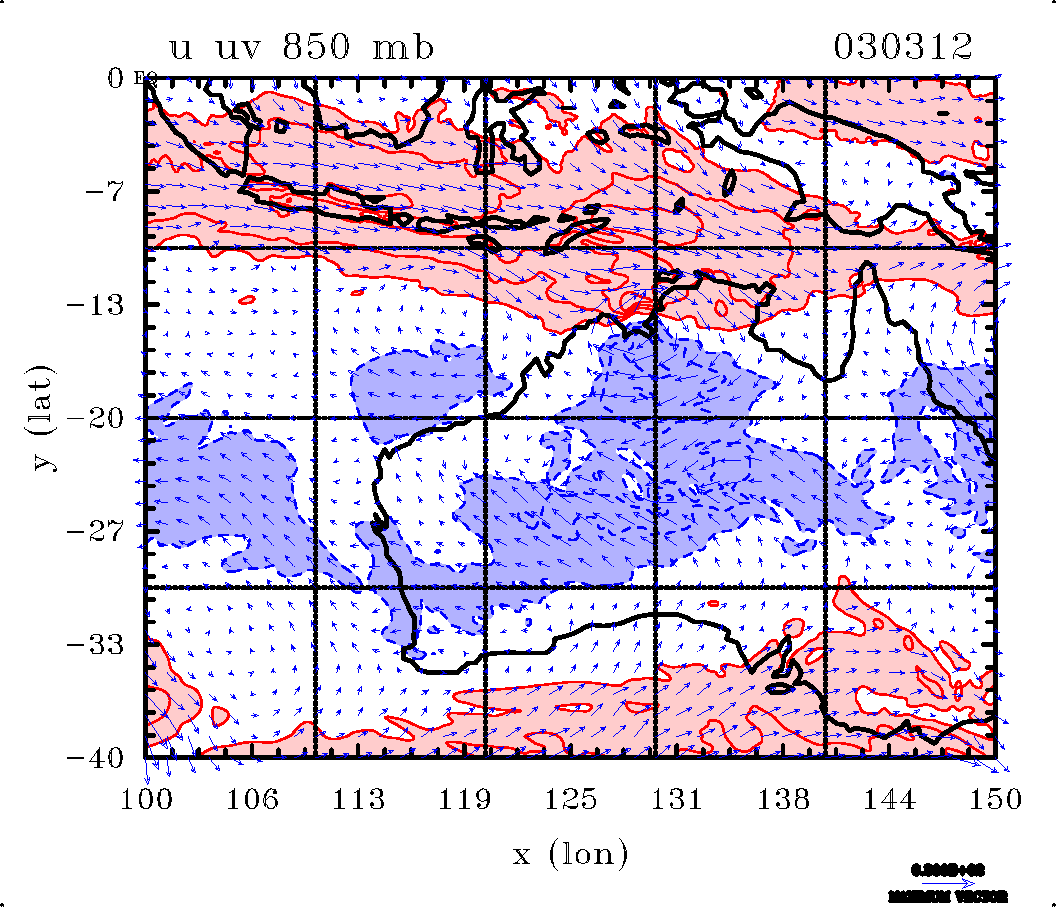
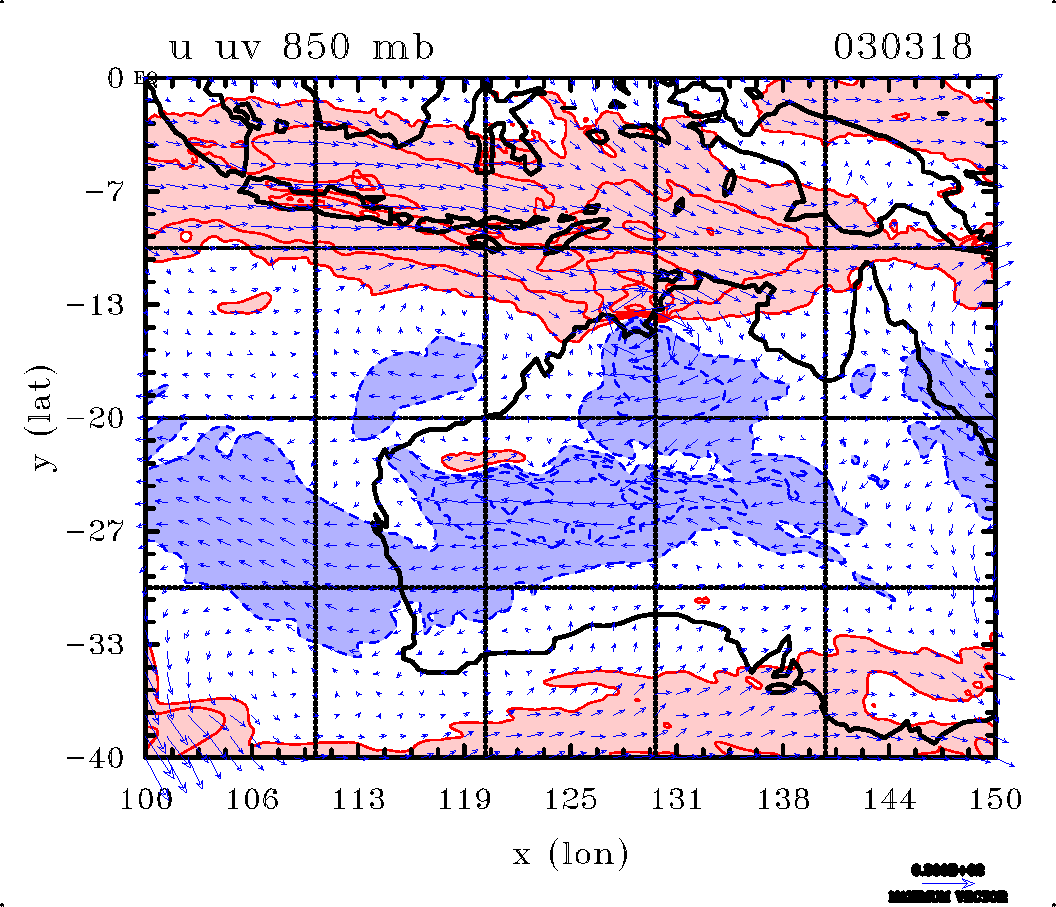
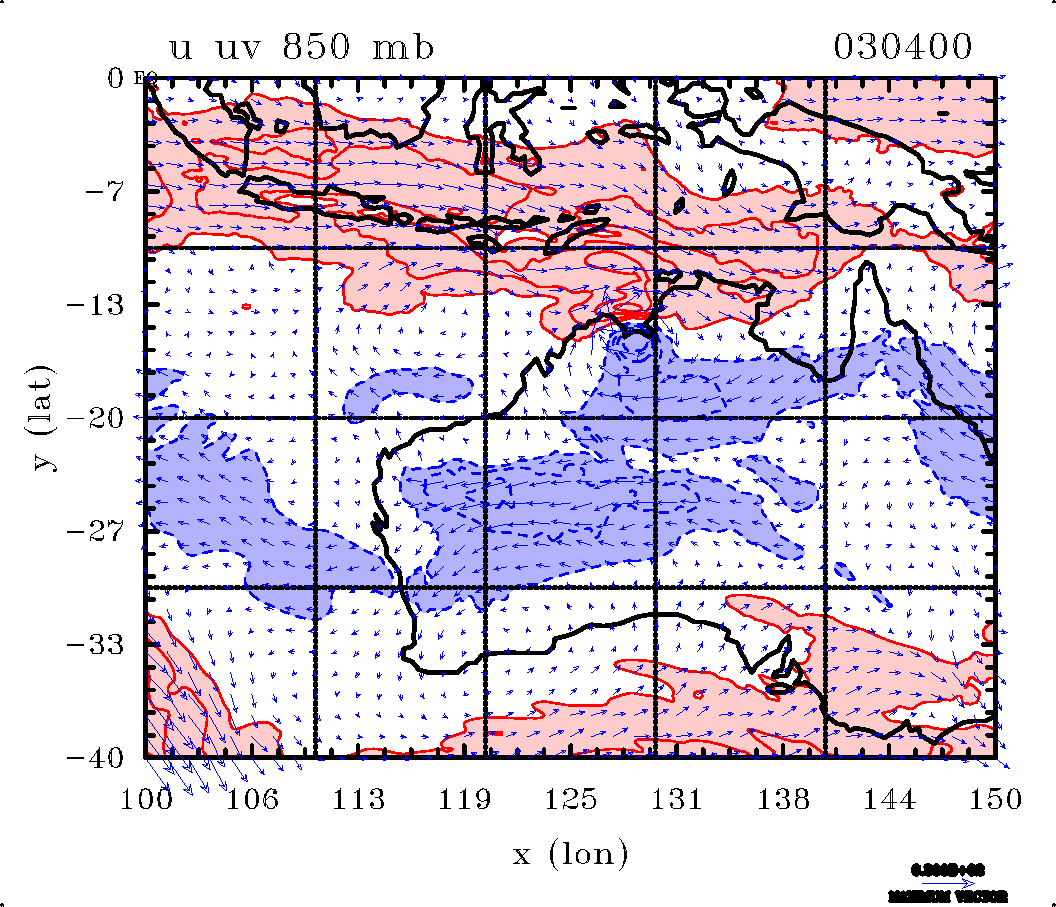
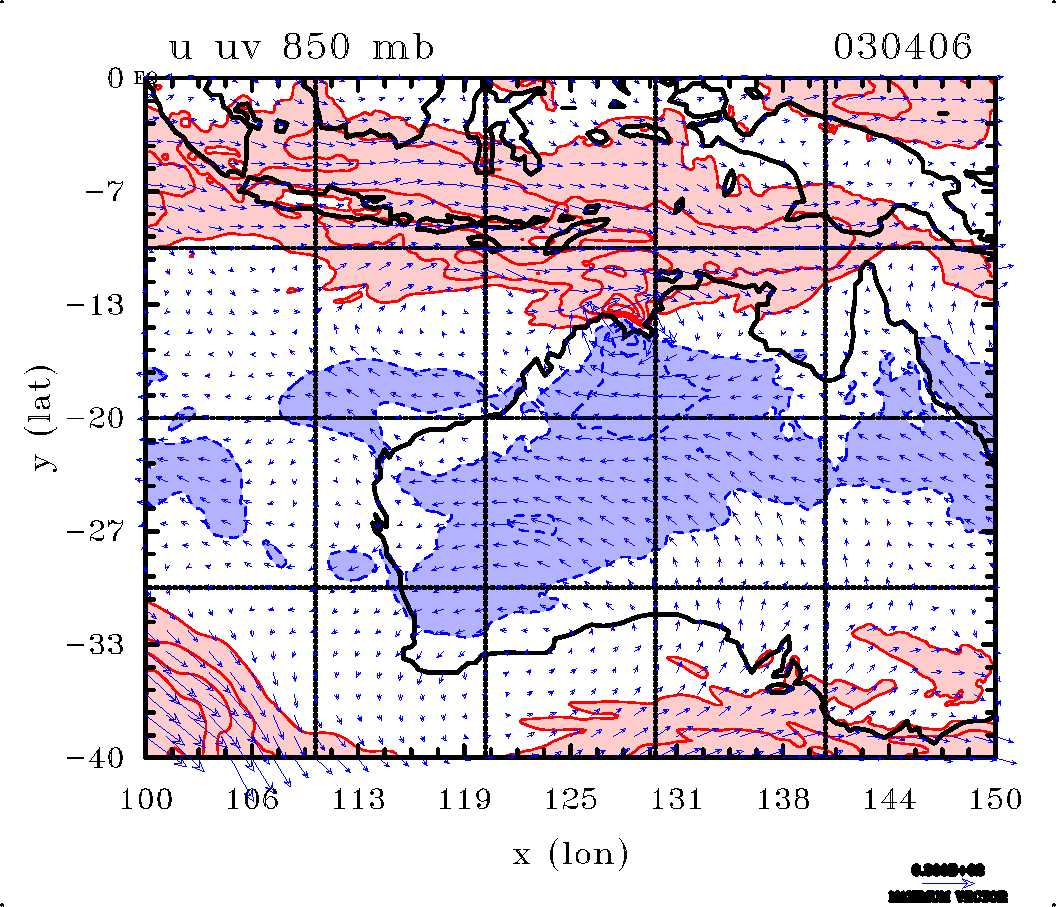
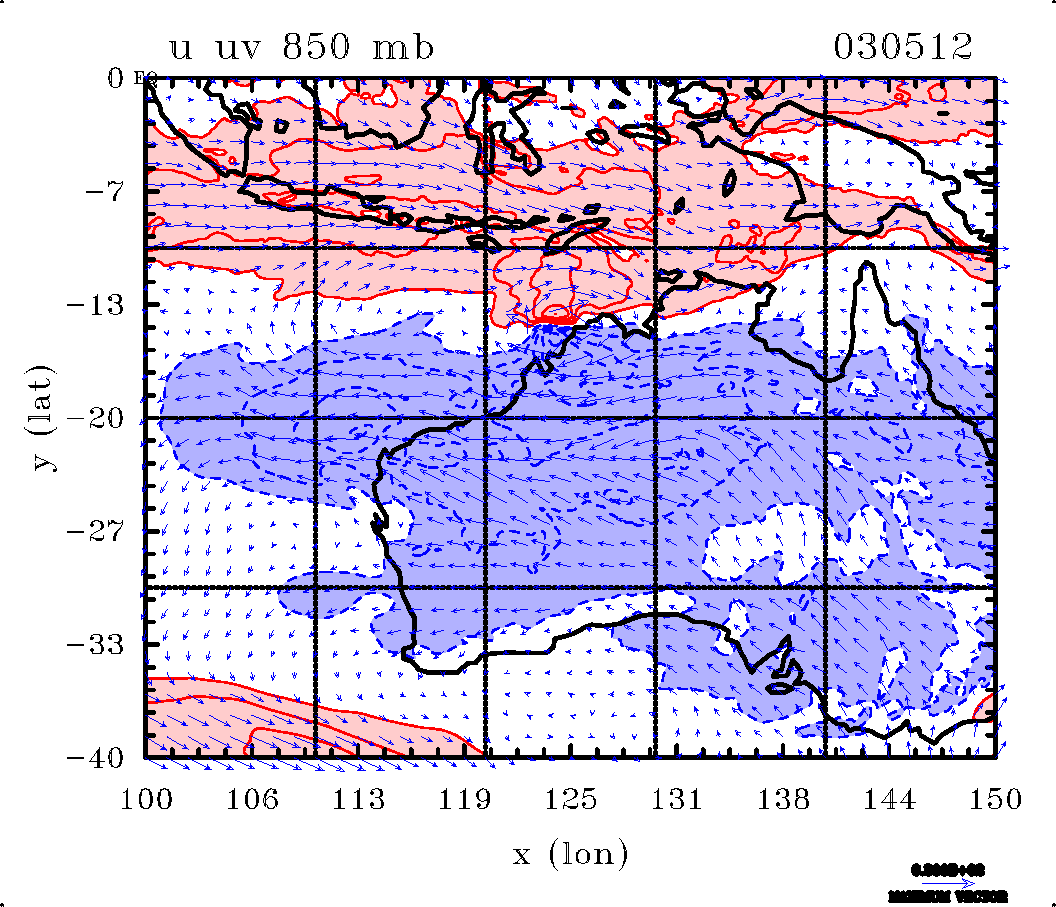
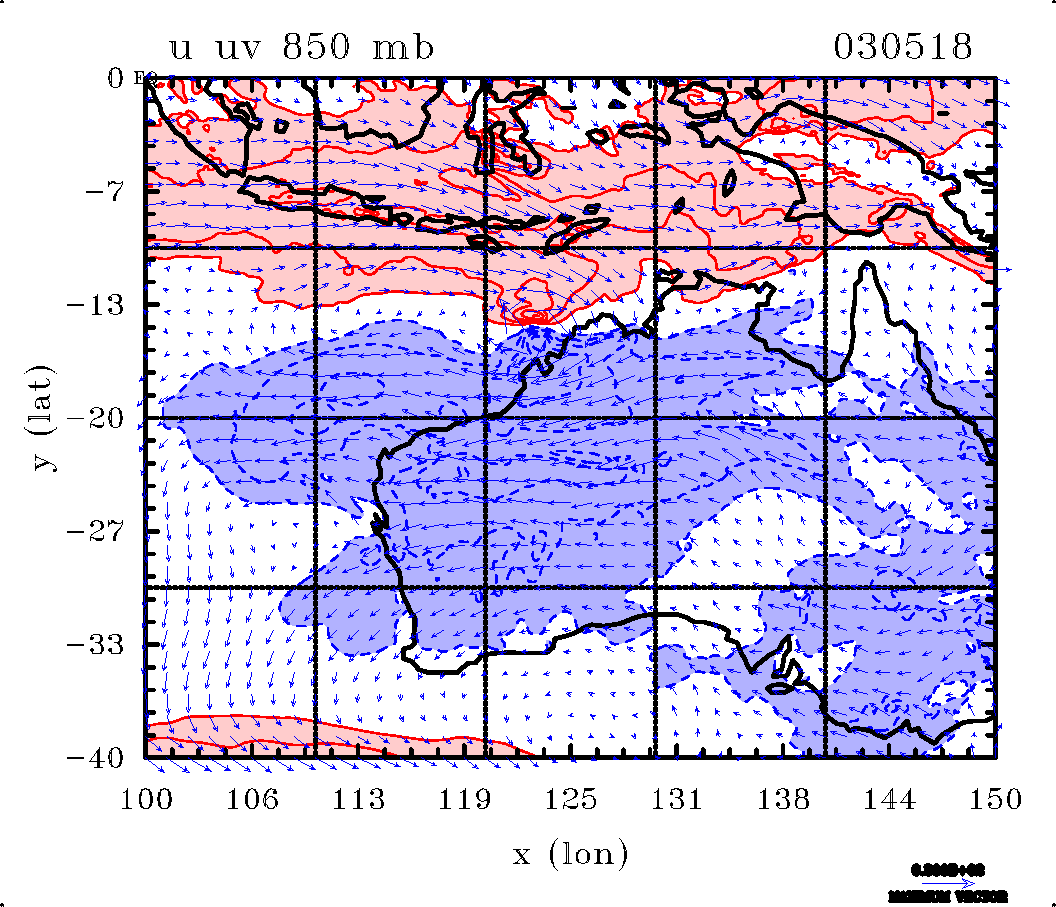
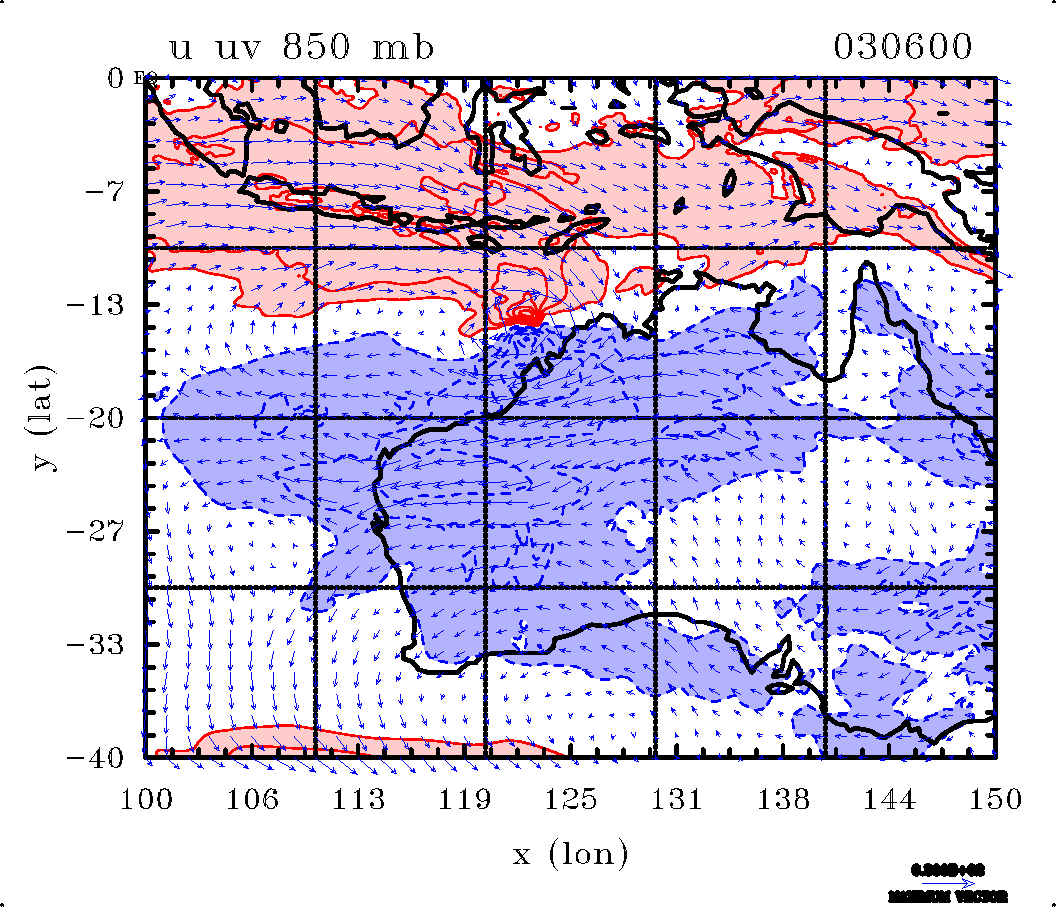
Wind vectors and contours of zonal wind at 850 mb
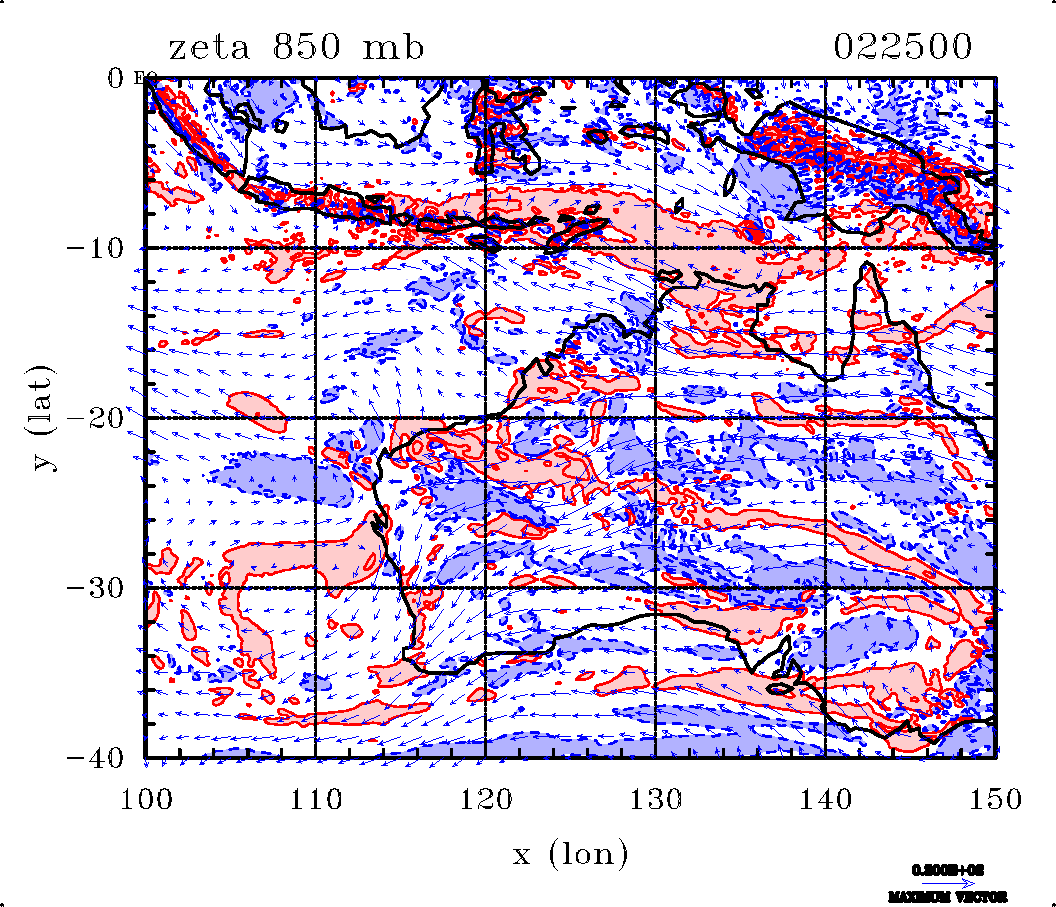
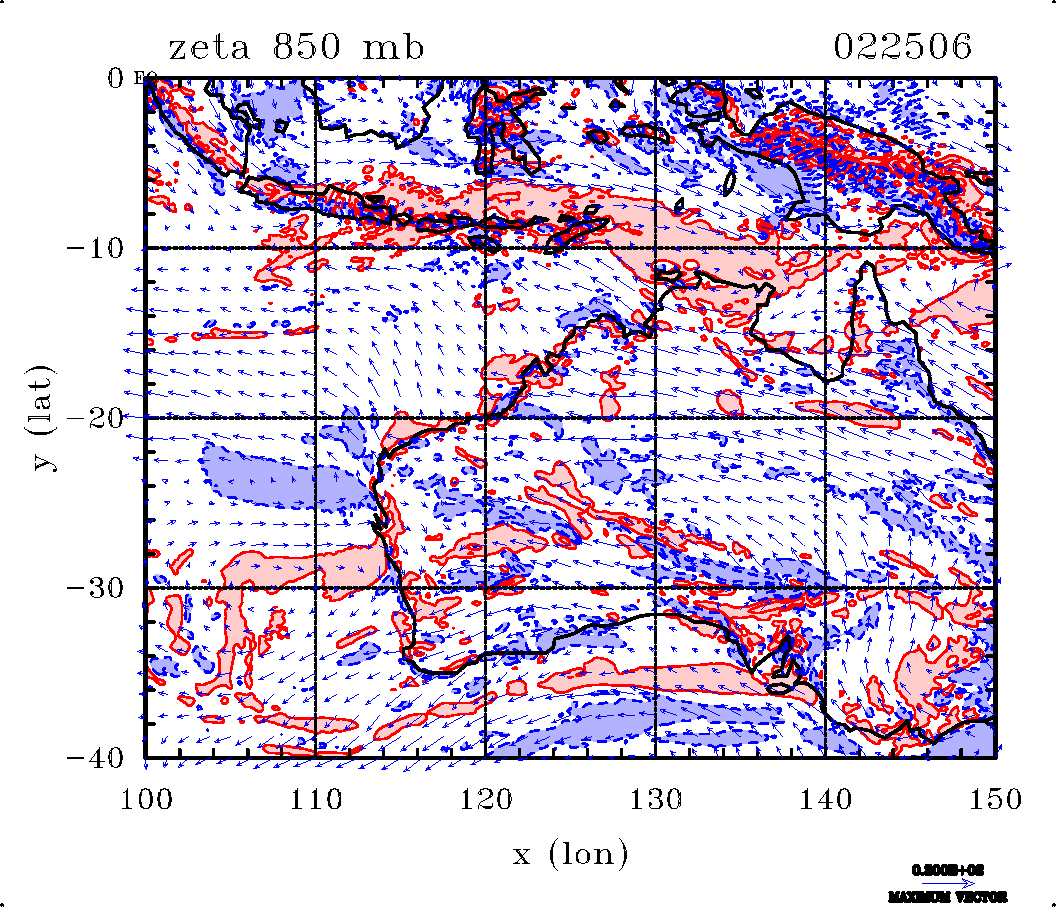
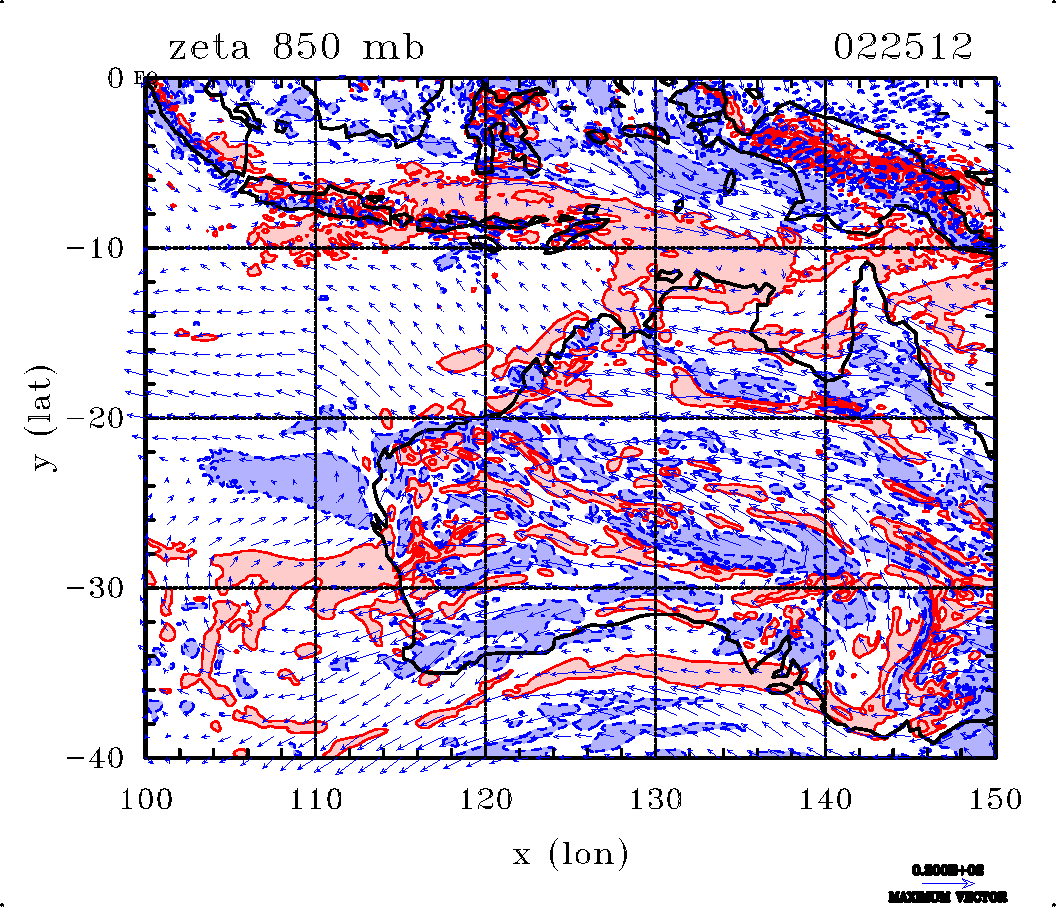
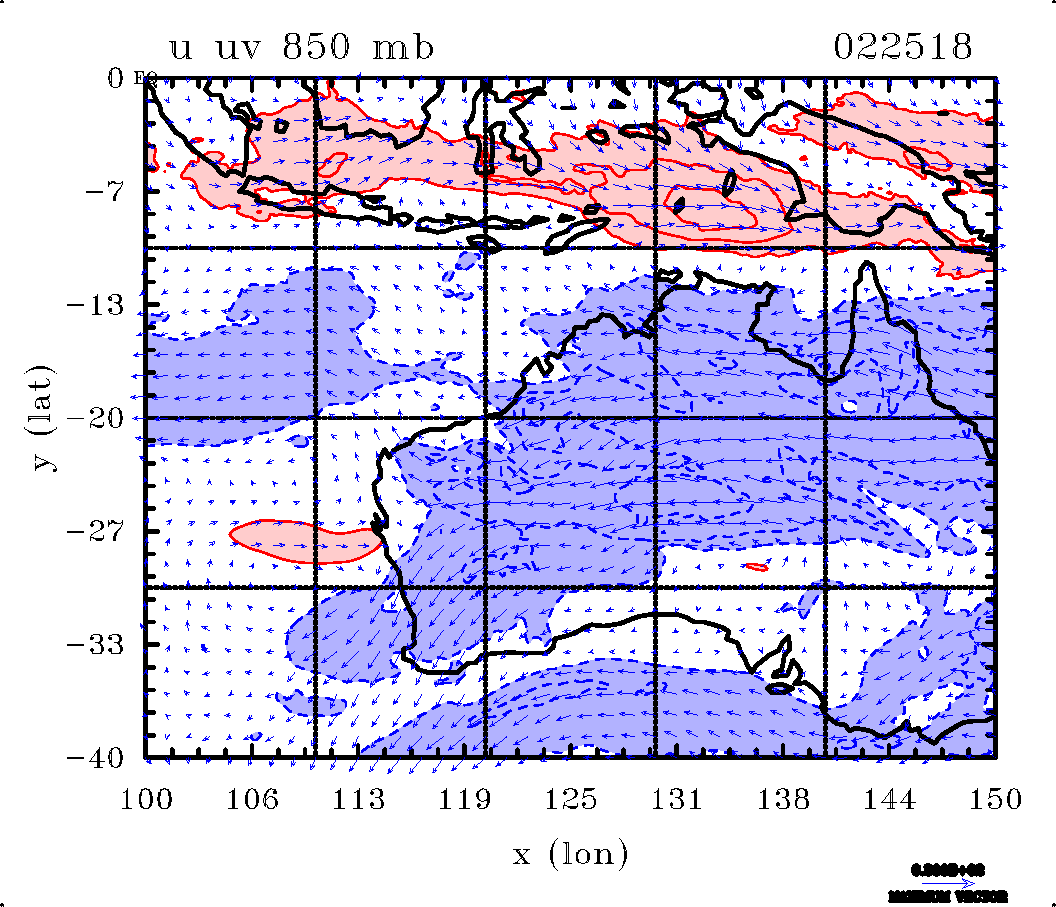
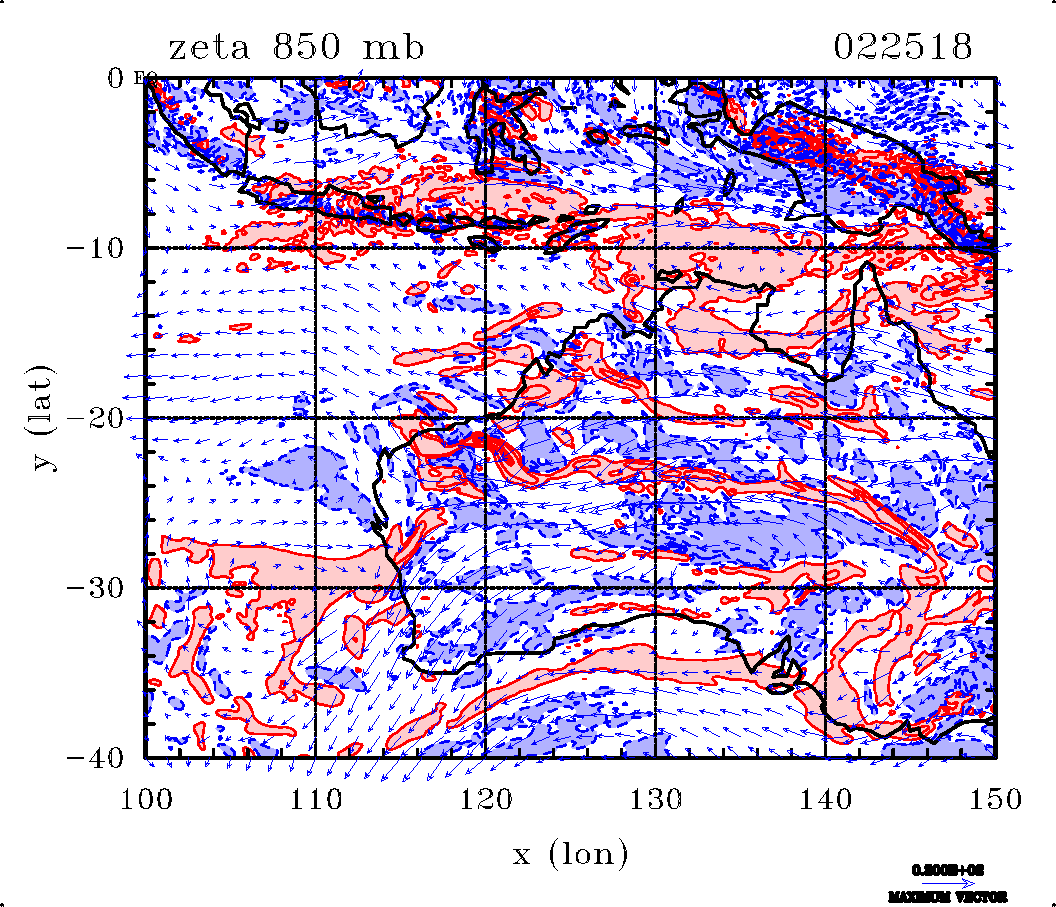
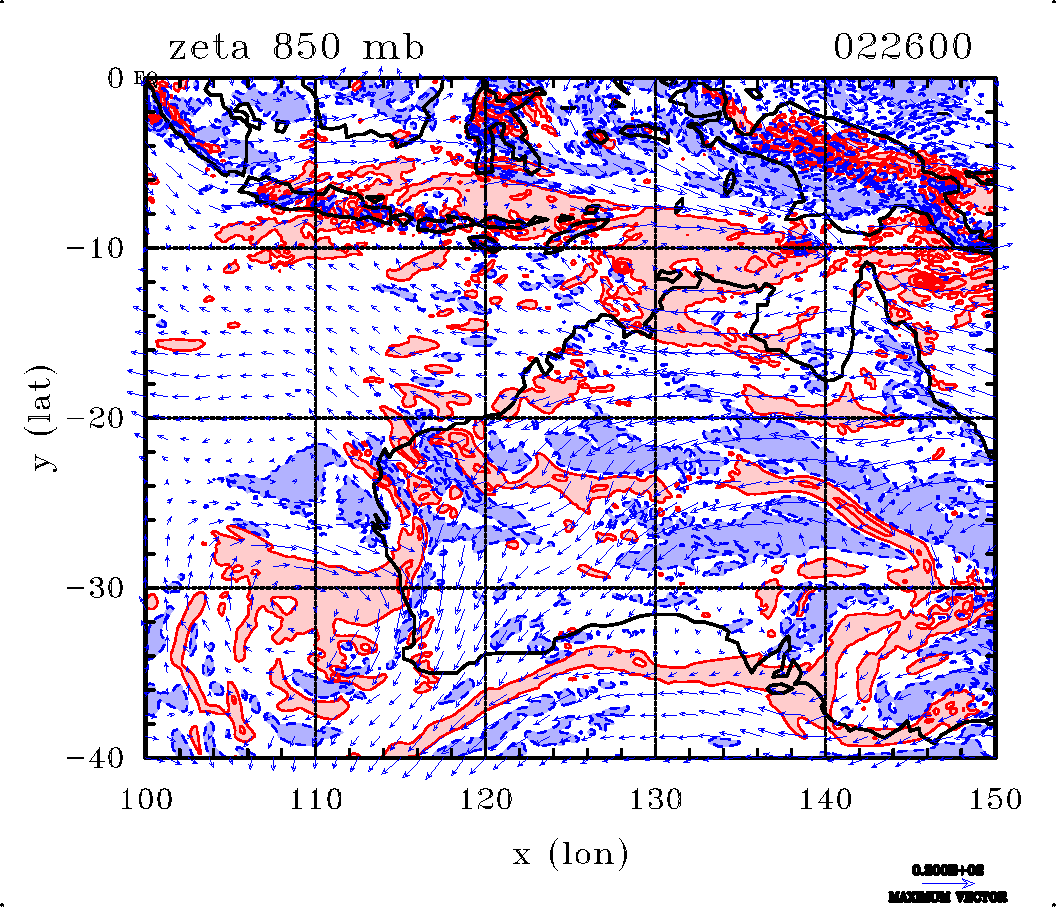
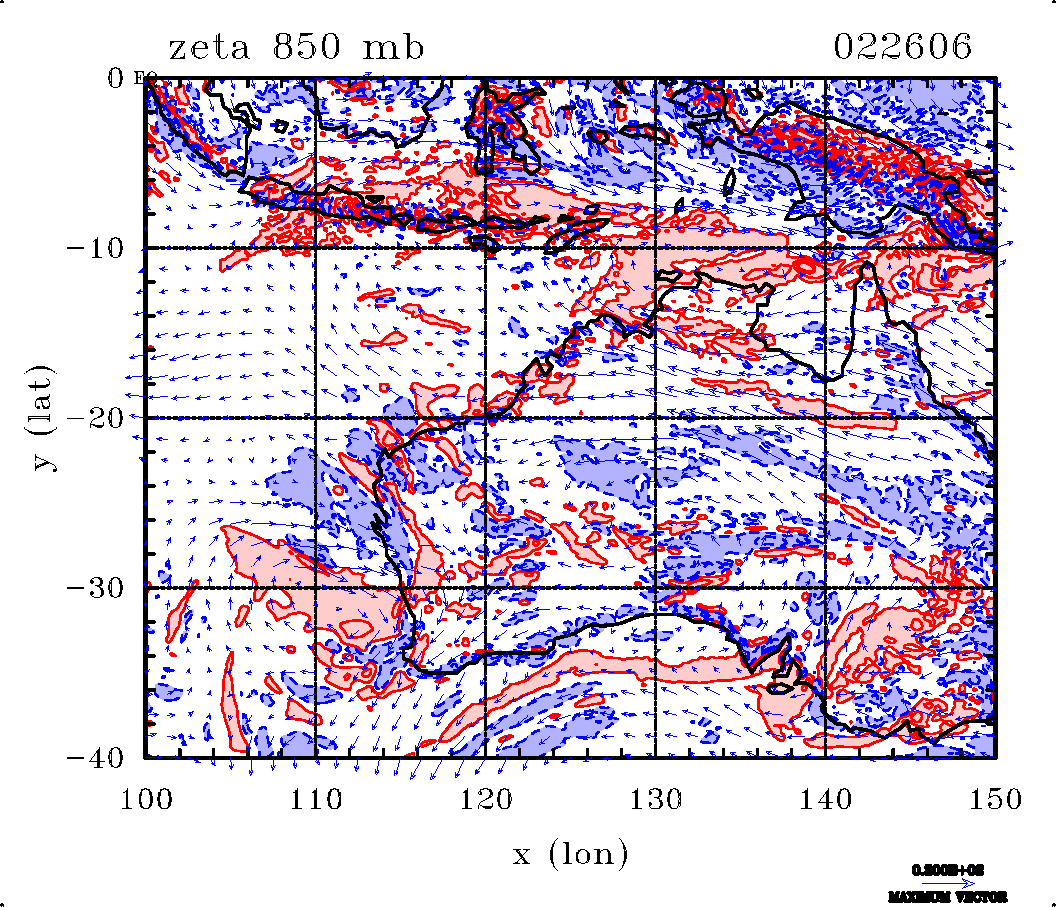
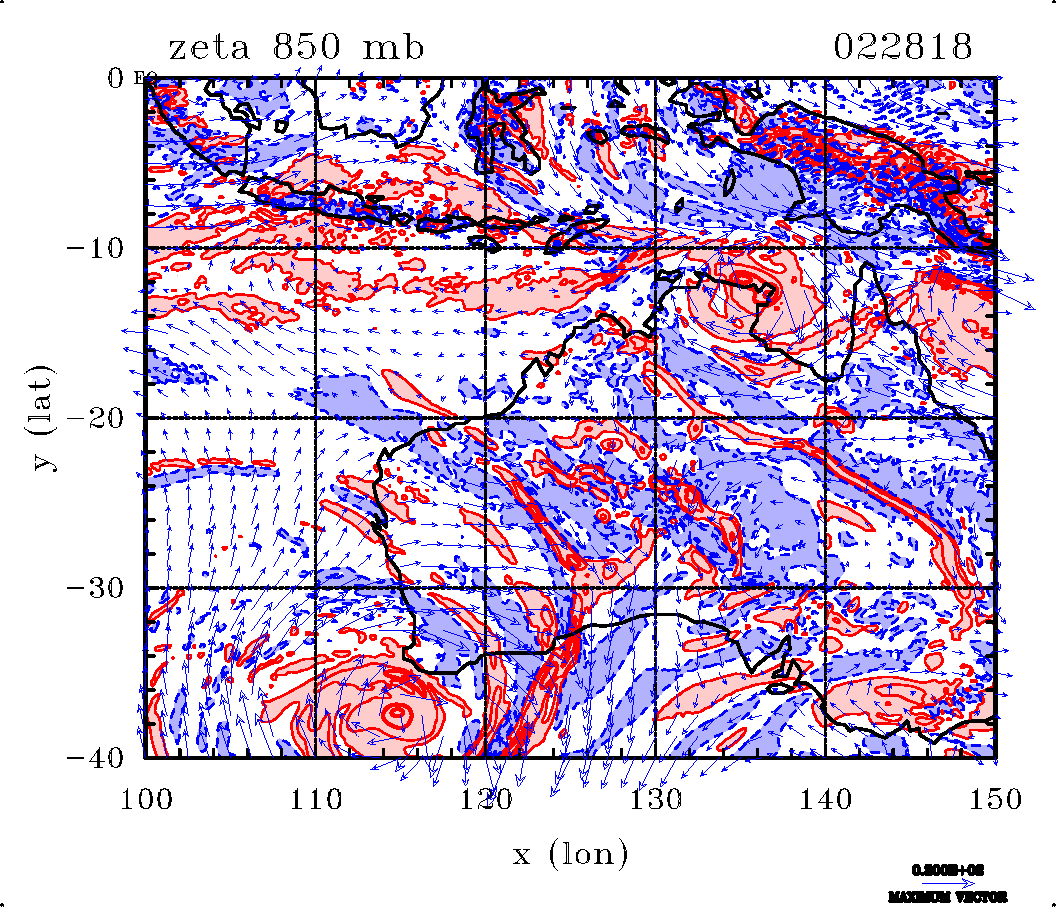
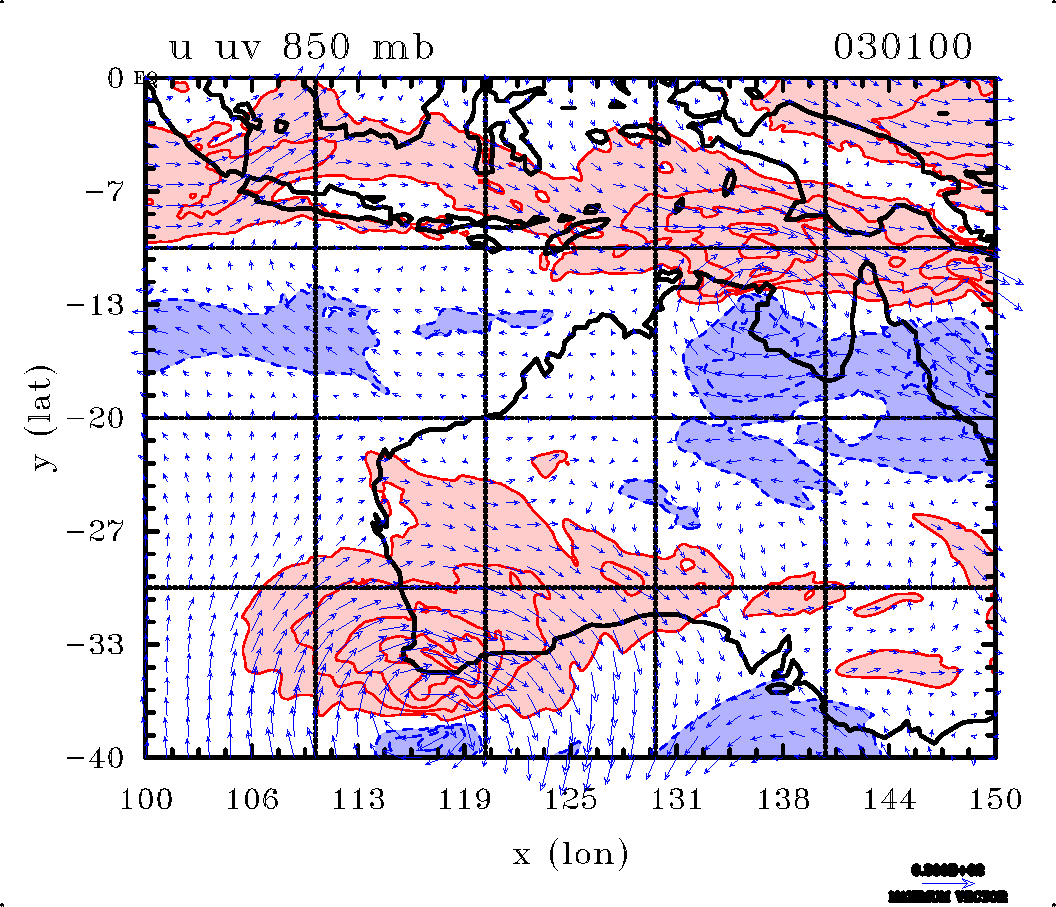
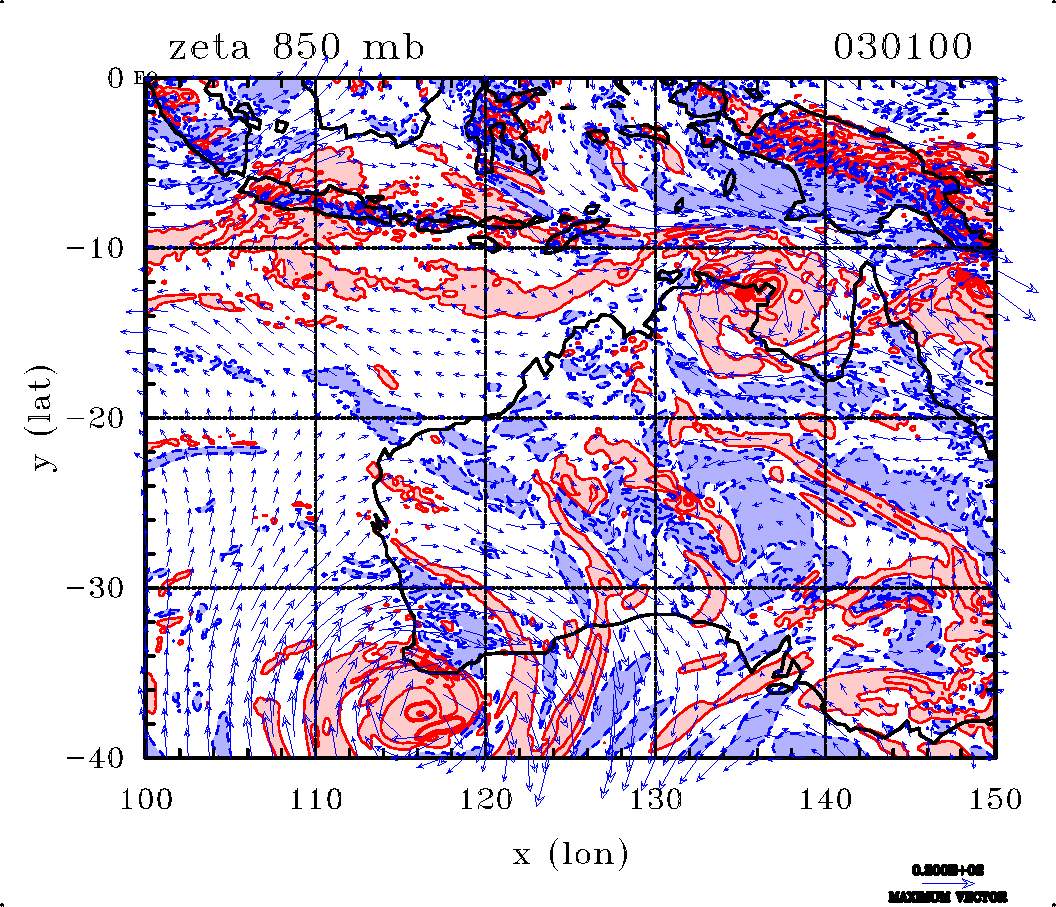
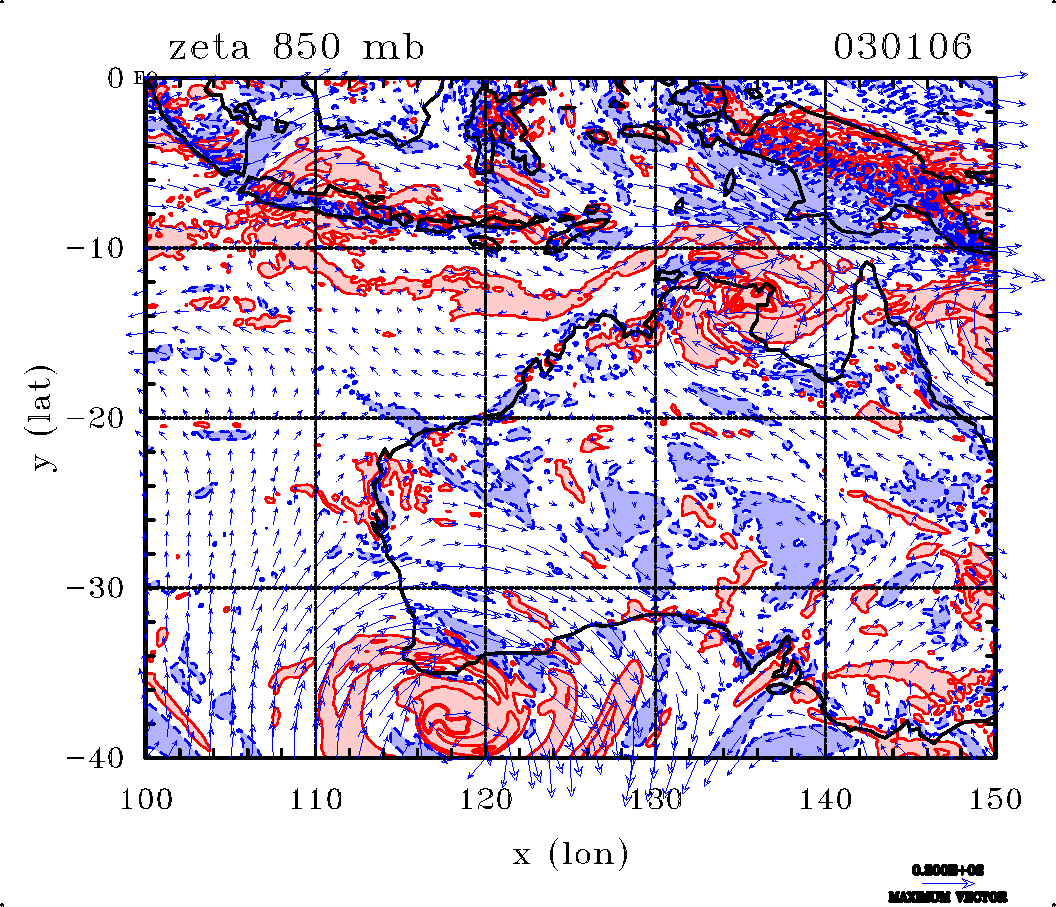
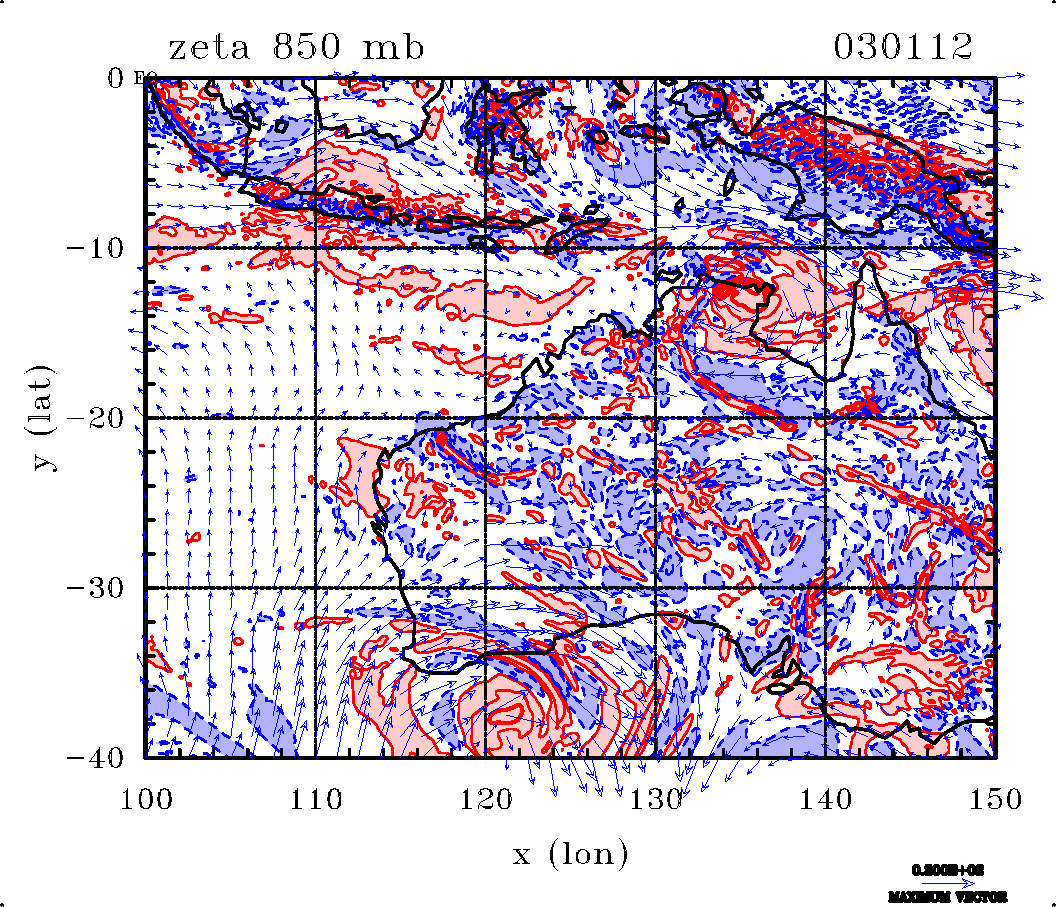
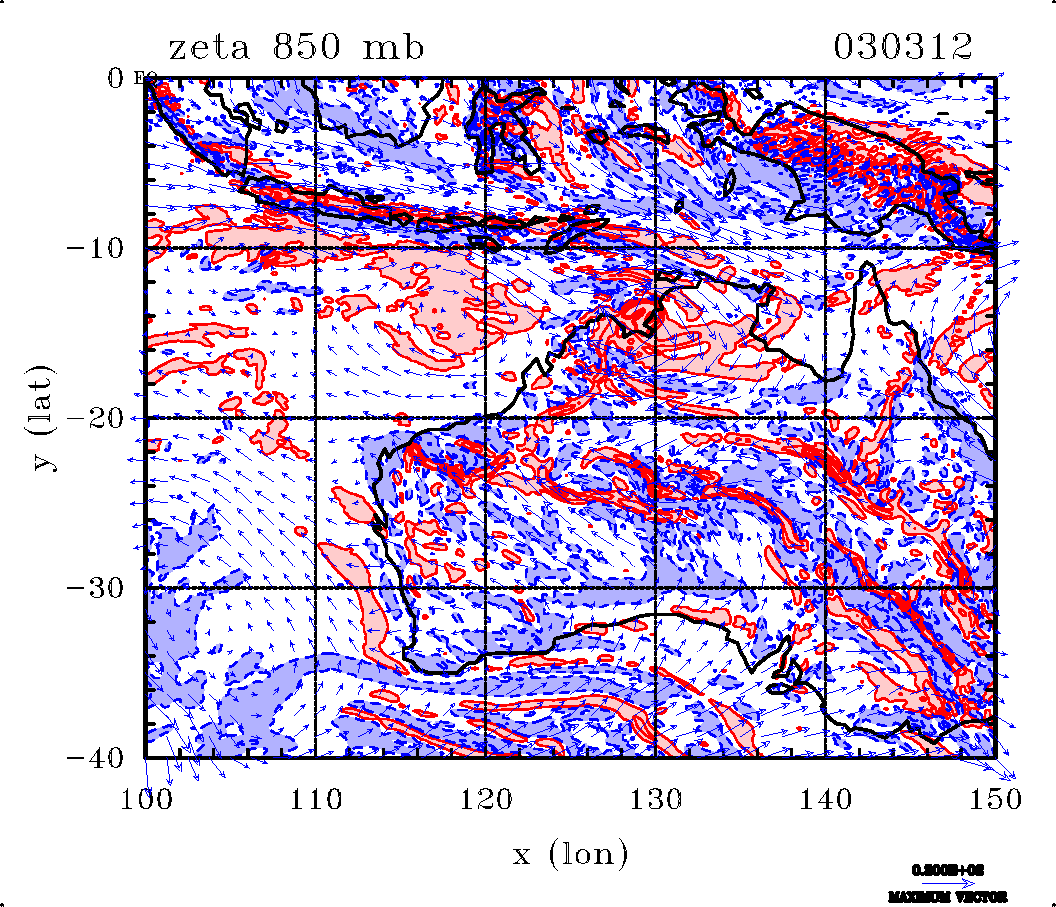
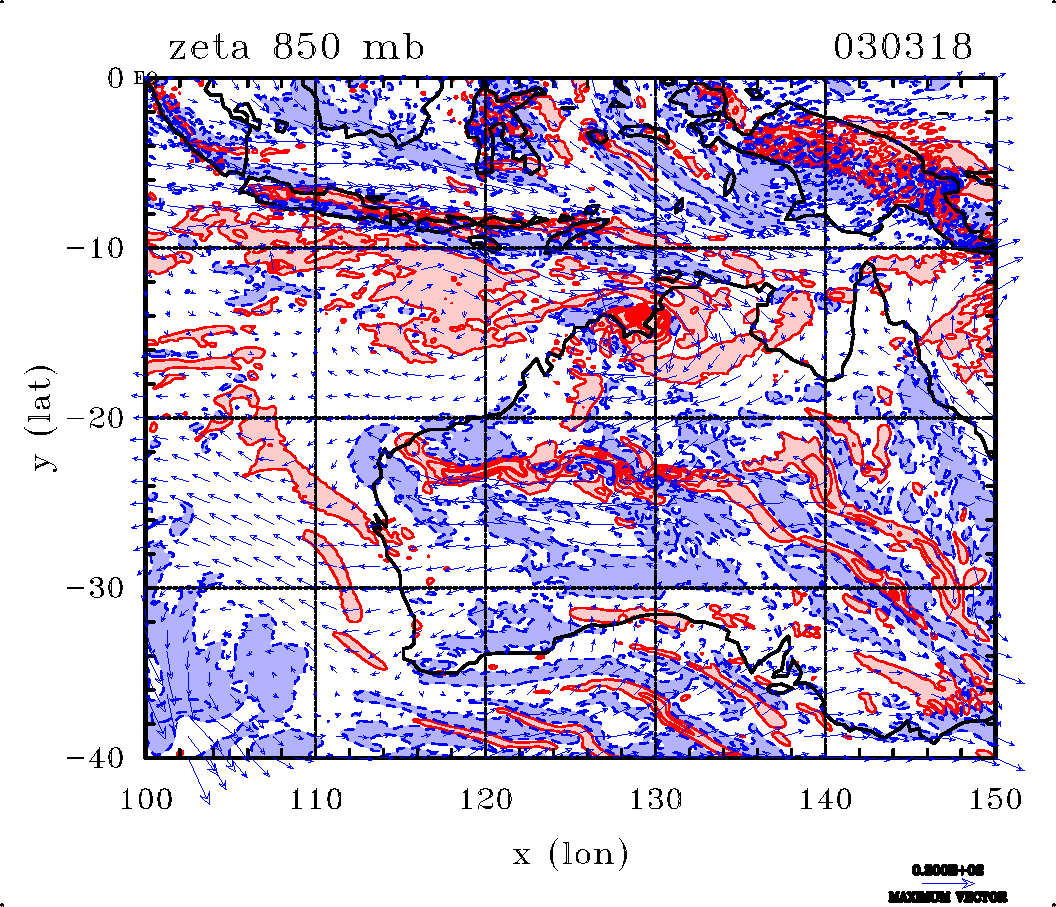
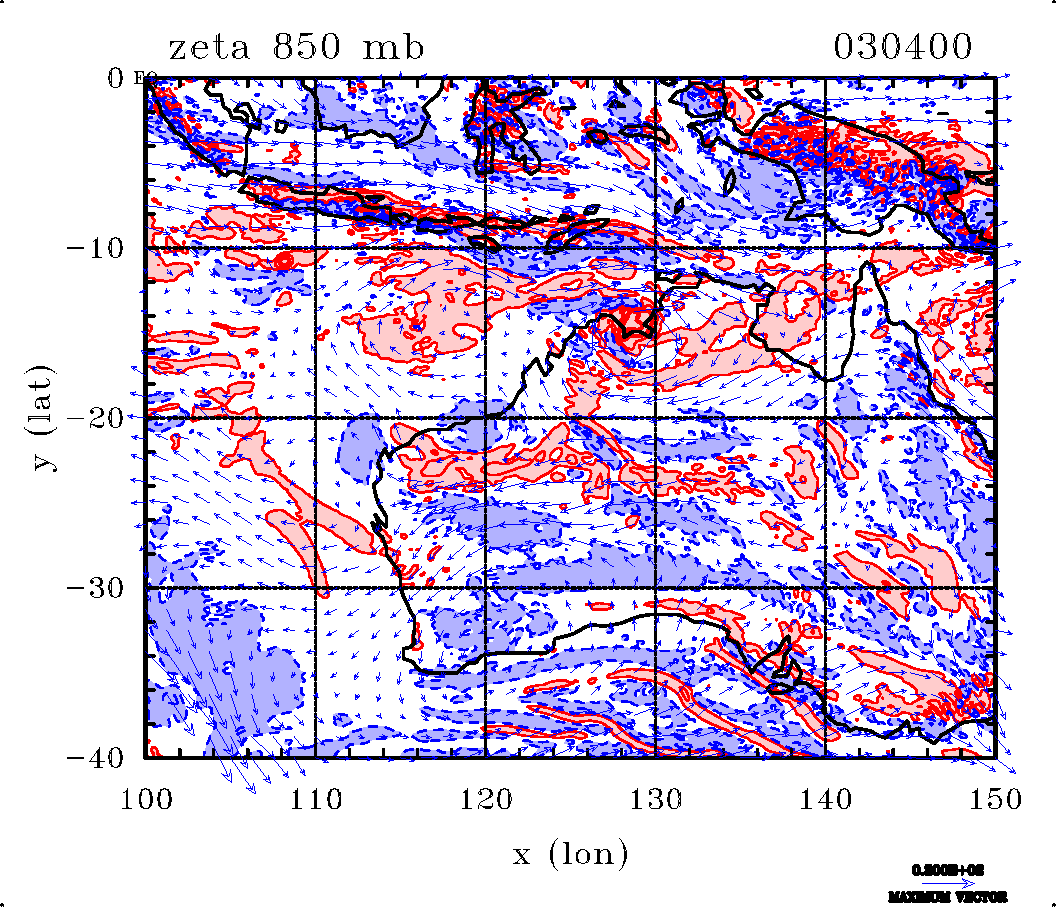
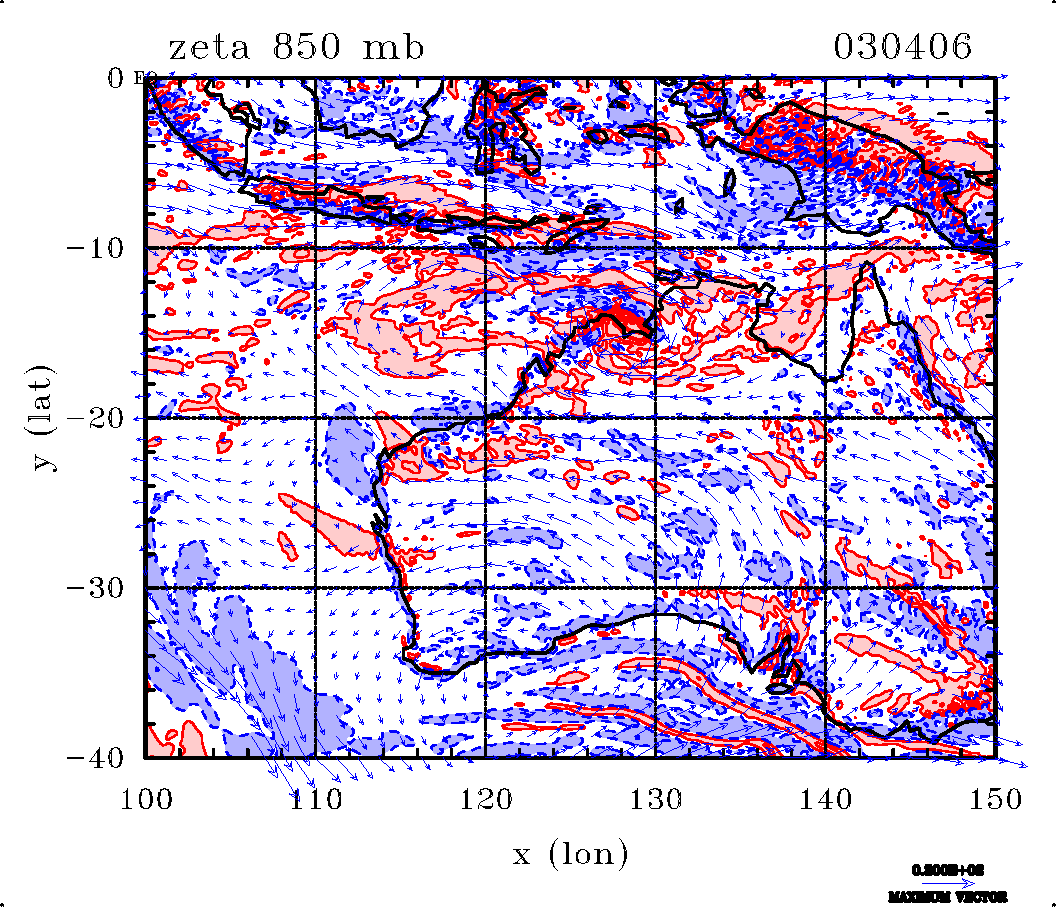
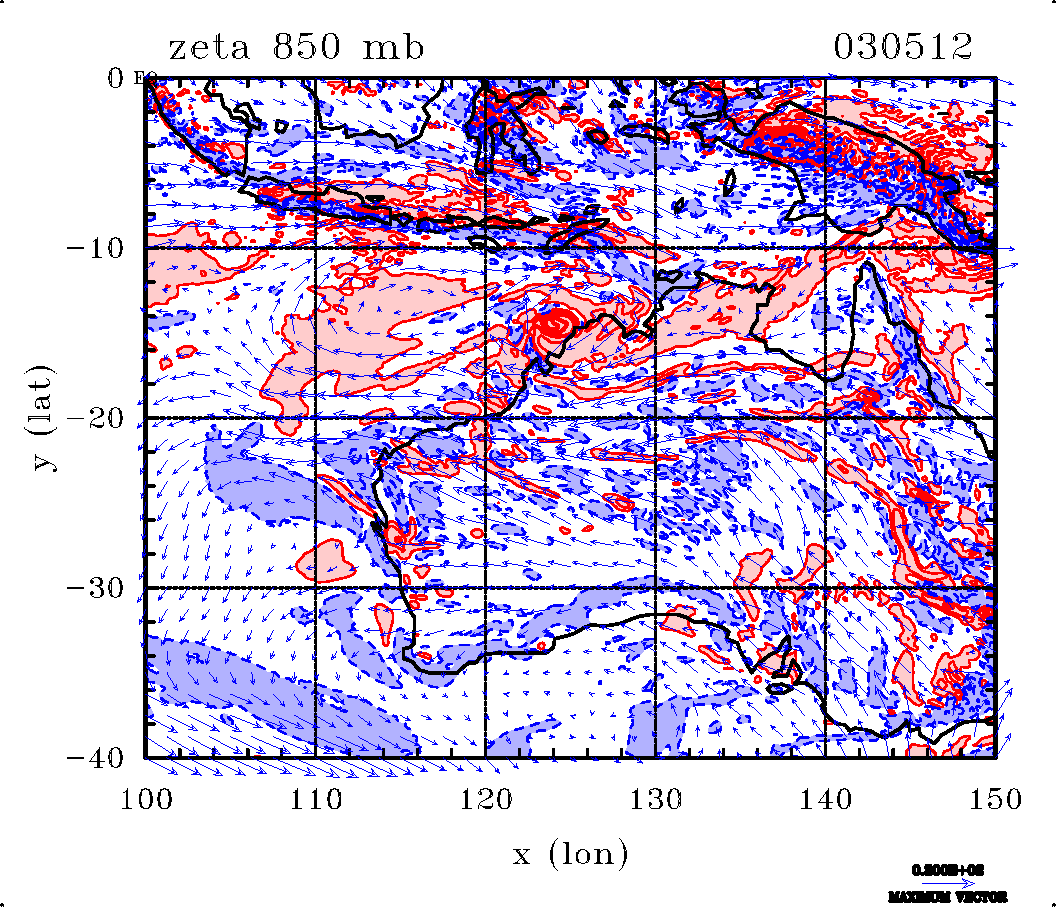
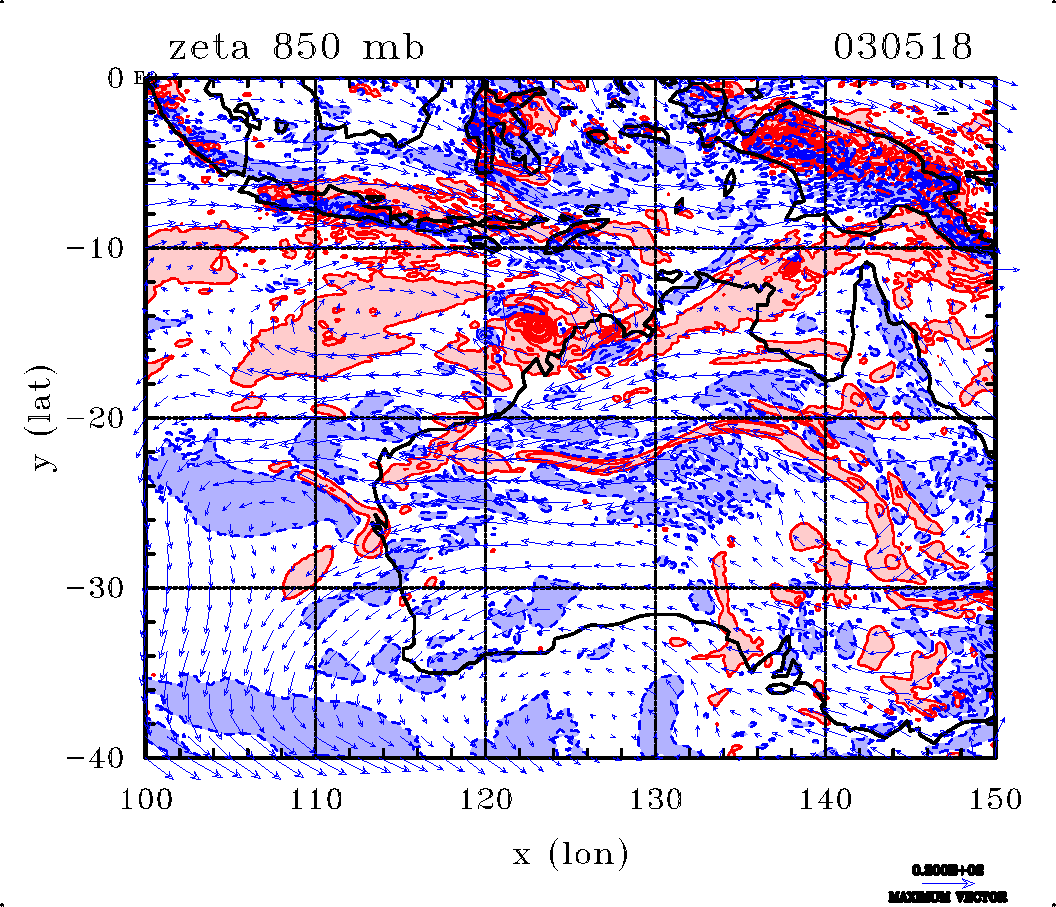
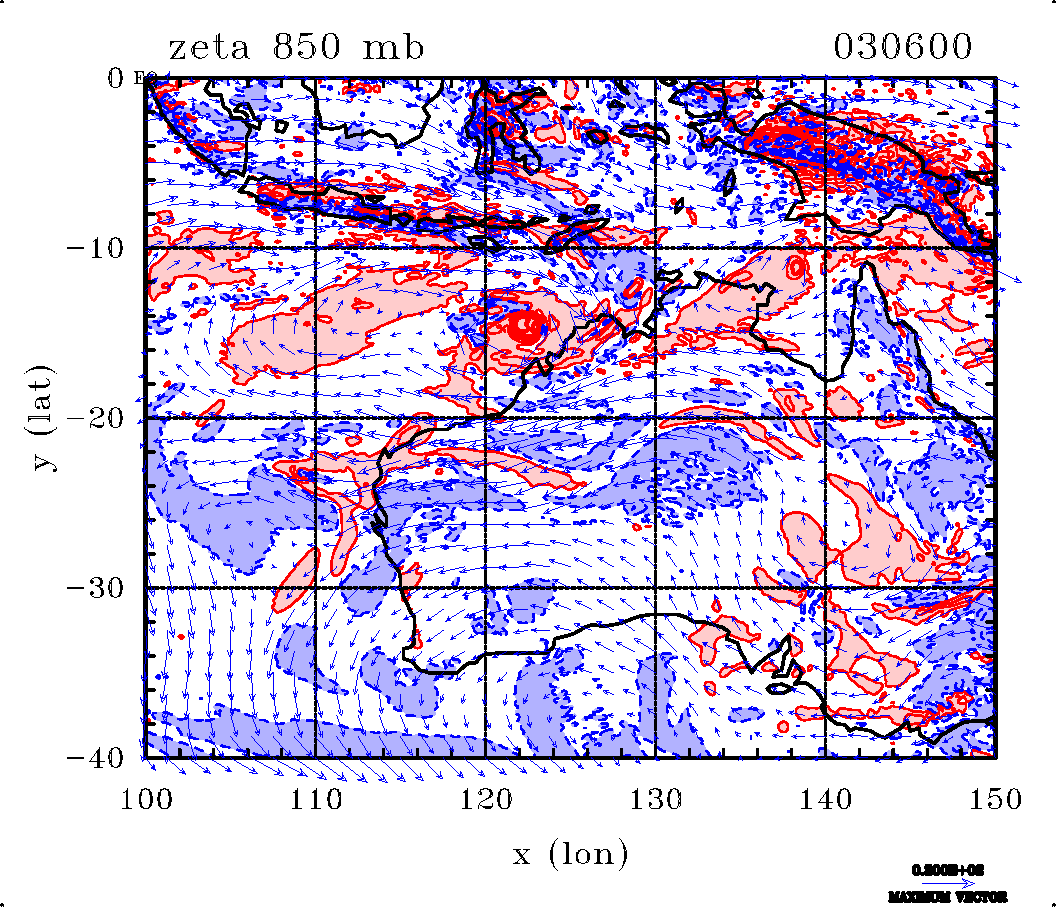
The left panels show wind vectors and contours of the zonal velocity component during the genesis and intensification stages of the disturbance. Contour levels for the zonal wind are 5 m s-1. Regions with westerly zonal velocity component exceeding 5 m s-1 are shaded pink; regions with easterly zonal velocity component exceeding 5 m s-1 are shaded light blue. The right panels show wind vectors and contours of the relative vorticity. Contour levels for the relative vorticity are 2 × 10⁻⁵ s-1 up to 1 × 10⁻⁴ s-1 and thereafter 2.5 × 10⁻⁴ s-1 up to 1 × 10⁻³. Positive values are solid lines, negative values dashed lines. Regions with positive values exceeding 2 × 10⁻⁵ s-1 are shaded pink; regions with negative values exceeding 2 × 10⁻⁵ s-1 in magnitude are shaded light blue.
Click here for the plotting code for the left panels and here for the code to produce the right panels.
 |  |
 |  |
 |  |
 |  |
 |  |
 |  |
 |  |
 |  |
 |  |
 |  |
 |  |
 |  |
 |  |
 |  |
 |  |
 |  |
 |  |
 |  |
 |  |
 |  |
 |  |
 |  |
 |  |
 |  |
 |  |
 |  |
 |  |
 |  |
 |  |
 |  |
 |  |
 |  |
 |  |
 |  |
 |  |
 |  |
 |  |
Copyright © Roger Smith: Date 22 July 2014