Tropical Cyclone Carlos Feb 2011
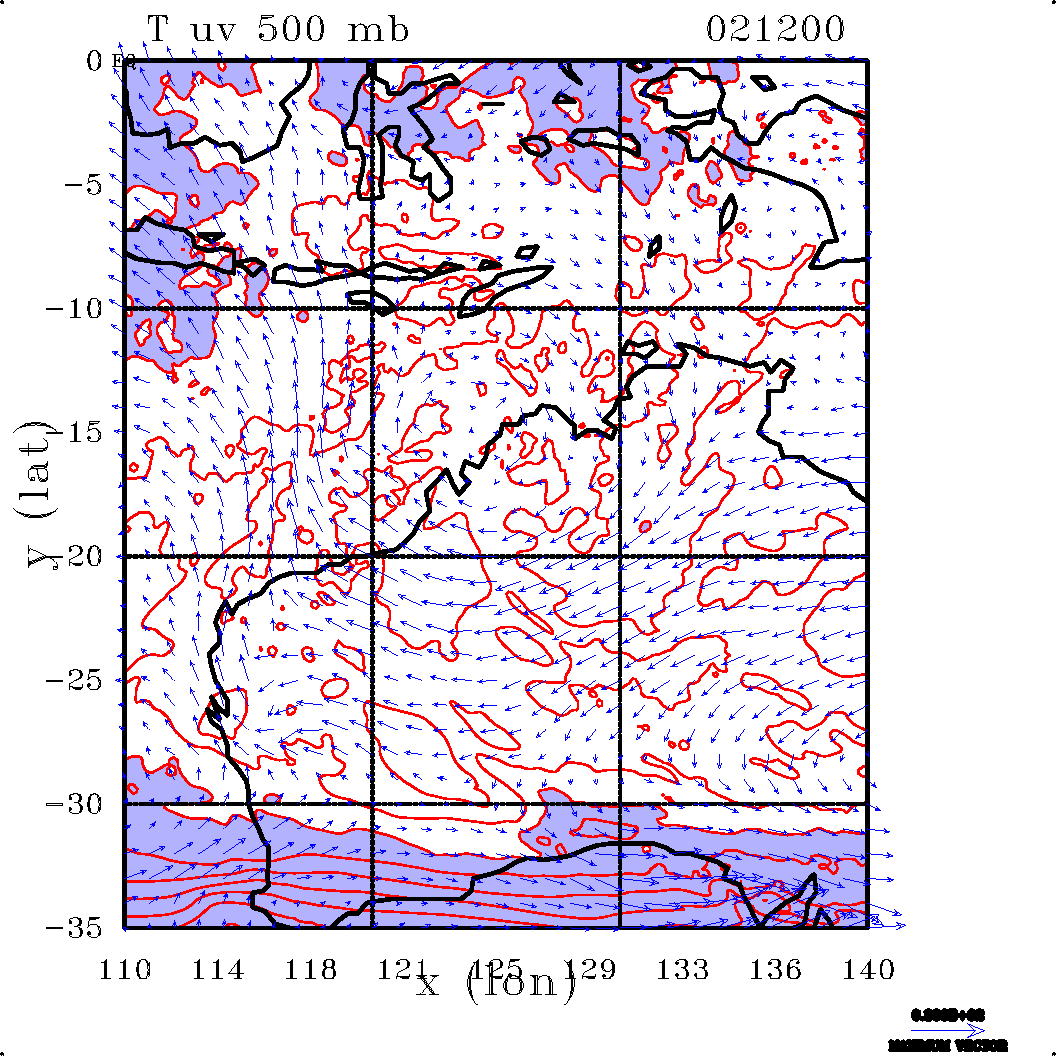
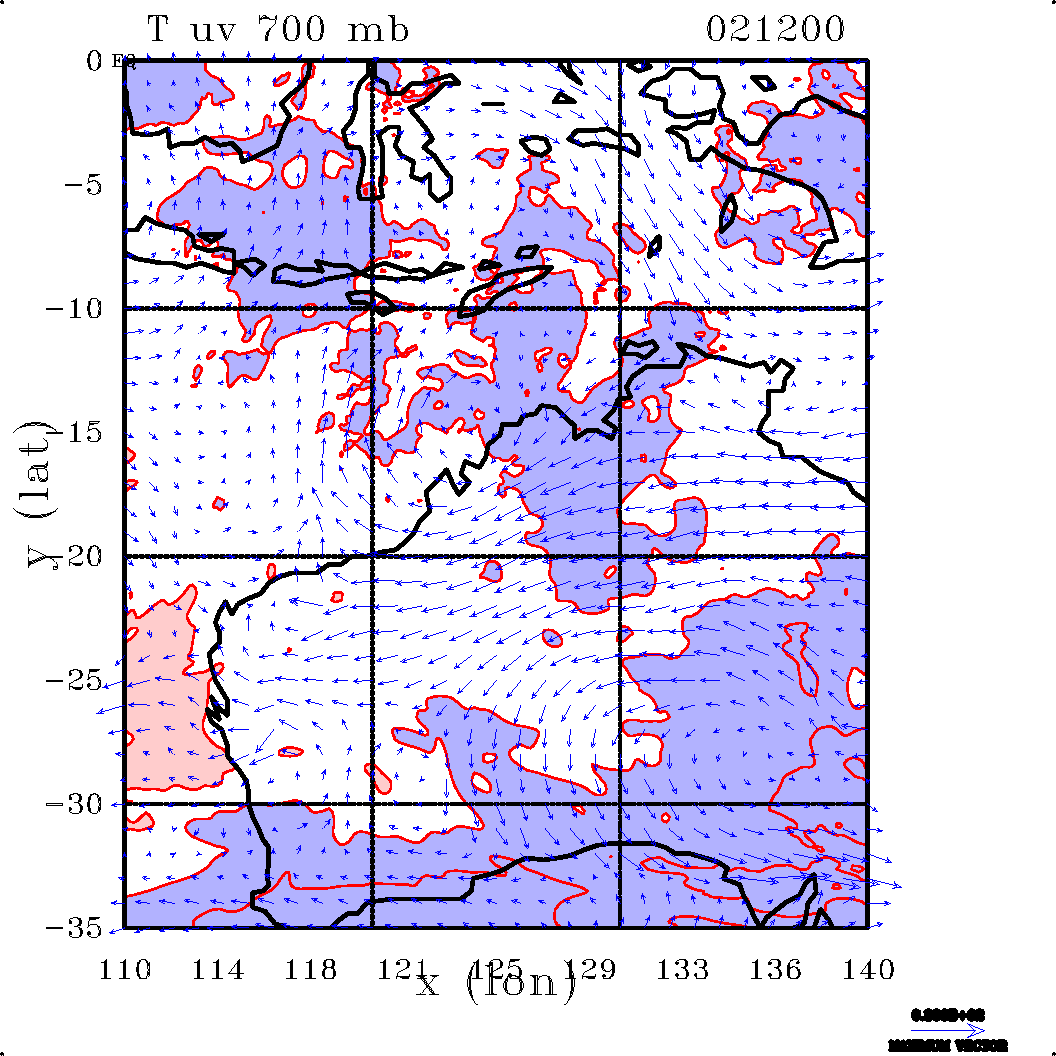
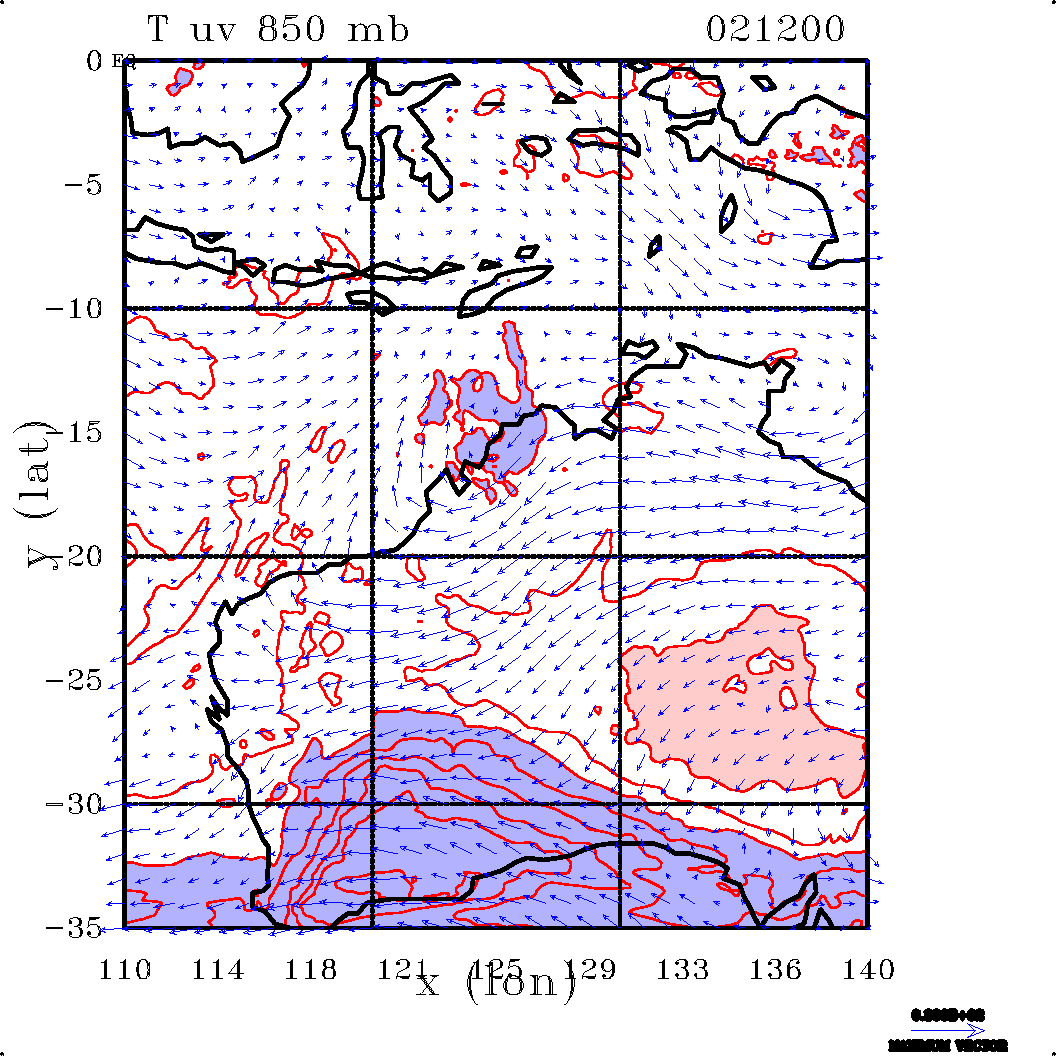
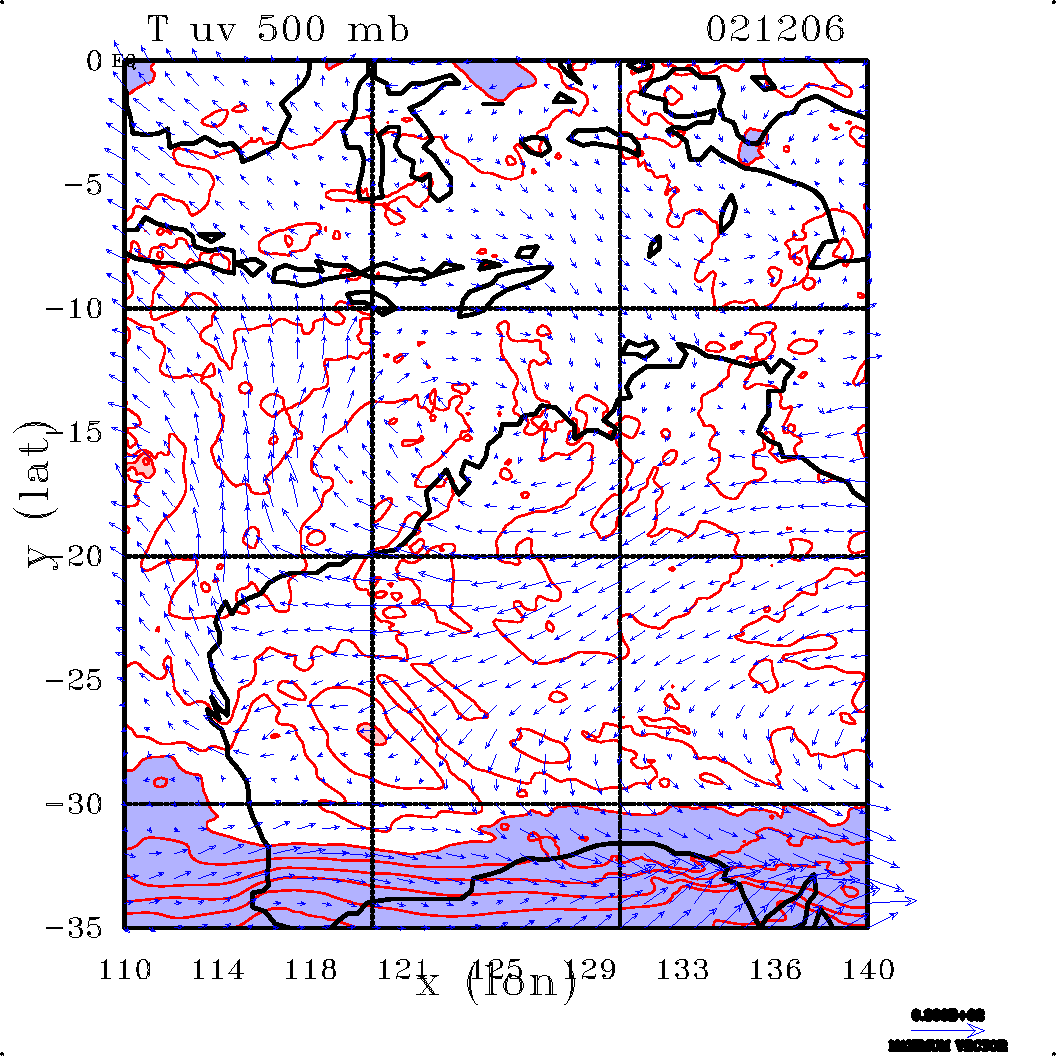
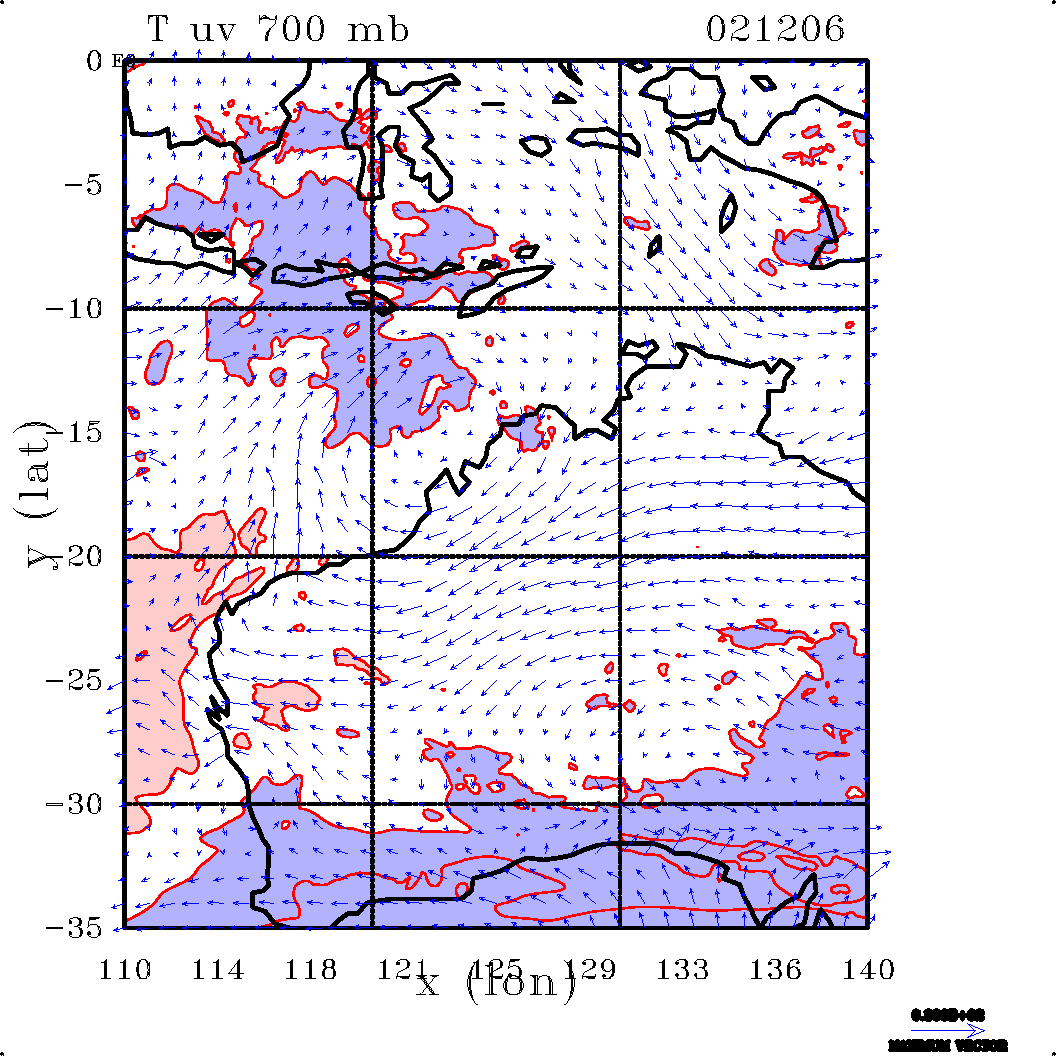
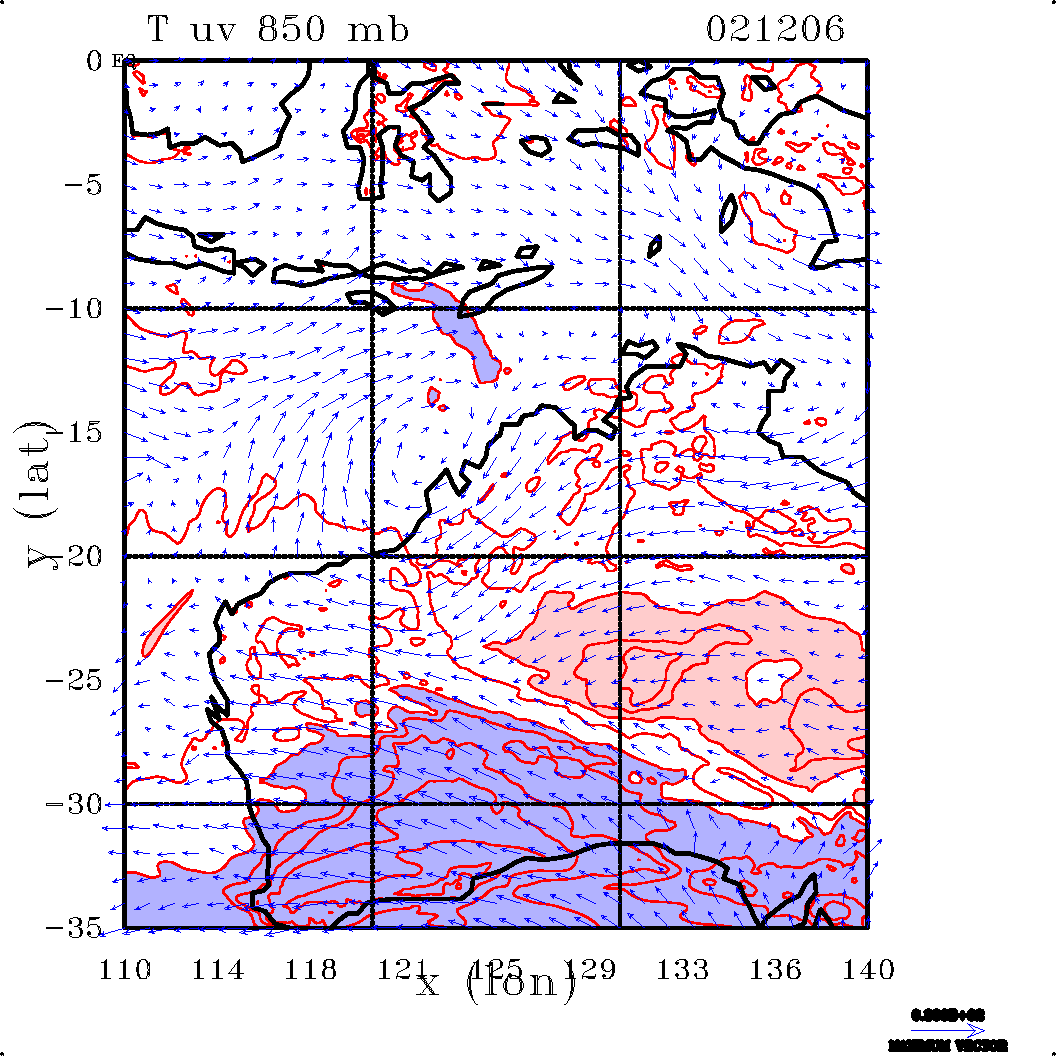
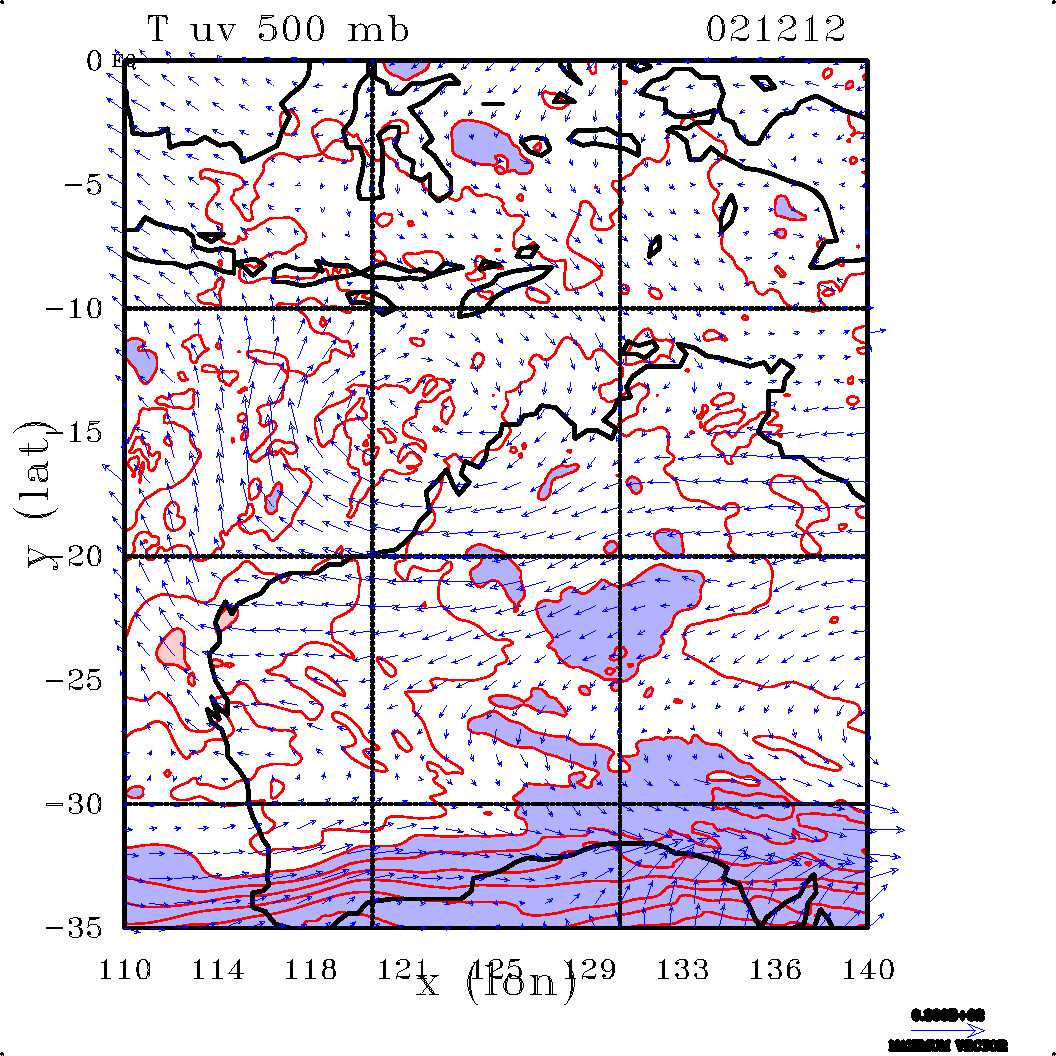
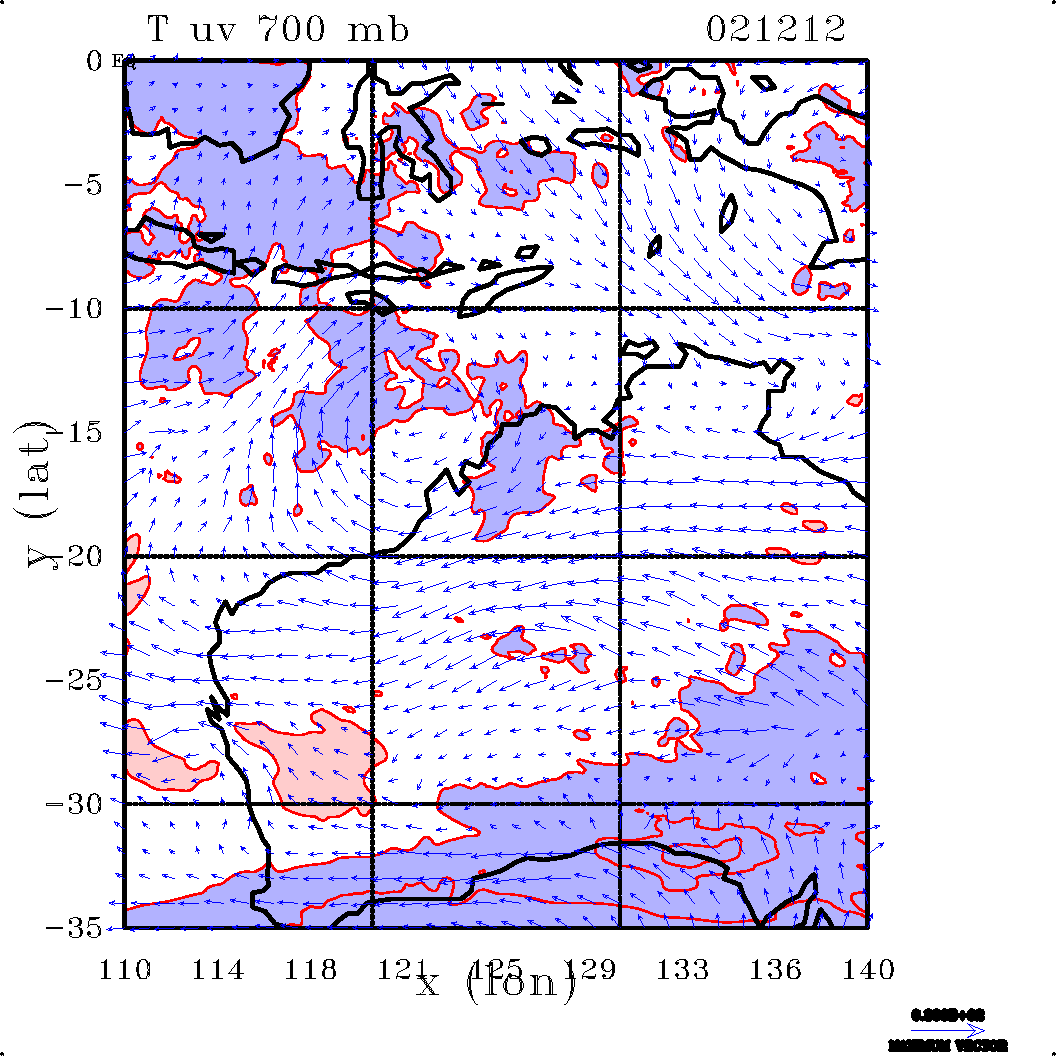
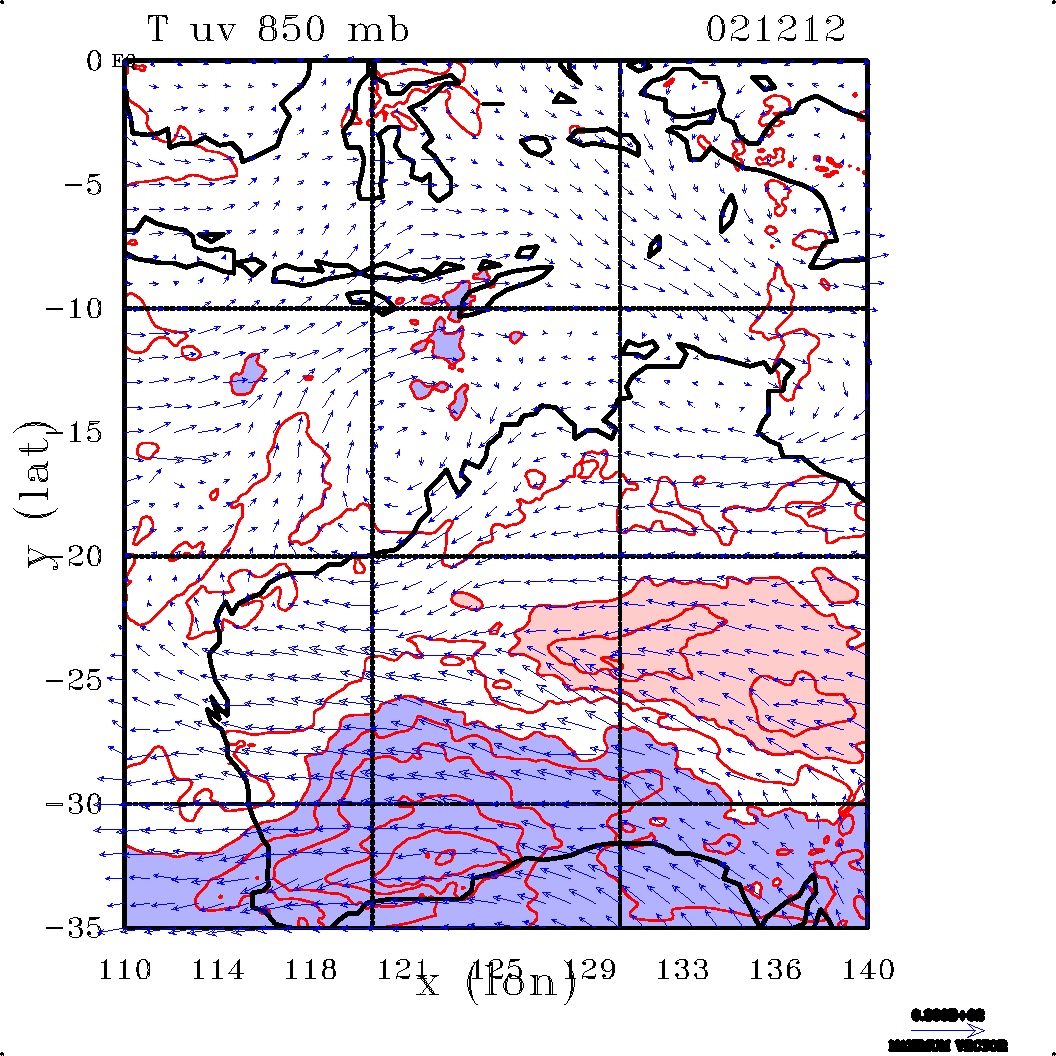
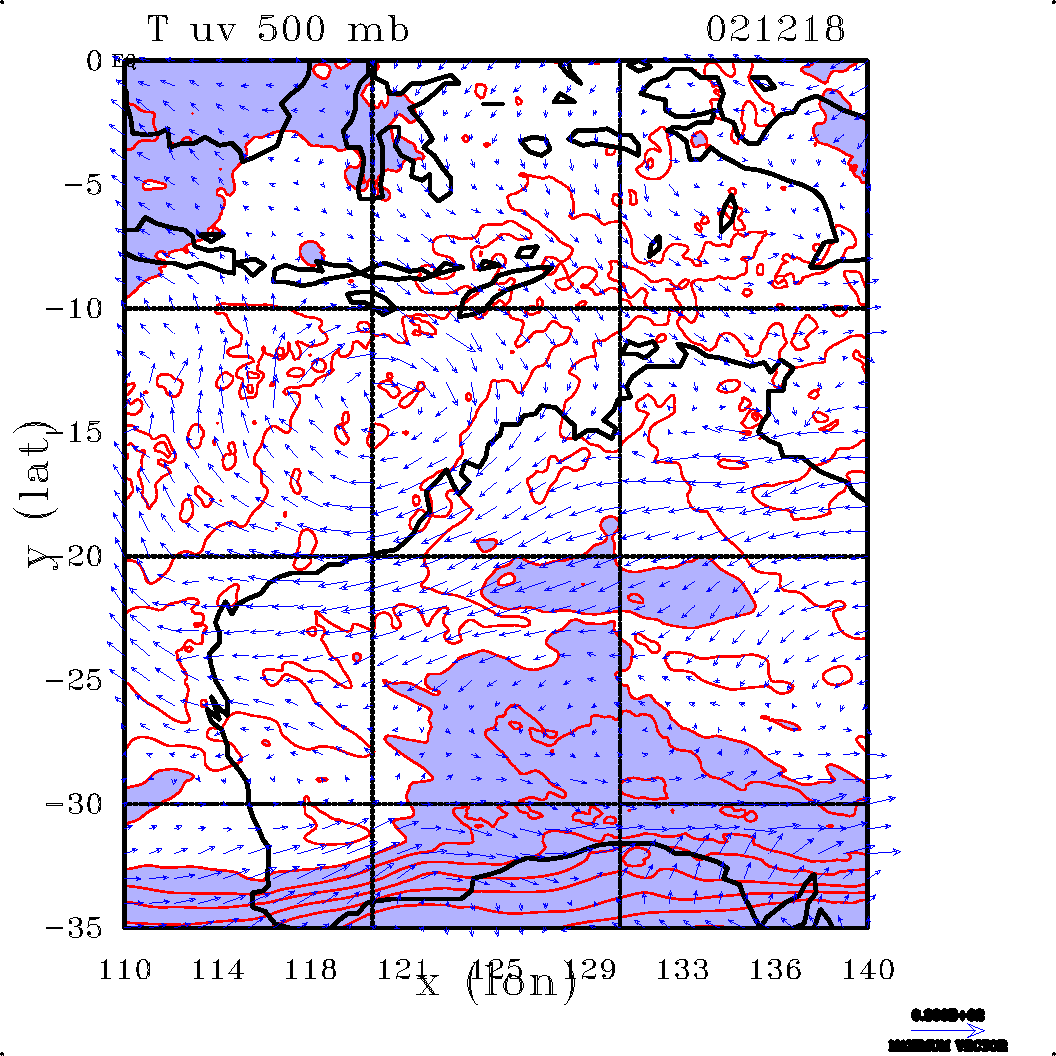
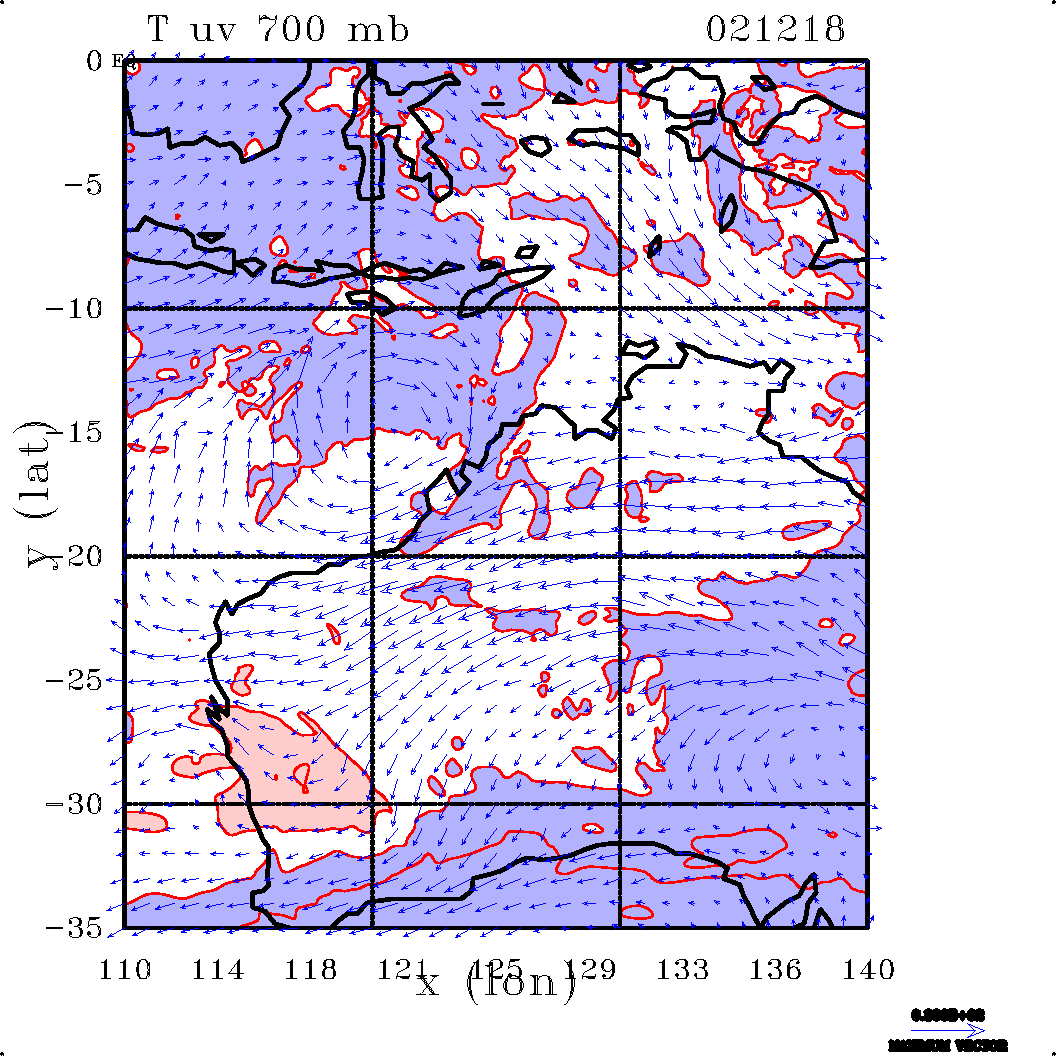
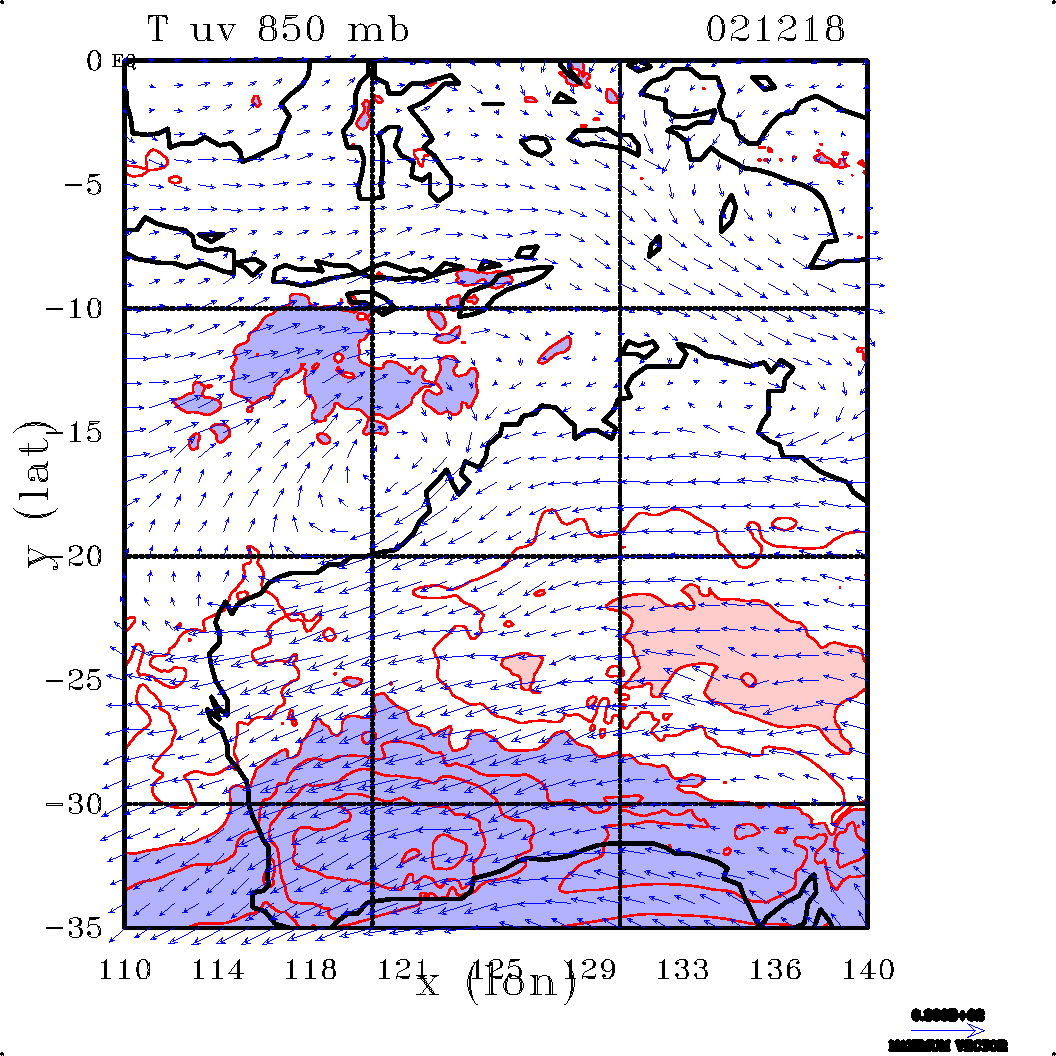
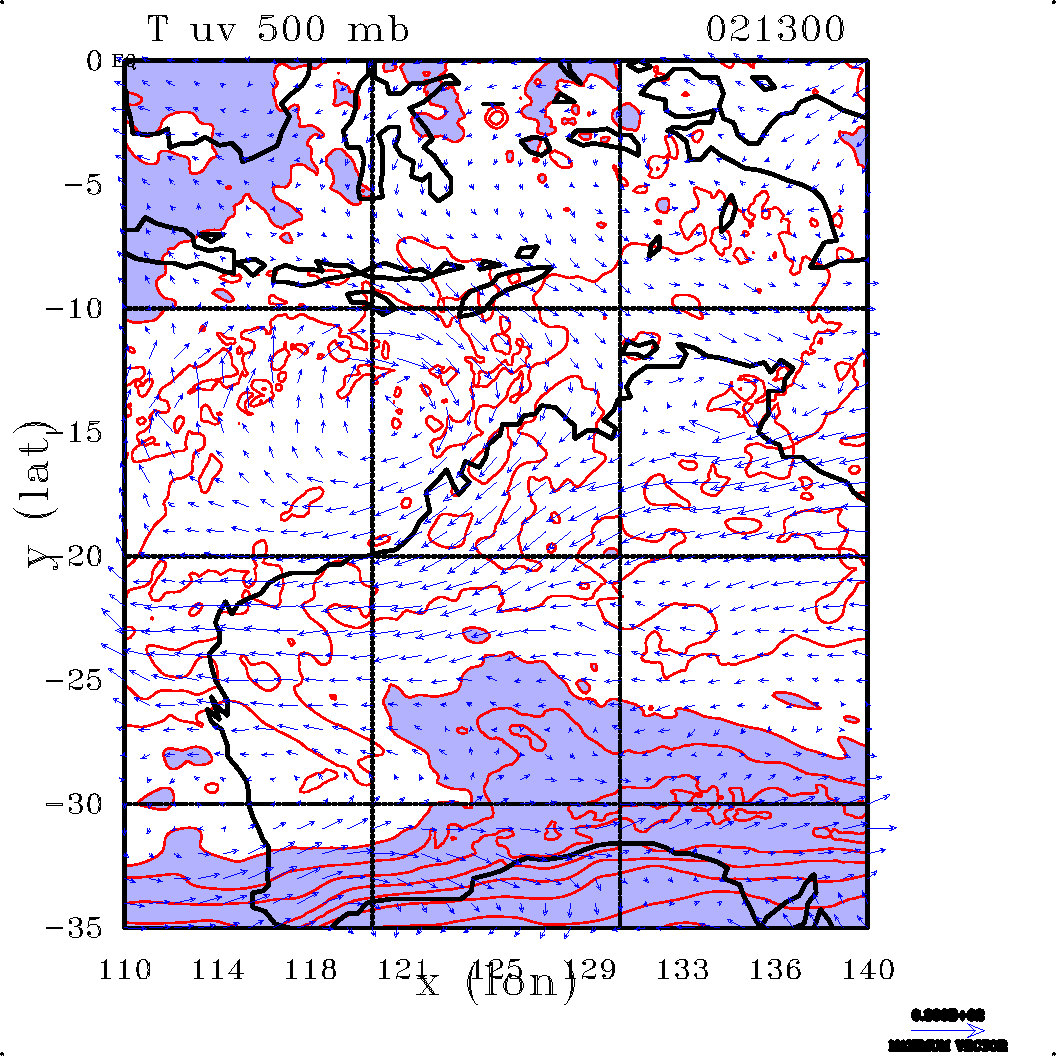
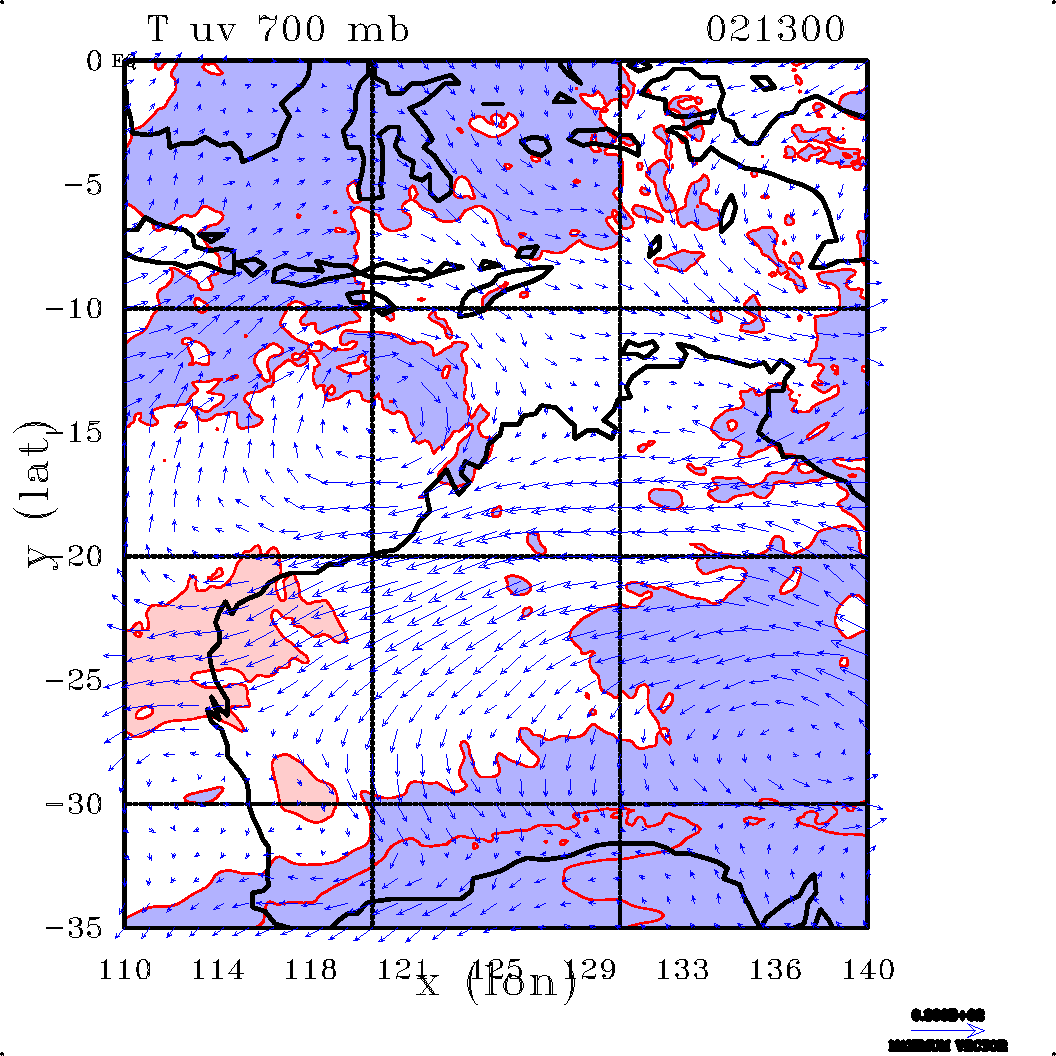
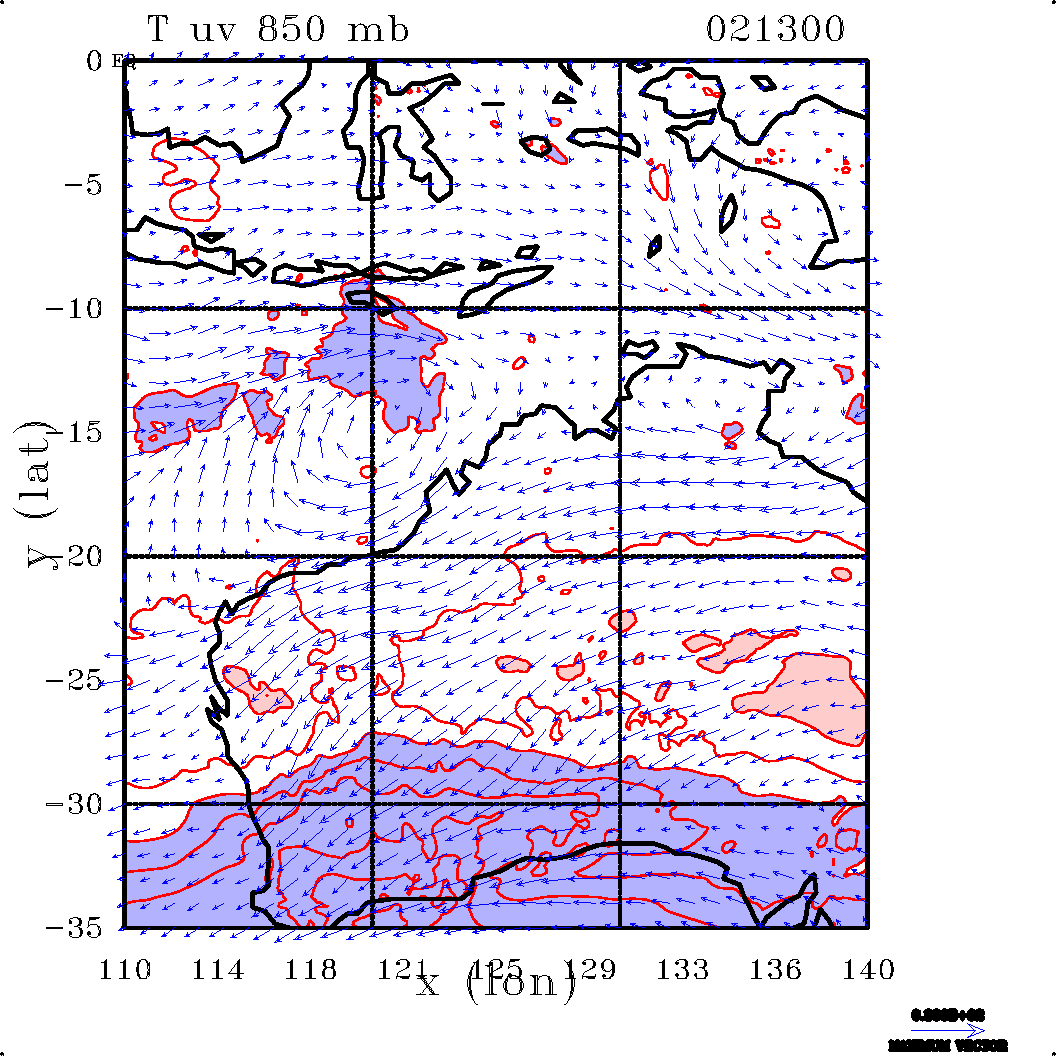
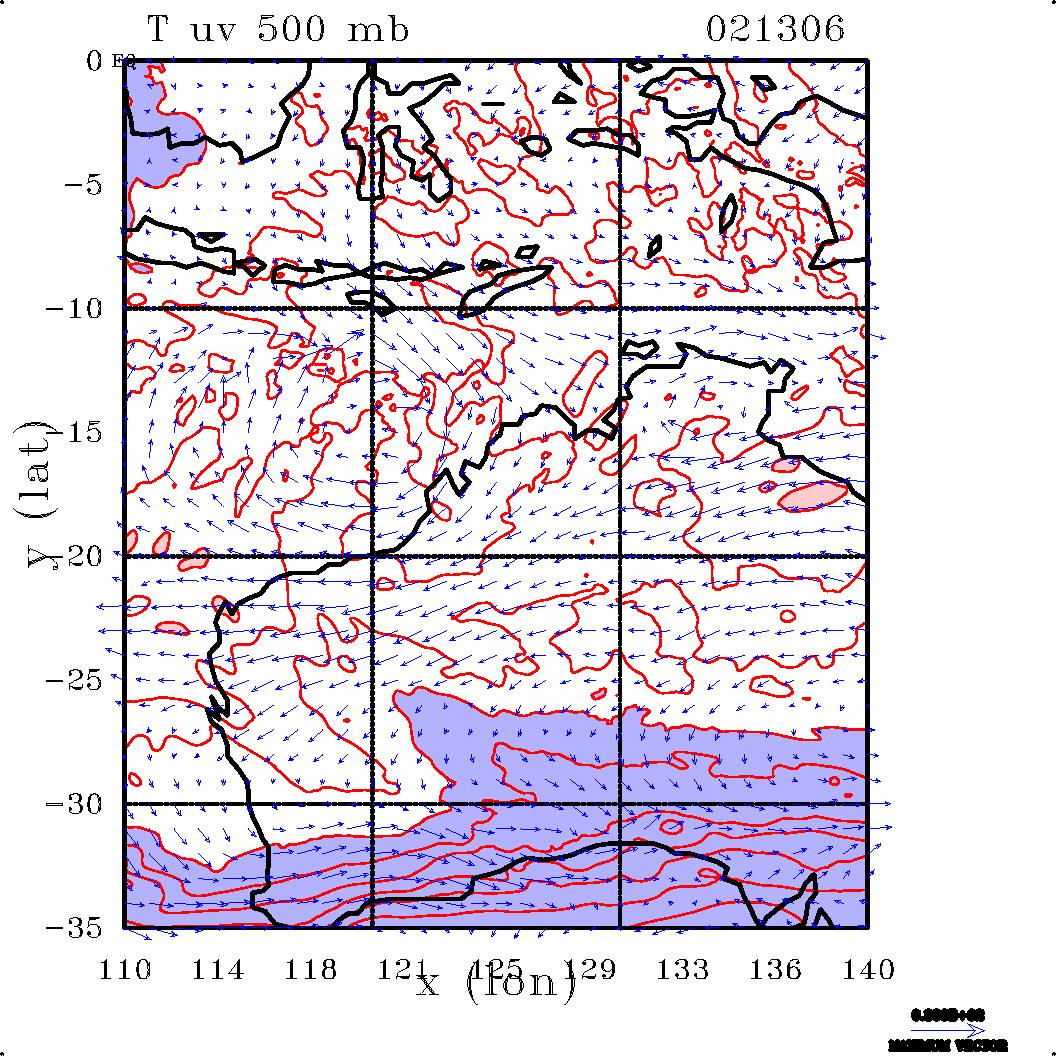
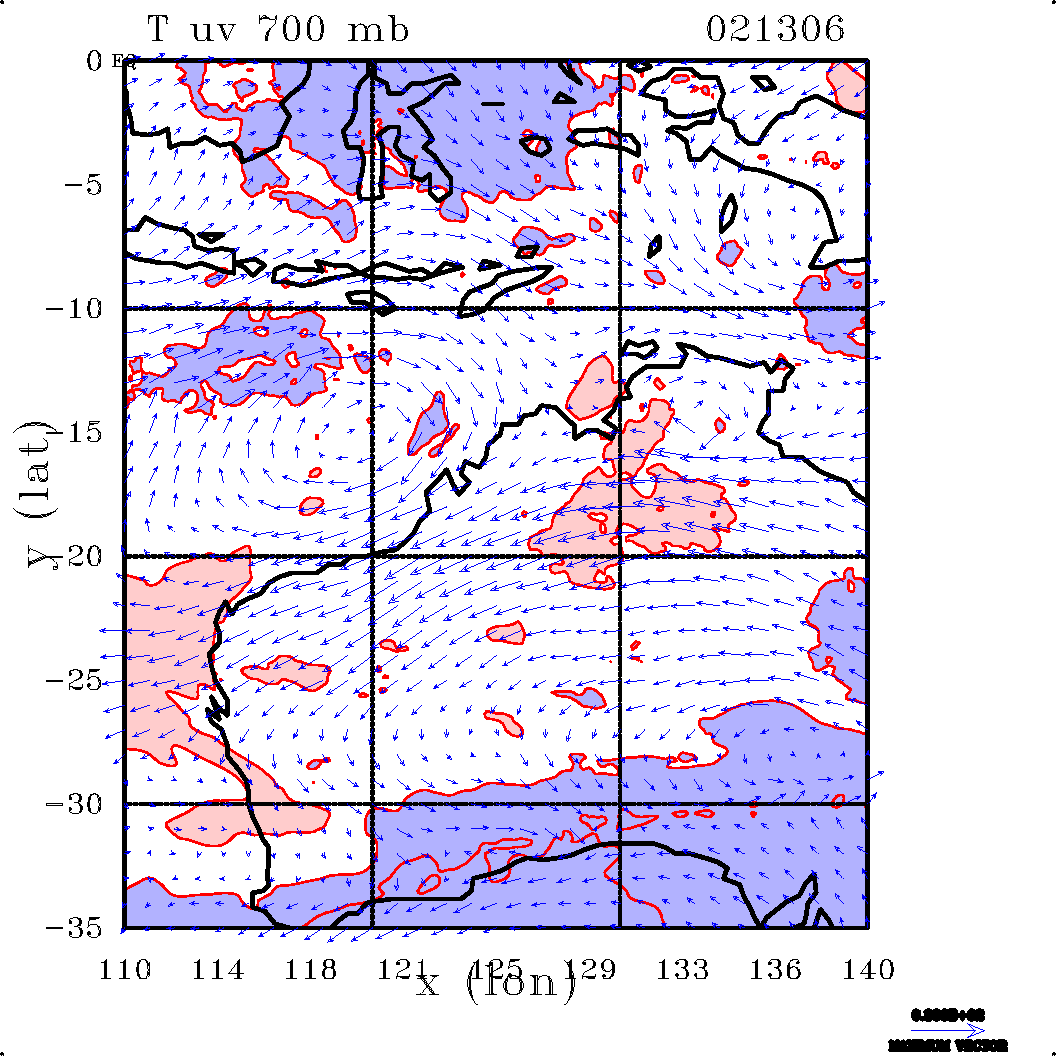
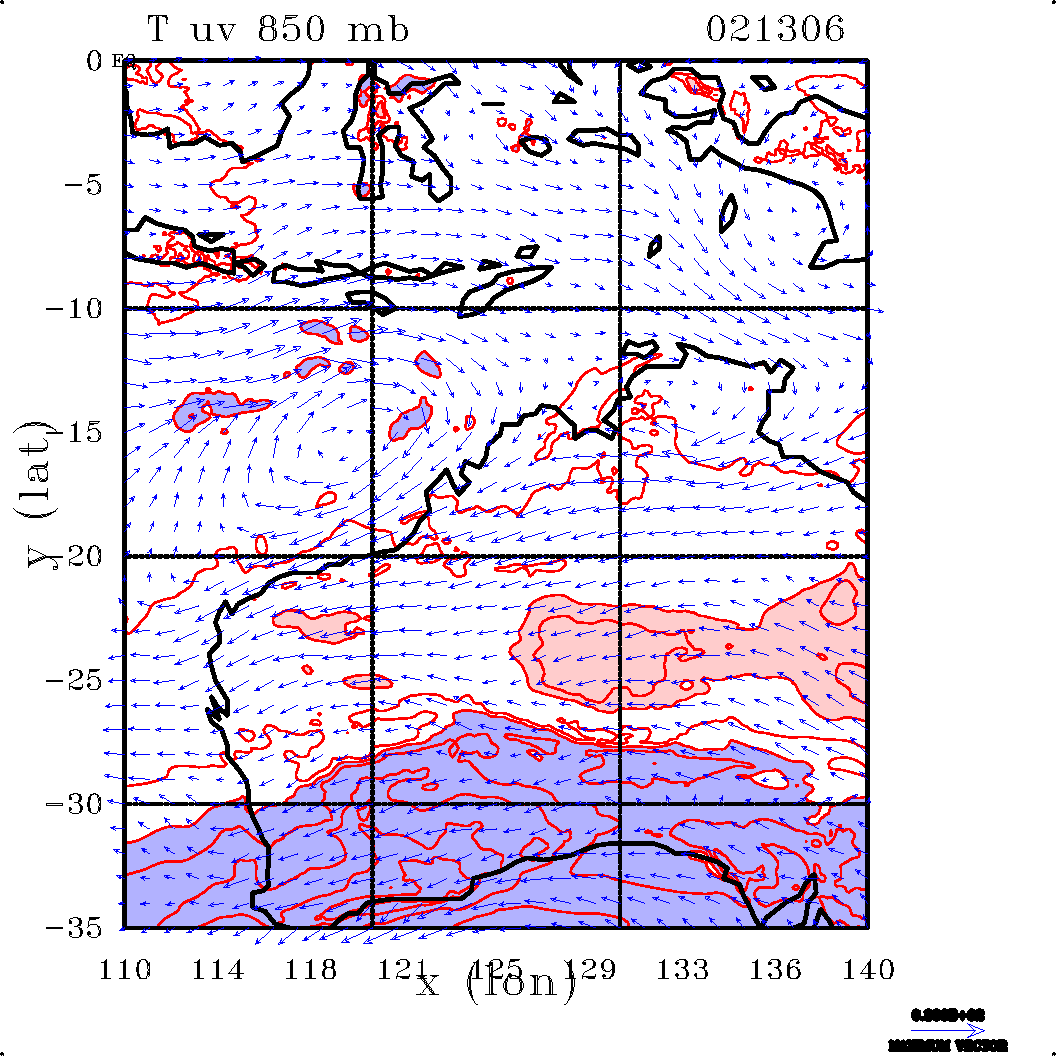
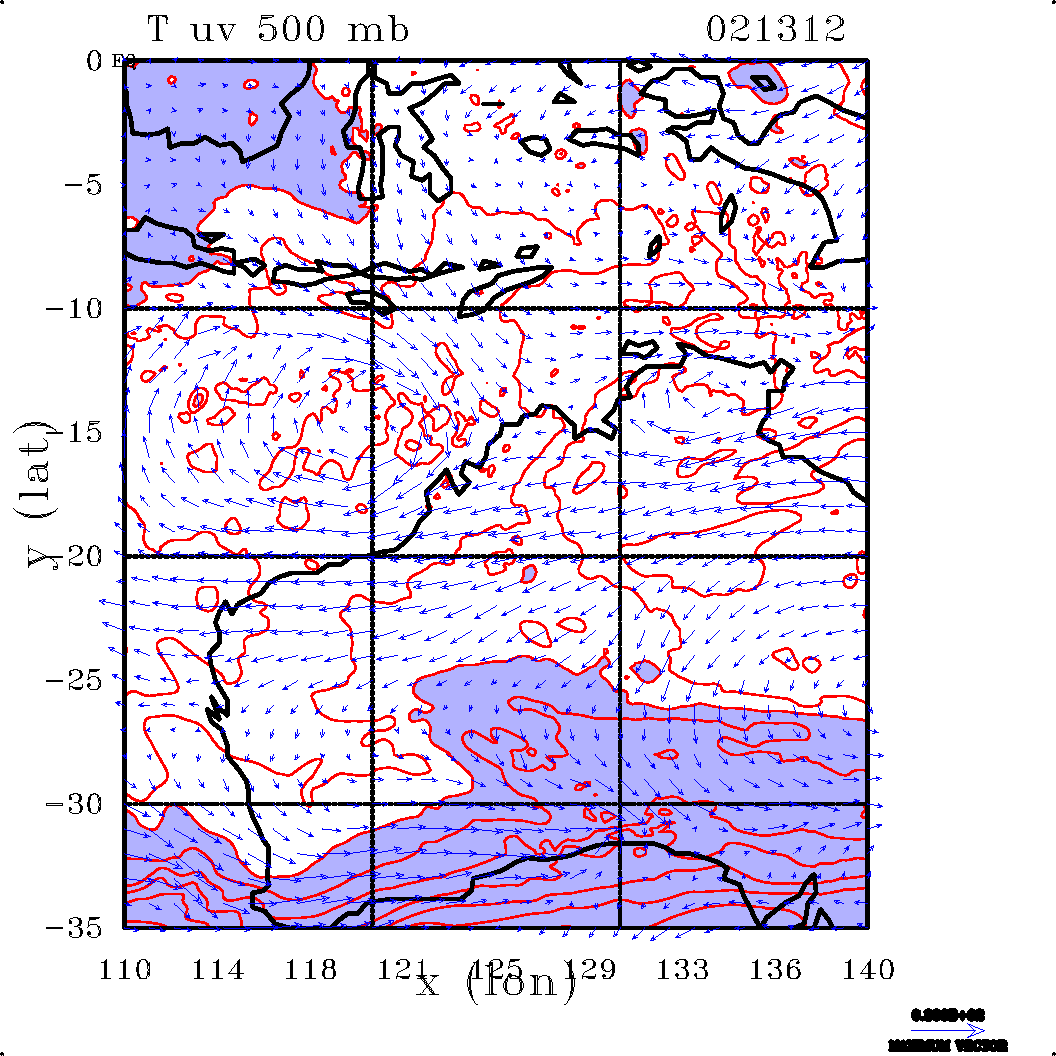
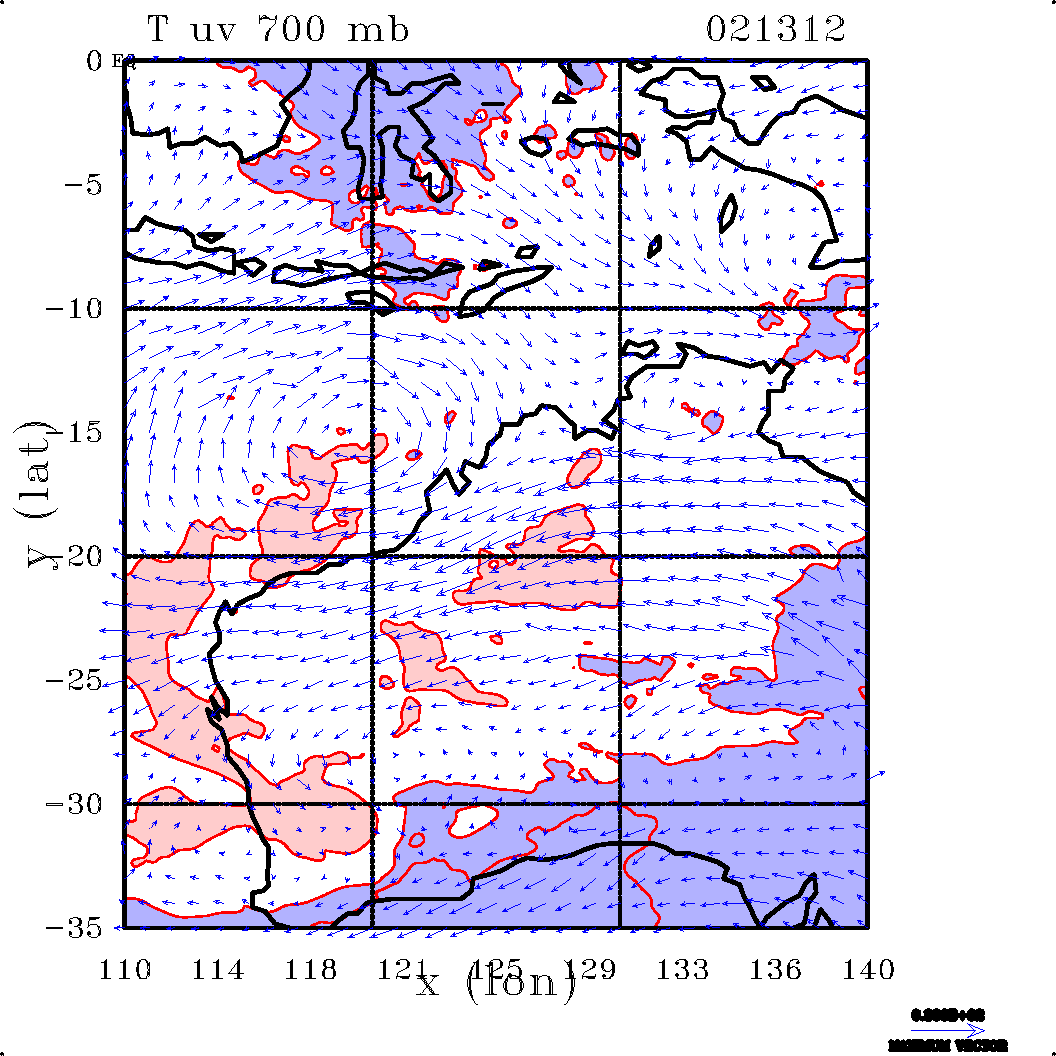
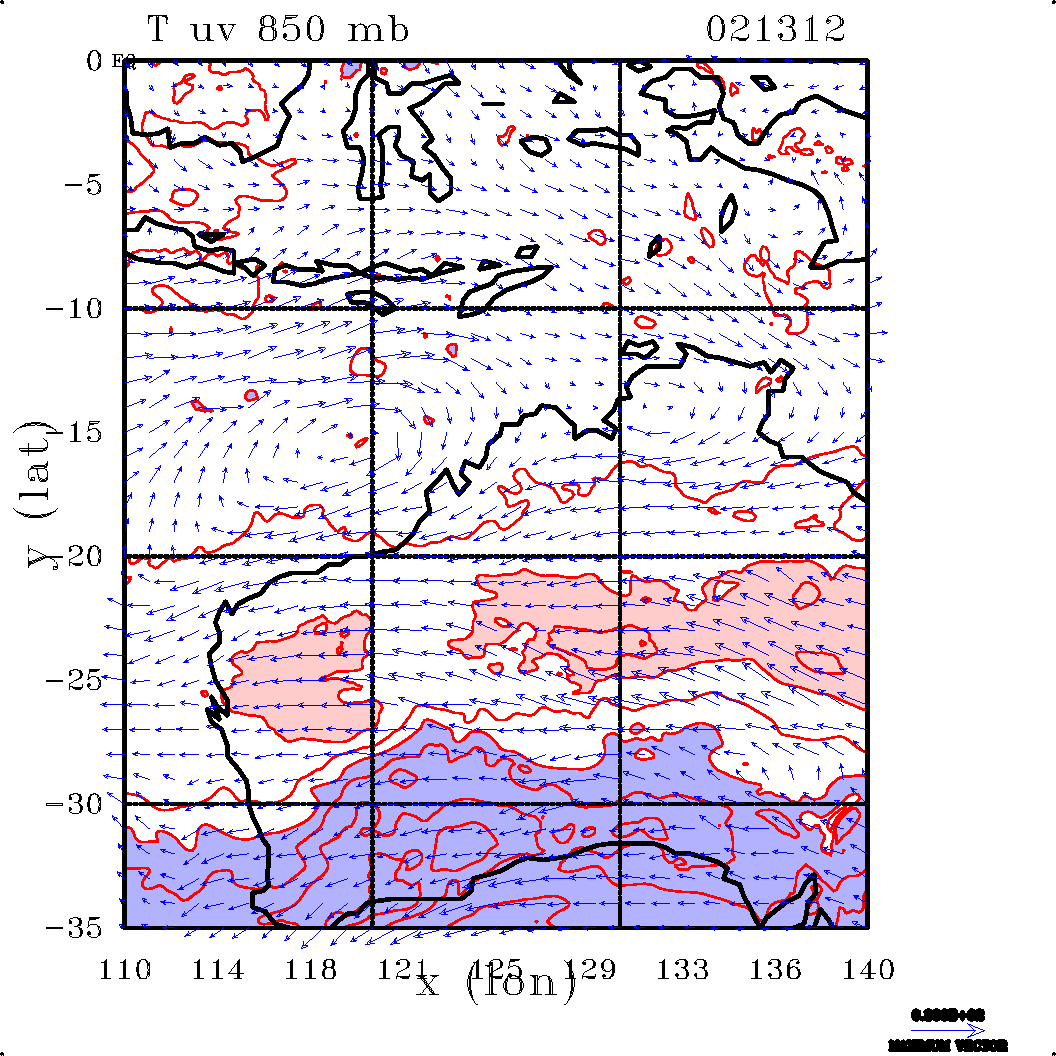
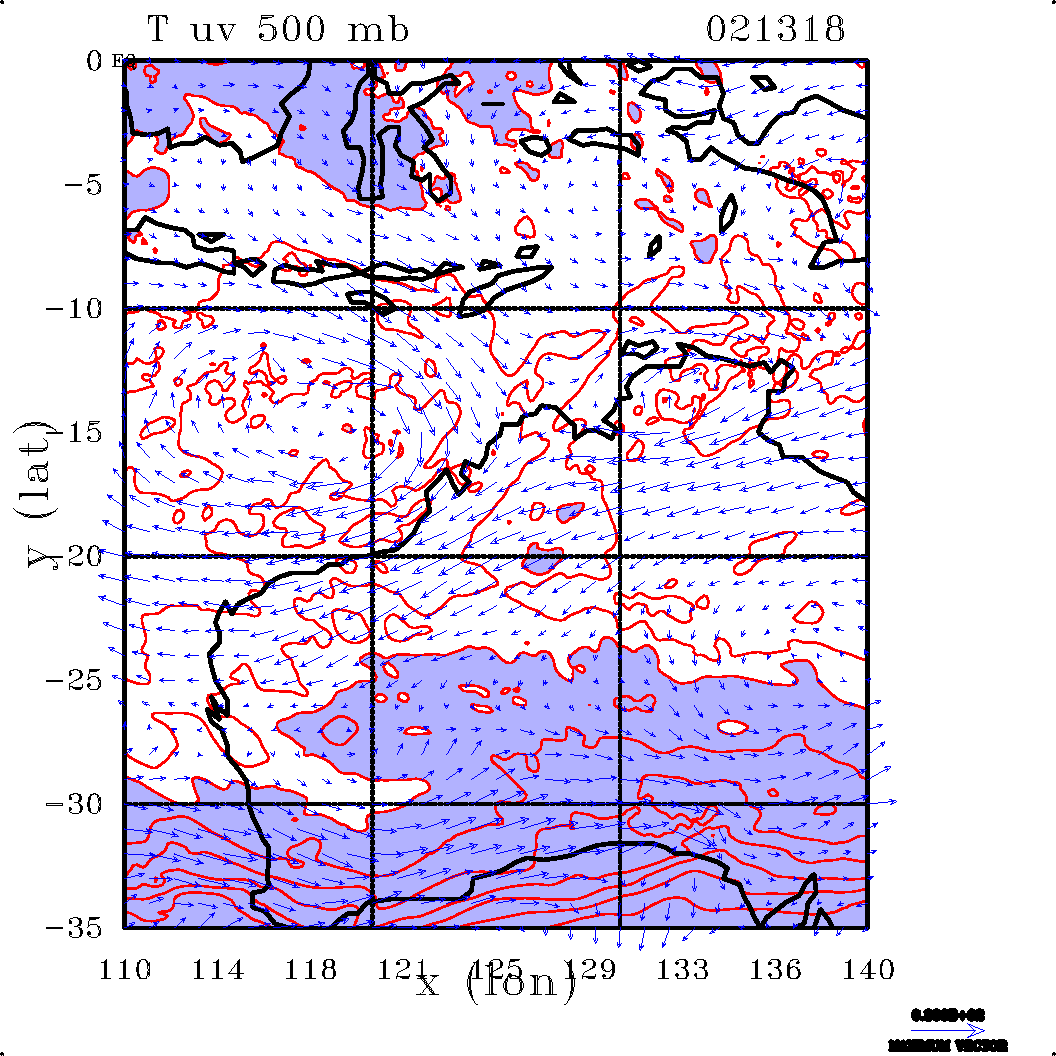
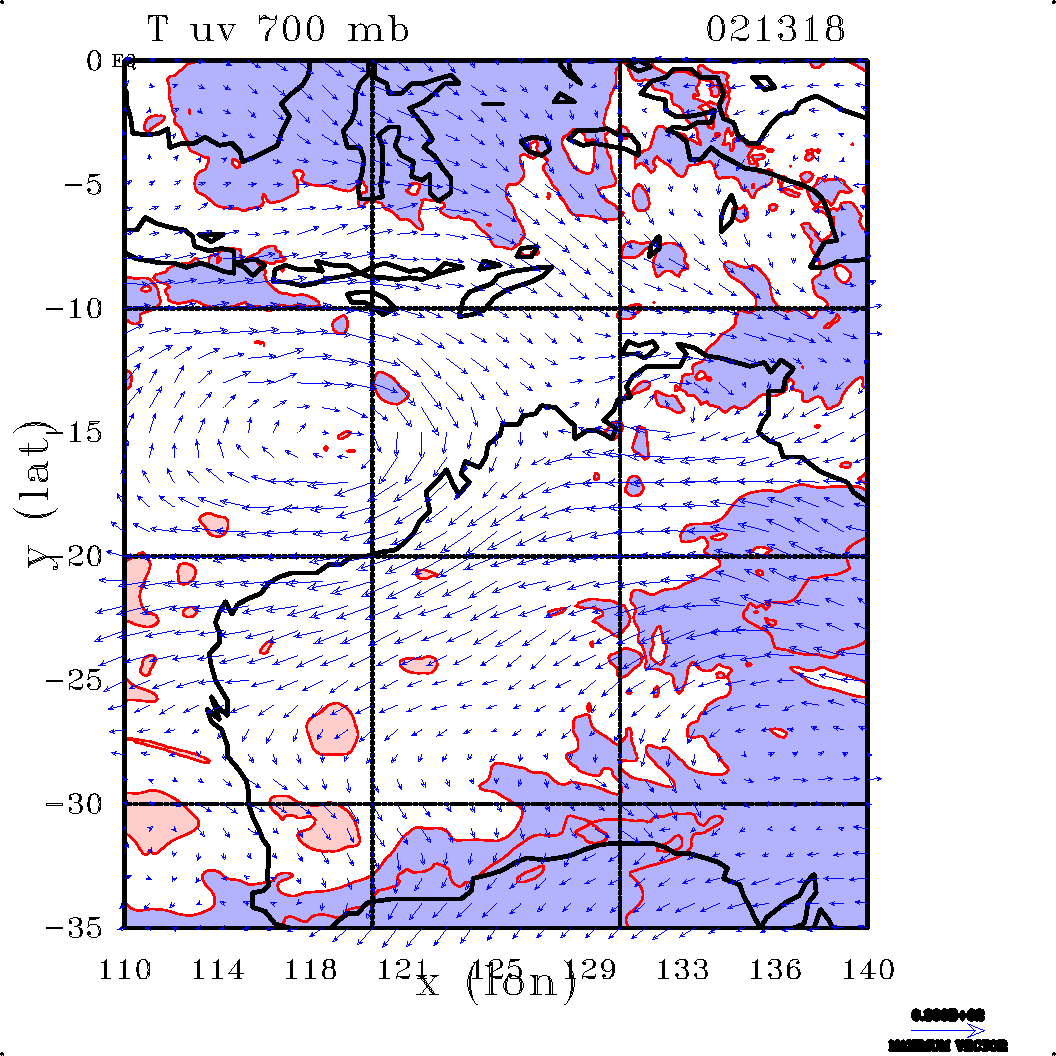
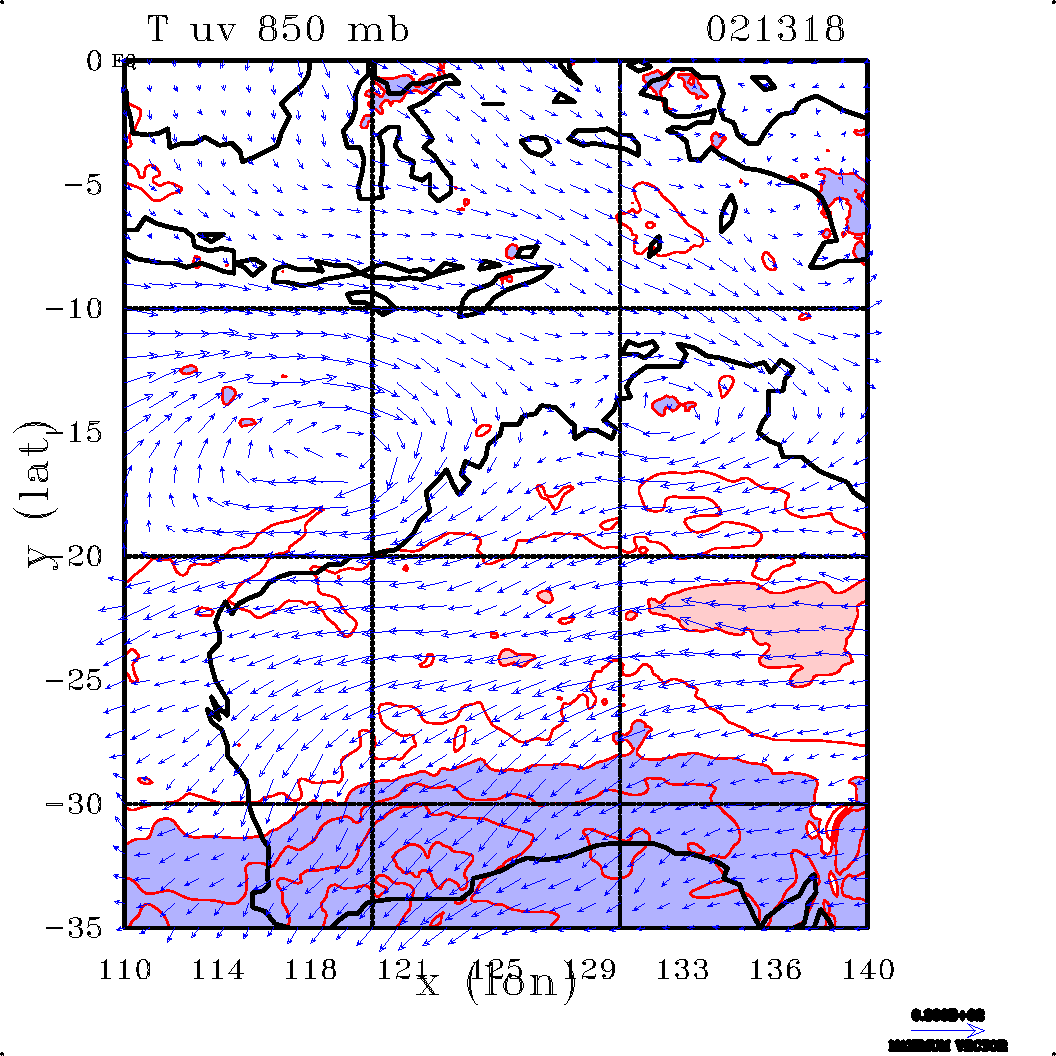
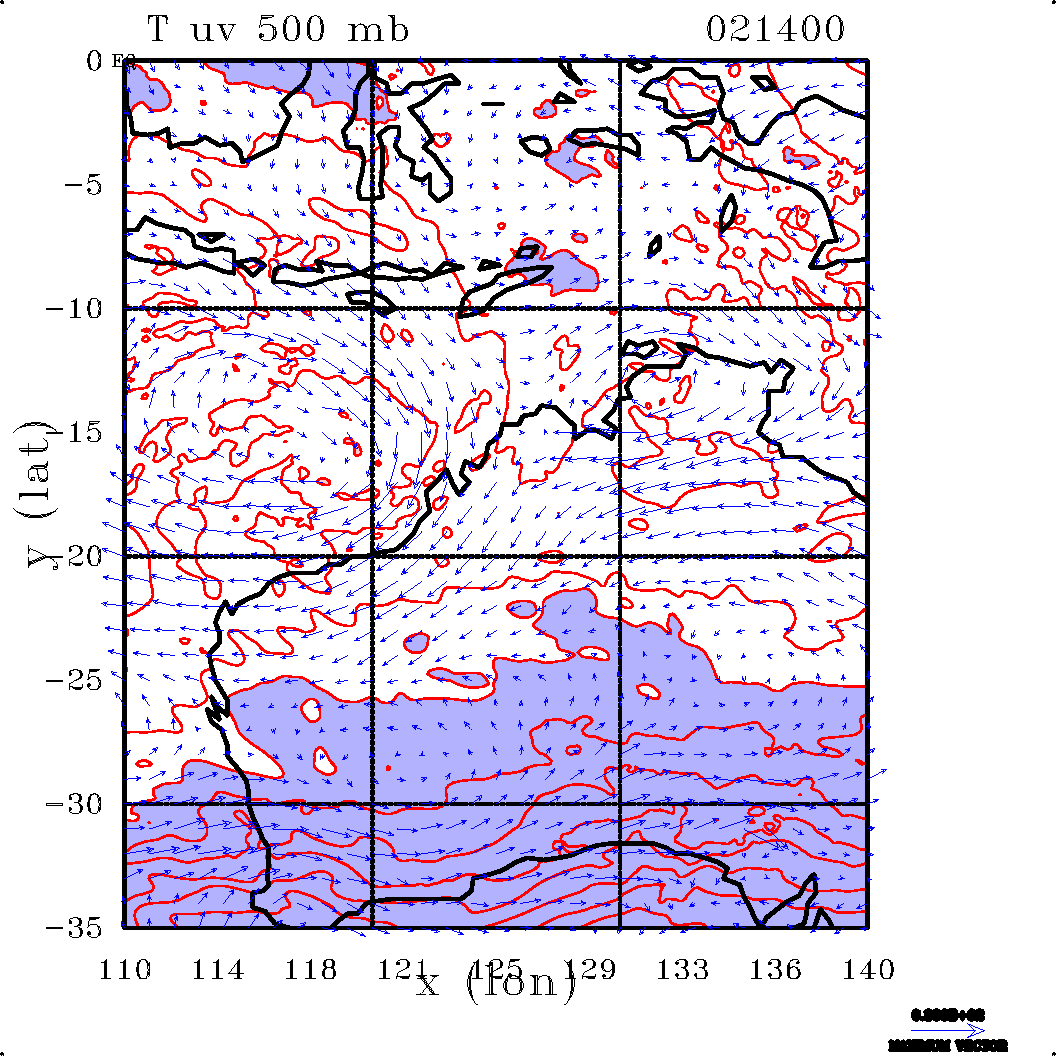
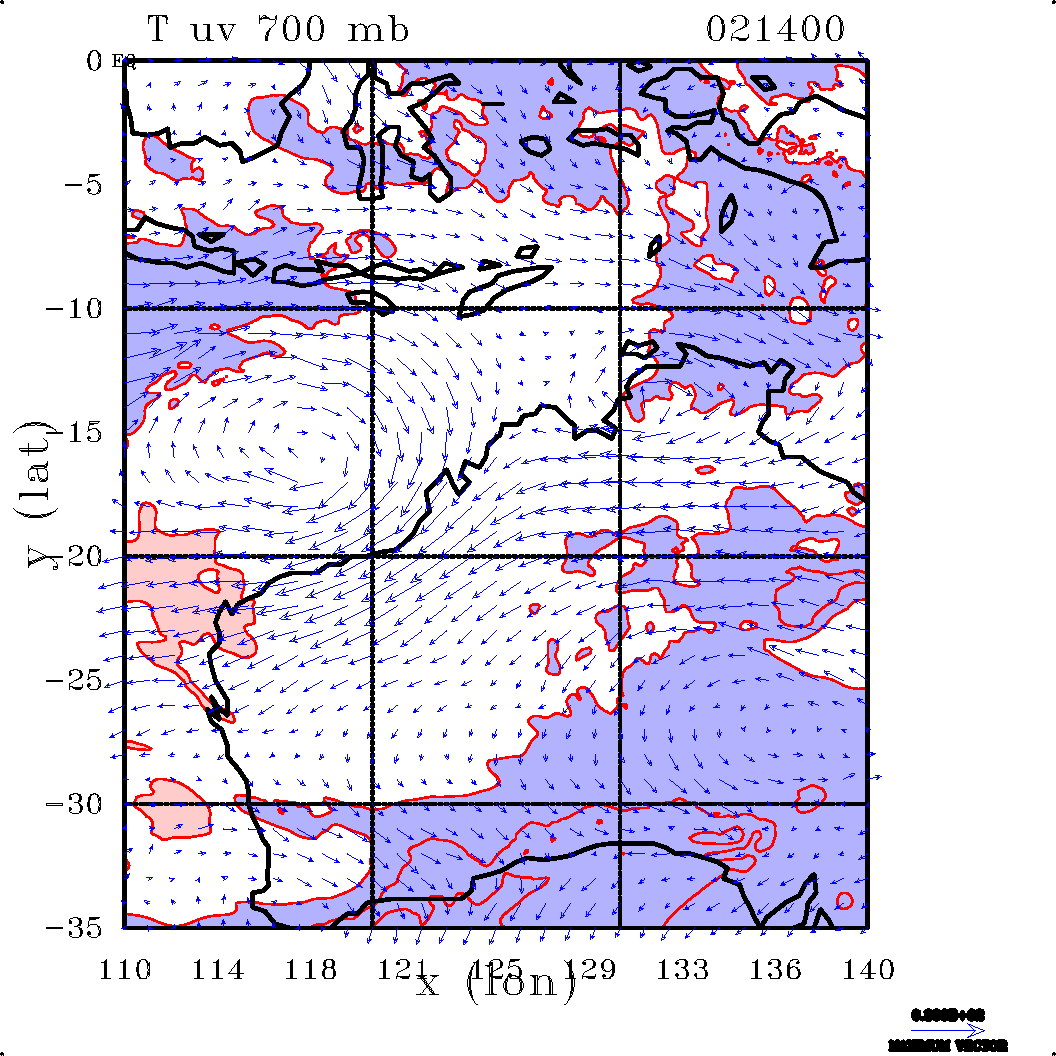
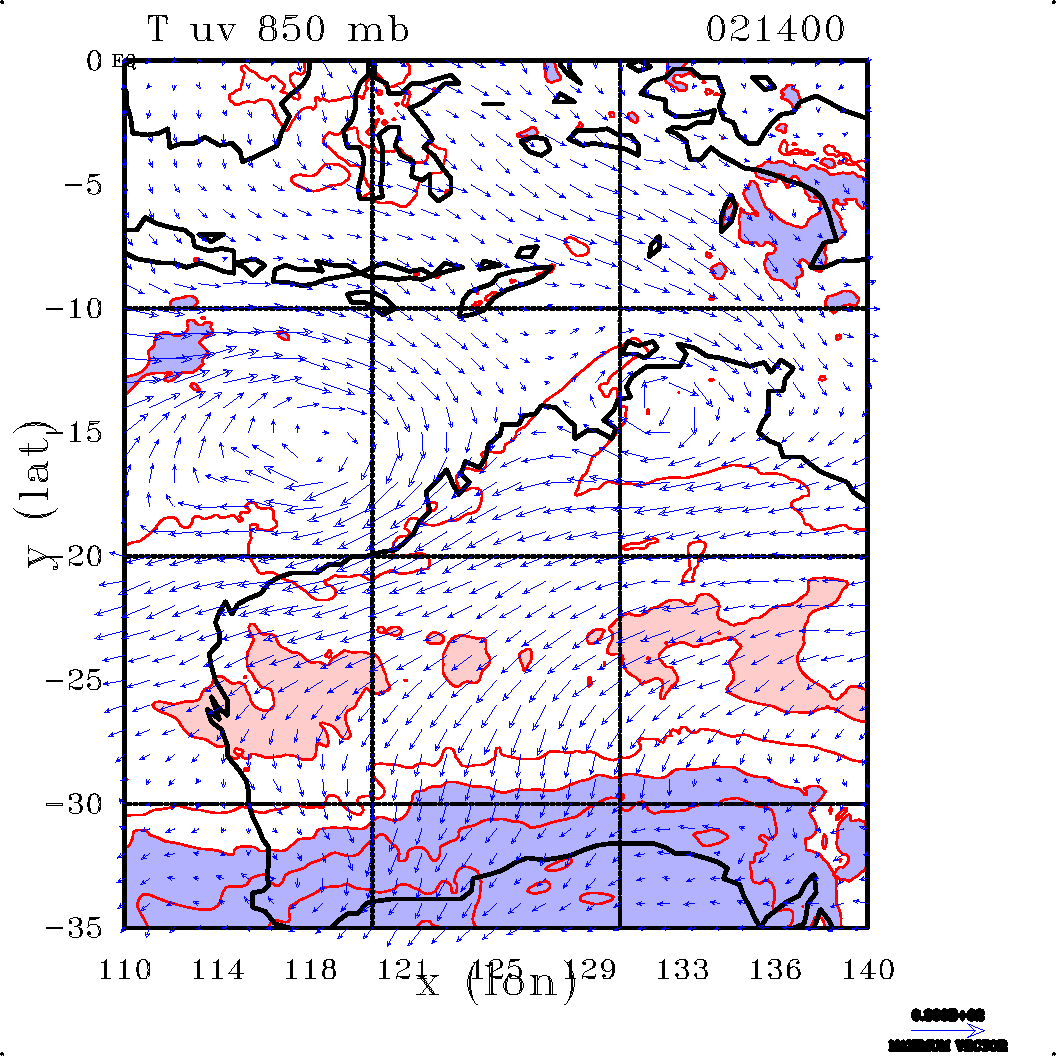
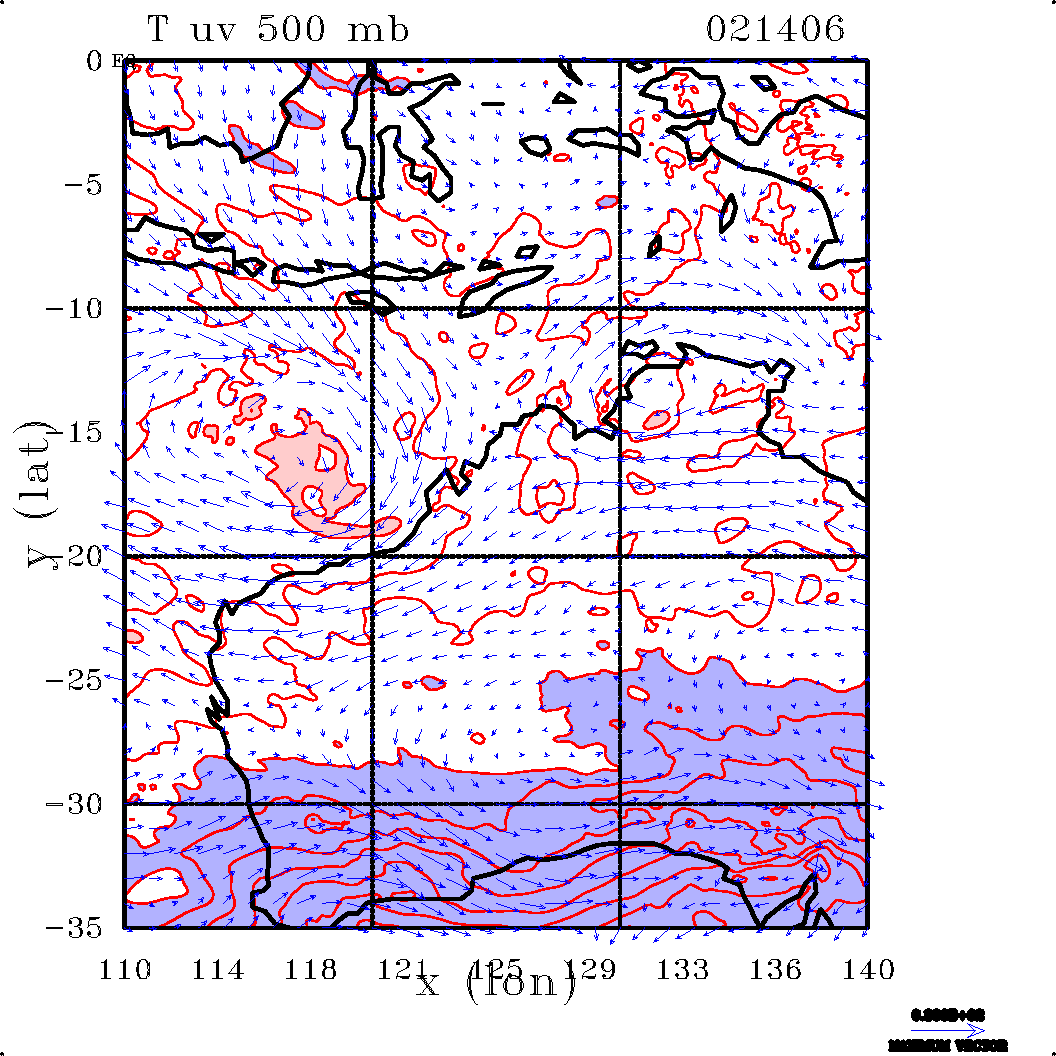
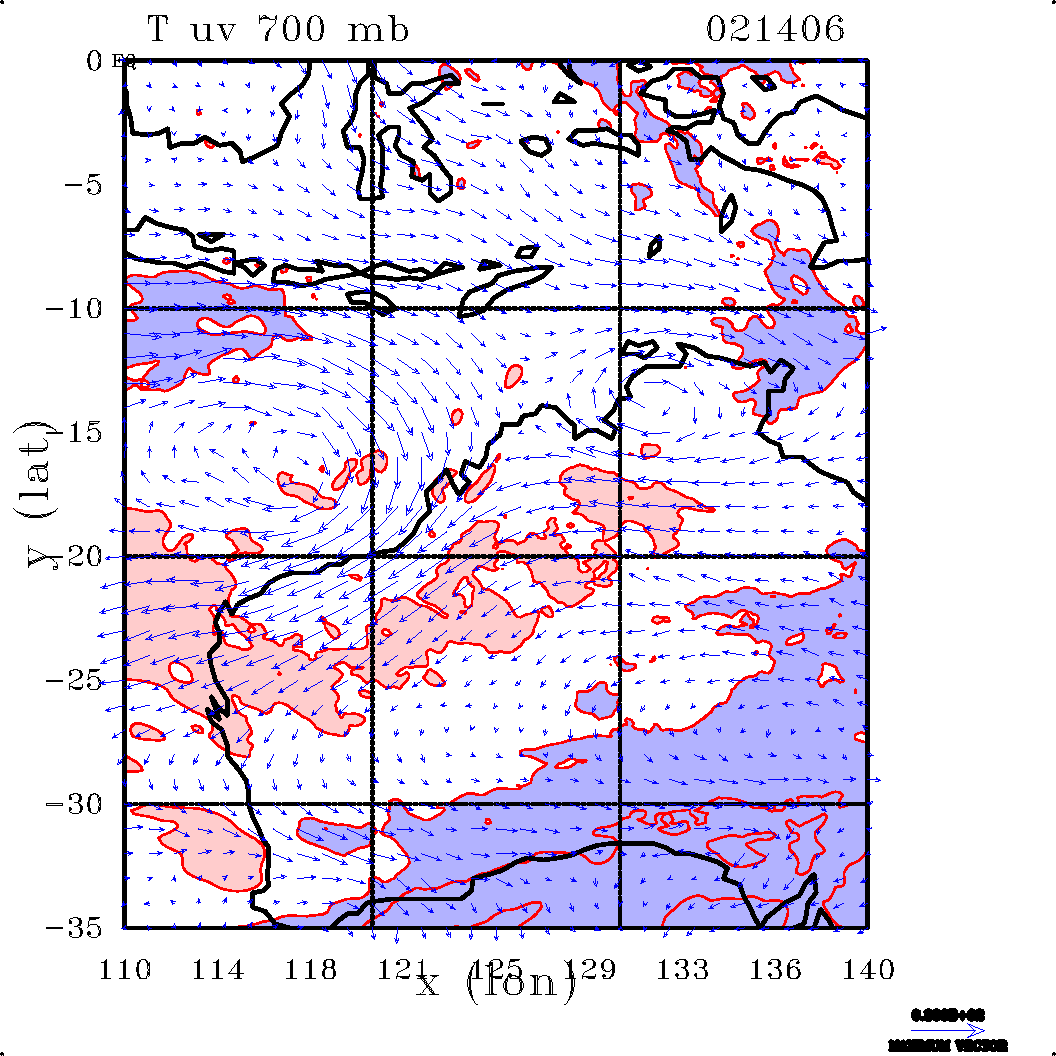
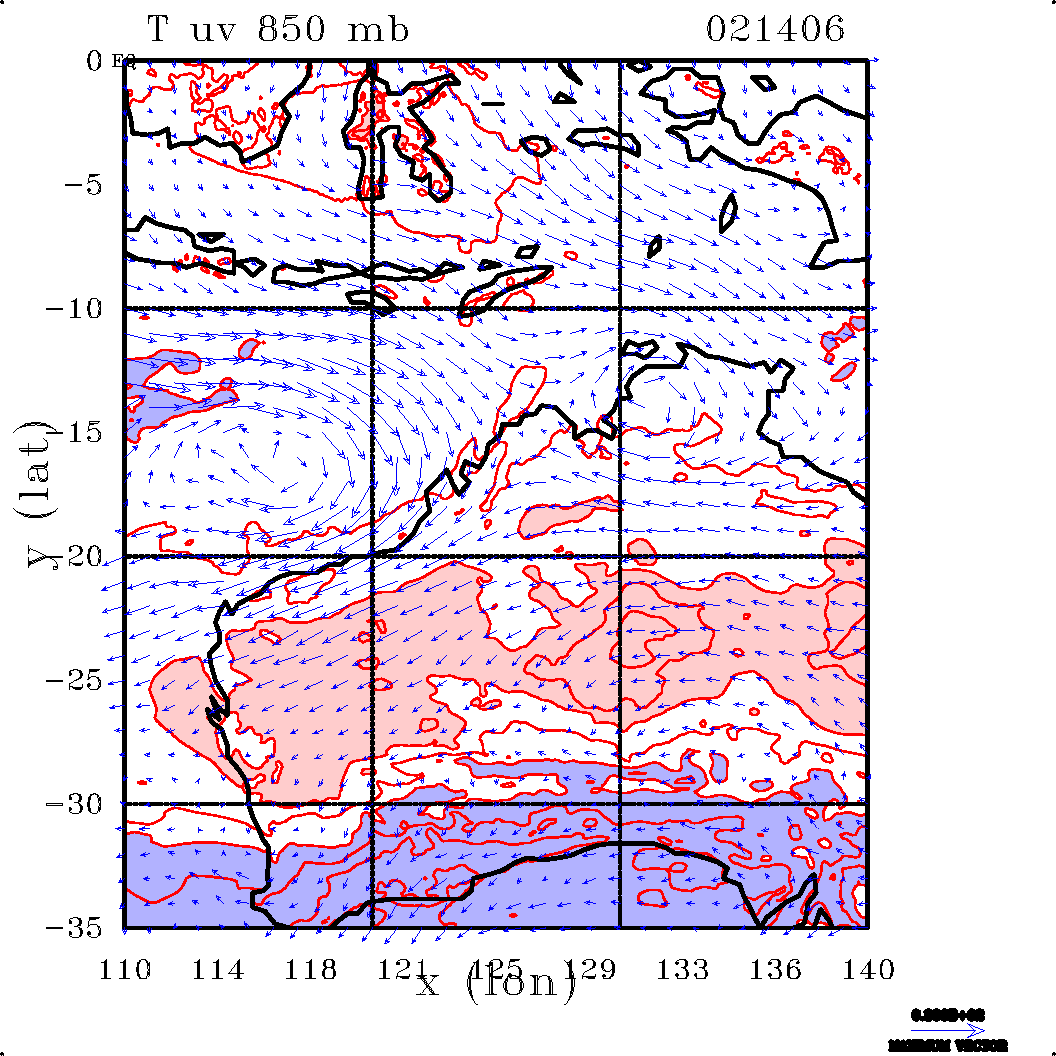
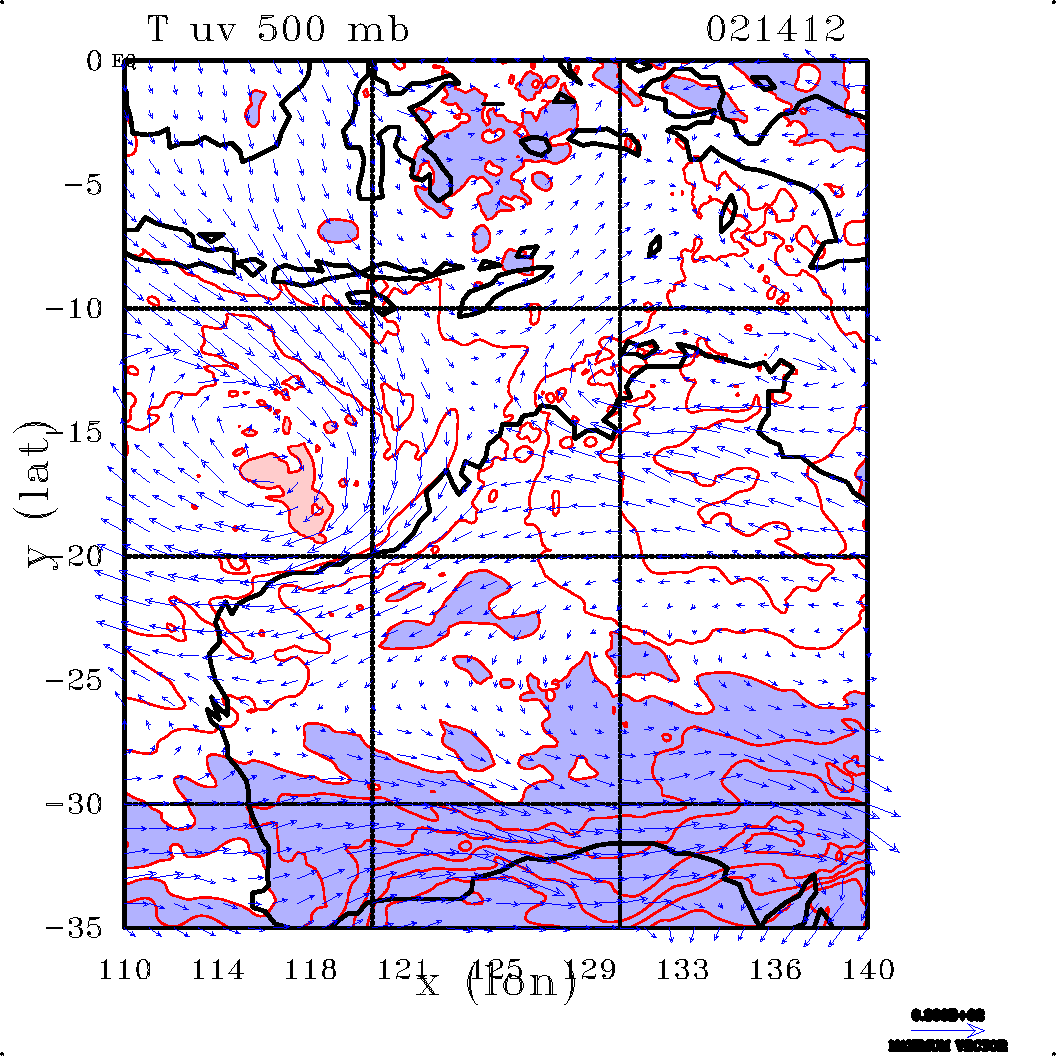
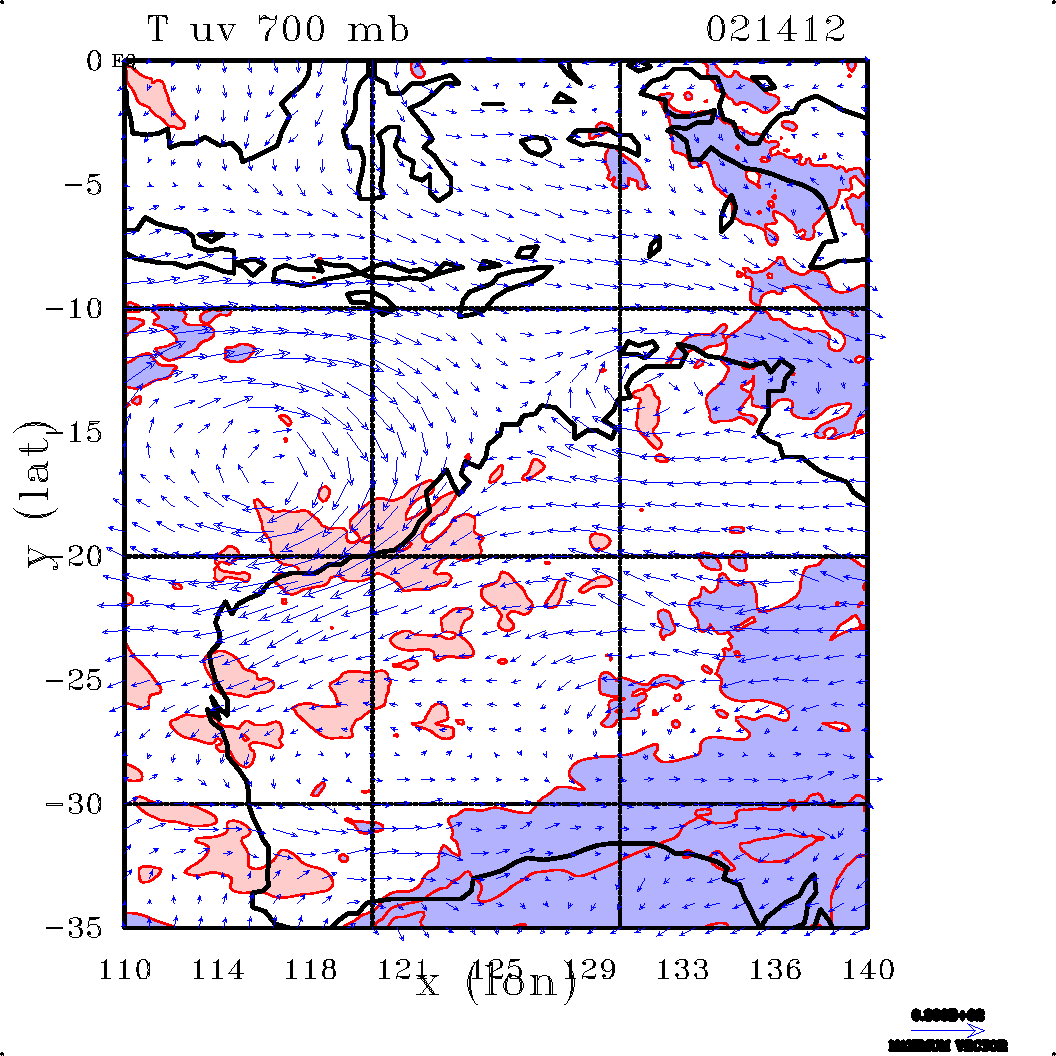
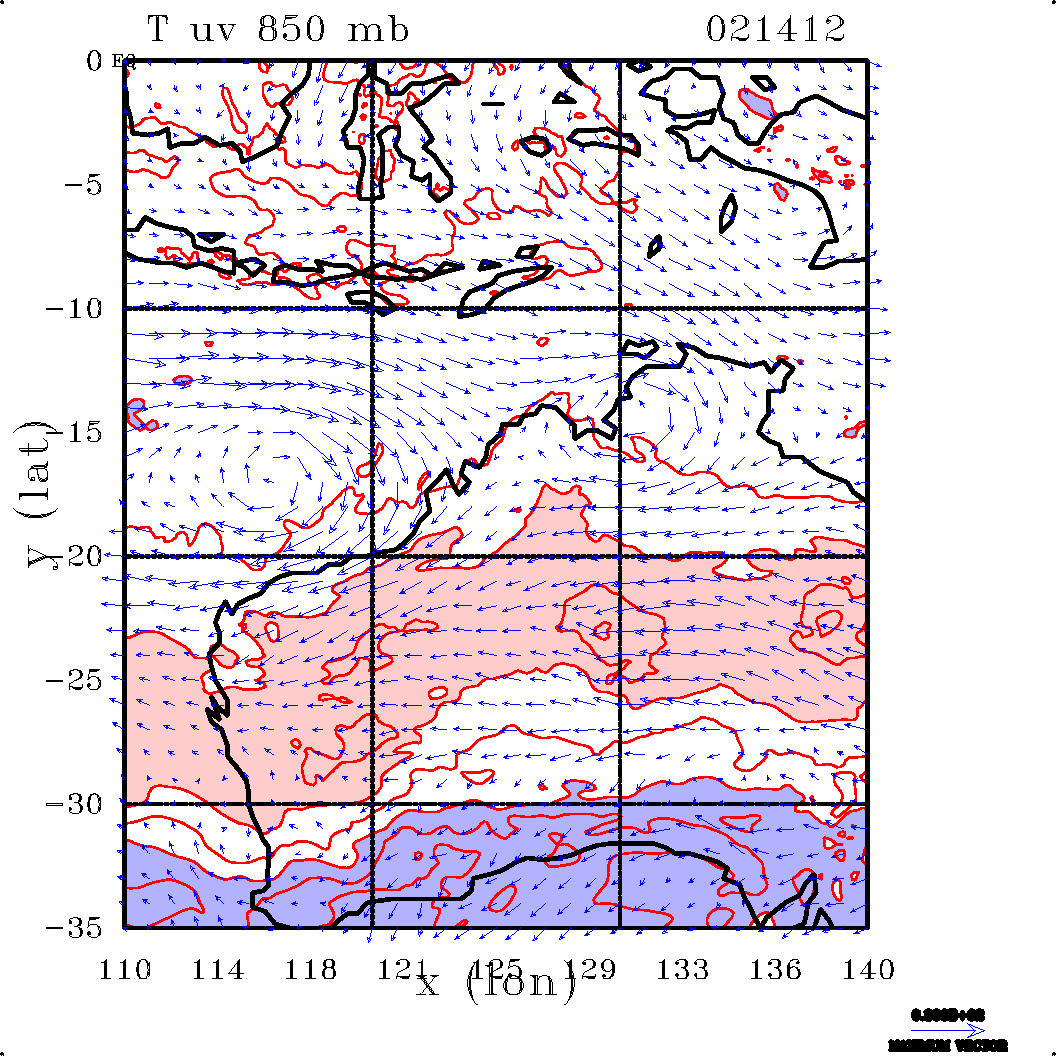
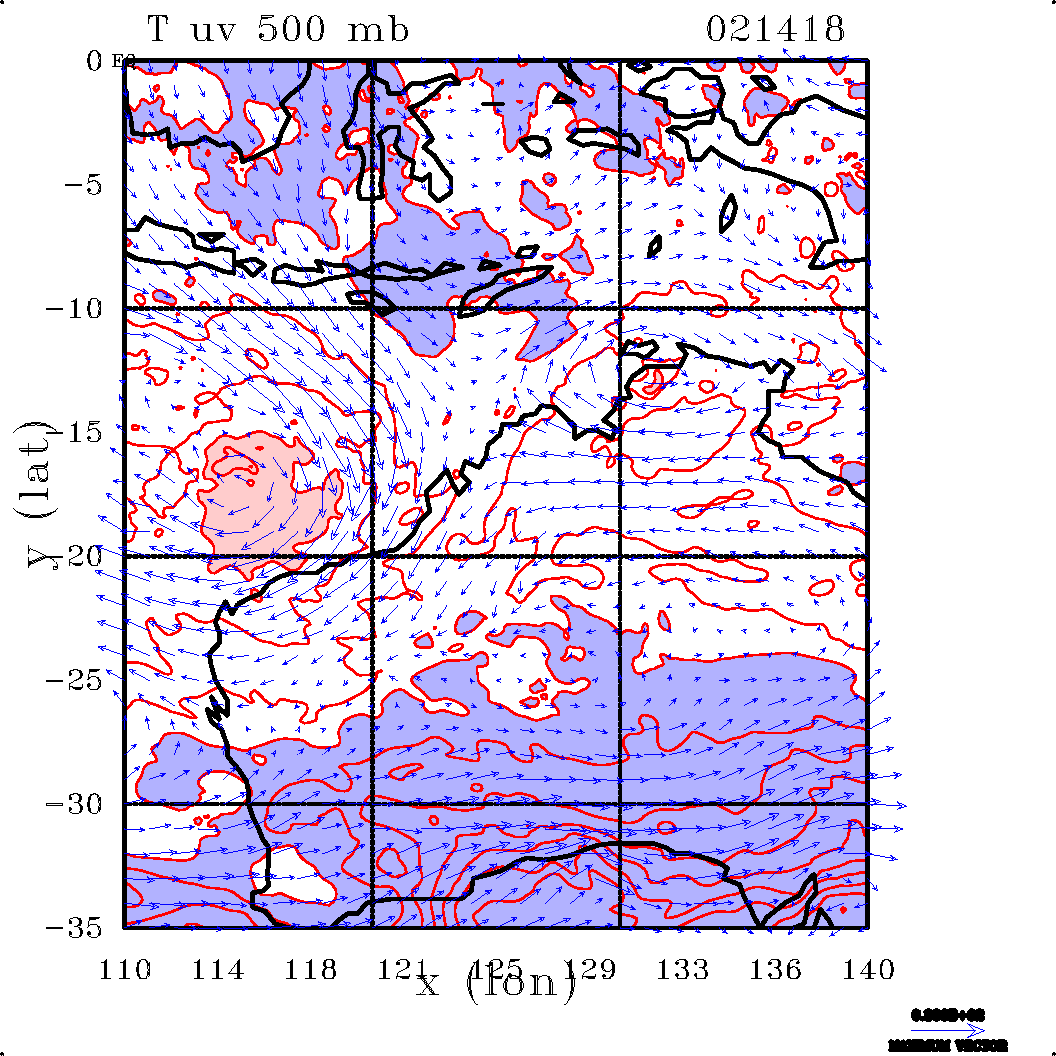
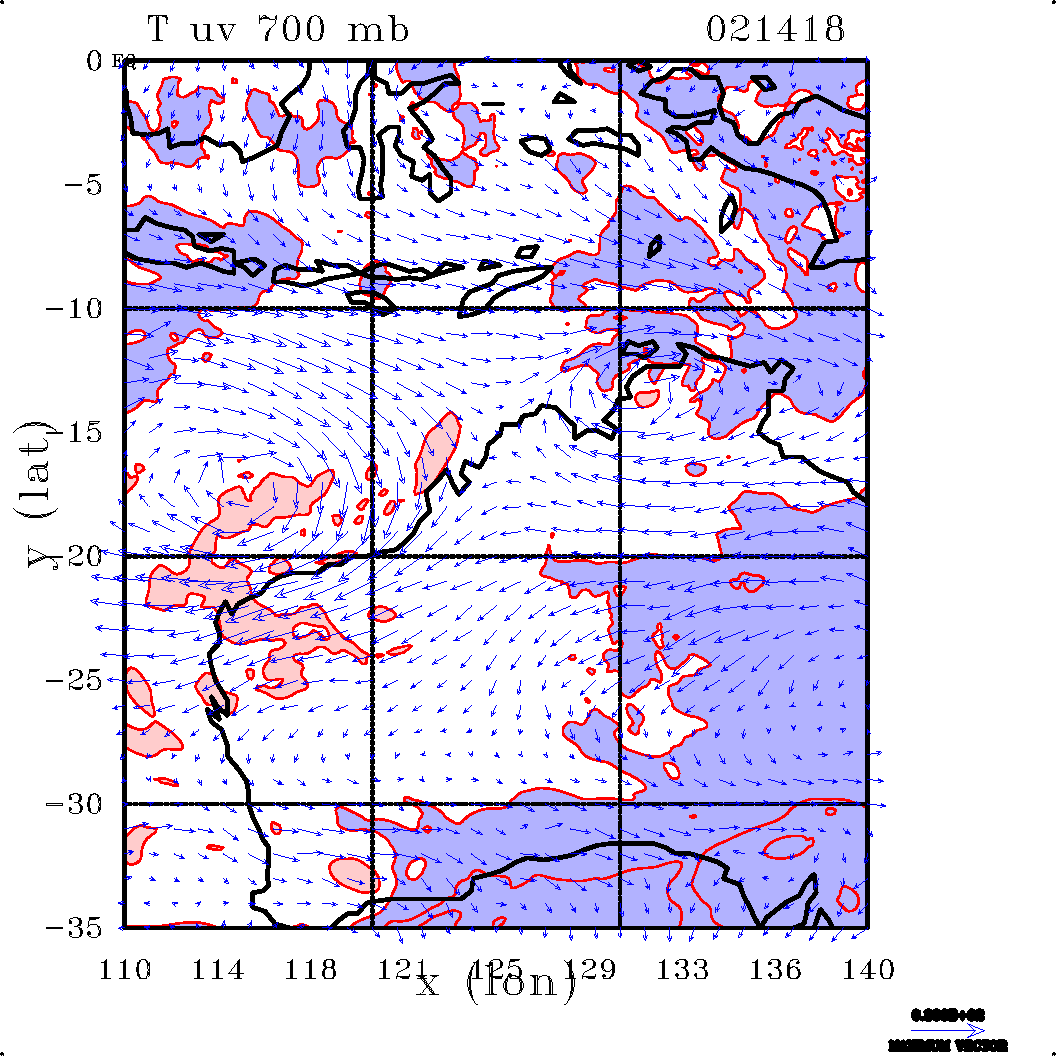
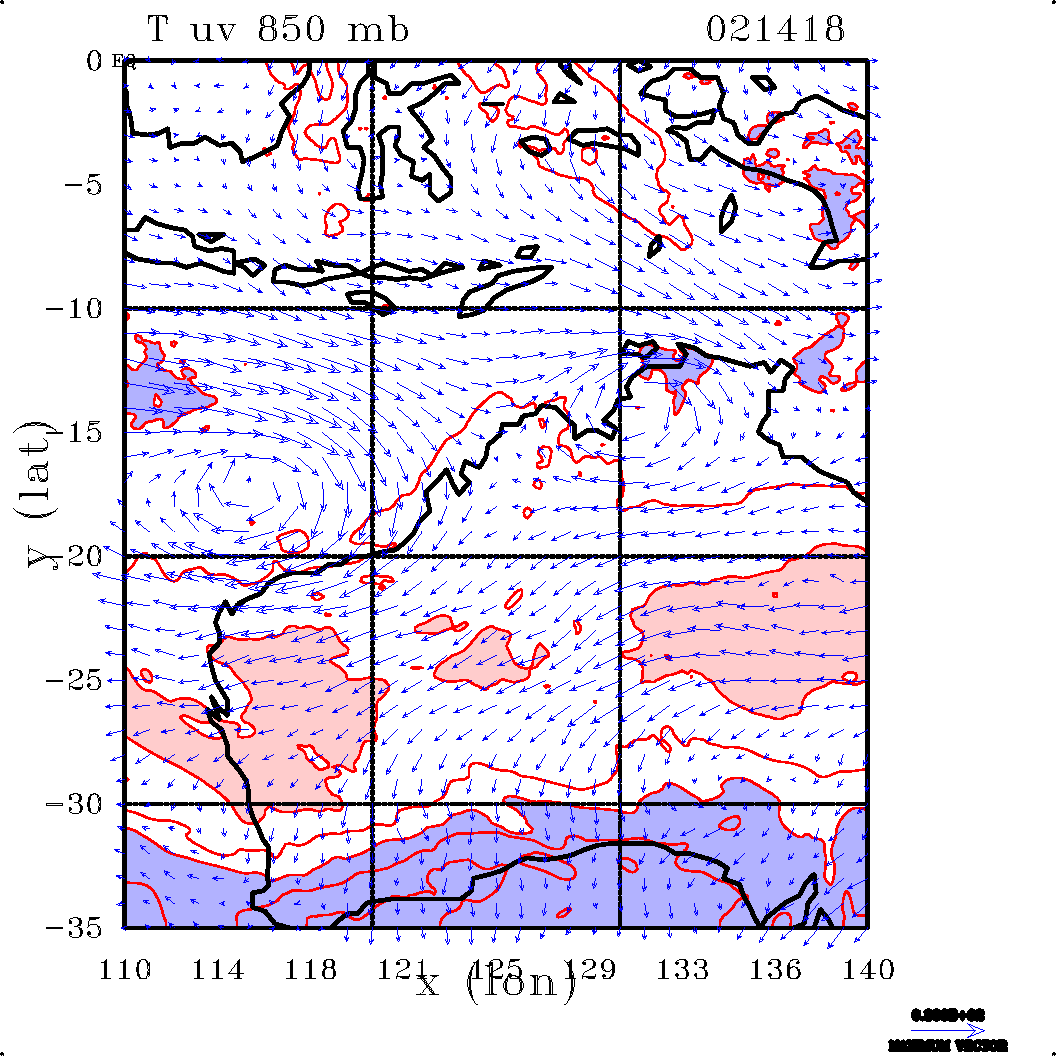
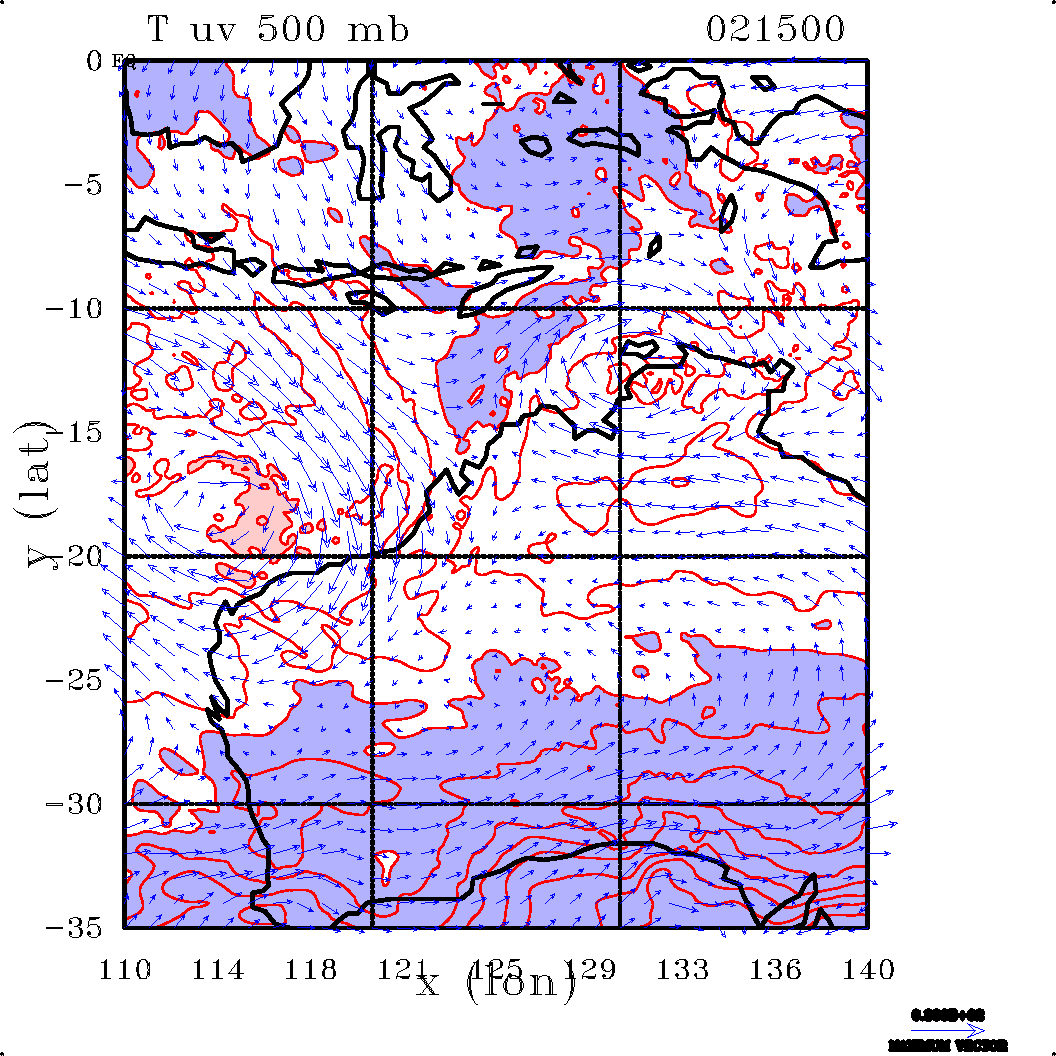
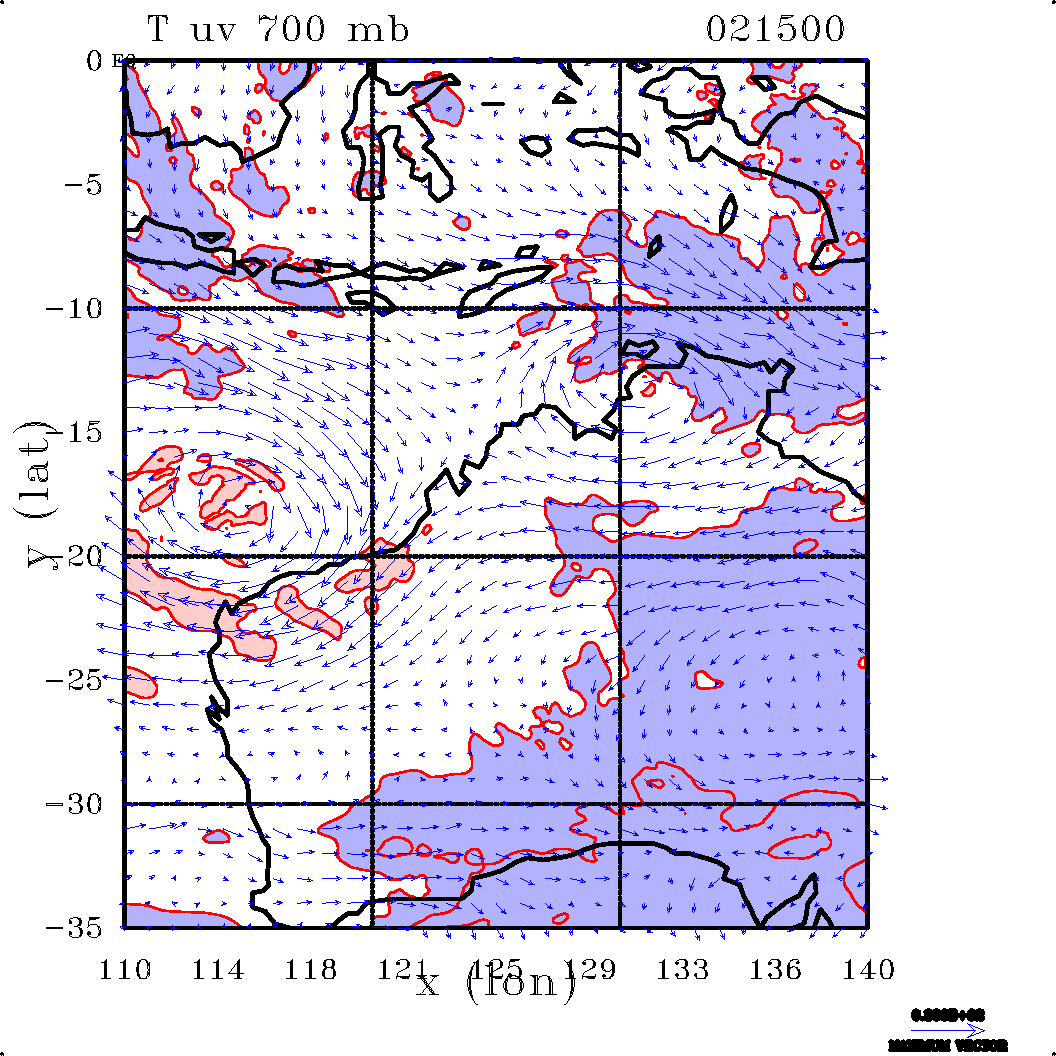
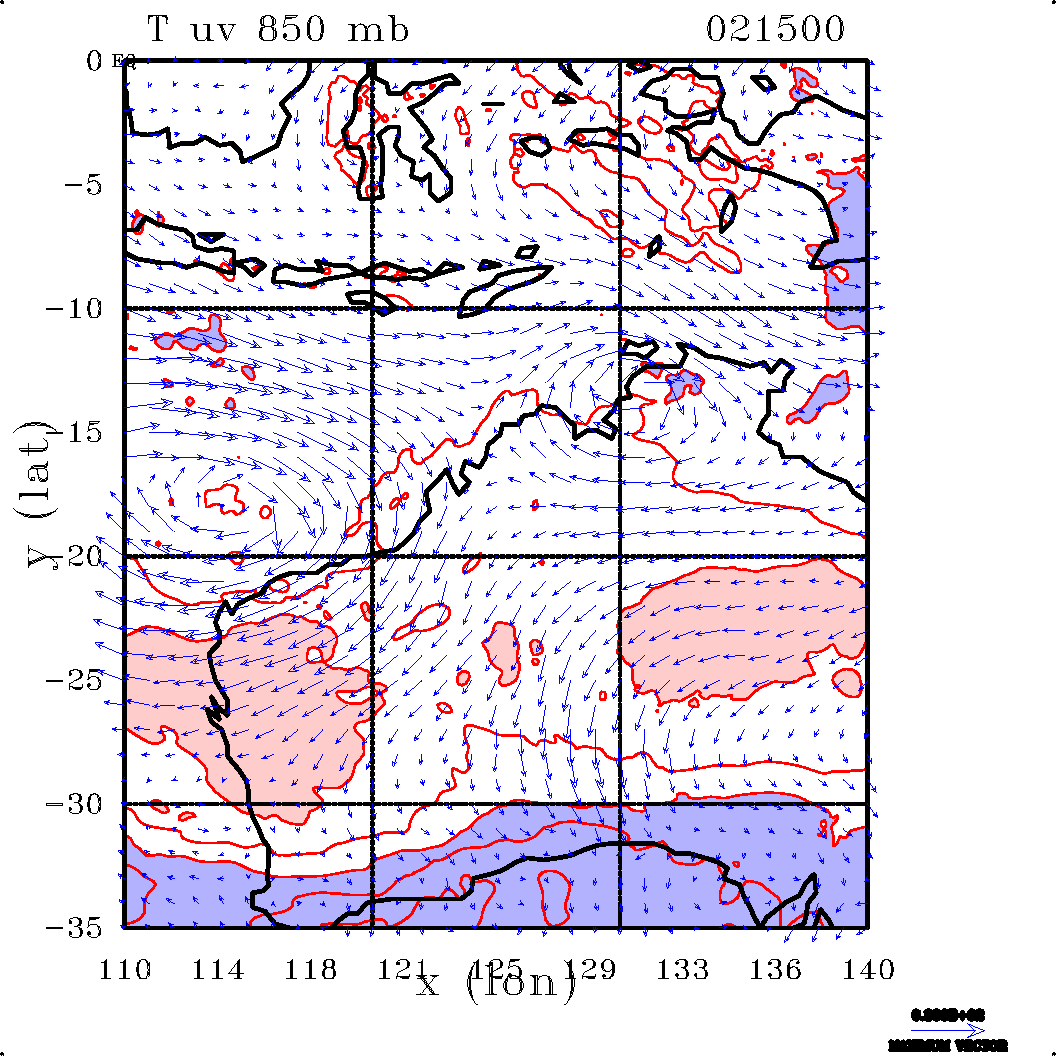
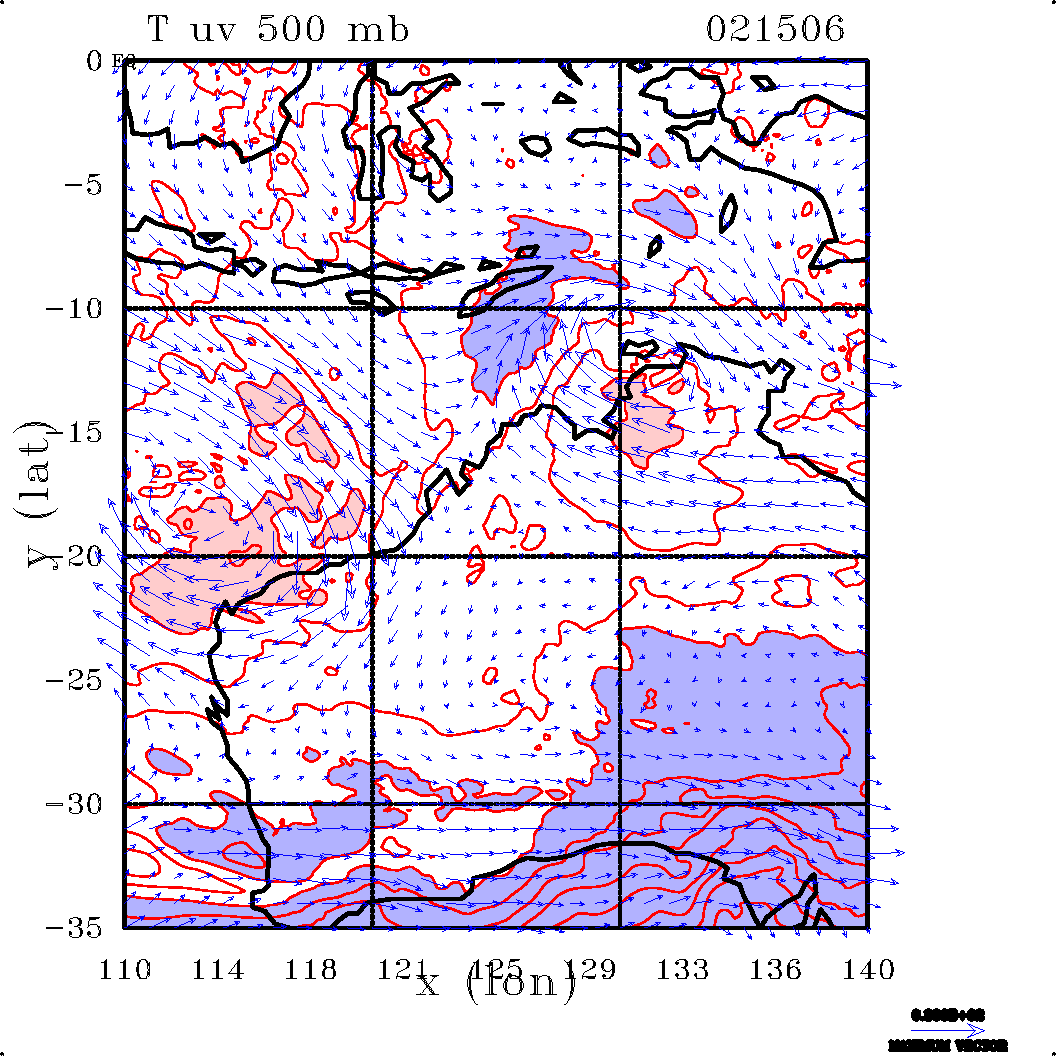
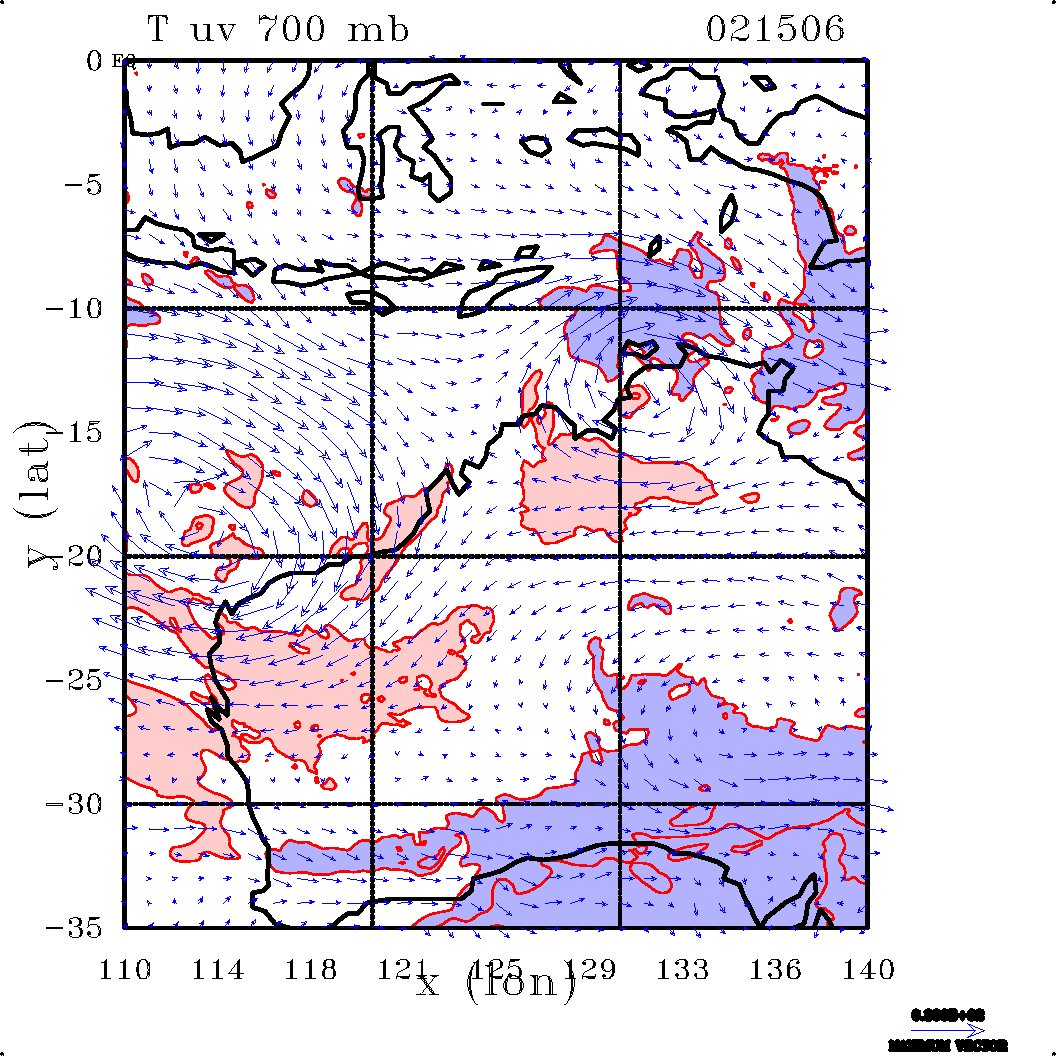
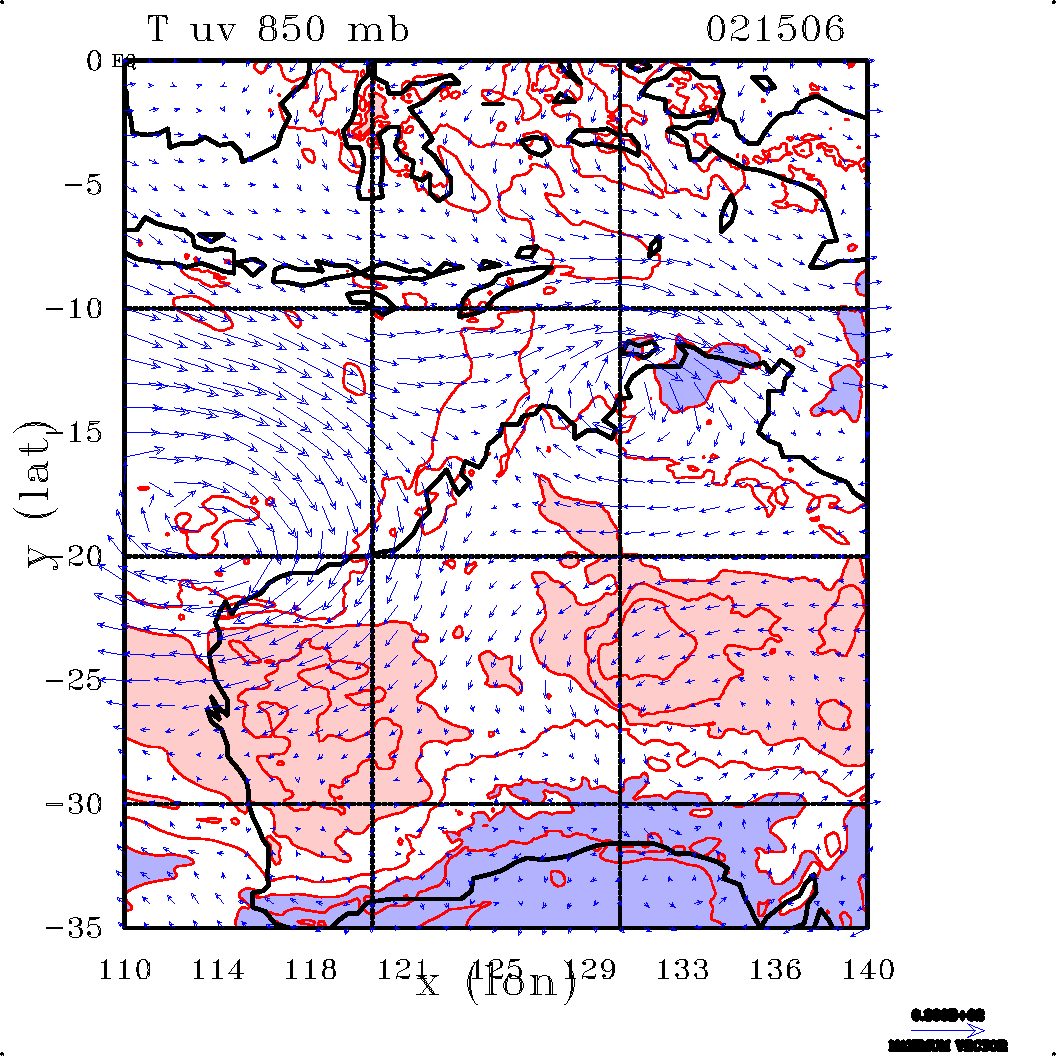
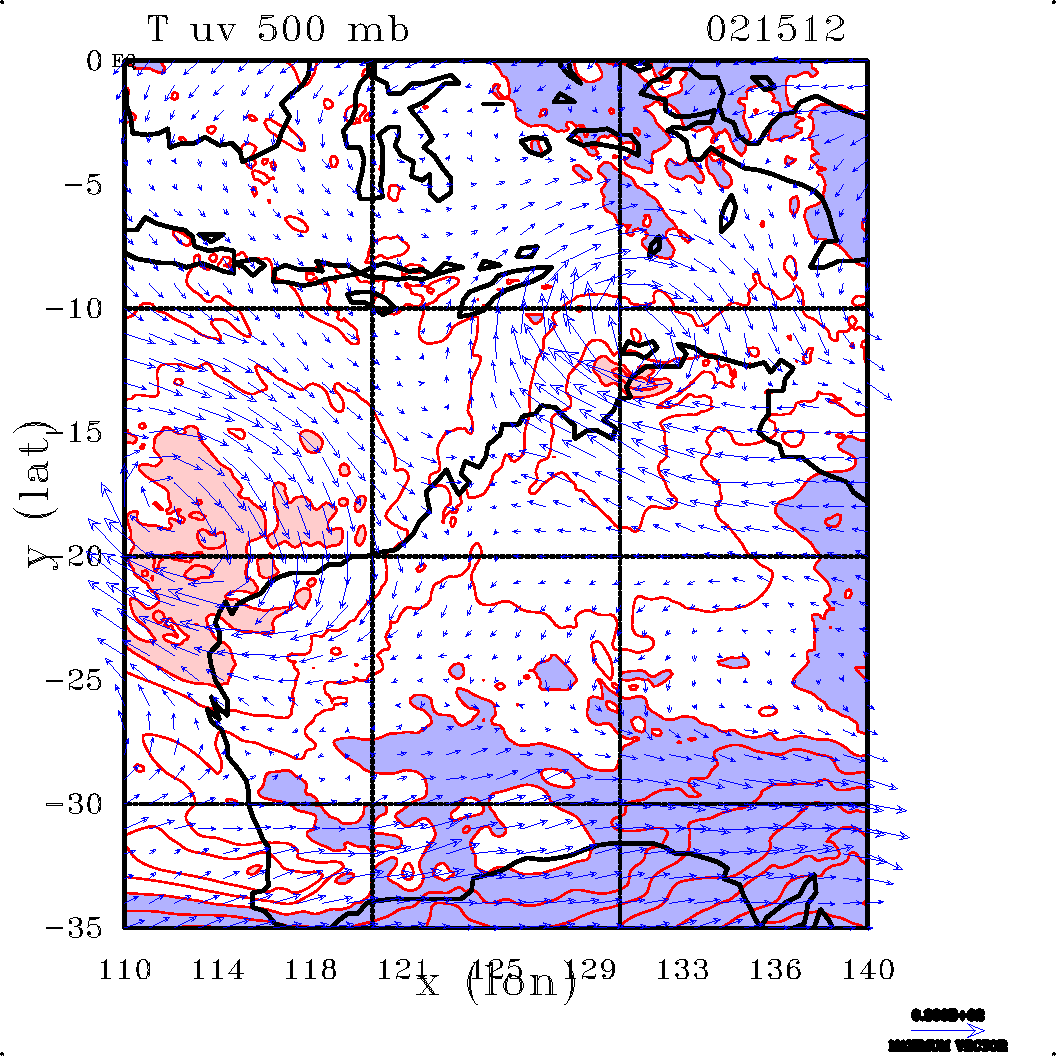
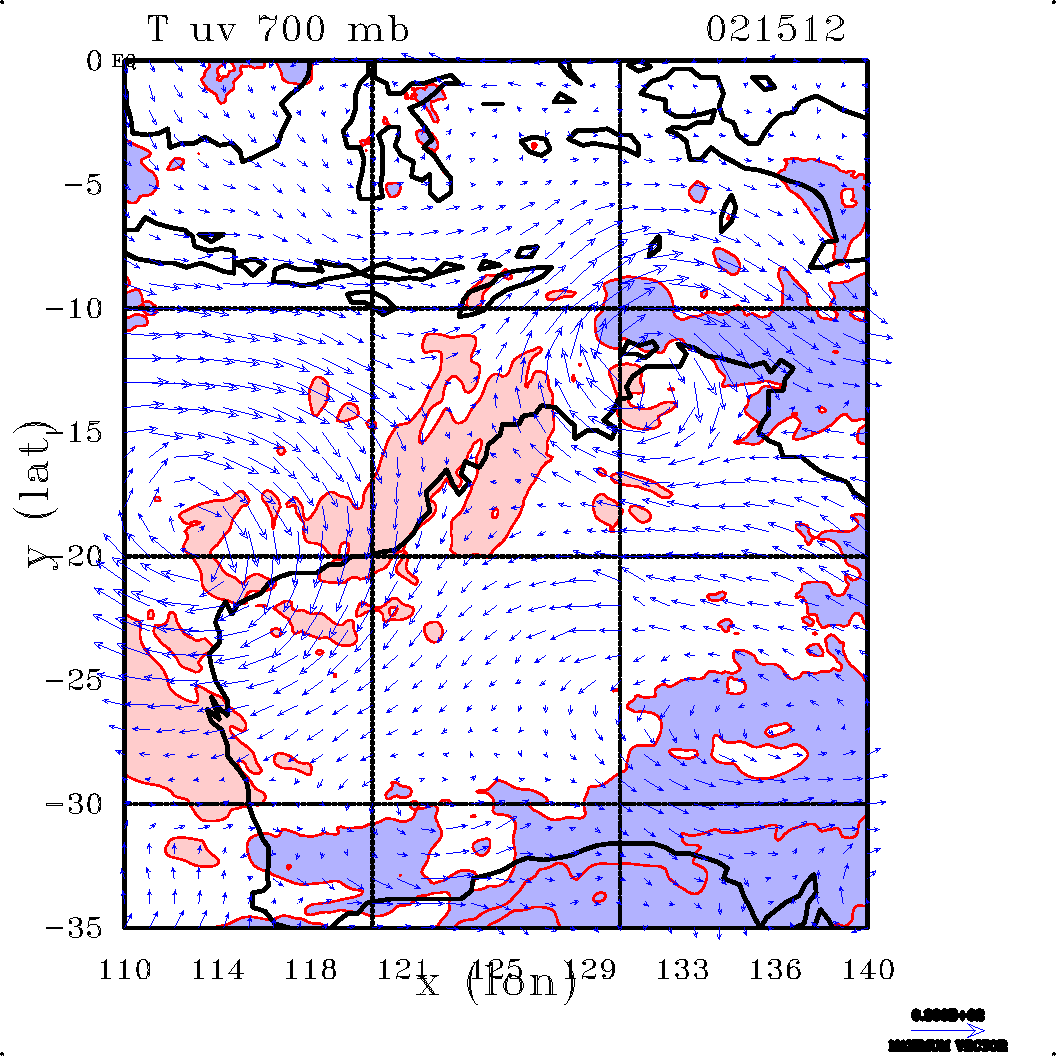
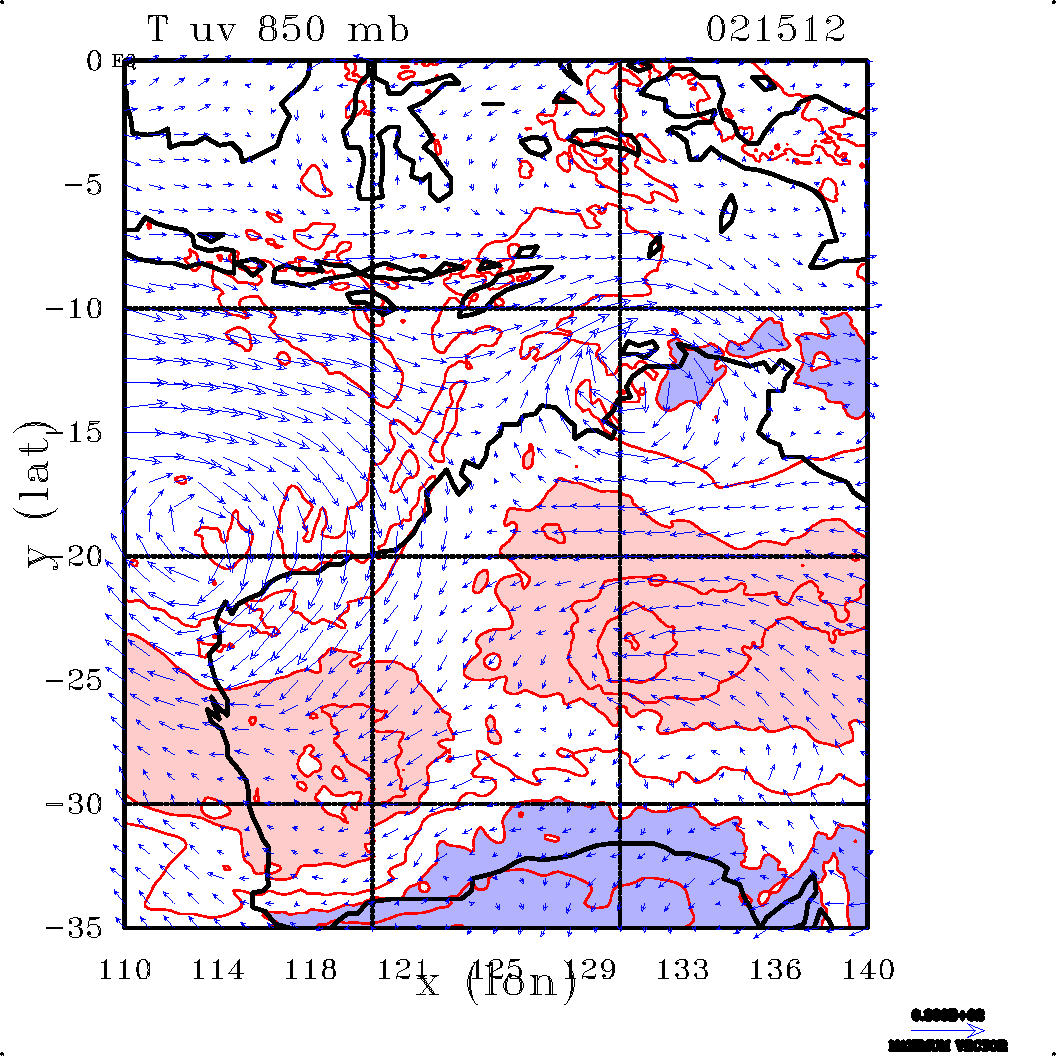
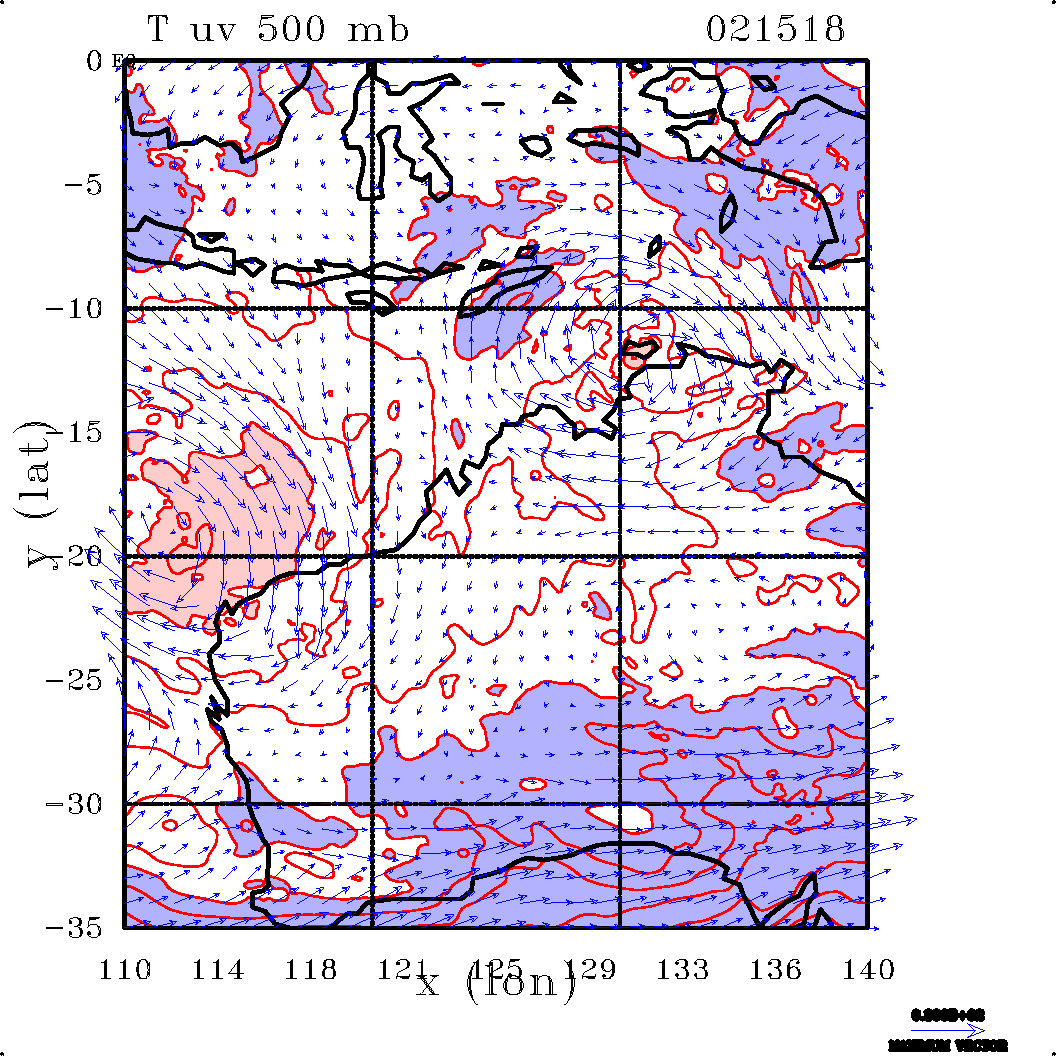
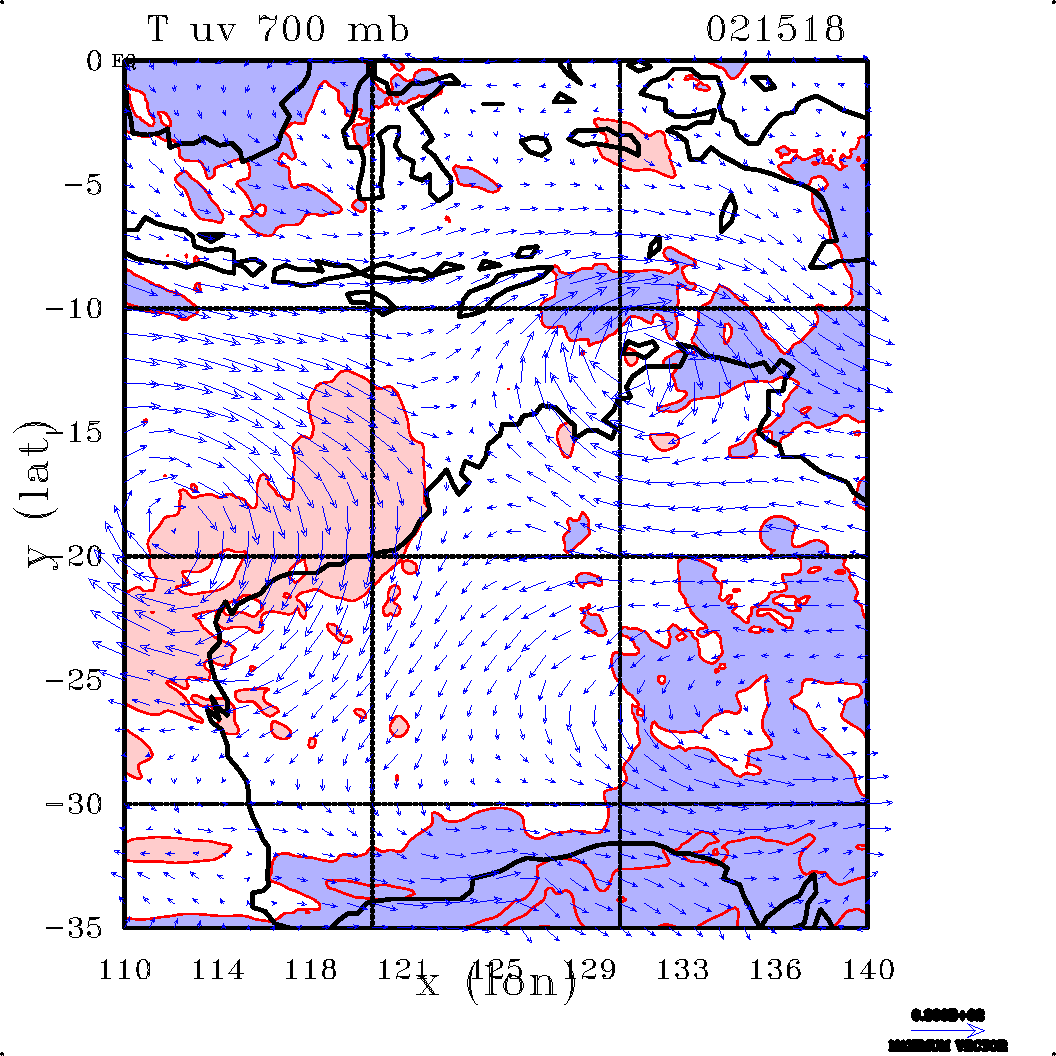
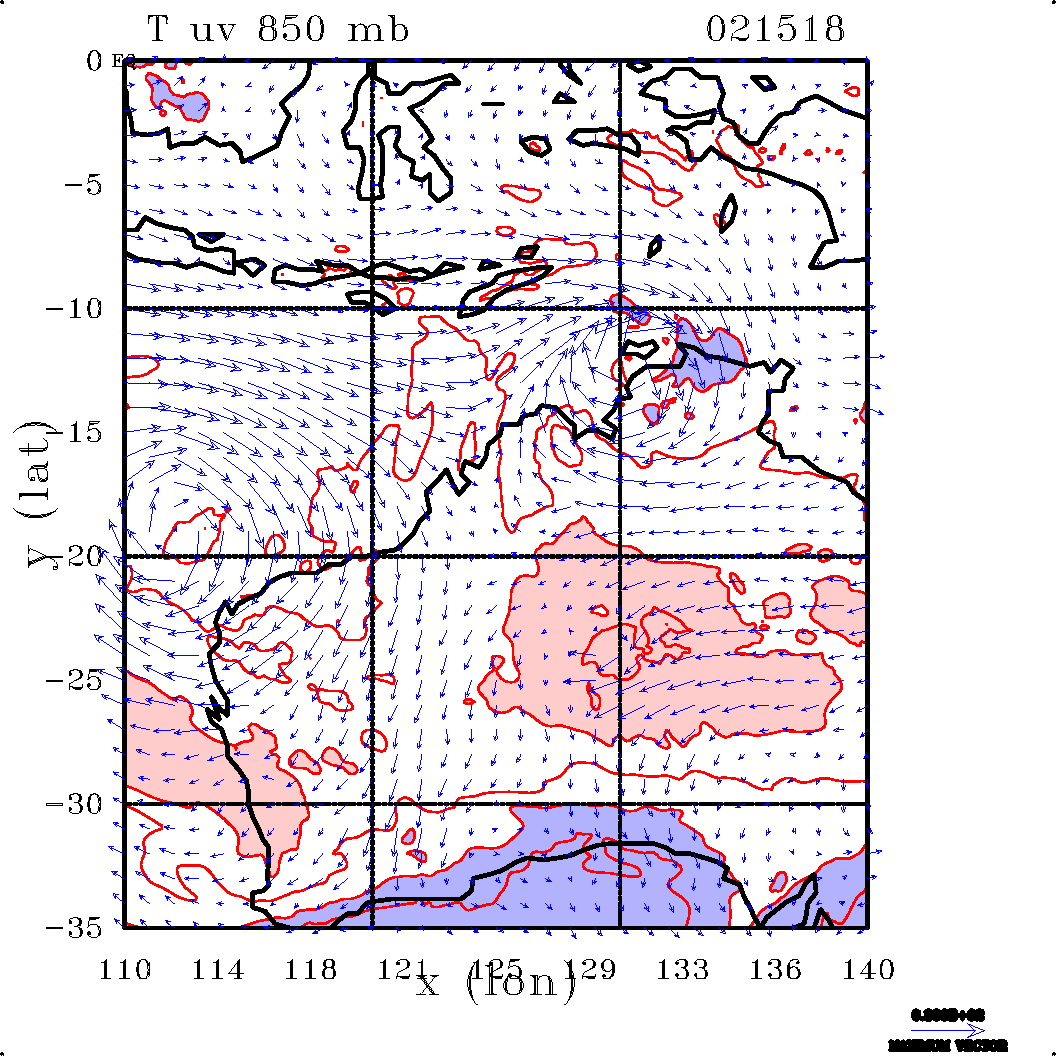
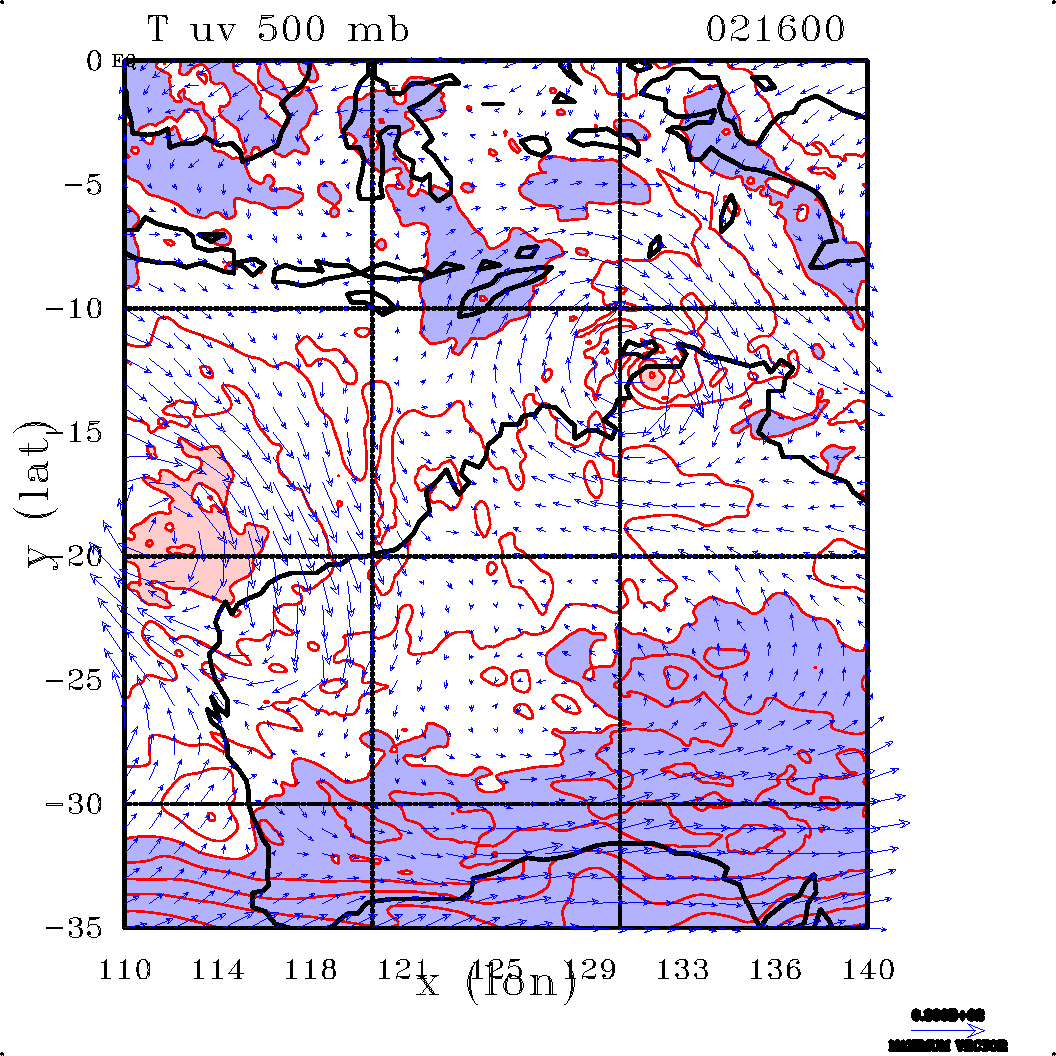
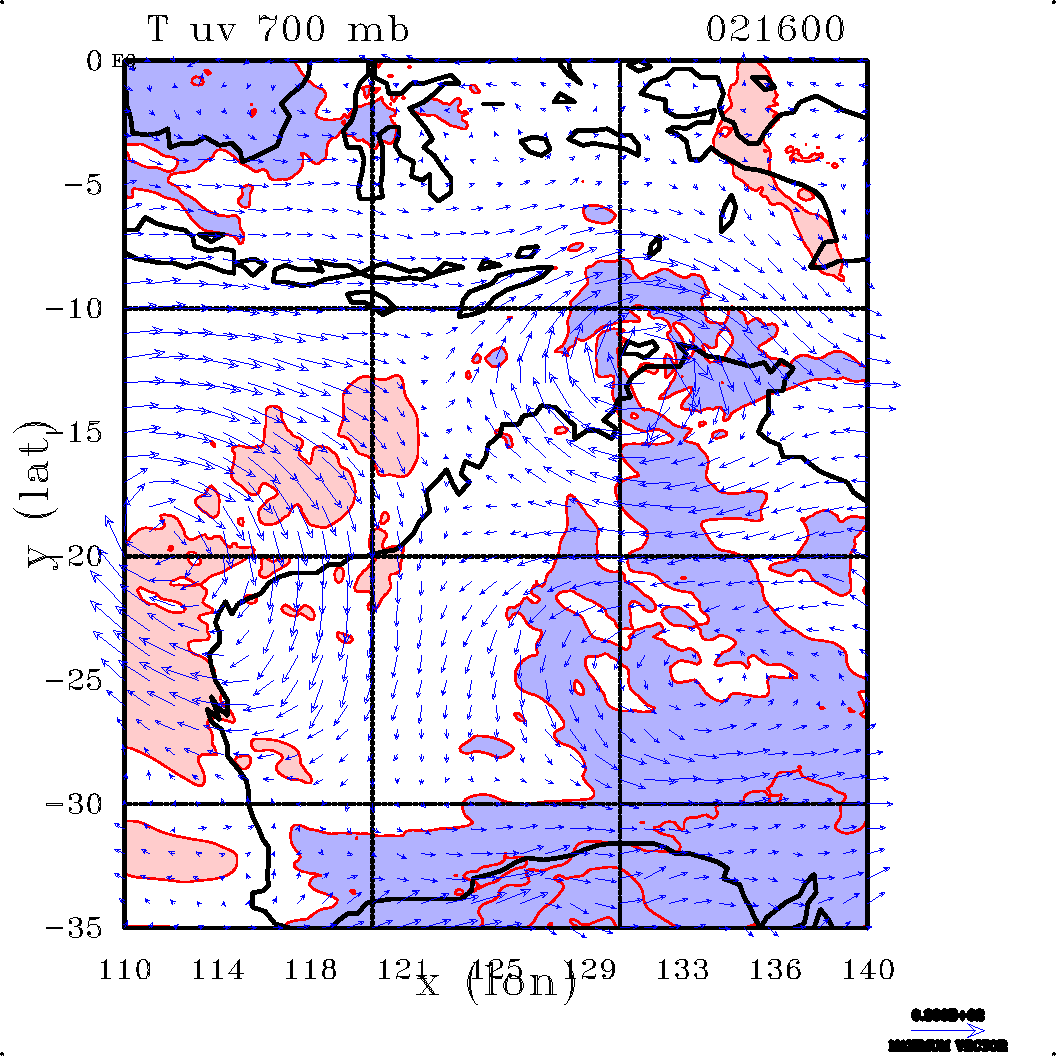
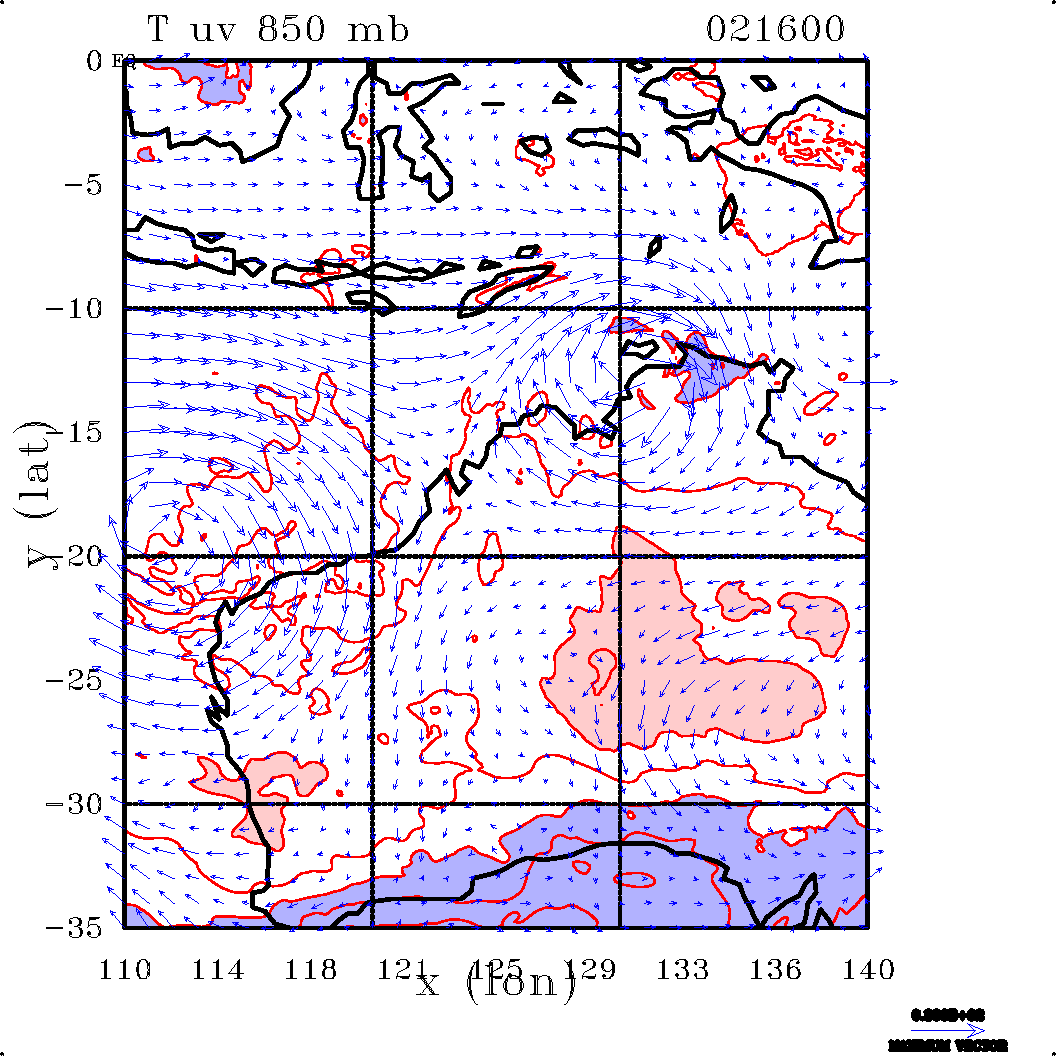
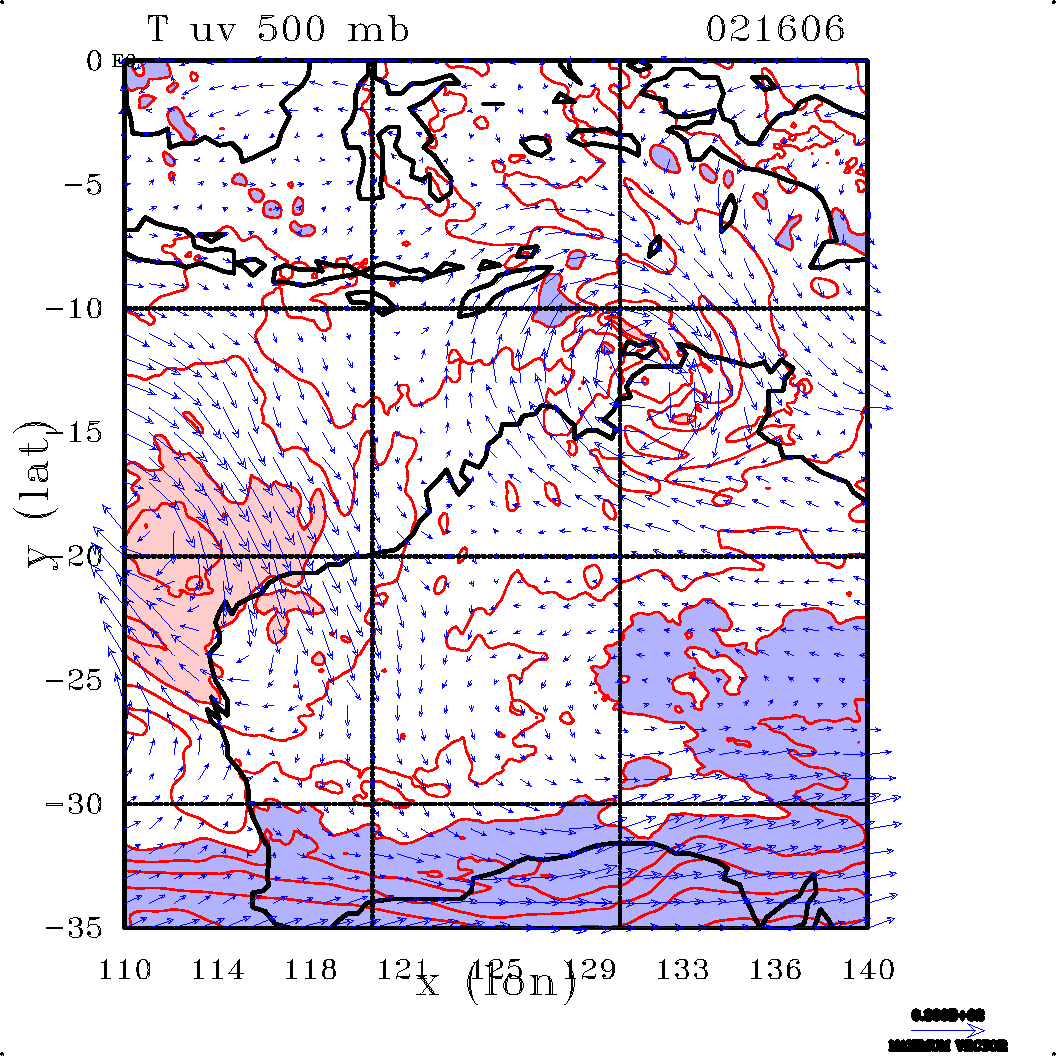
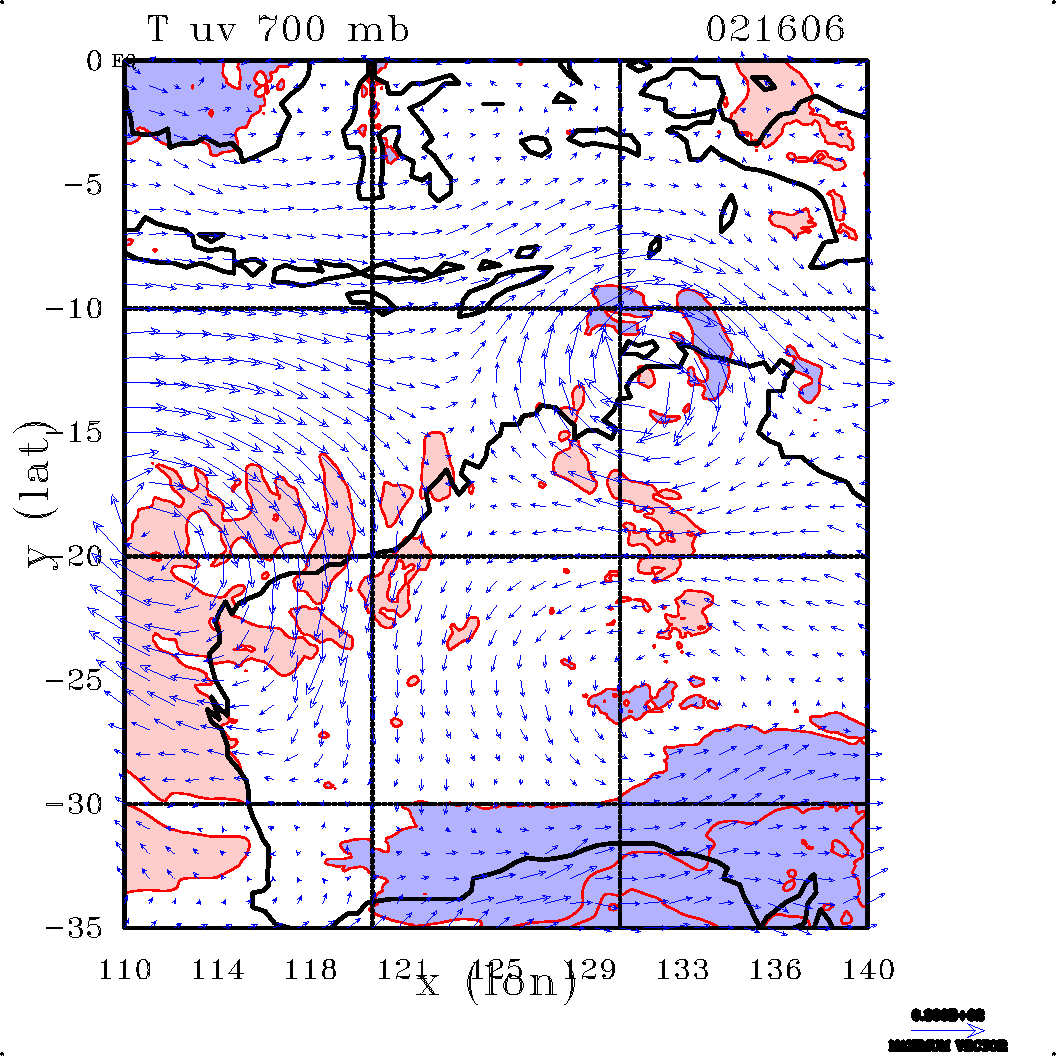
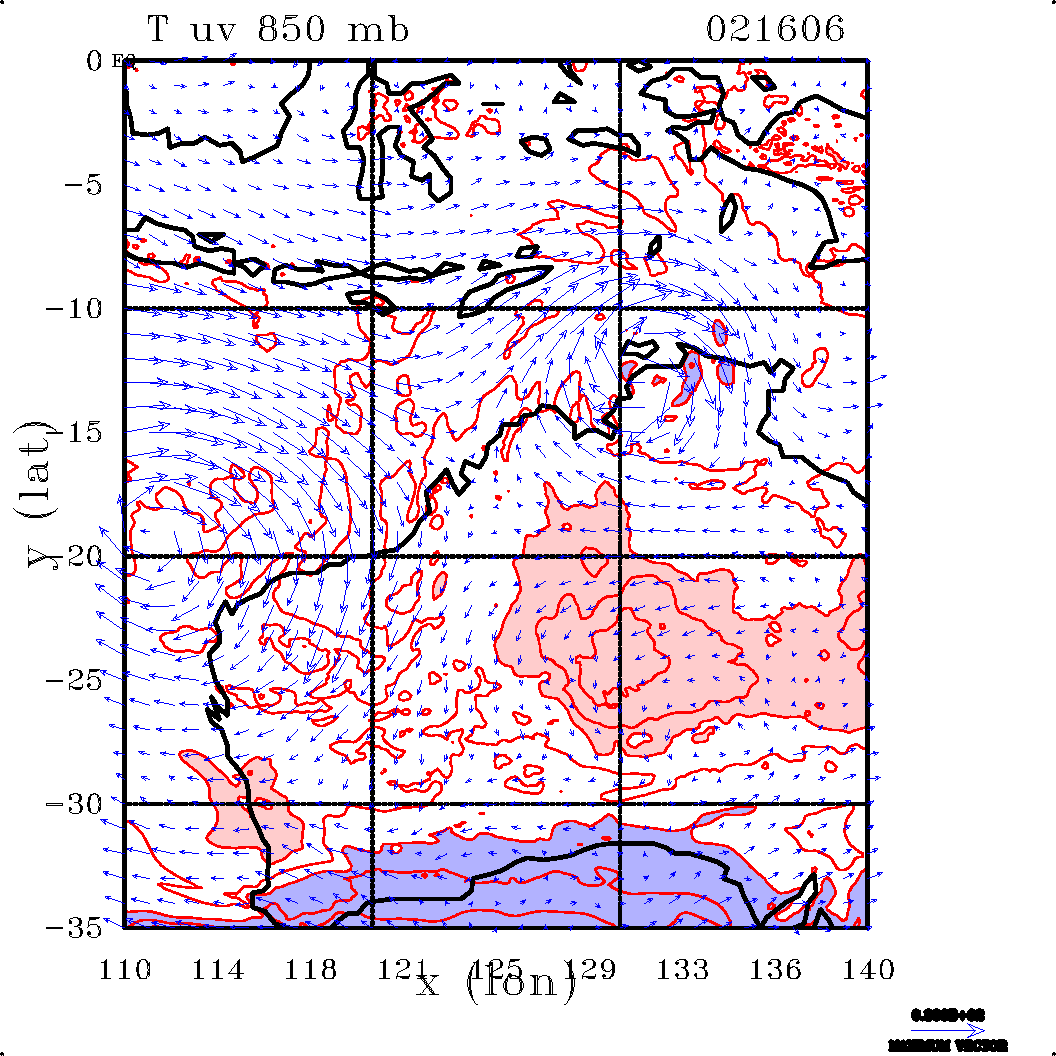
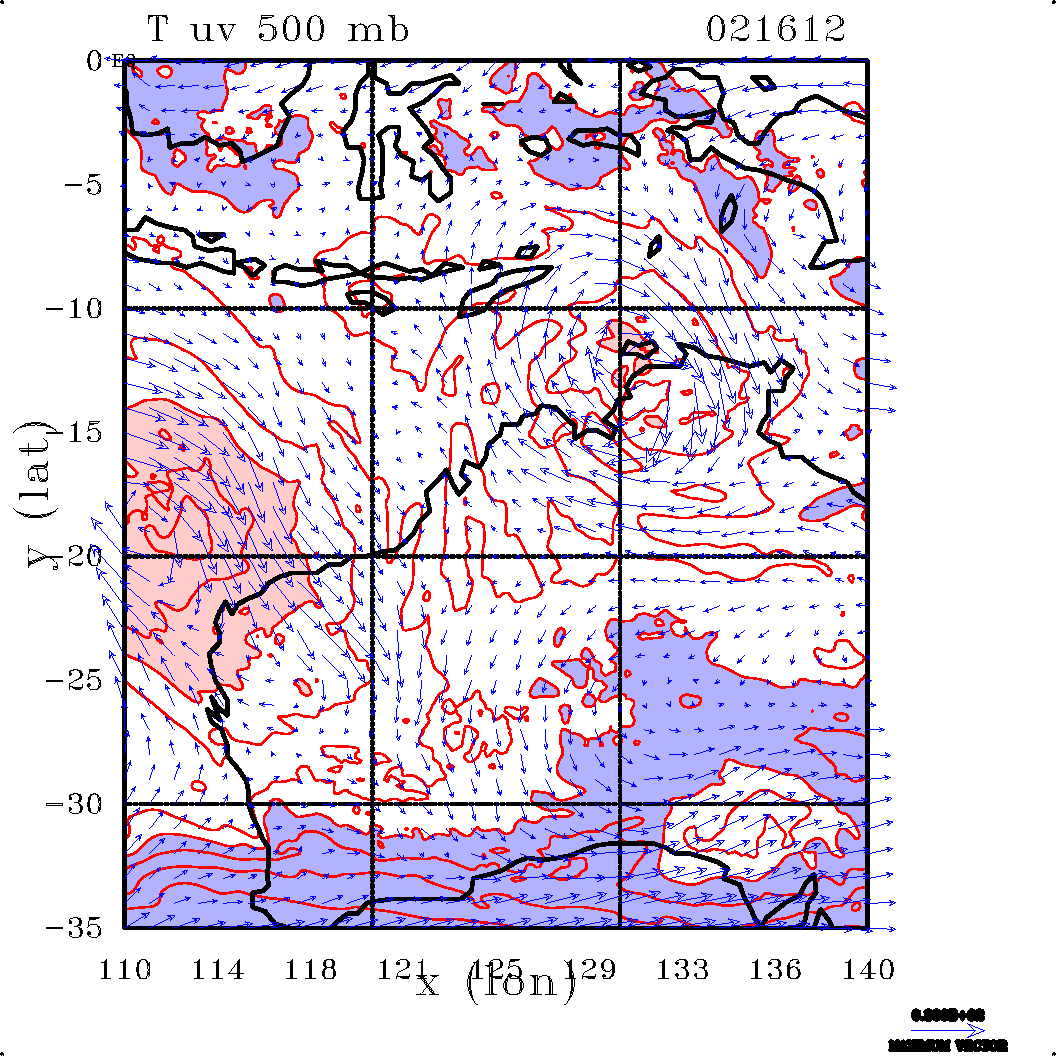
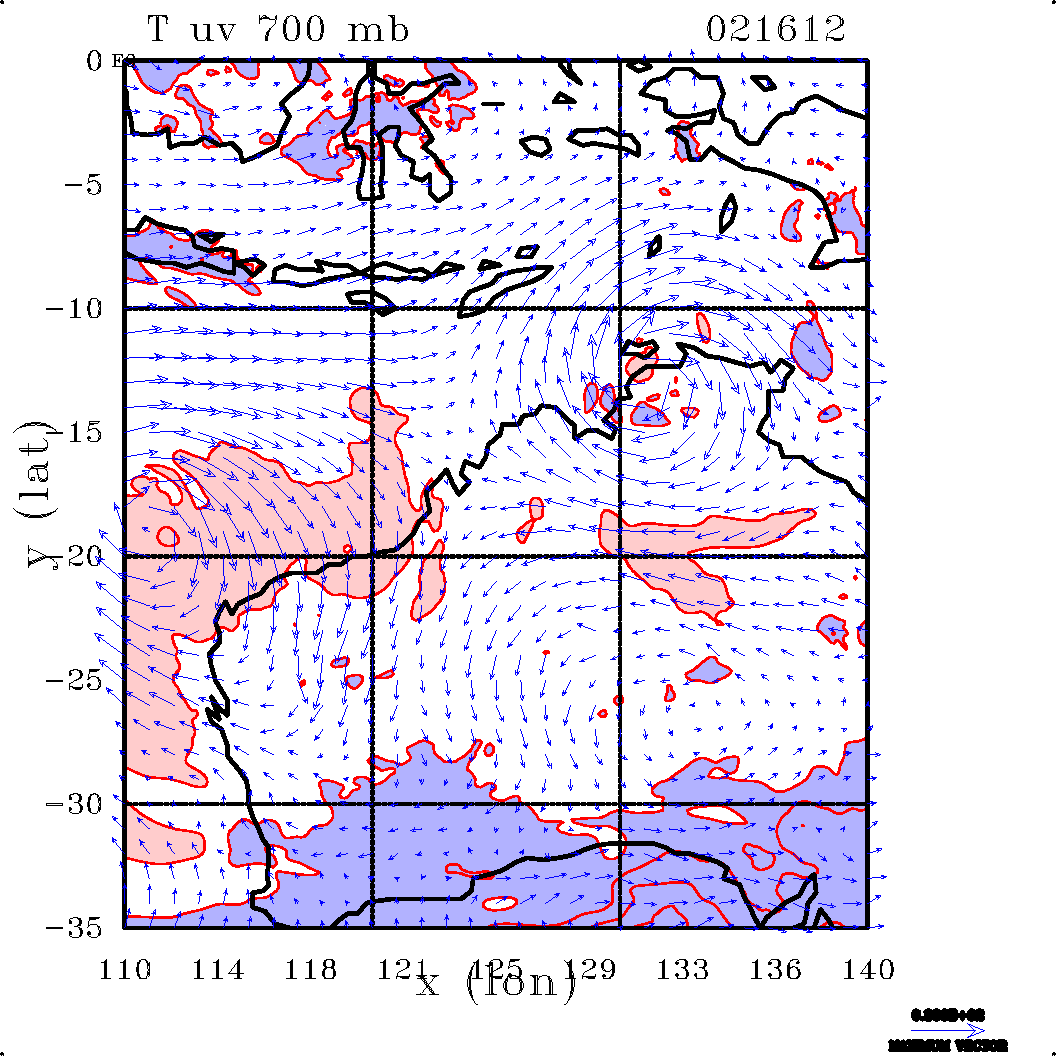
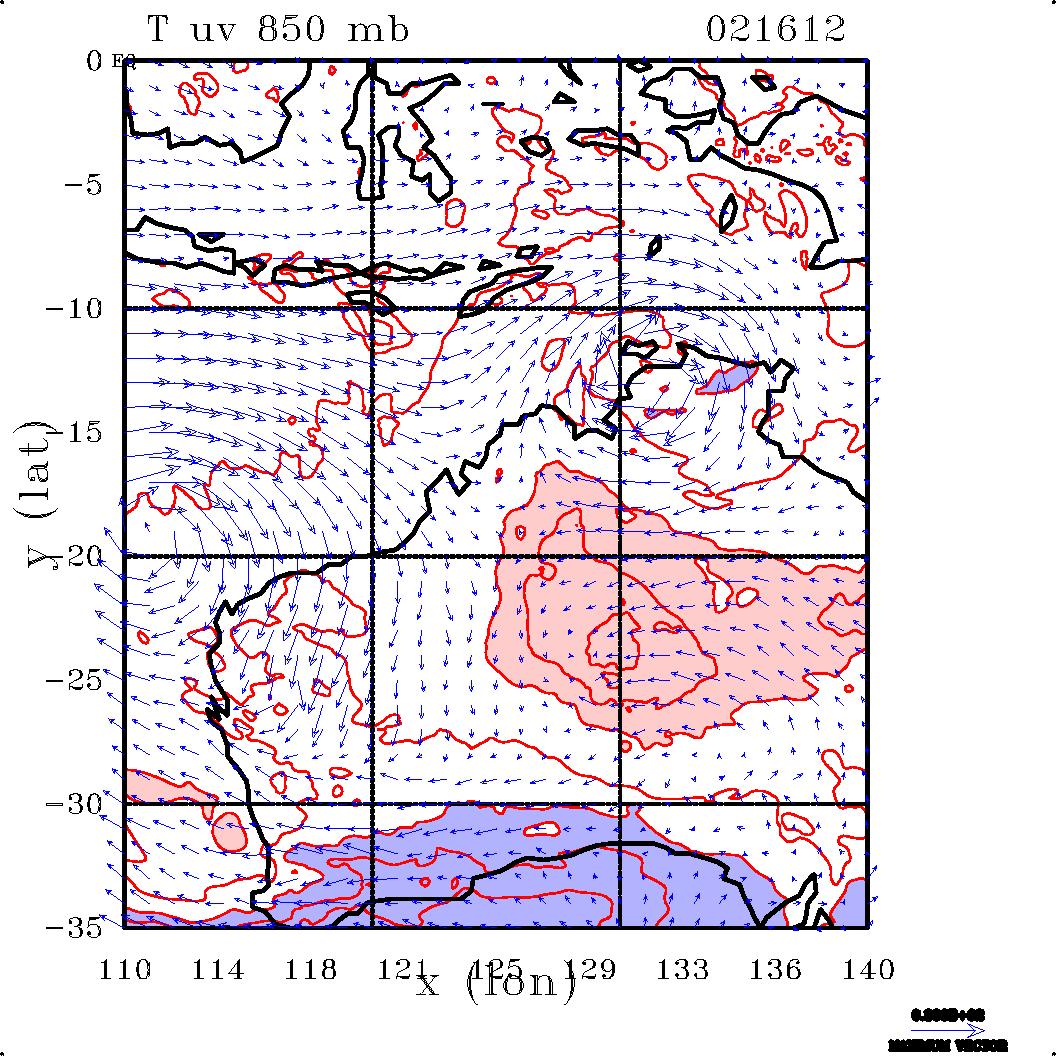
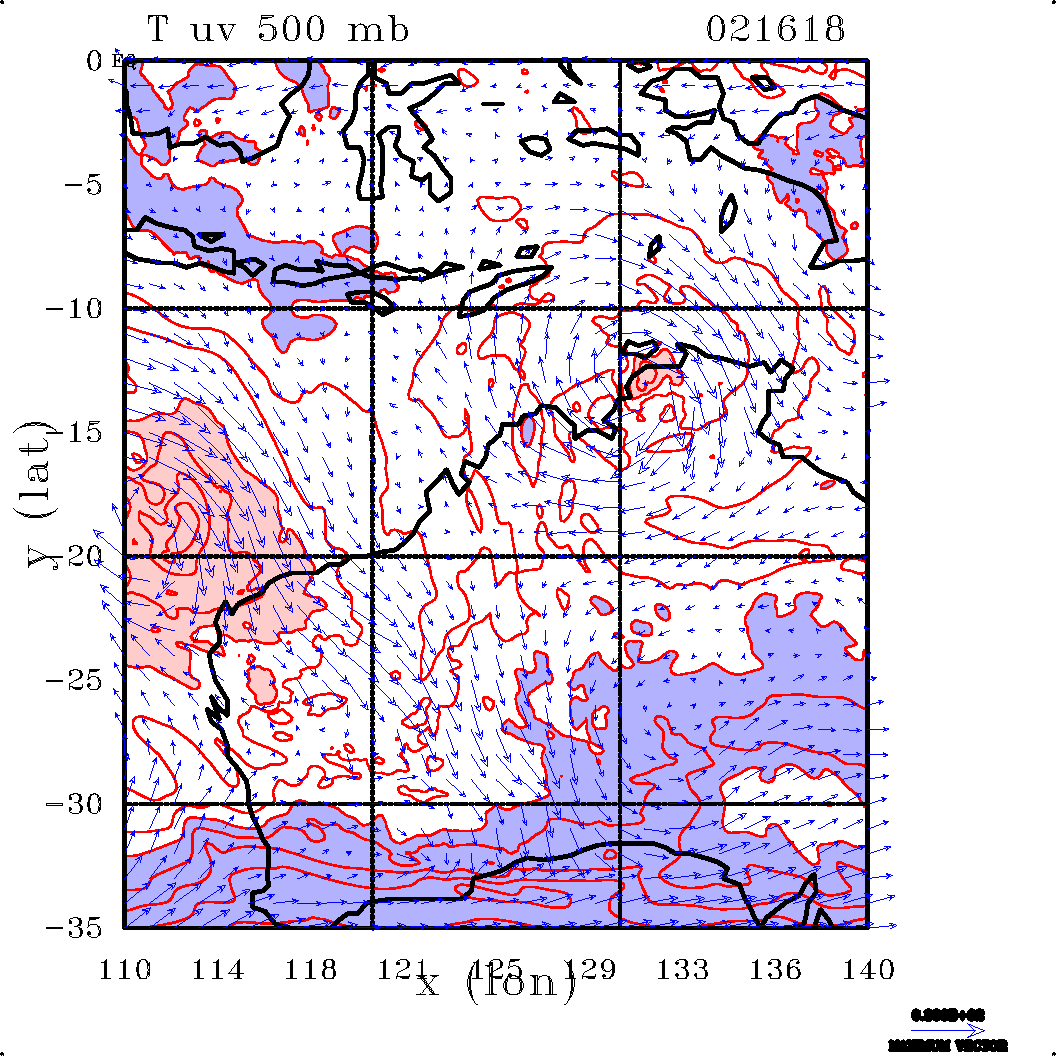
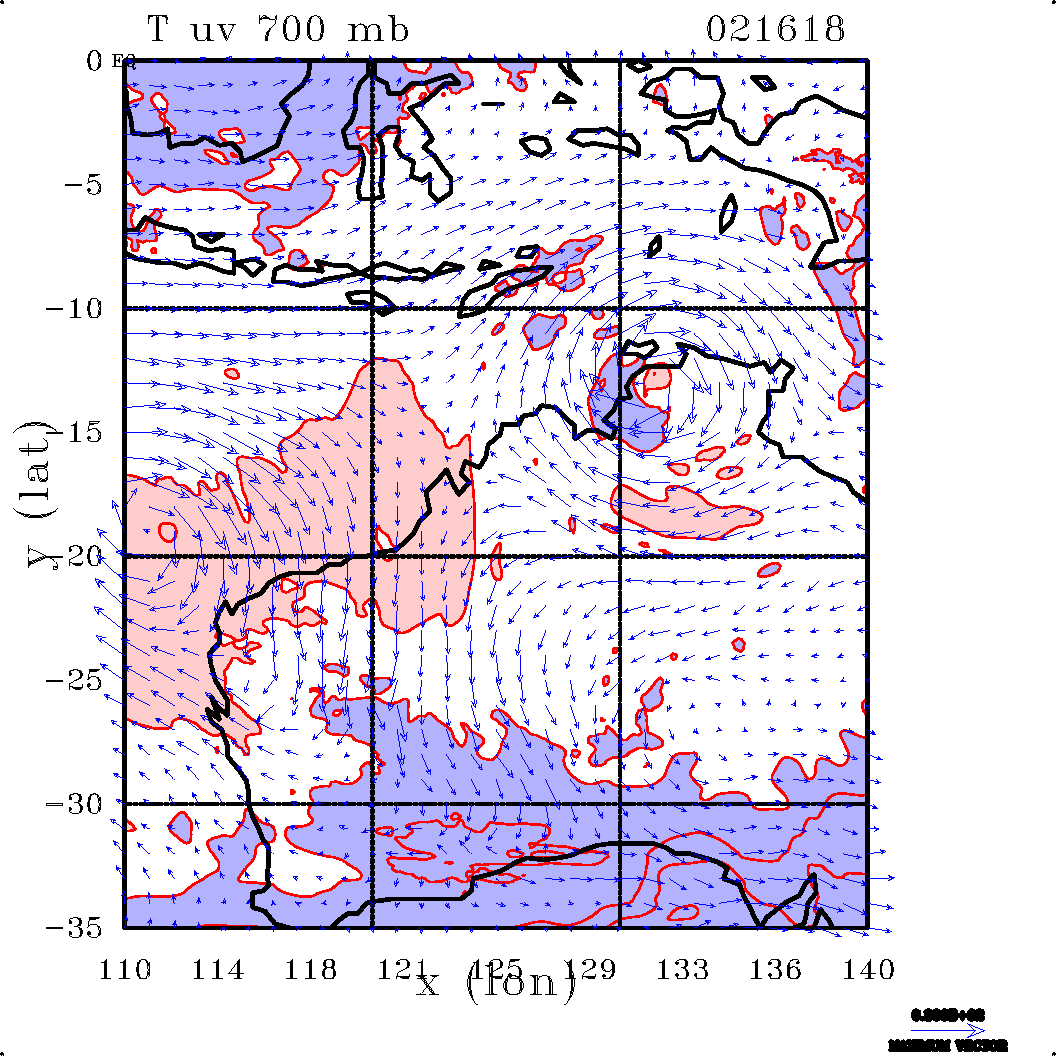
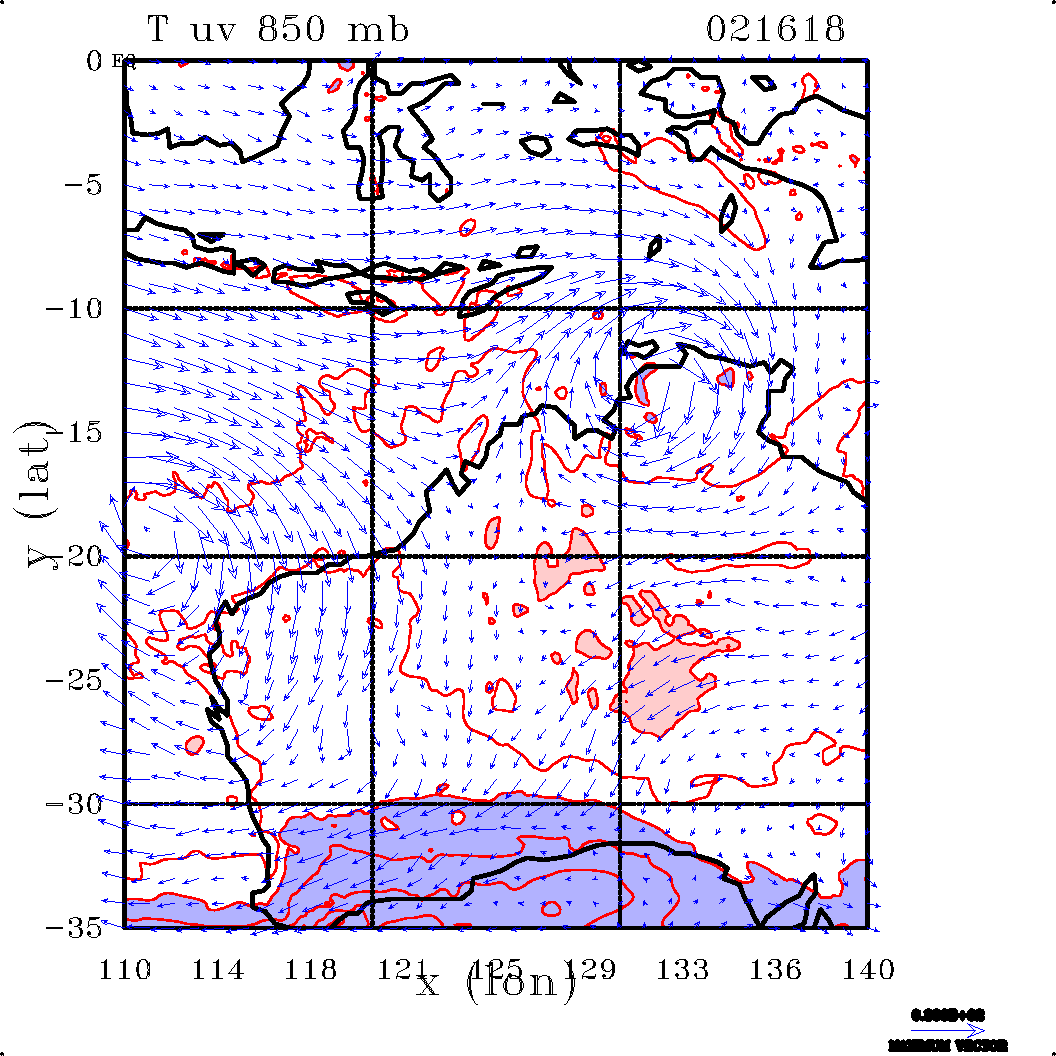
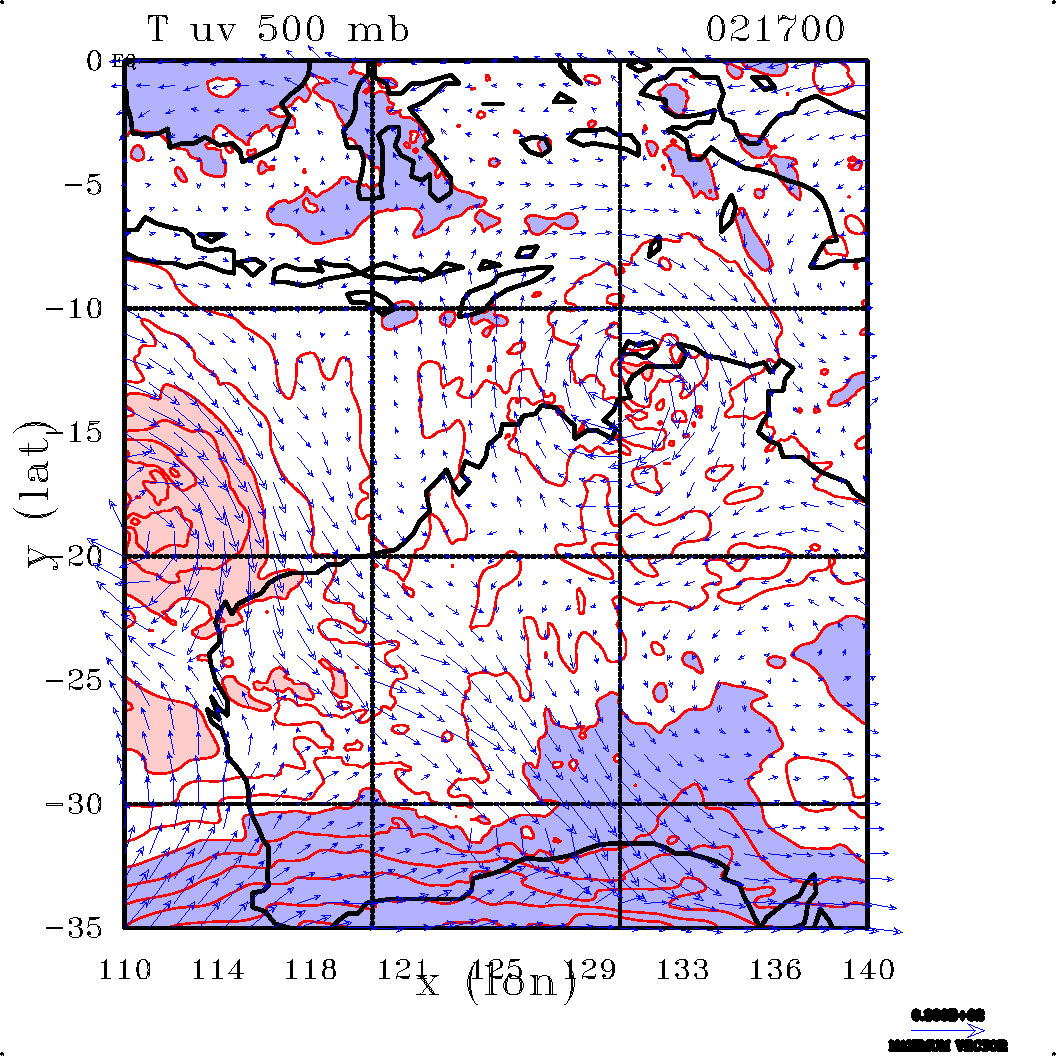
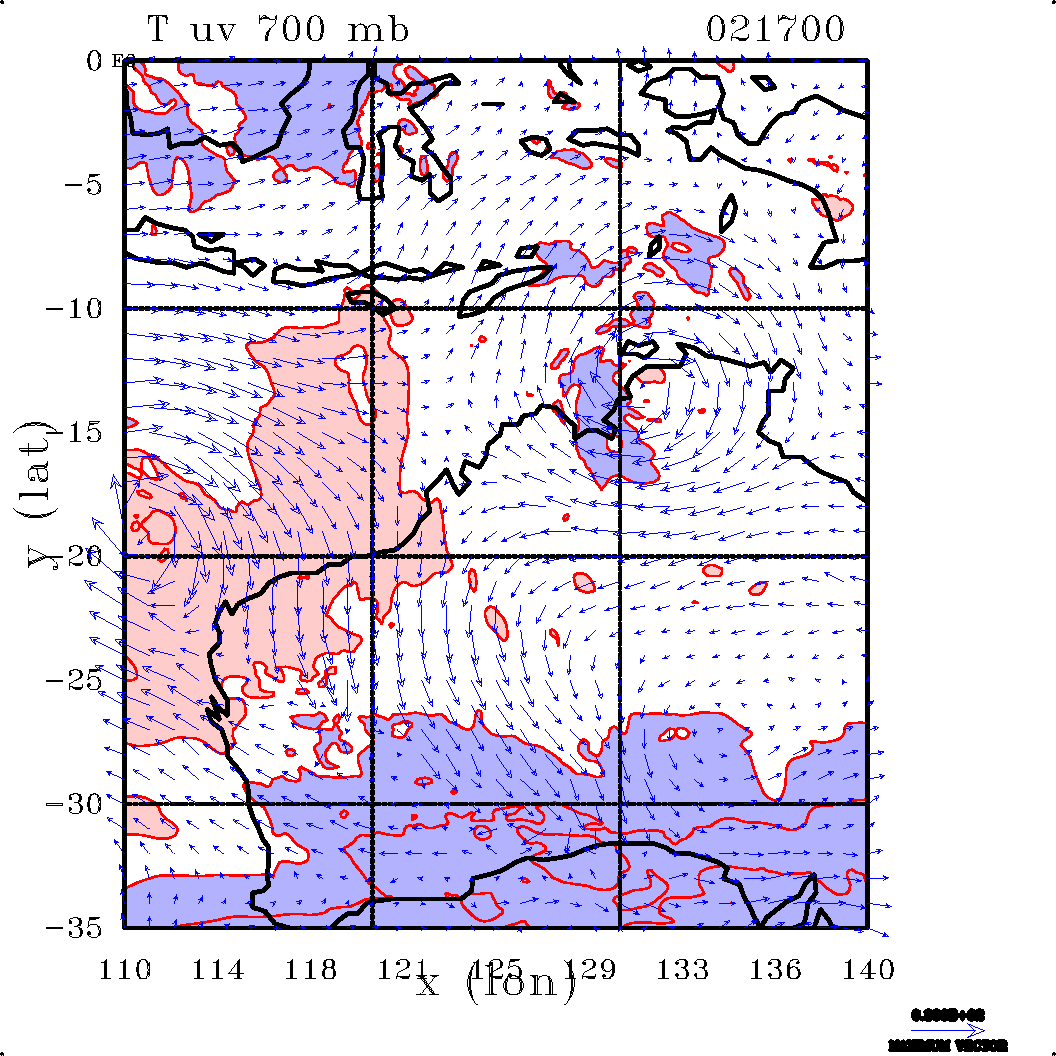
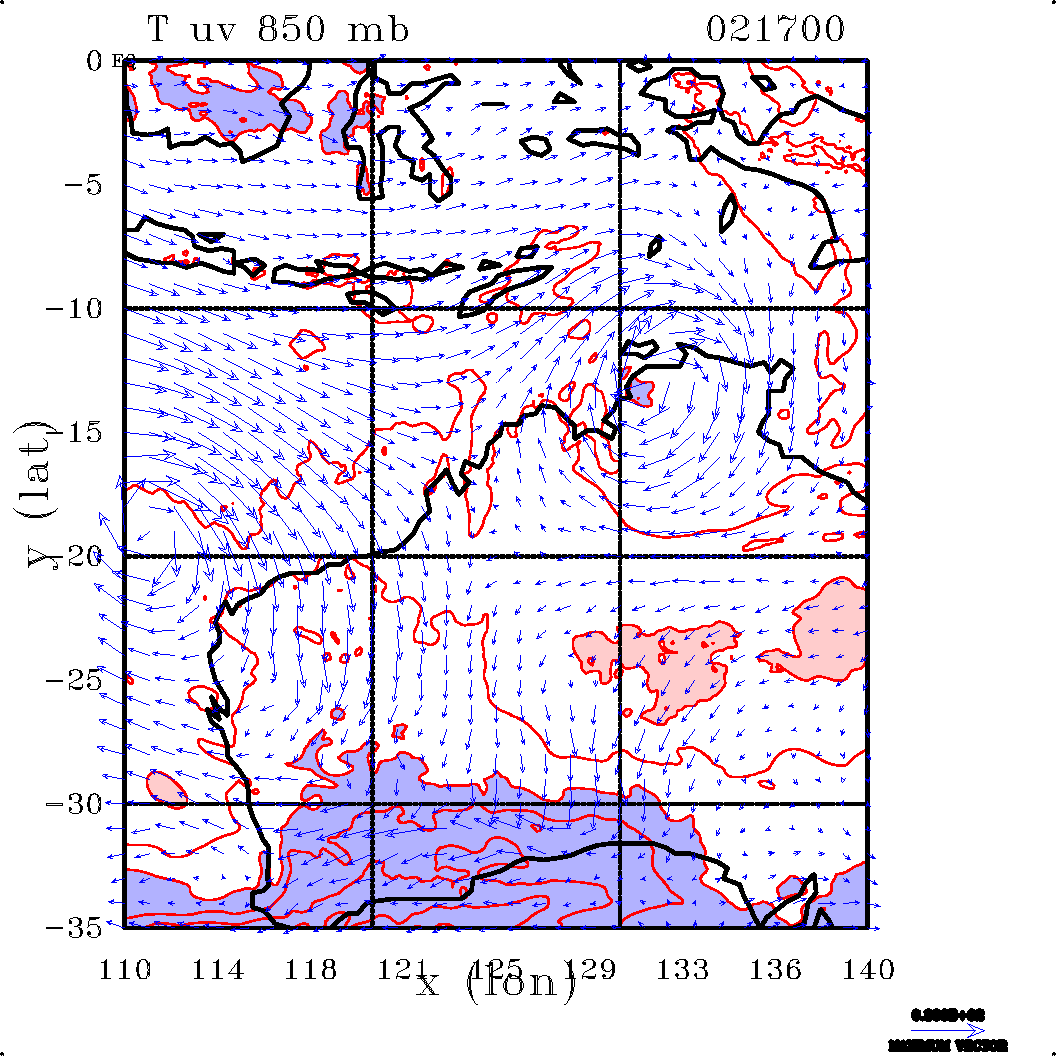
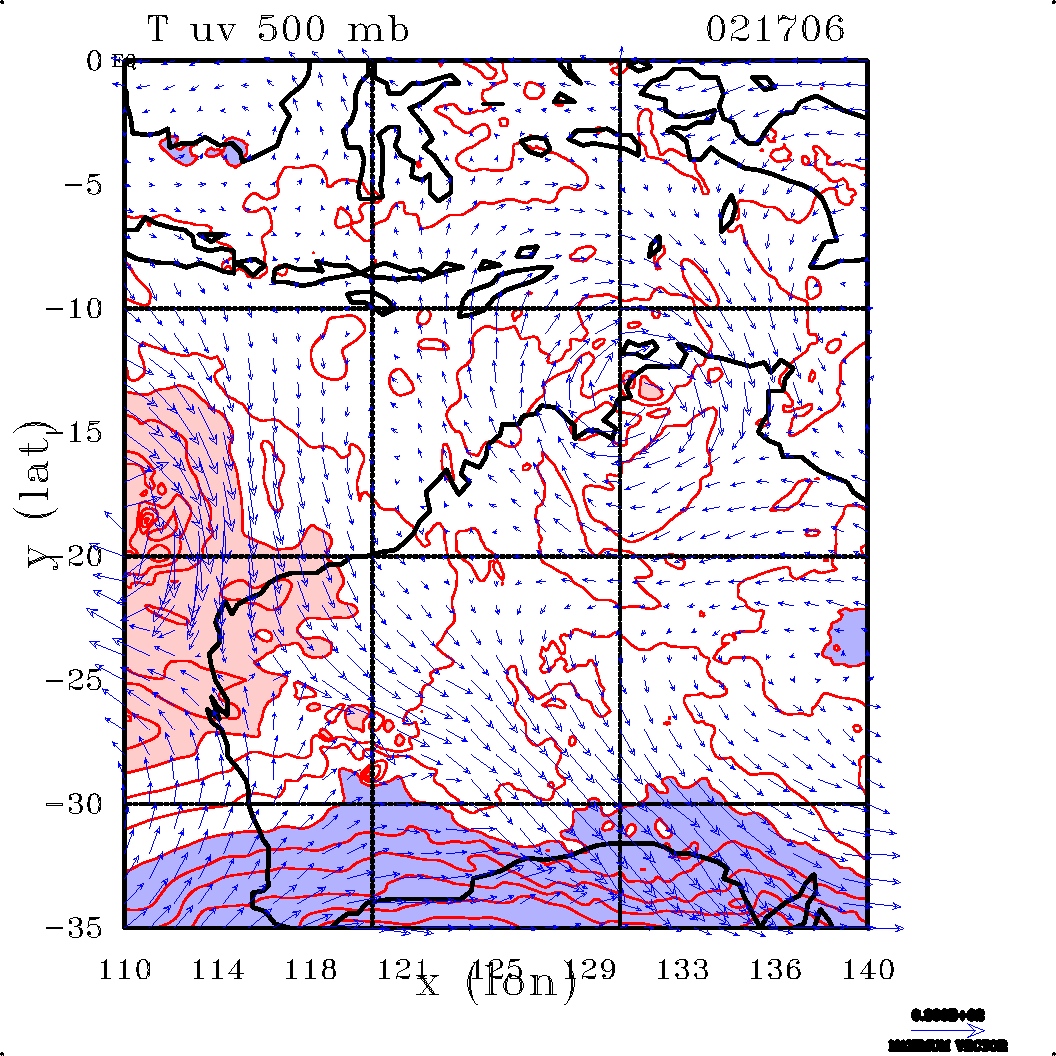
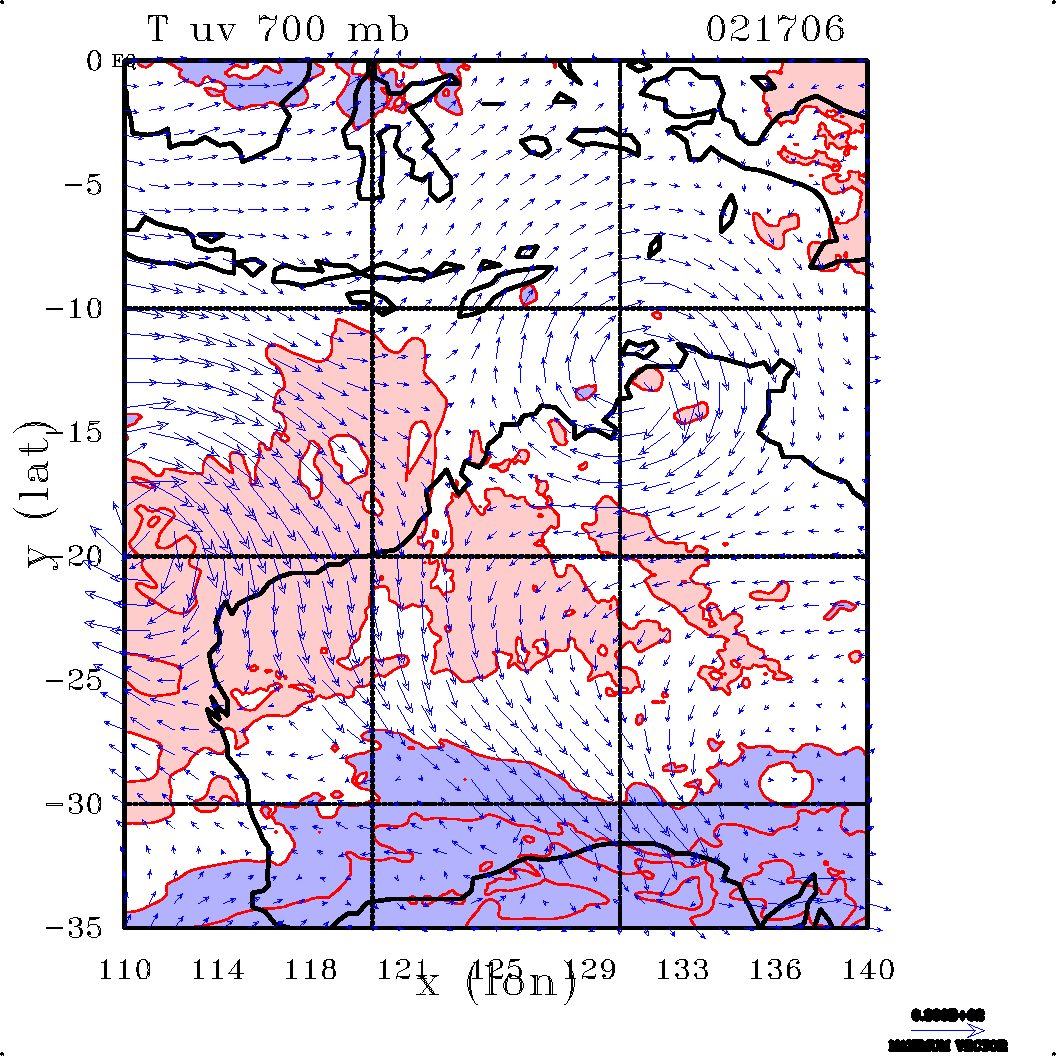
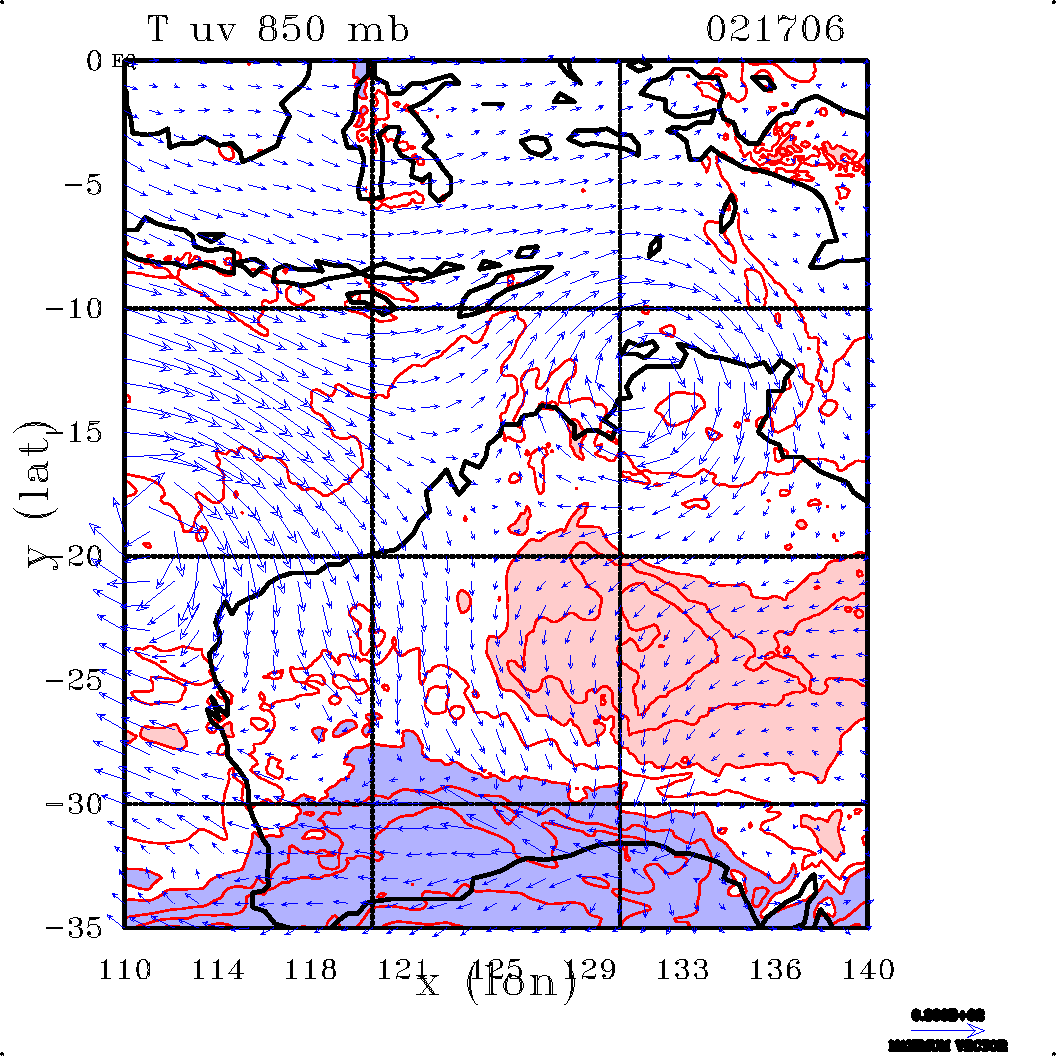
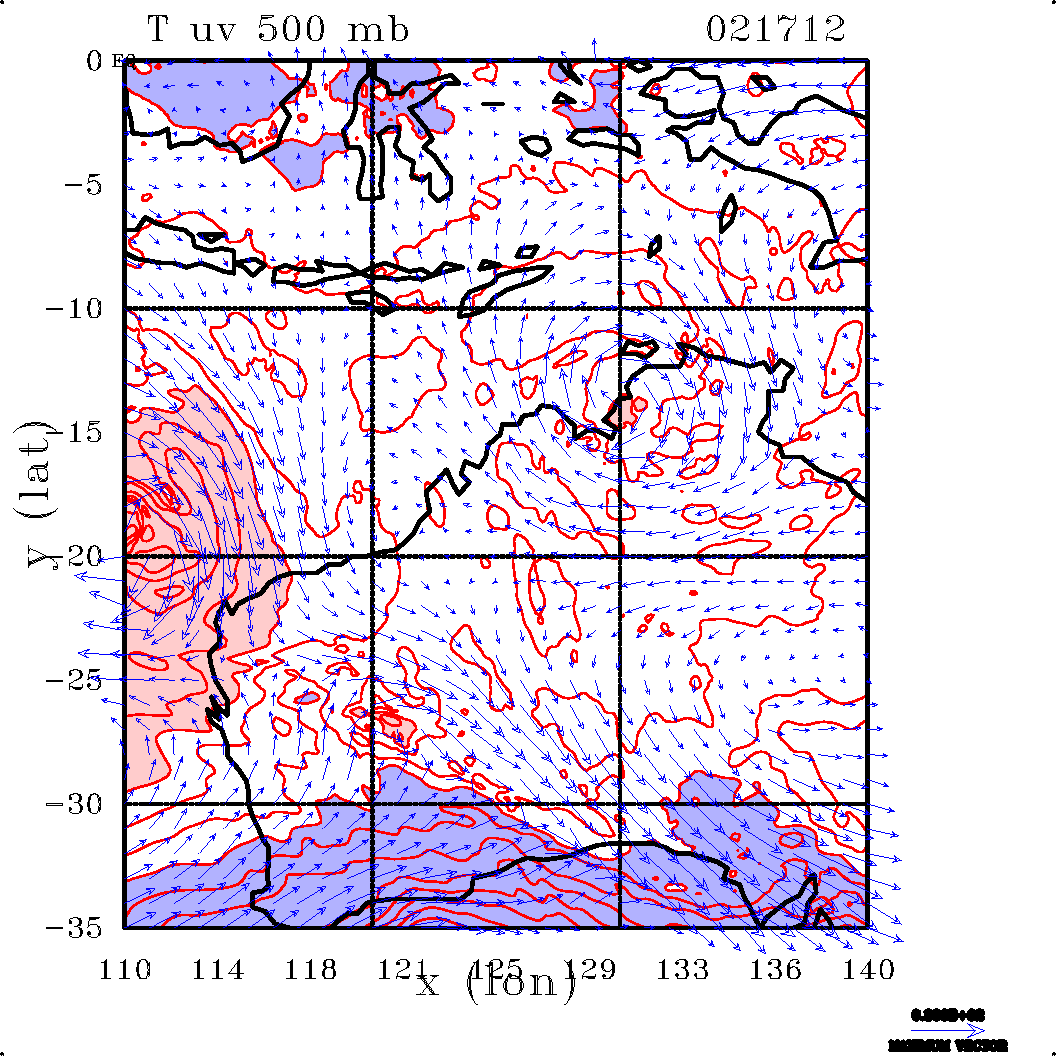
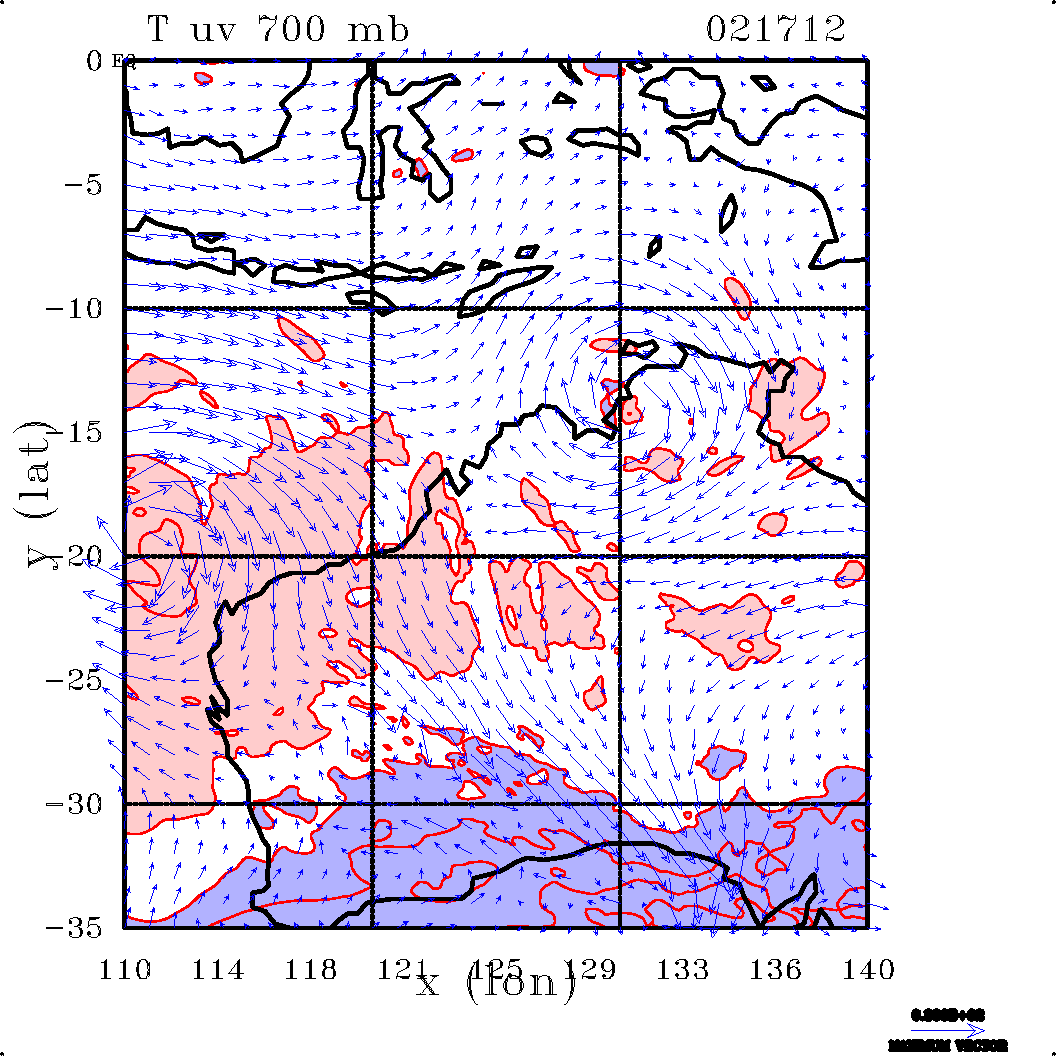
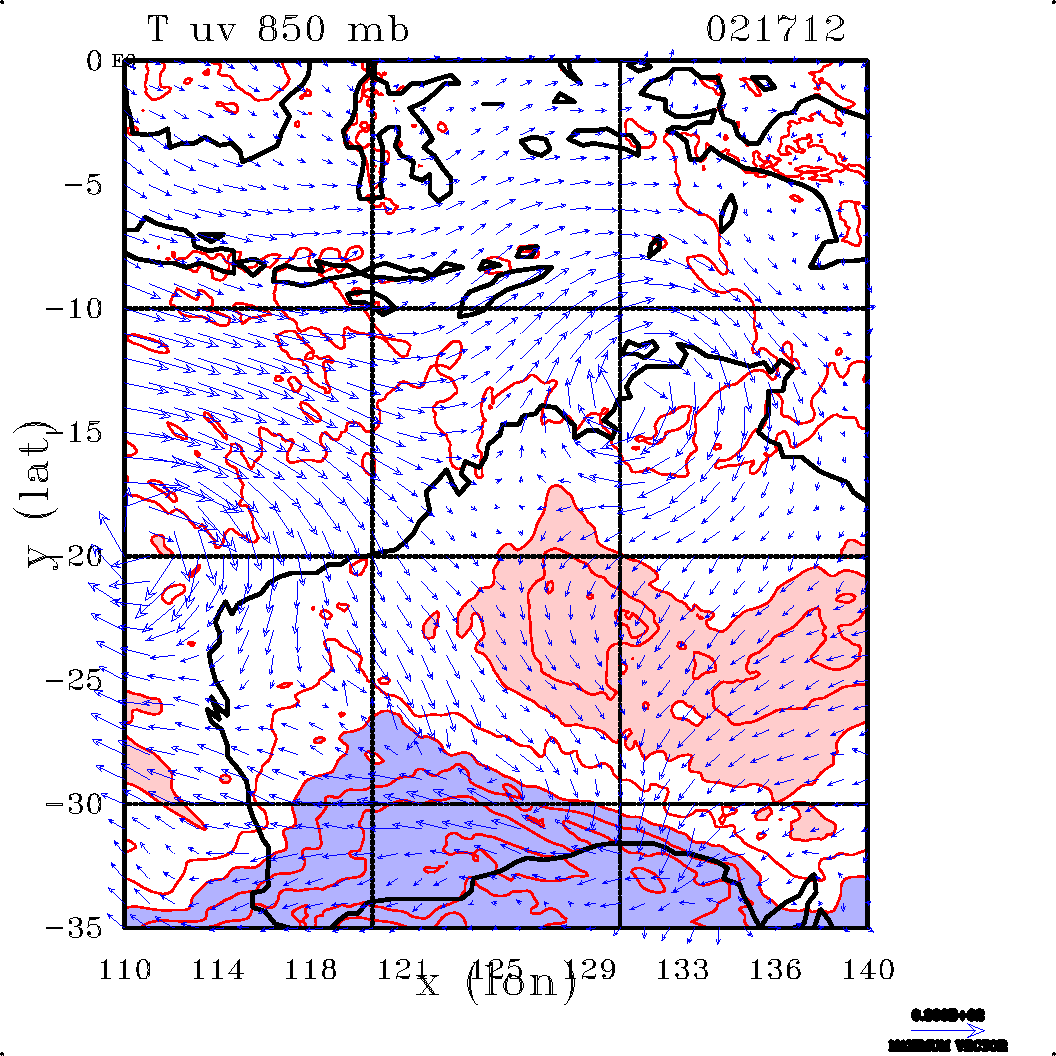
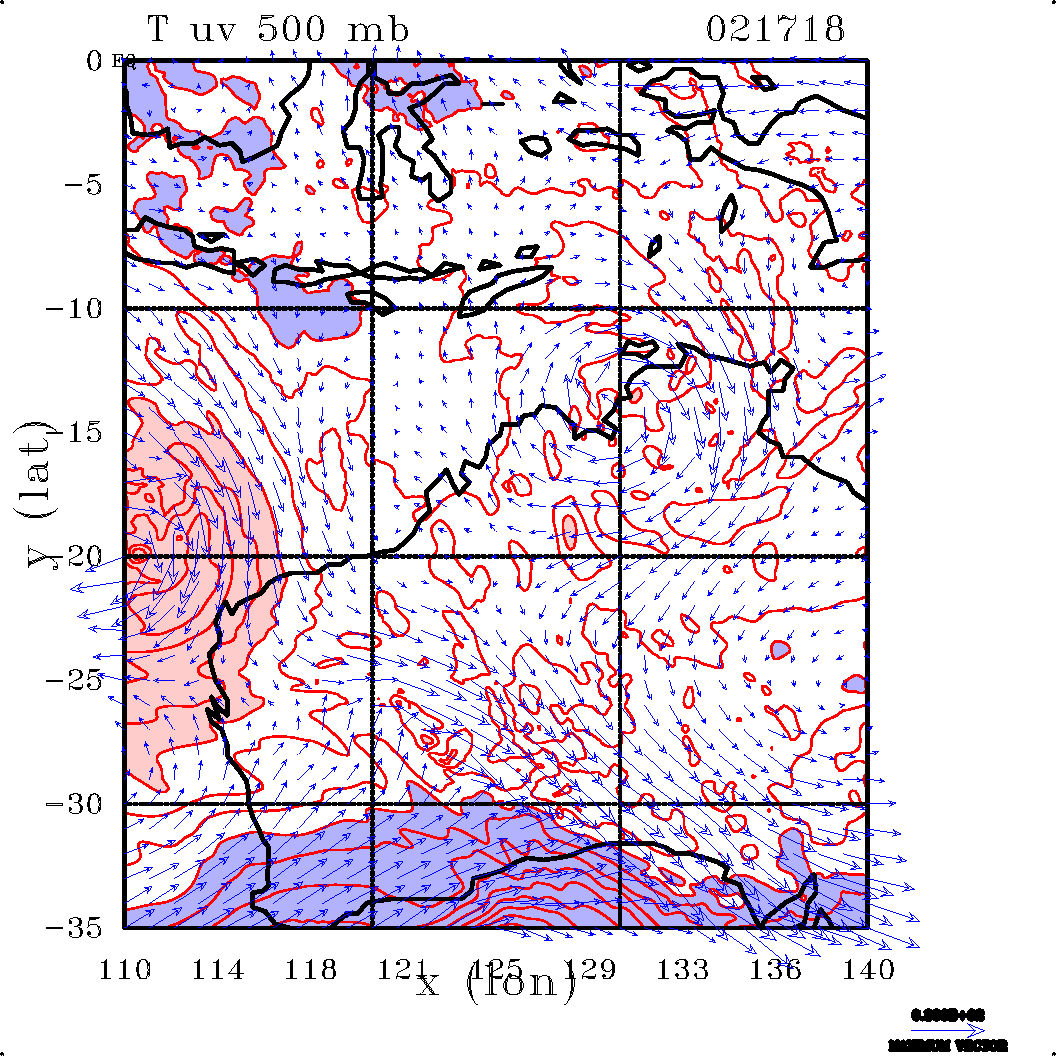
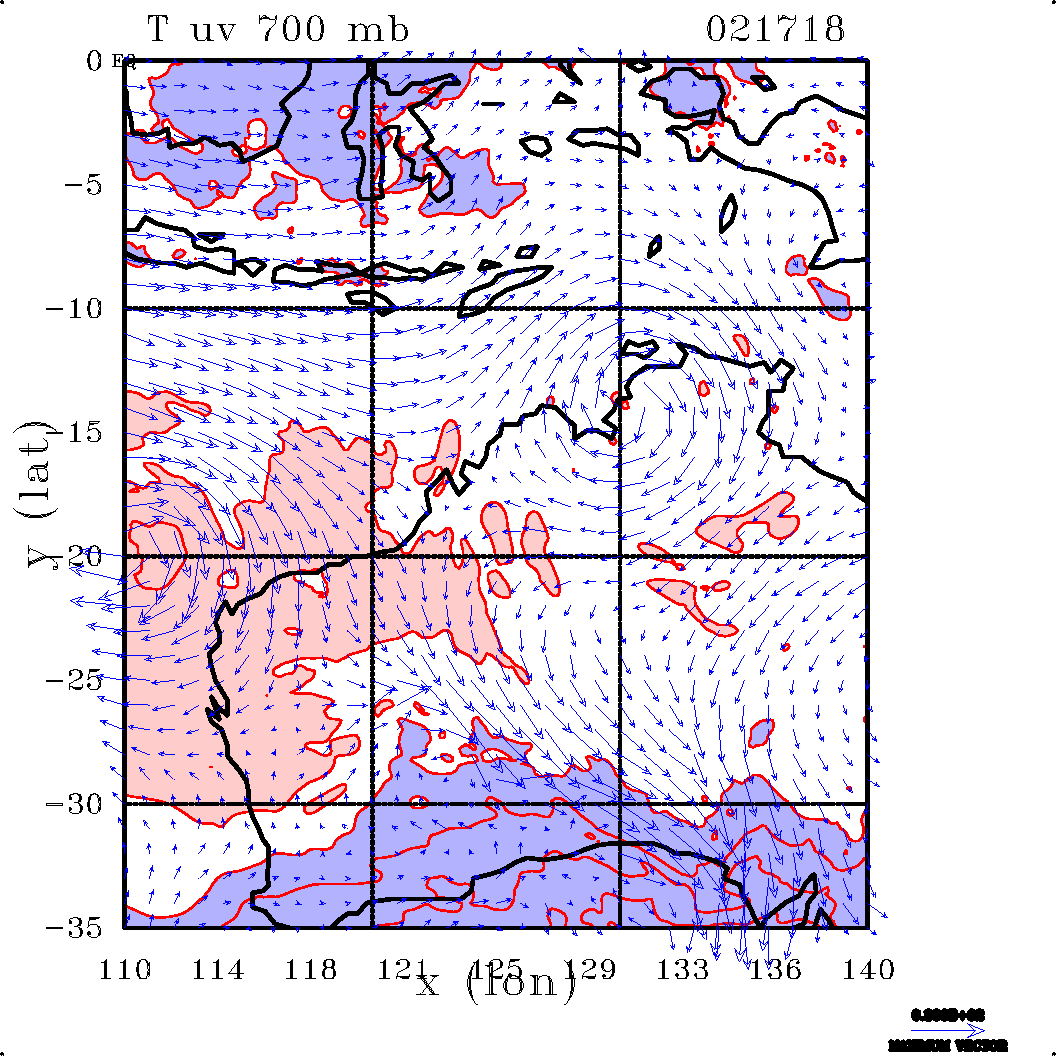
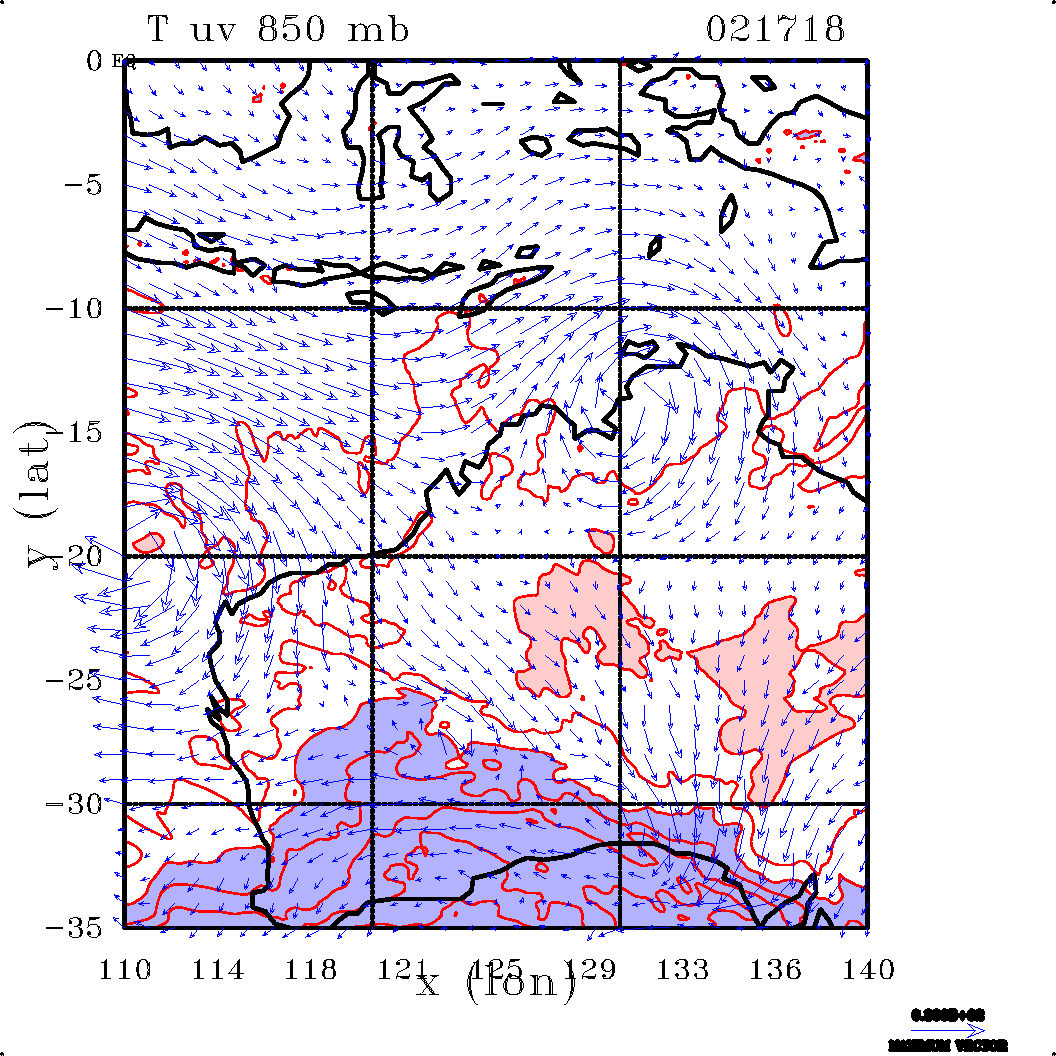
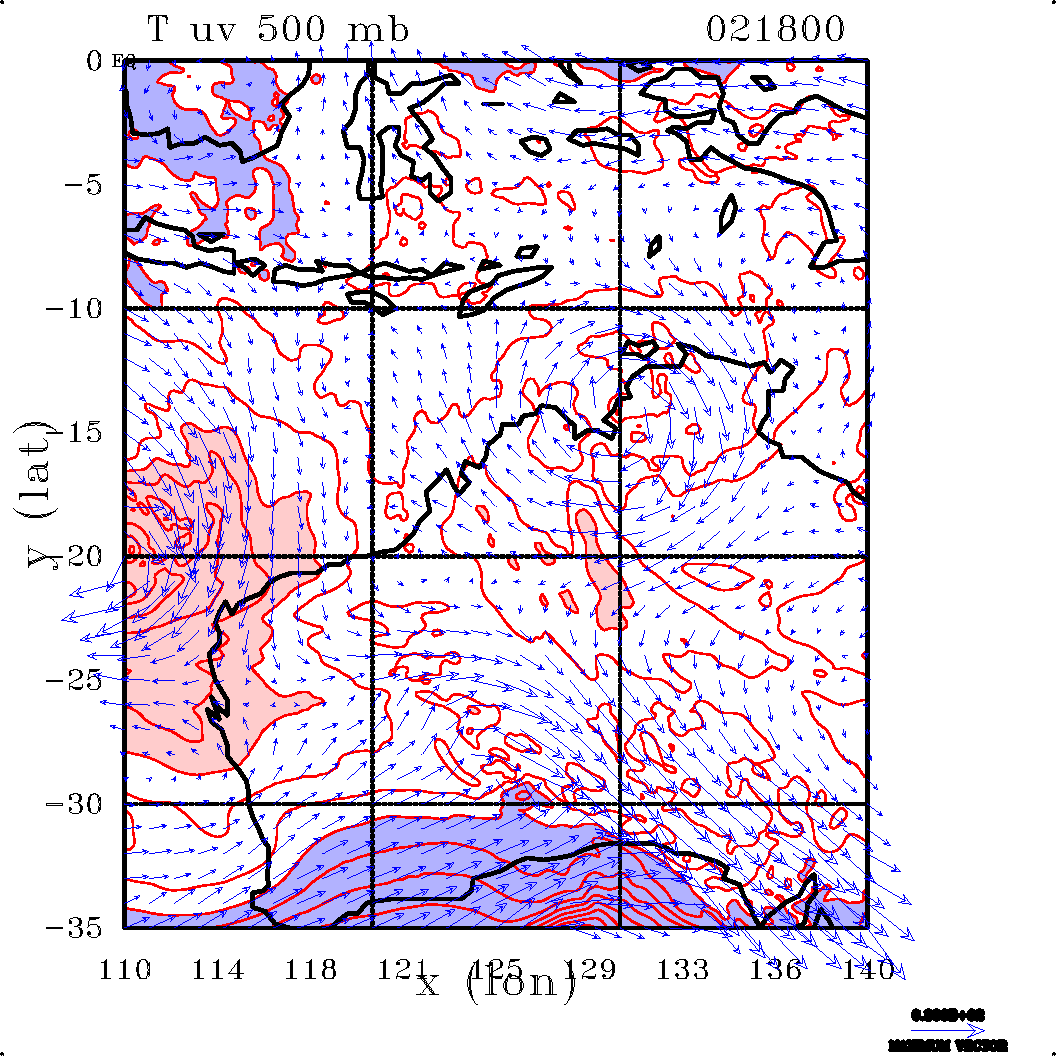
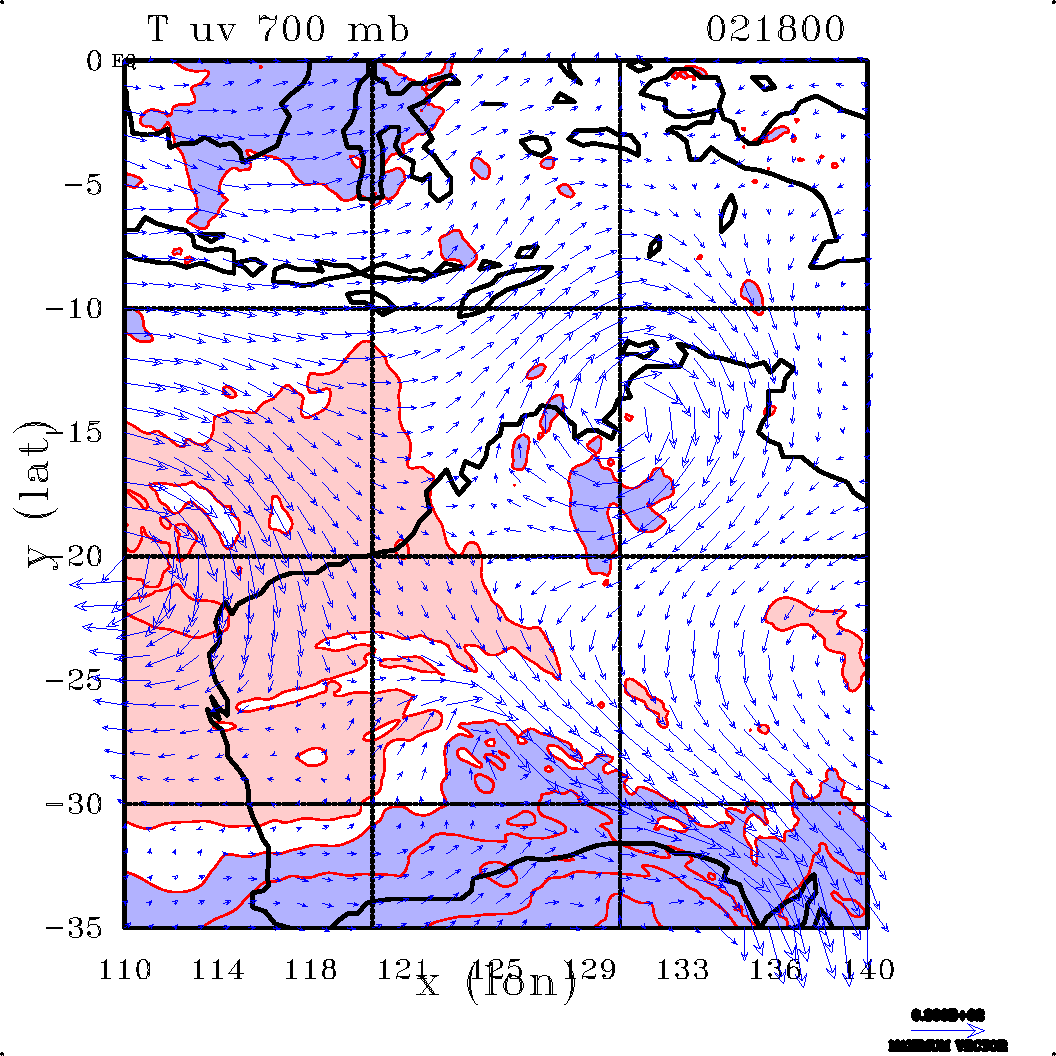
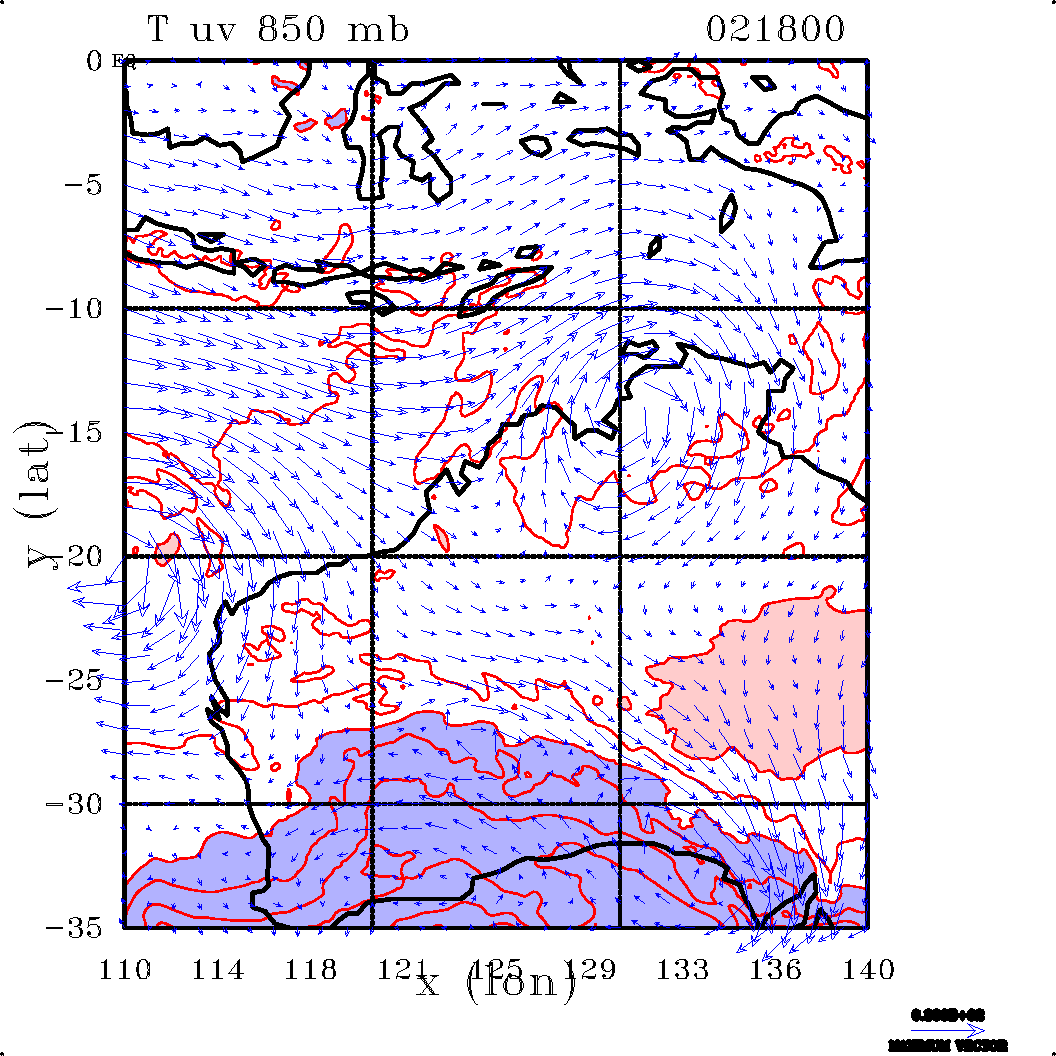
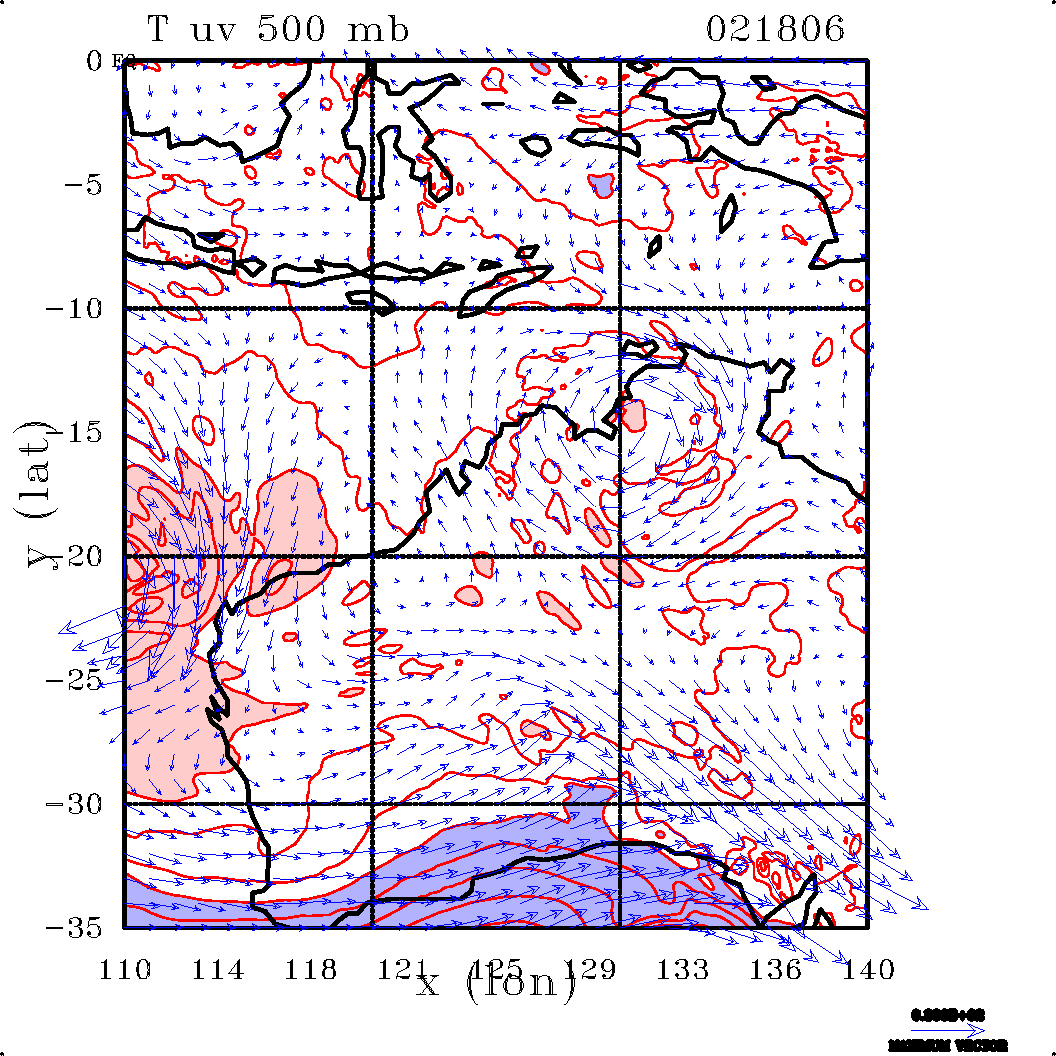
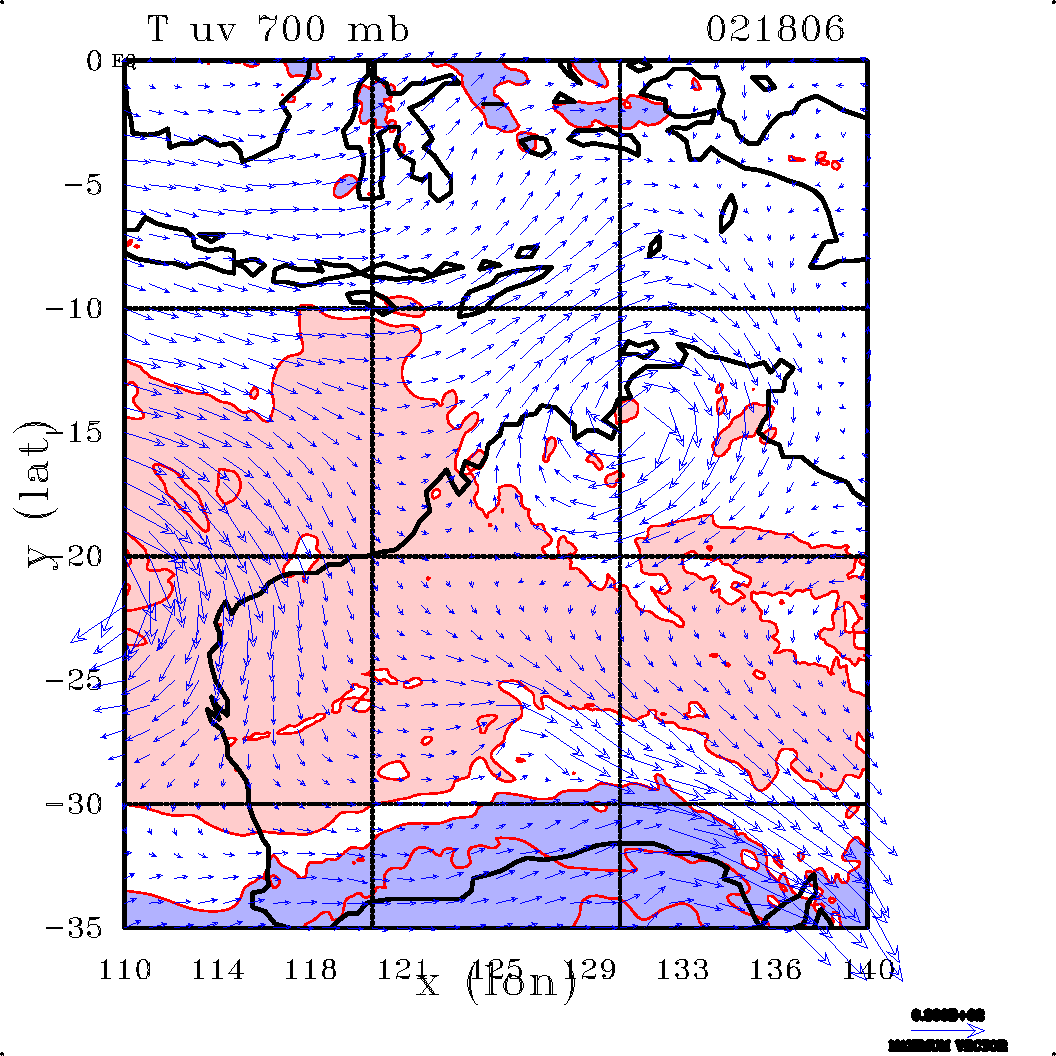
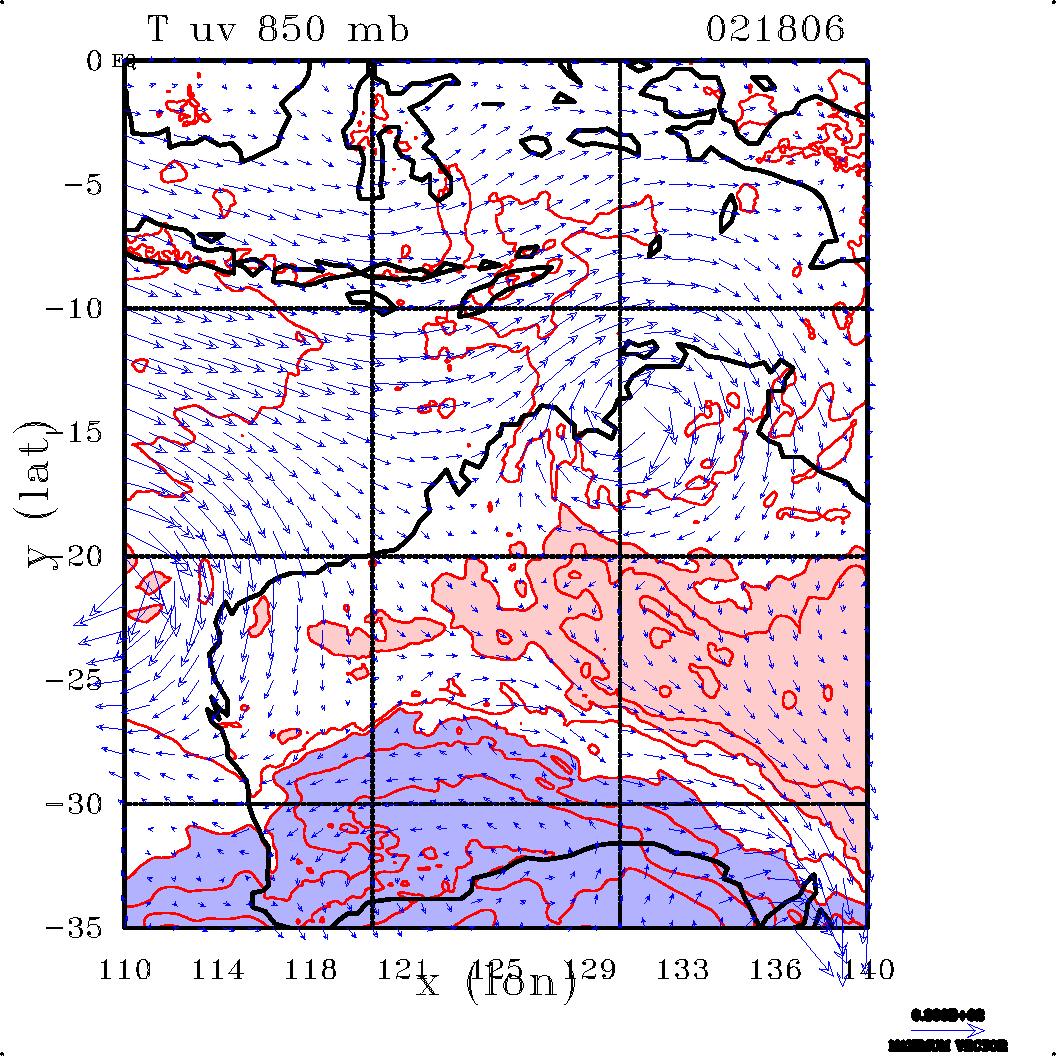
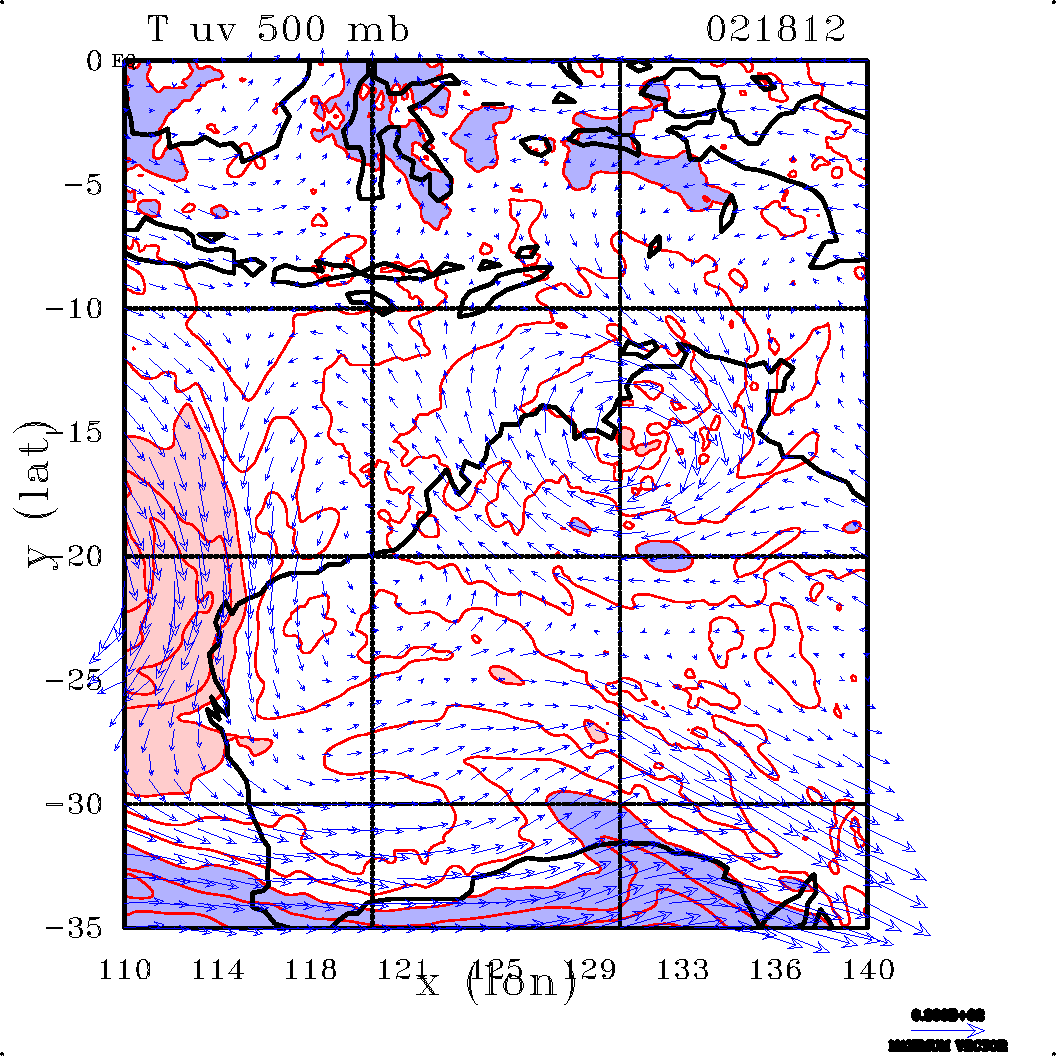
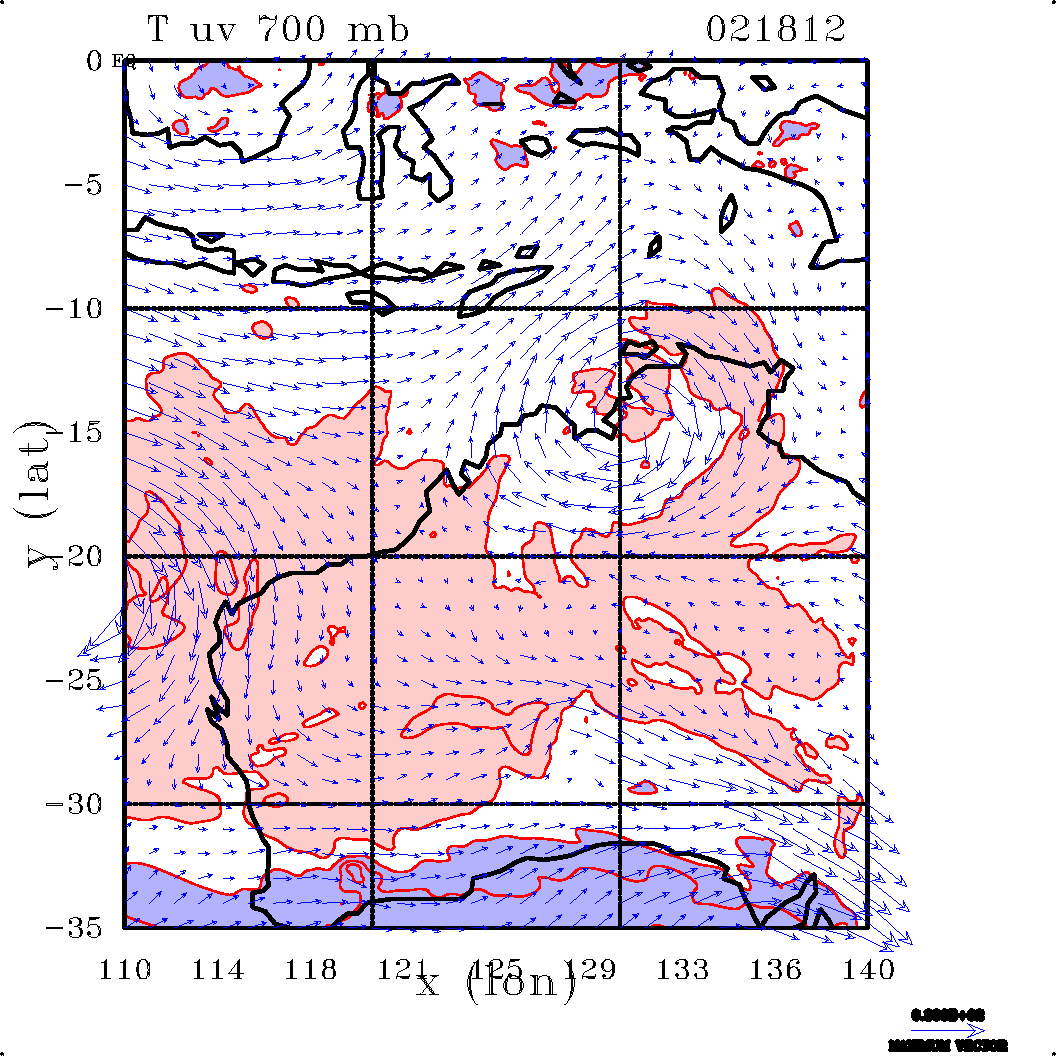
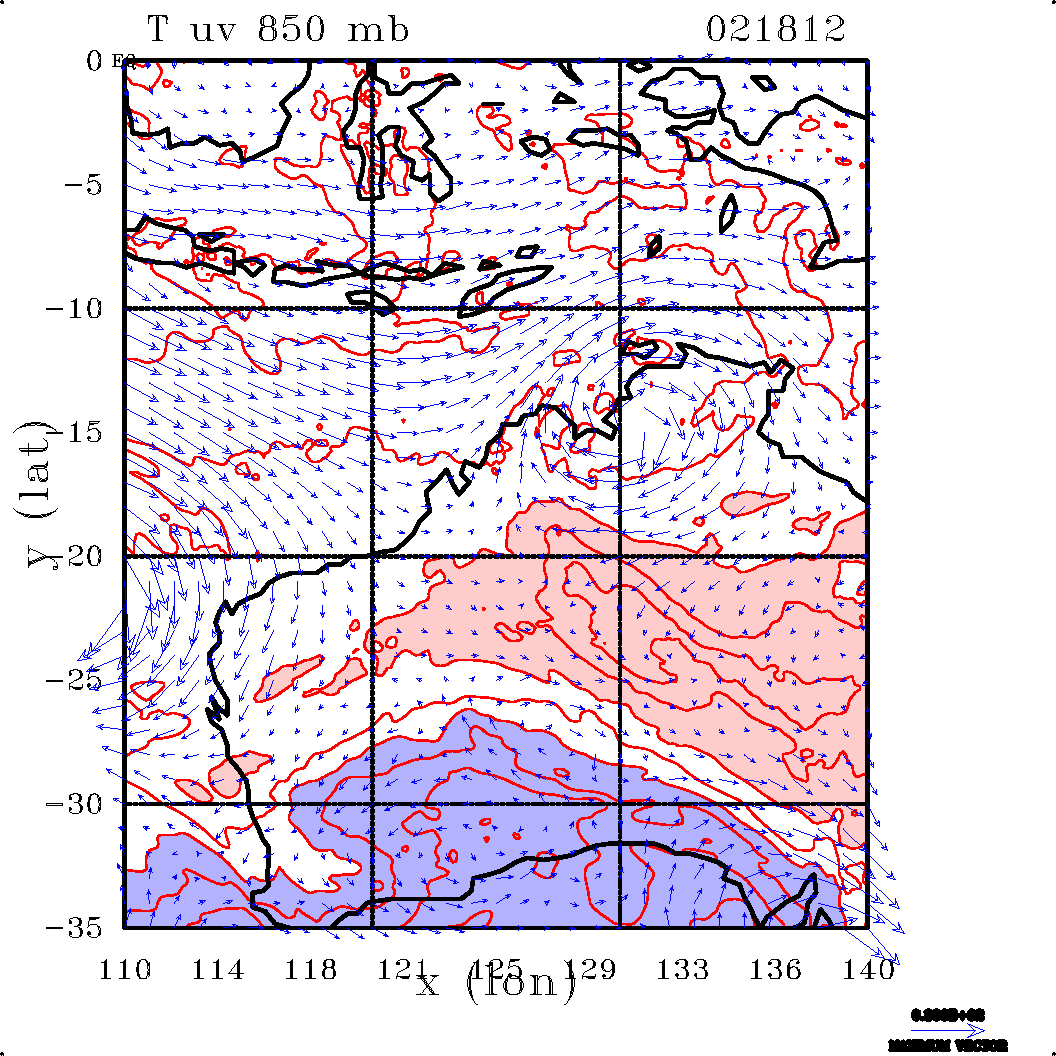
Contours of temperature at selected pressure levels
The following plots show wind vectors and contours of temperature during the genesis and mature stage of the disturbance. Contour levels for the temperature are 2 K at 850 and 700 mb, and 1 K at 500 mb. Contour interval is 2 K at 850 and 700 mb, and 1 K at 500 mb. Regions with temperature less than 290 K at 850 mb, 282 K at 700 mb, and 267 K at 500 mb are shaded pink; regions with temperature greater than 294 K at 850 mb, 284 K at 700 mb, and 270 K at 500 mb are shaded light blue.
 |  |
 |
|
 |  |
 |  |
 |  |
 |  |
 |  |
 |  |
 |  |
 |  |
 |  |
 |  |
 |  |
 |  |
 |  |
 |  |
 |  |
 |  |
 |  |
 |  |
 |  |
 |  |
 |  |
 |  |
 |  |
 |  |
 |  |
 |  |
 |  |
 |  |
 |  |
 |  |
 |  |
 |  |
 |  |
 |  |
 |  |
 |  |
 |  |
 |  |
 |  |
 |  |
 |  |
 |  |
 |  |
 |  |
 |  |
 |  |
 |  |
 |  |
 |  |
 |  |
 |  |
 |  |
Copyright © Roger Smith