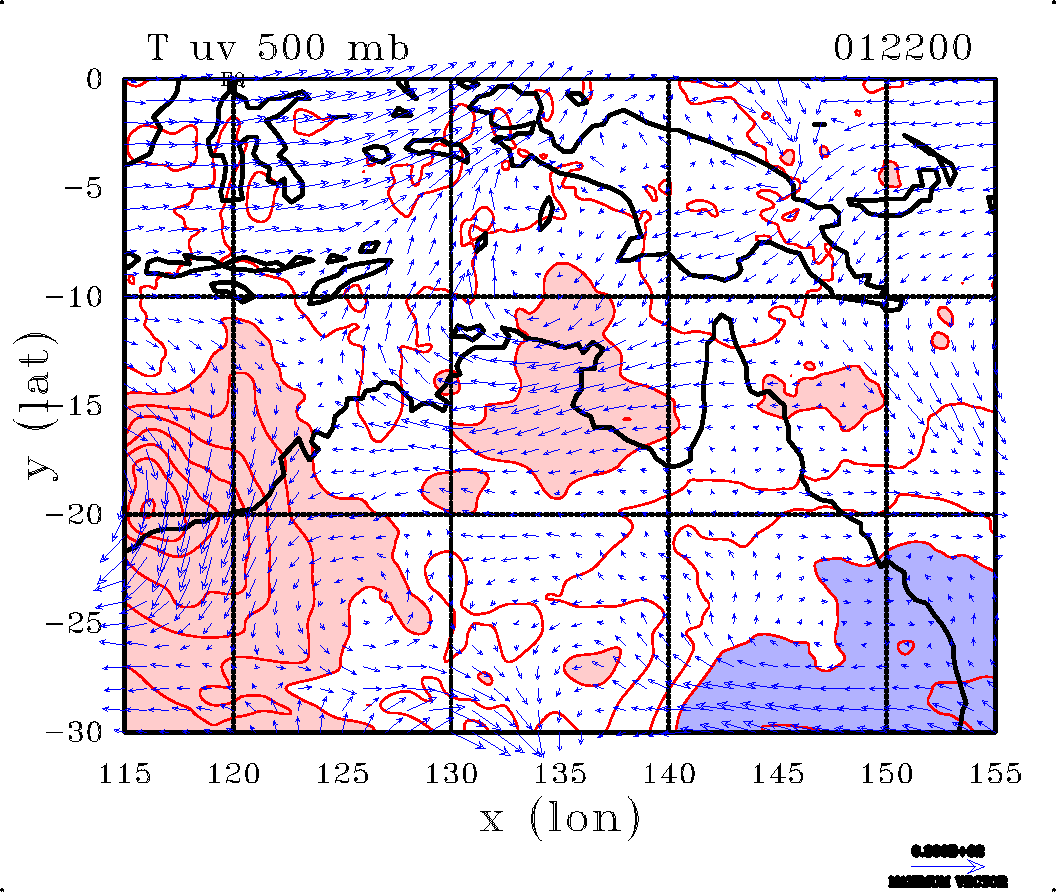
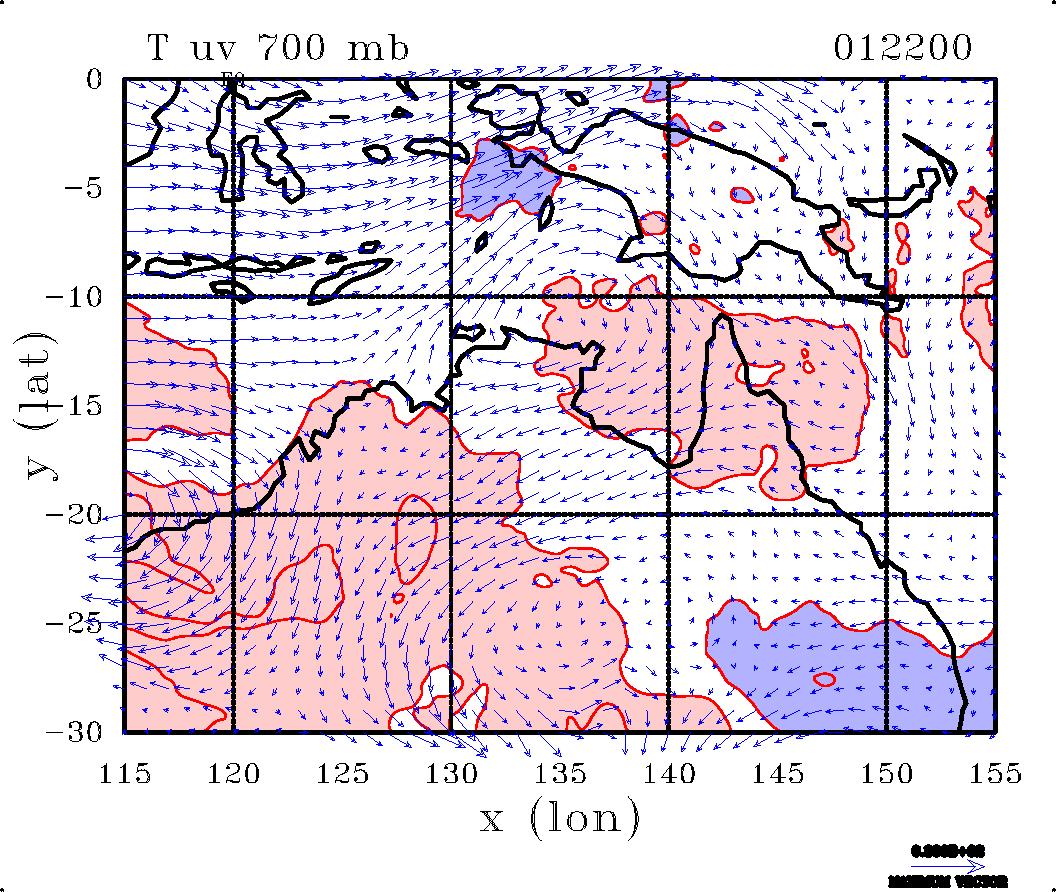
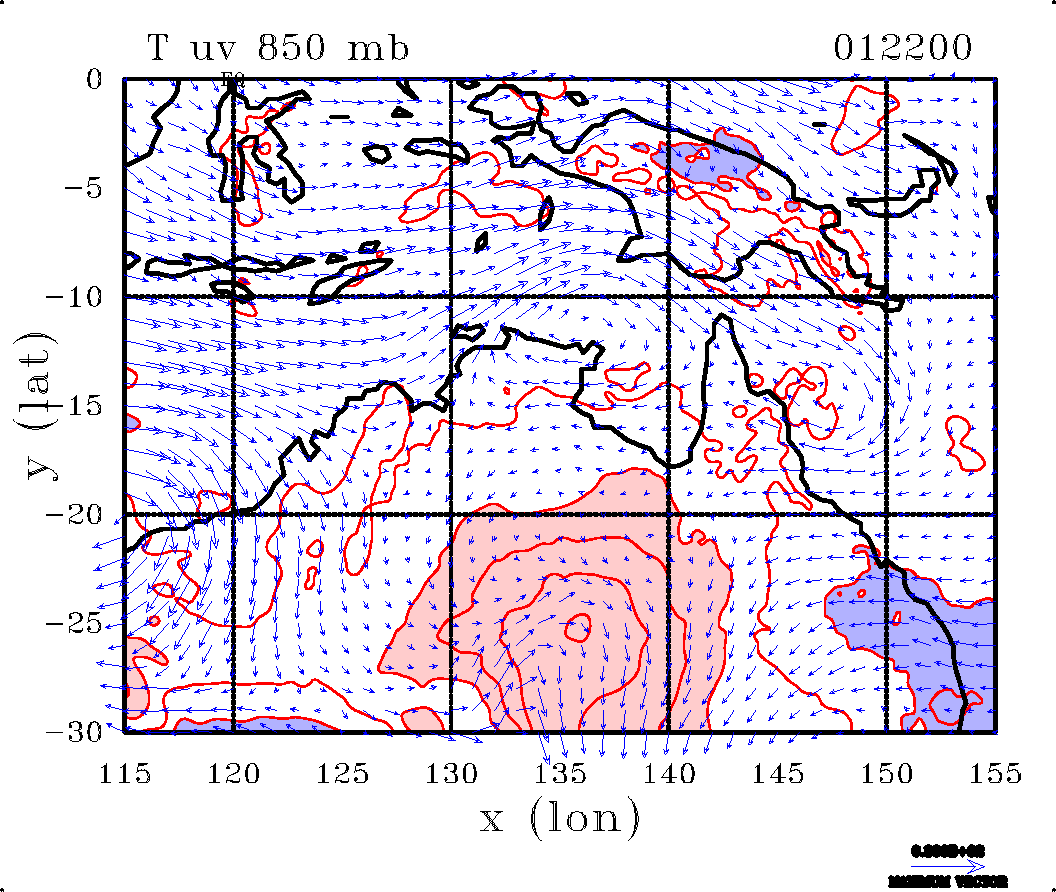
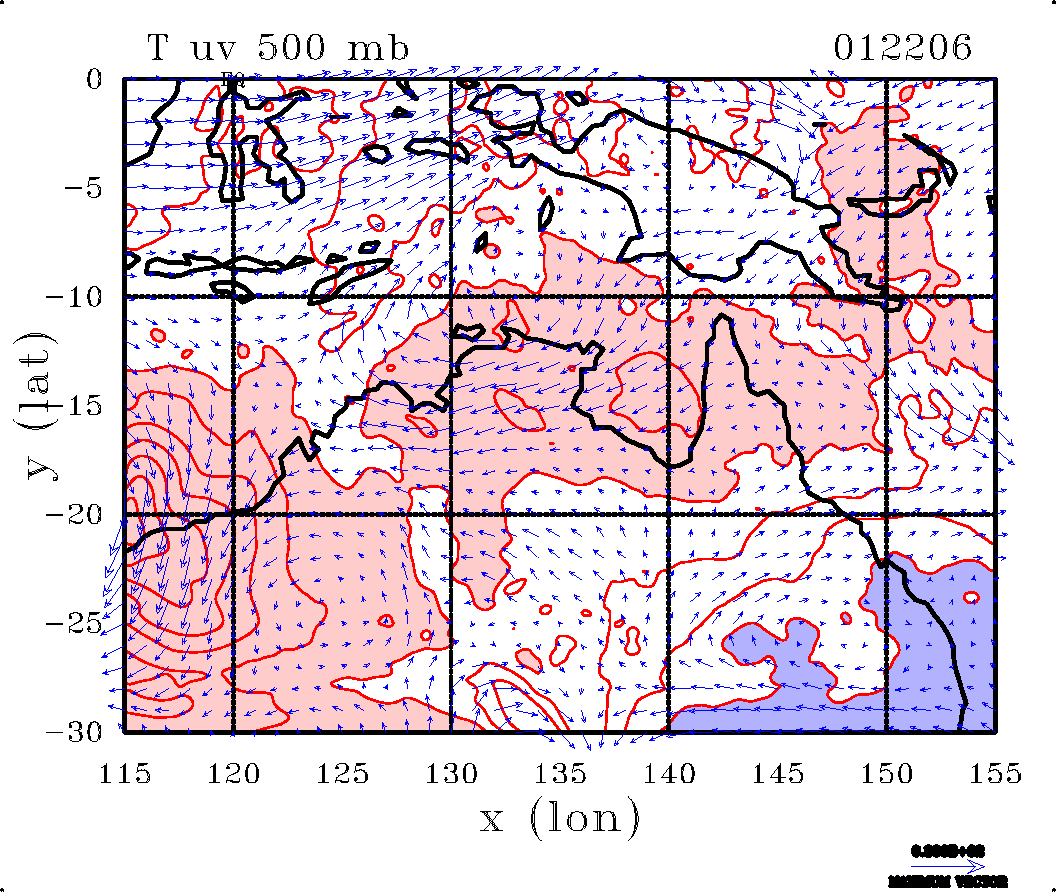
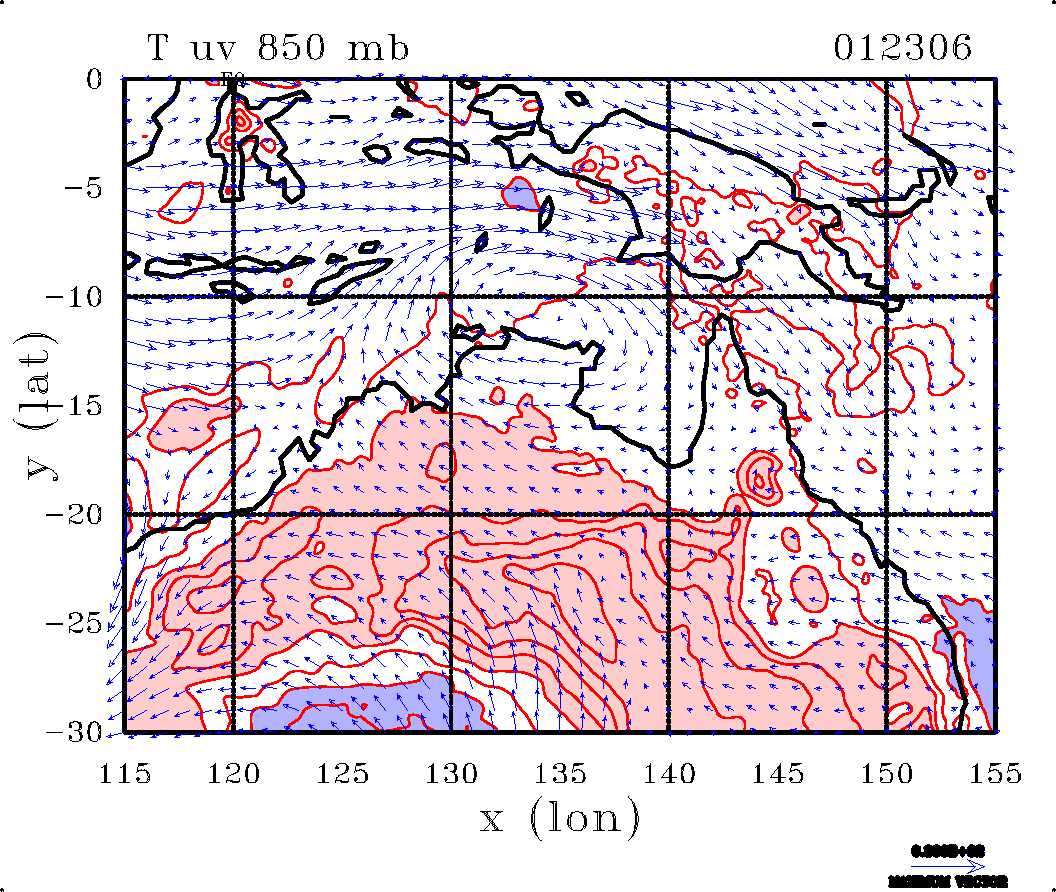
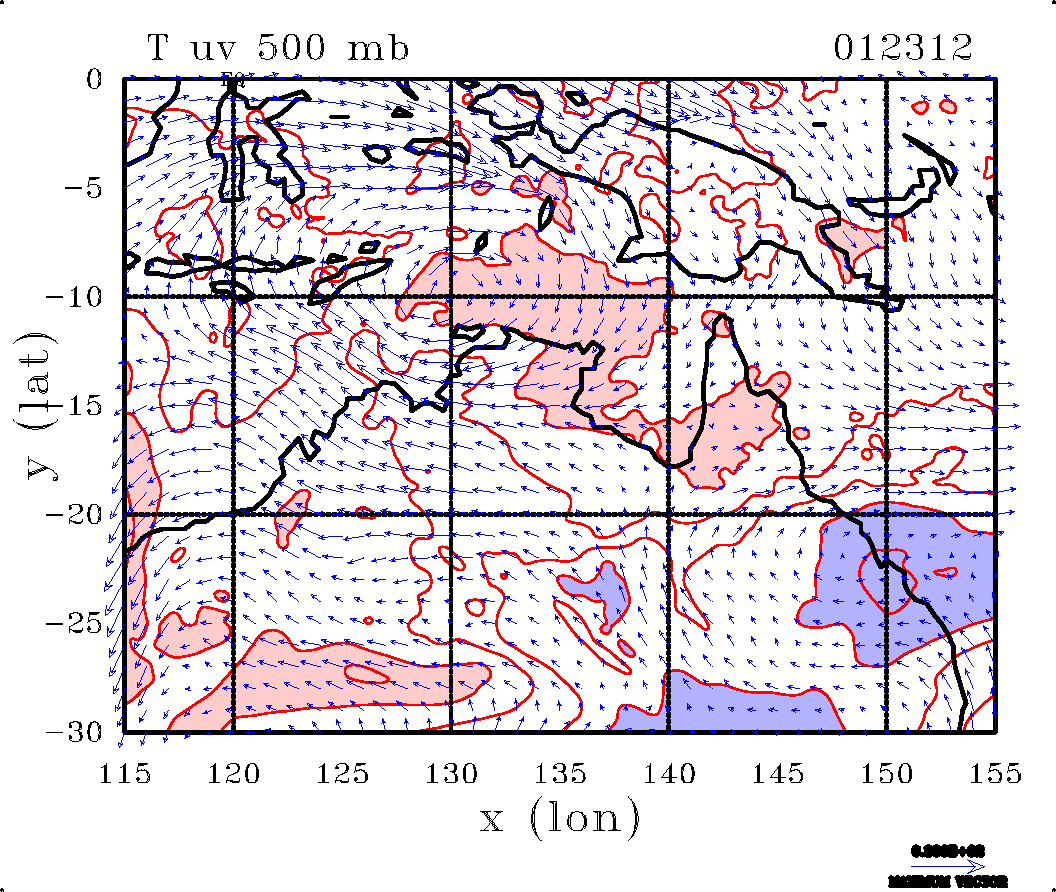
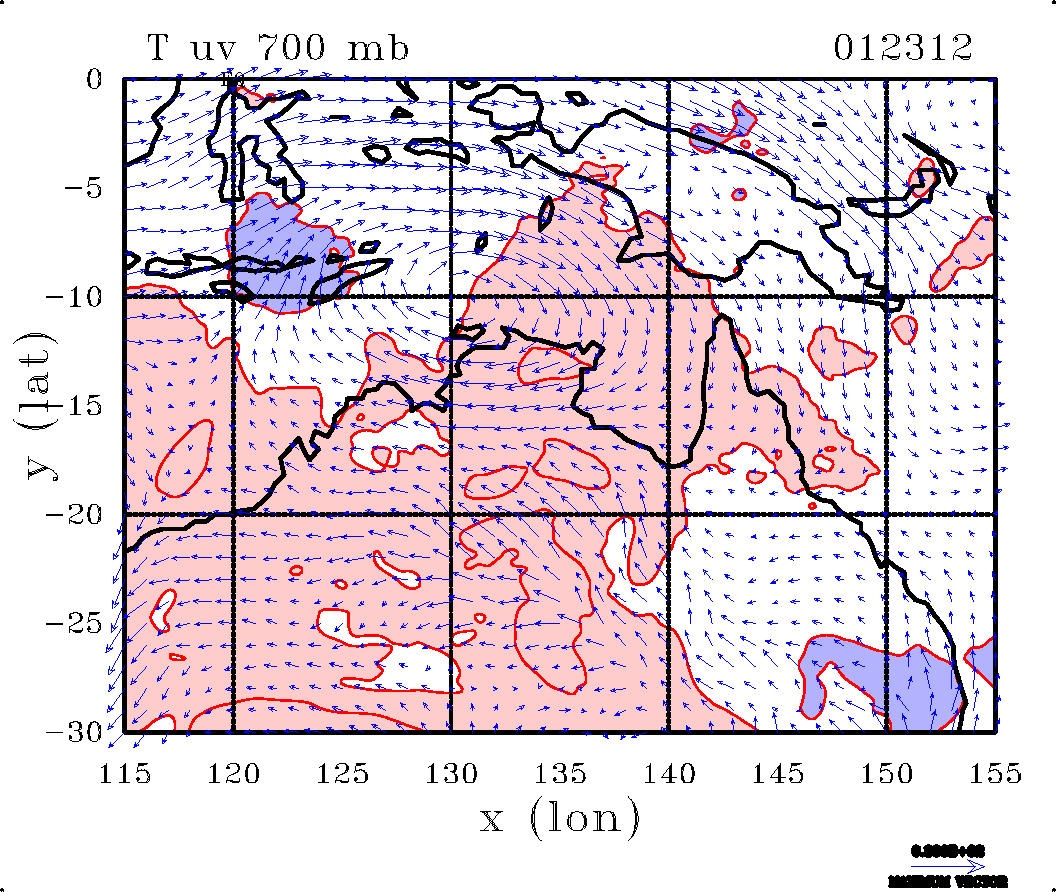
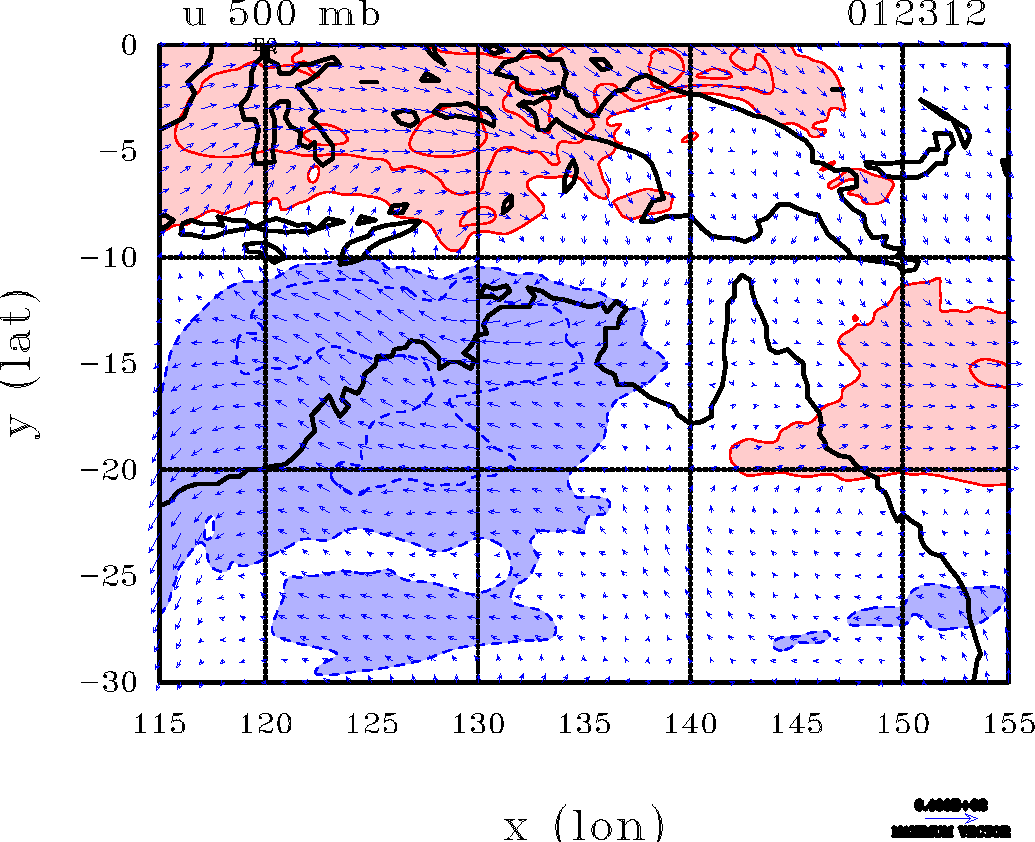
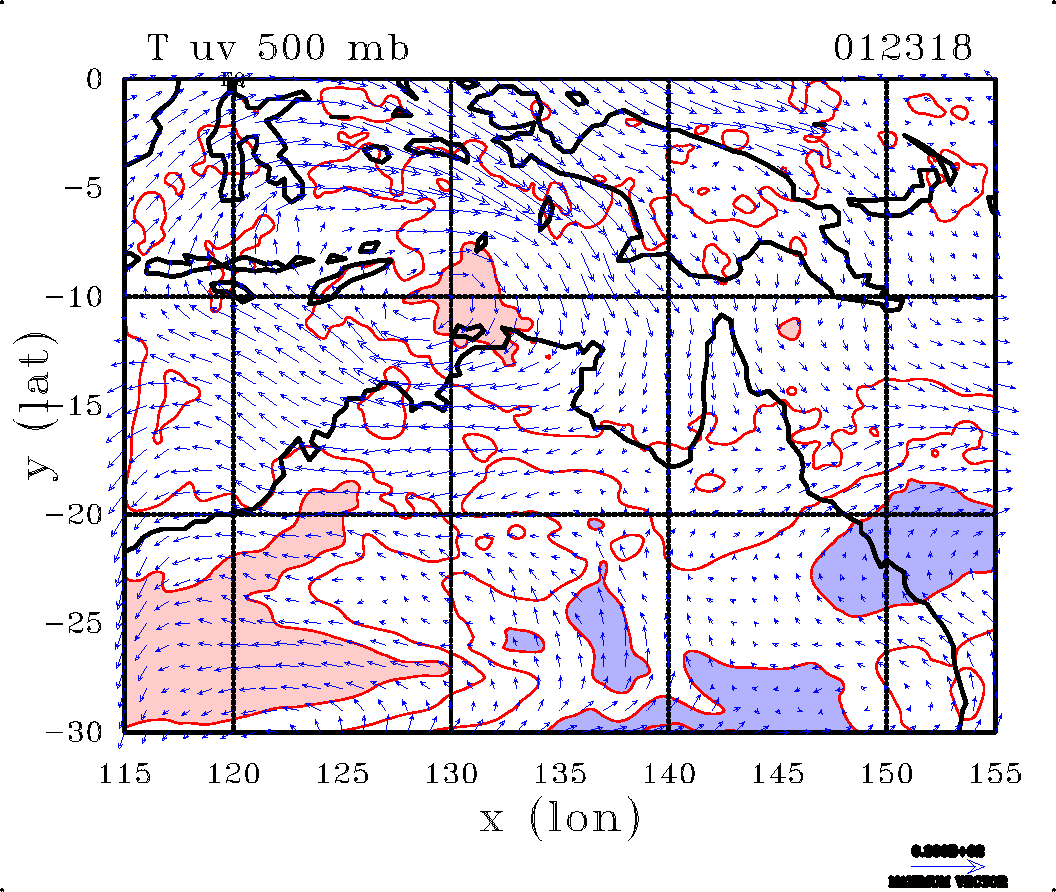
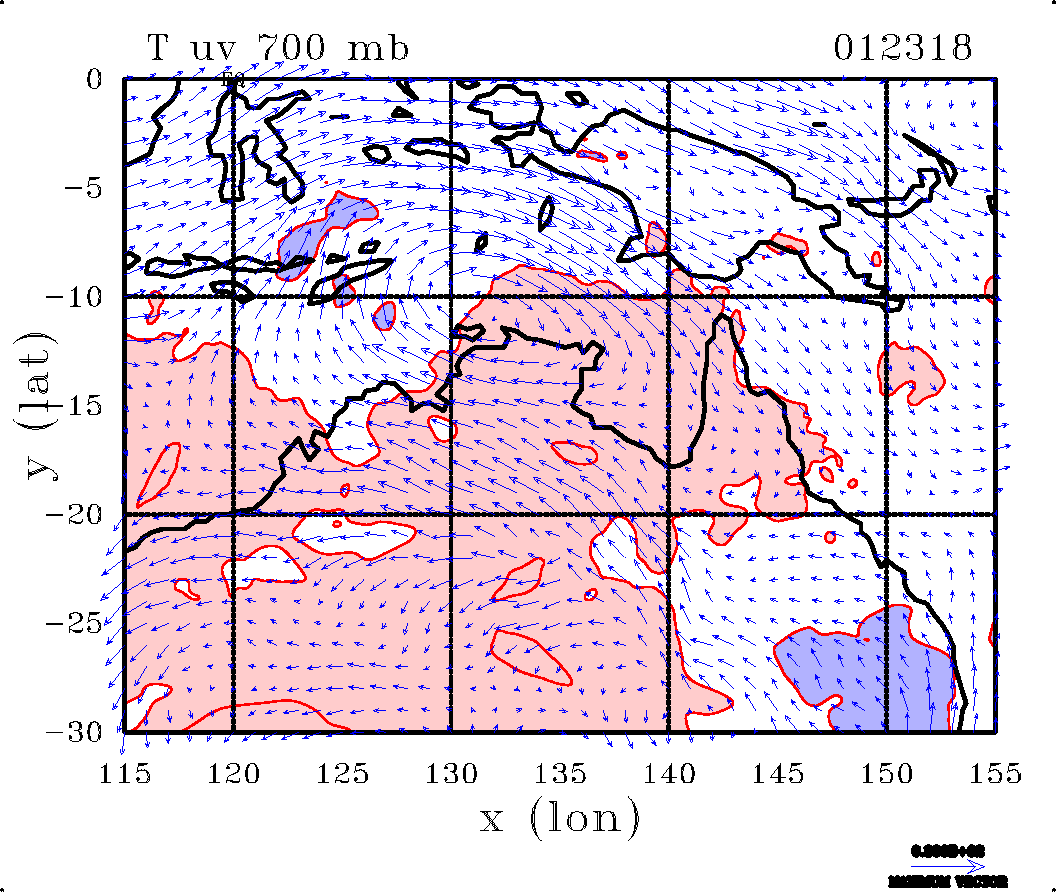
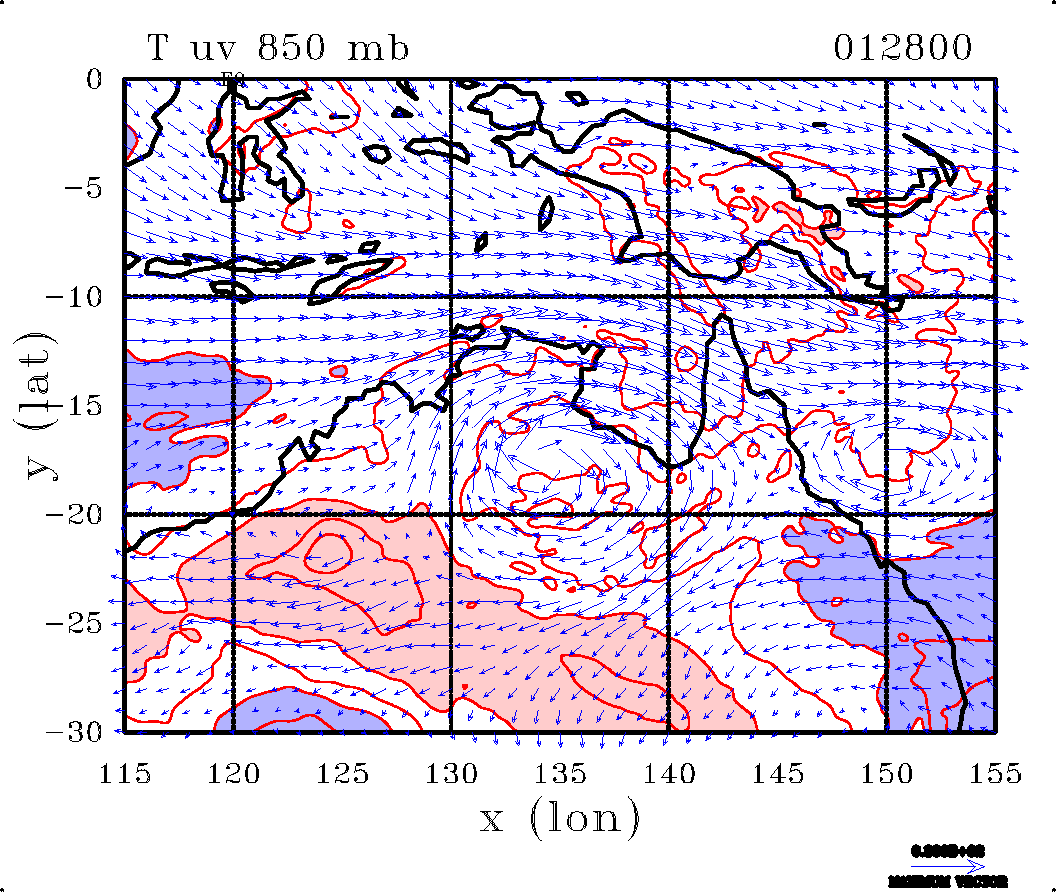
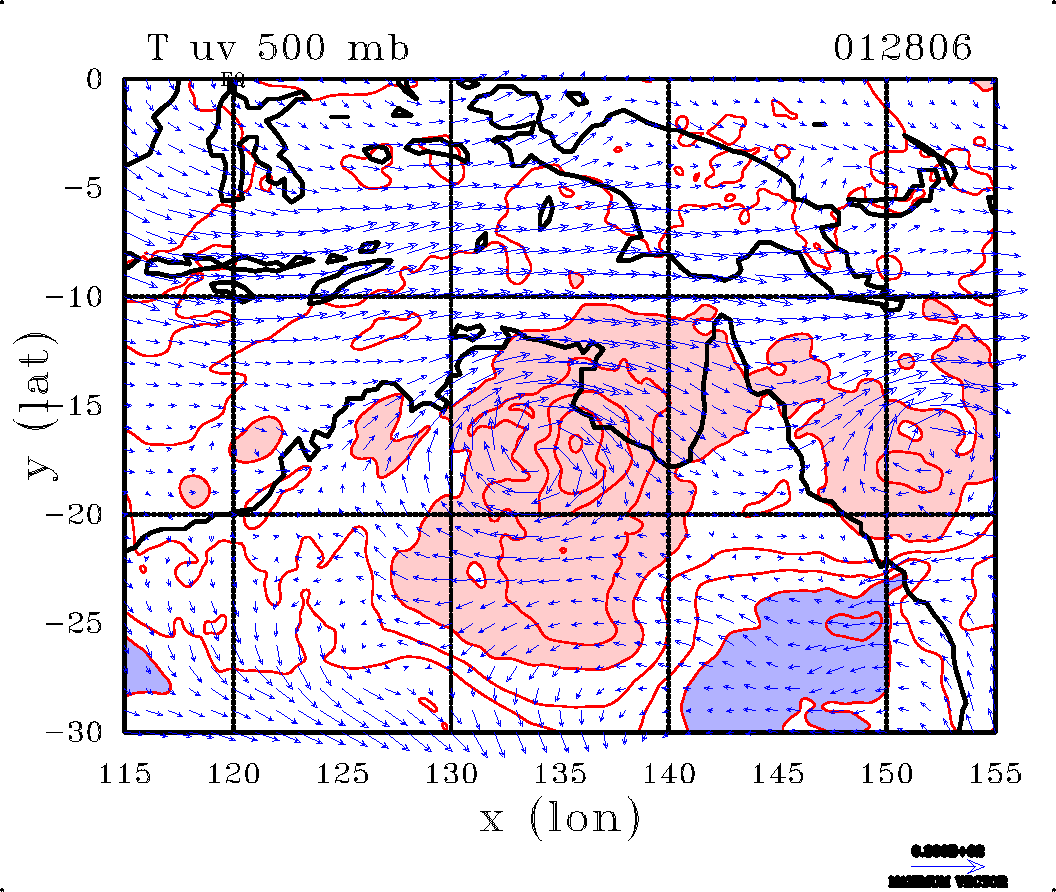
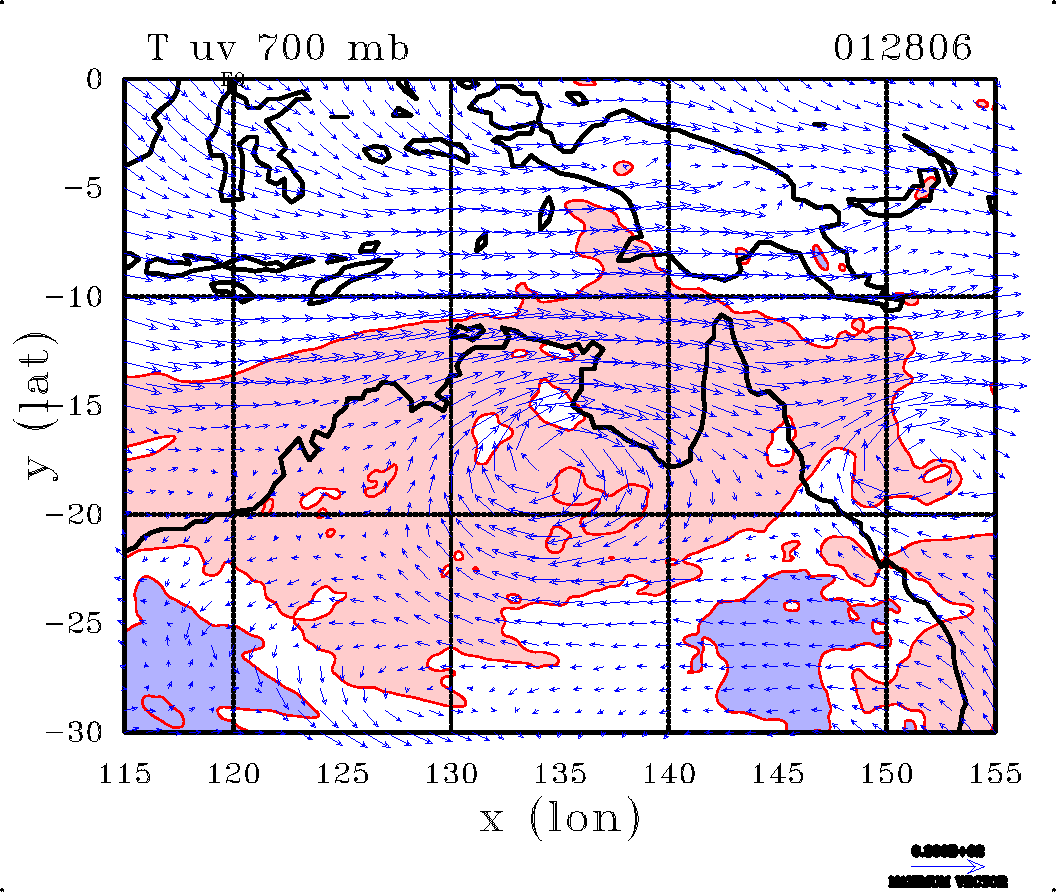
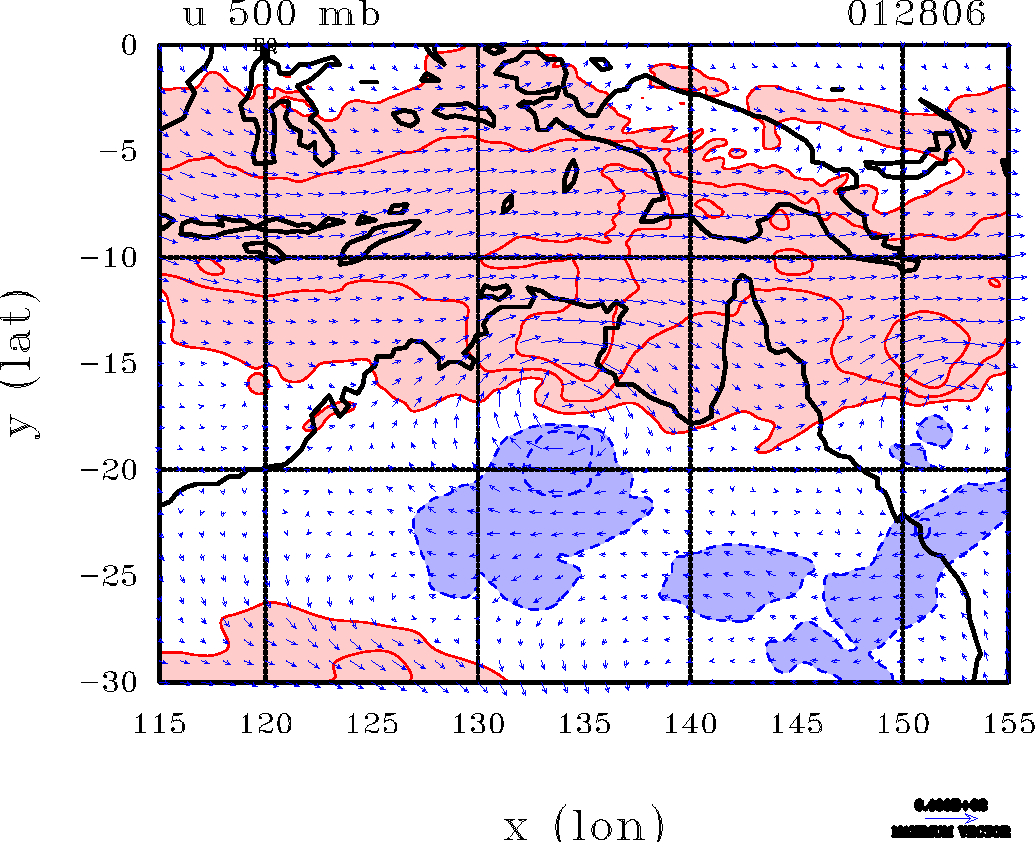
Tropical Cyclone Oswald Jan 2013
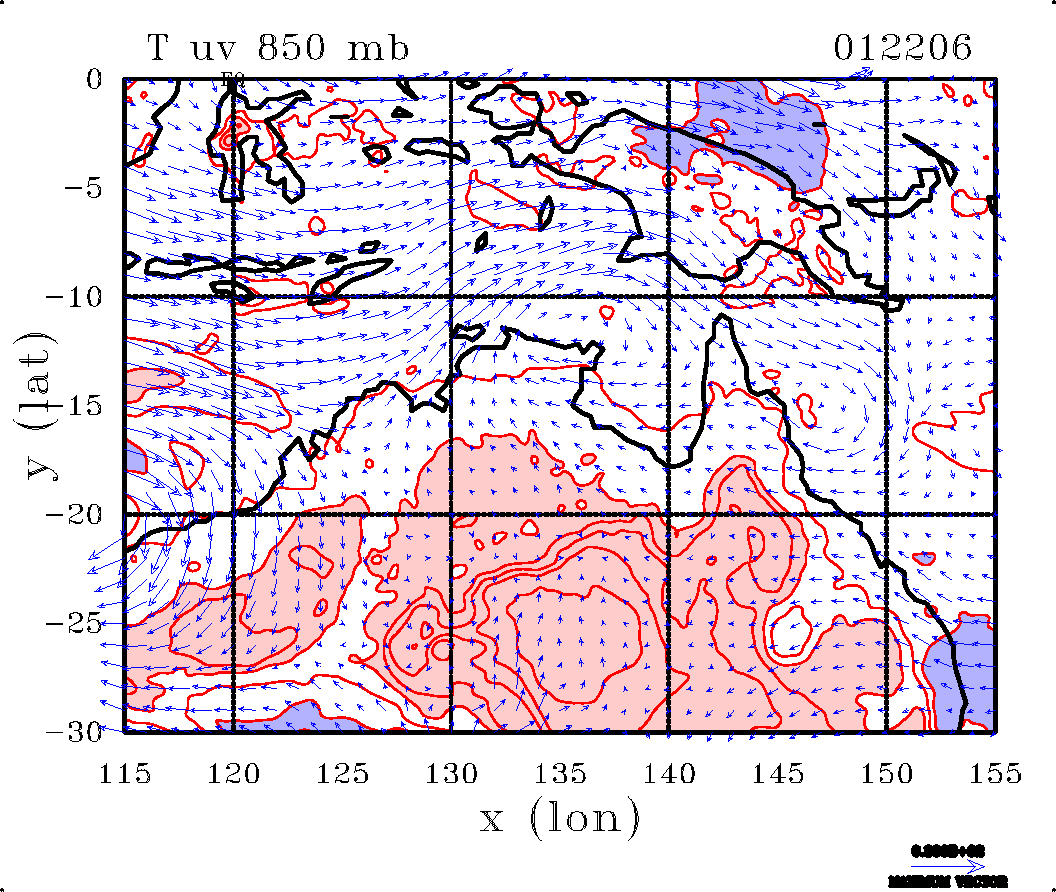
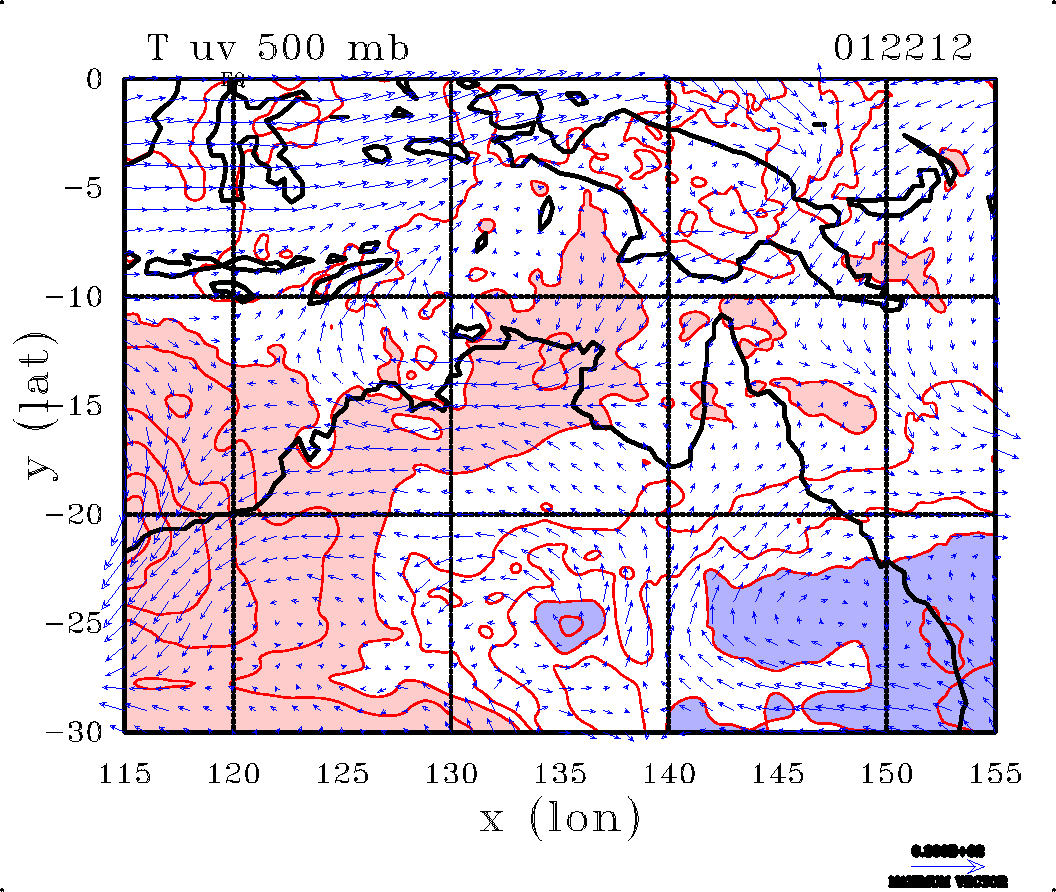
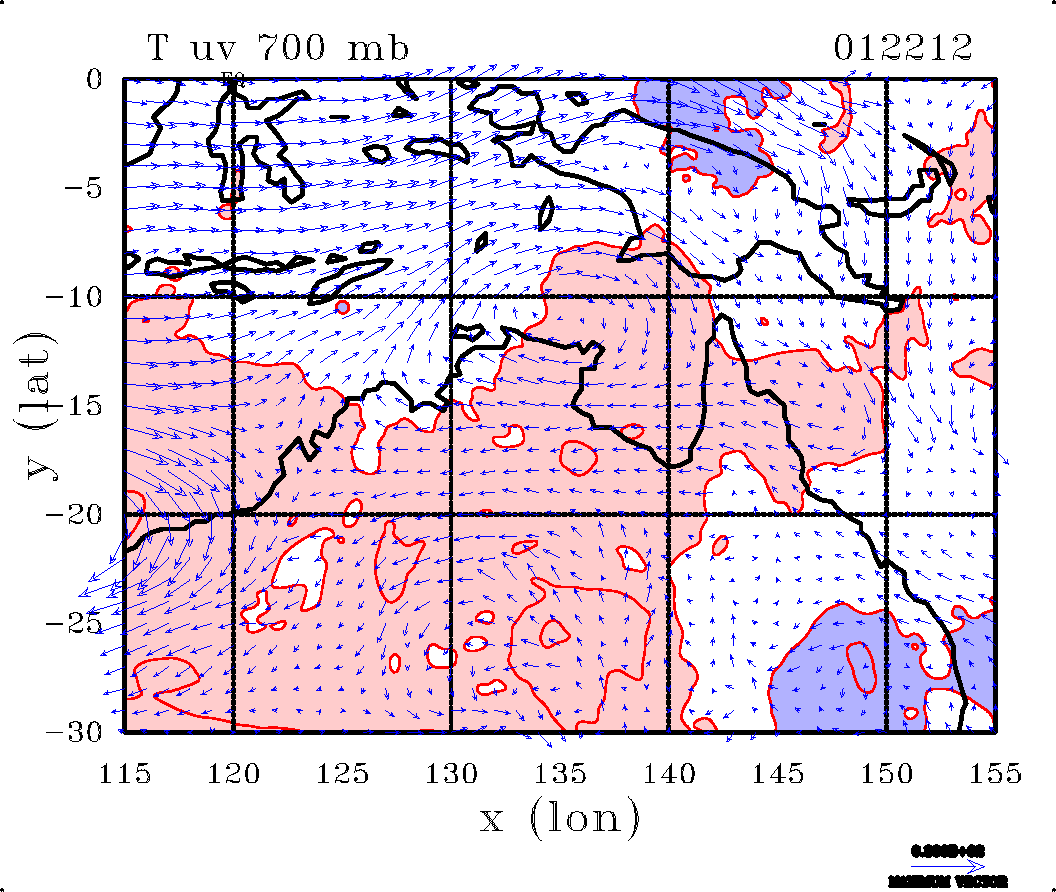
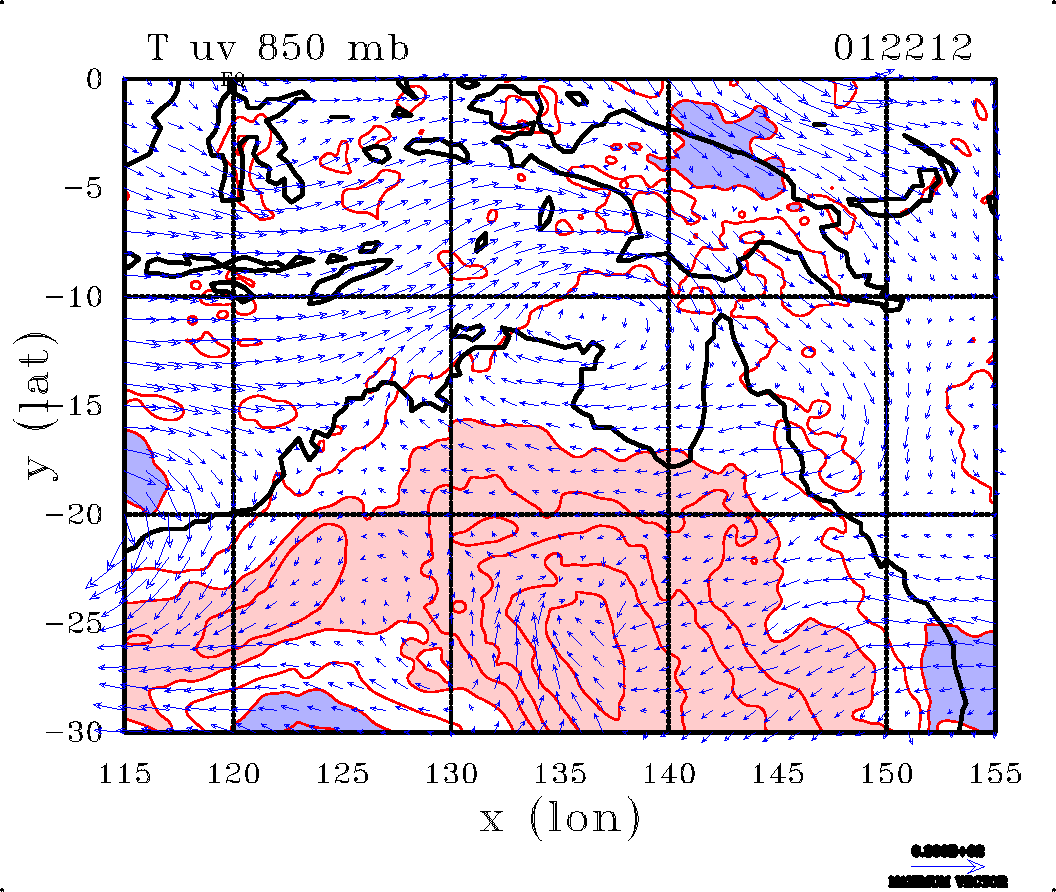
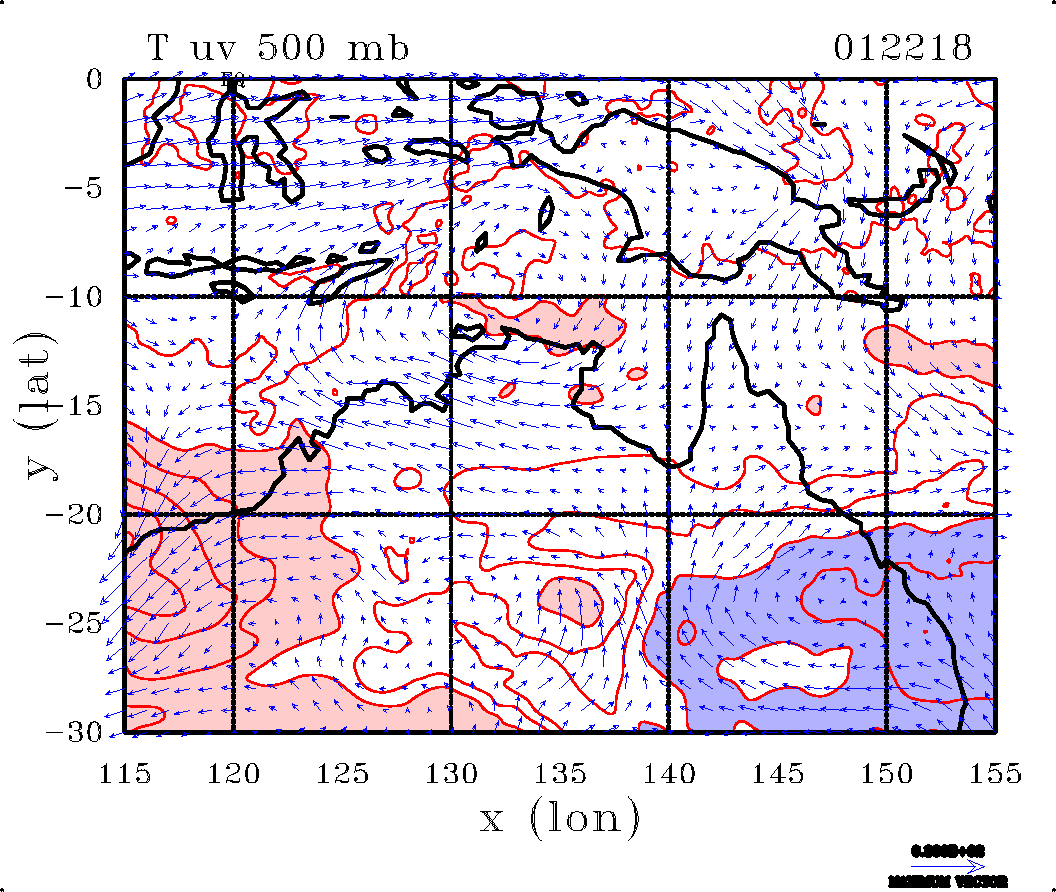
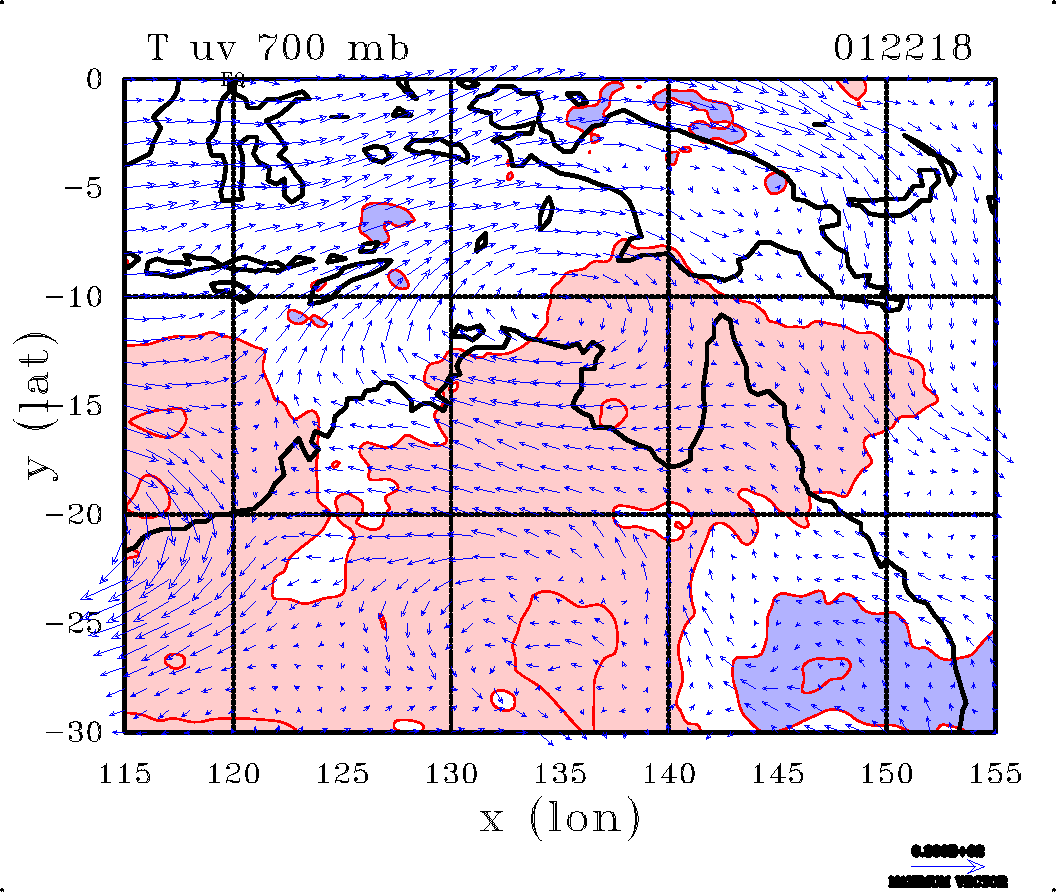
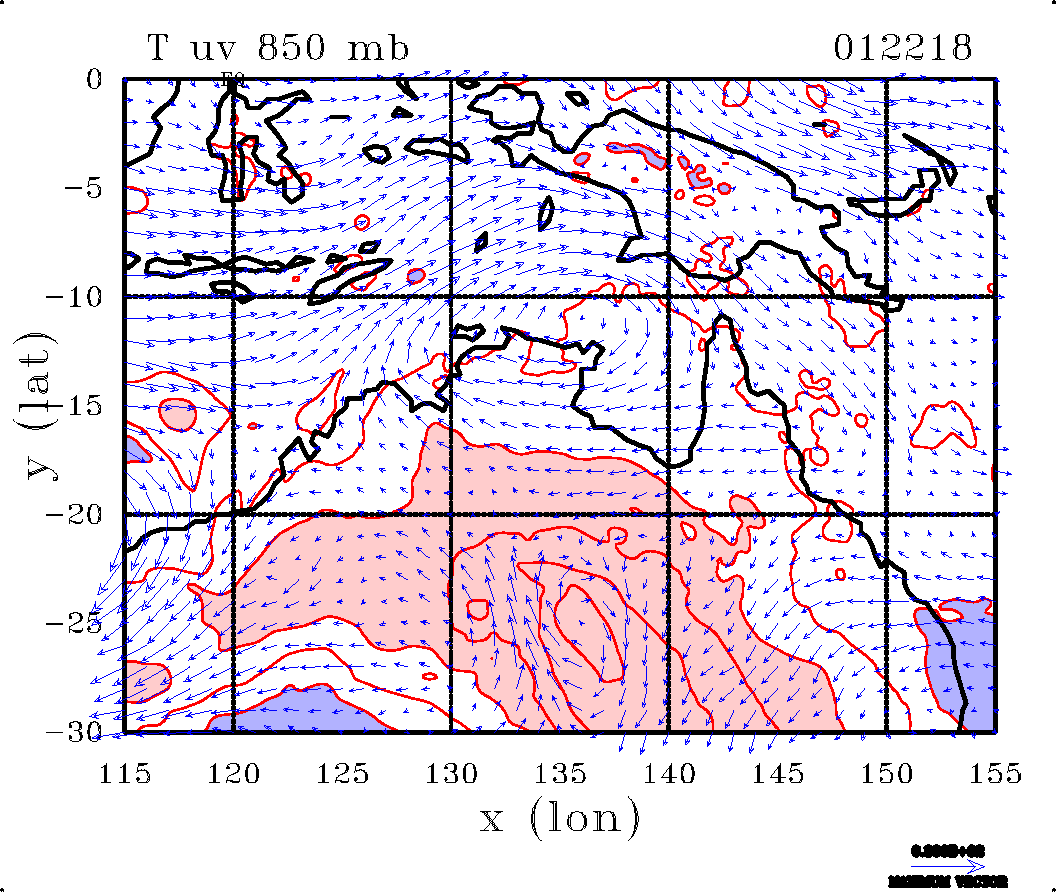
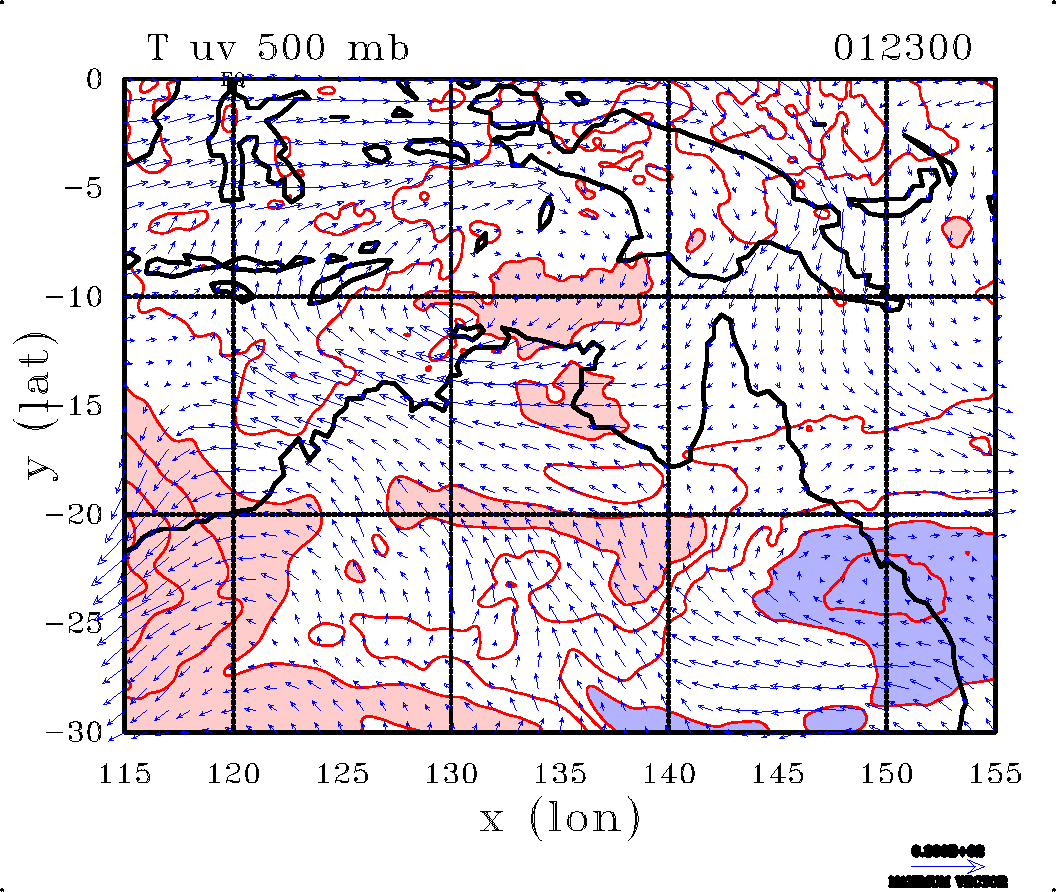
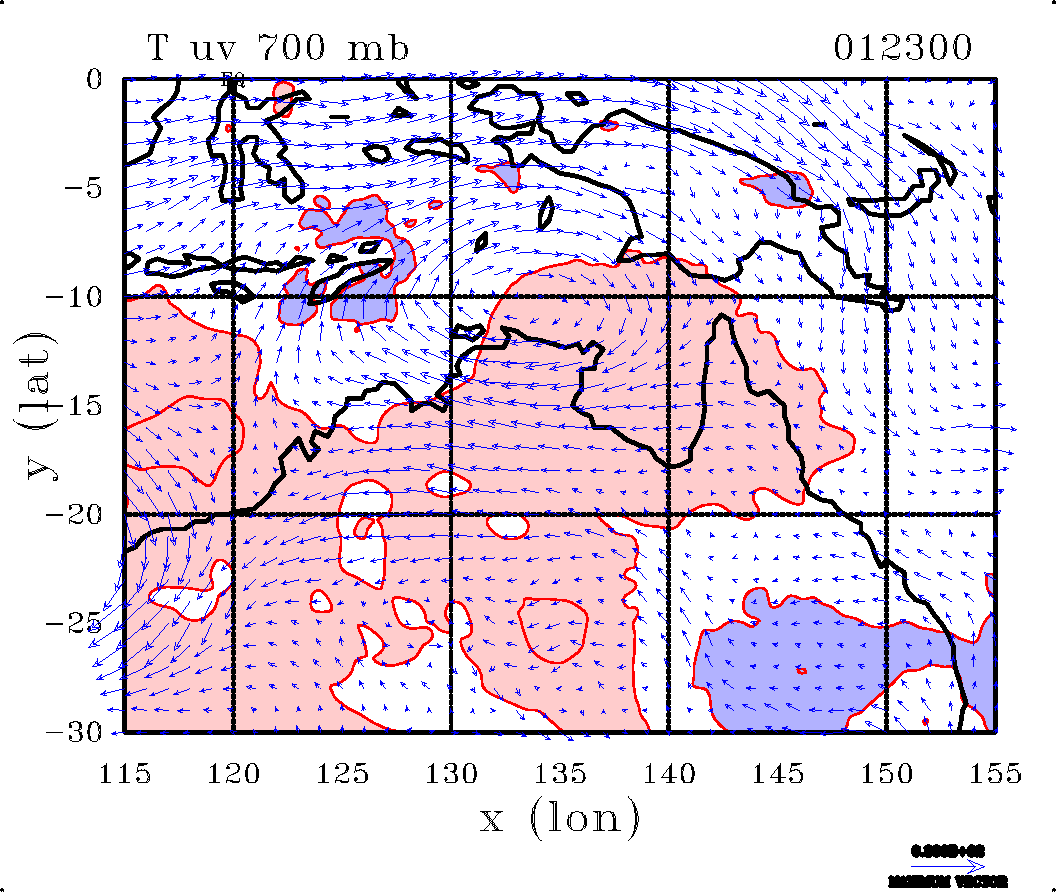
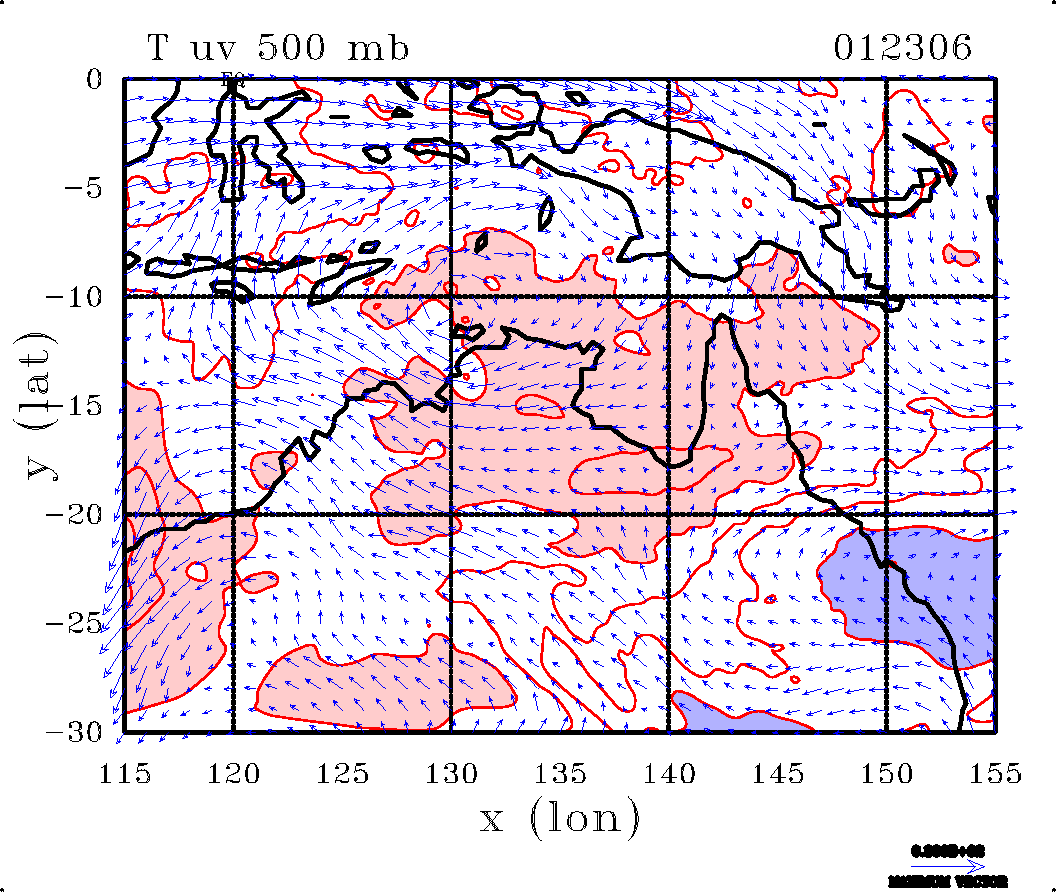
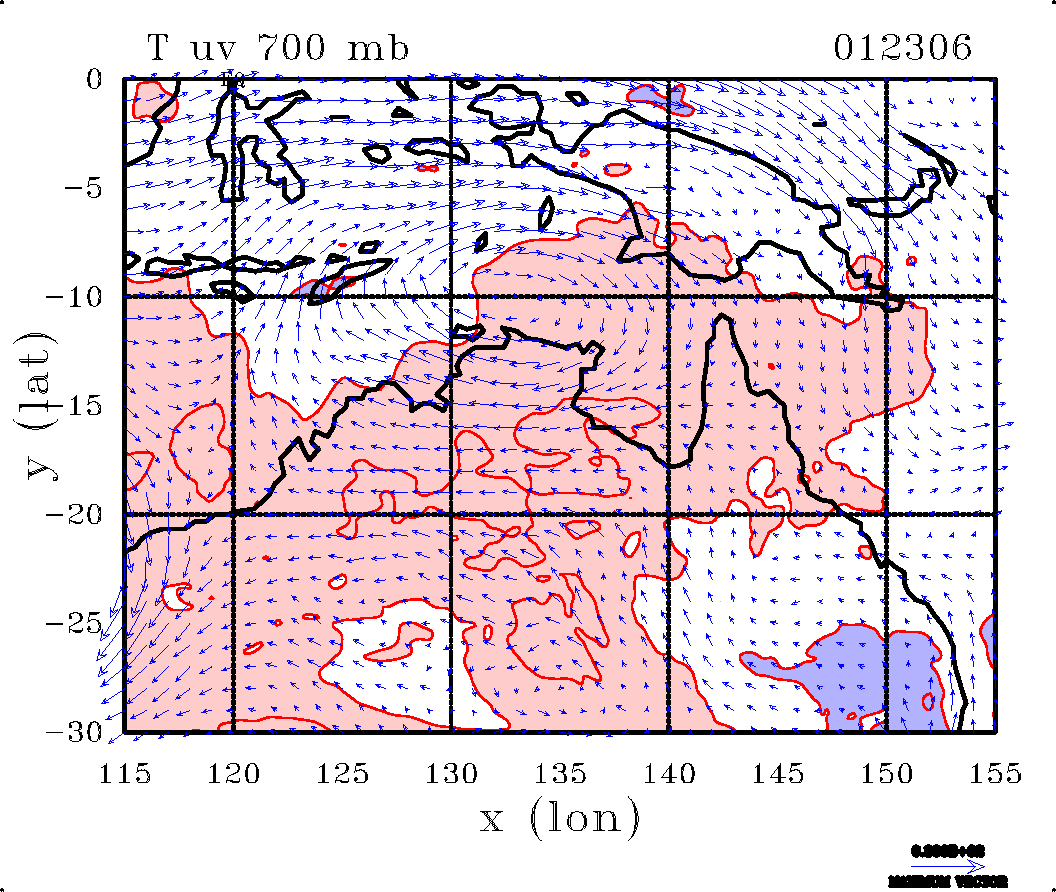
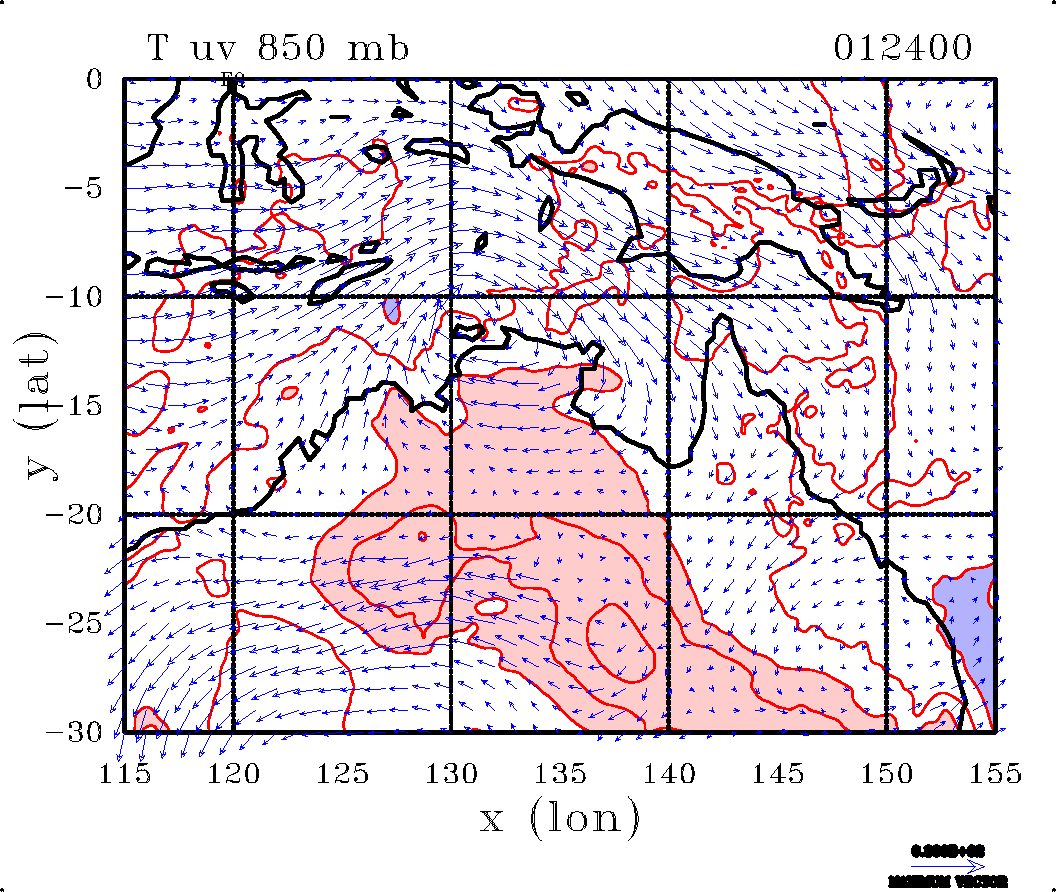
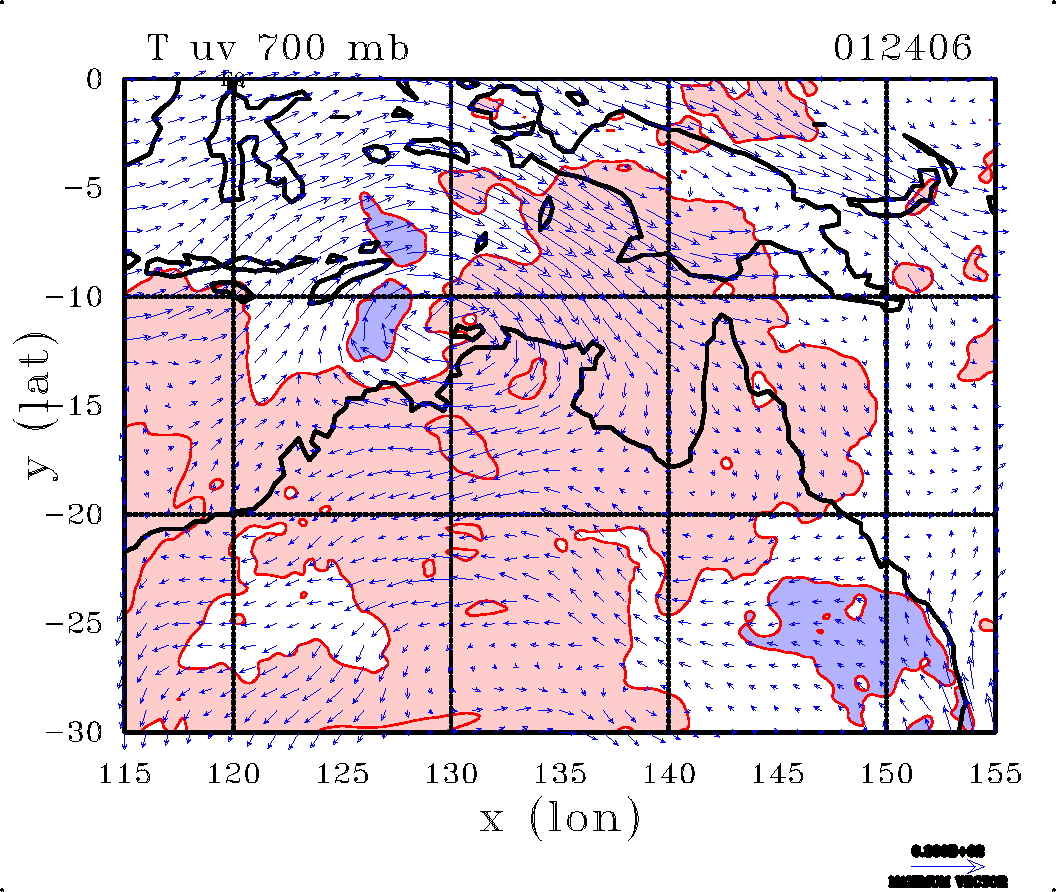
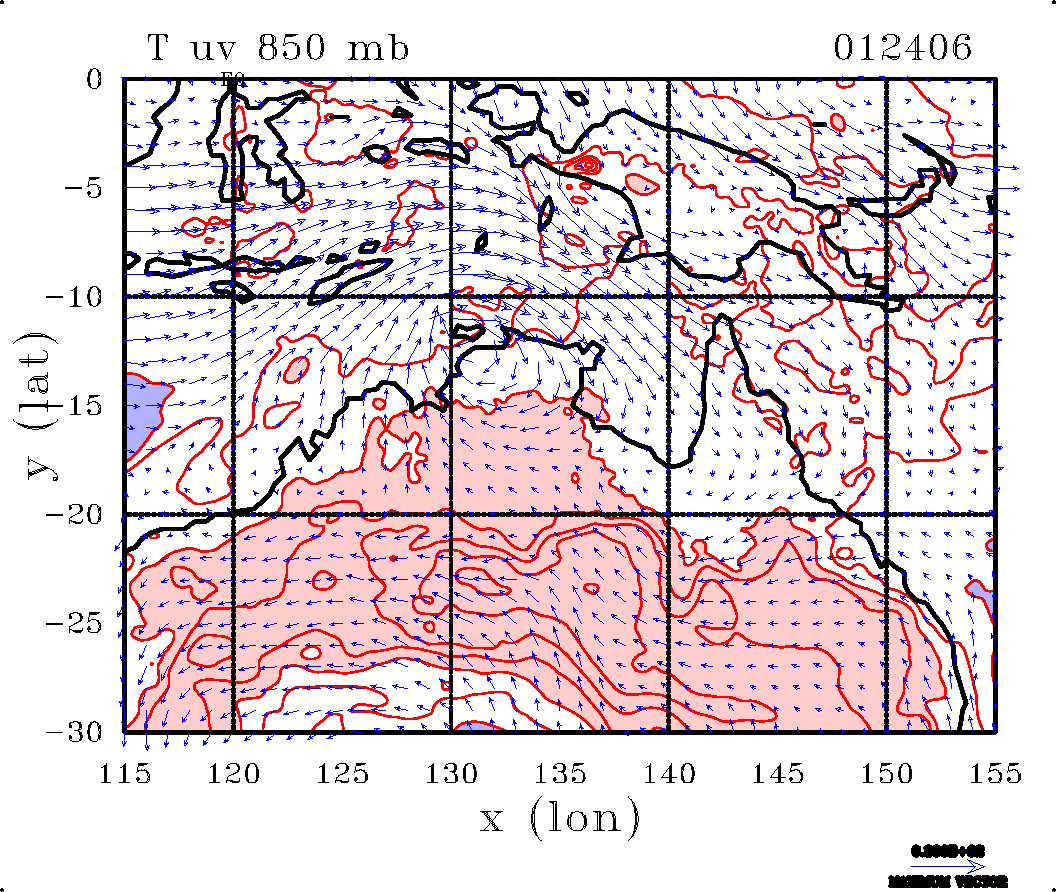
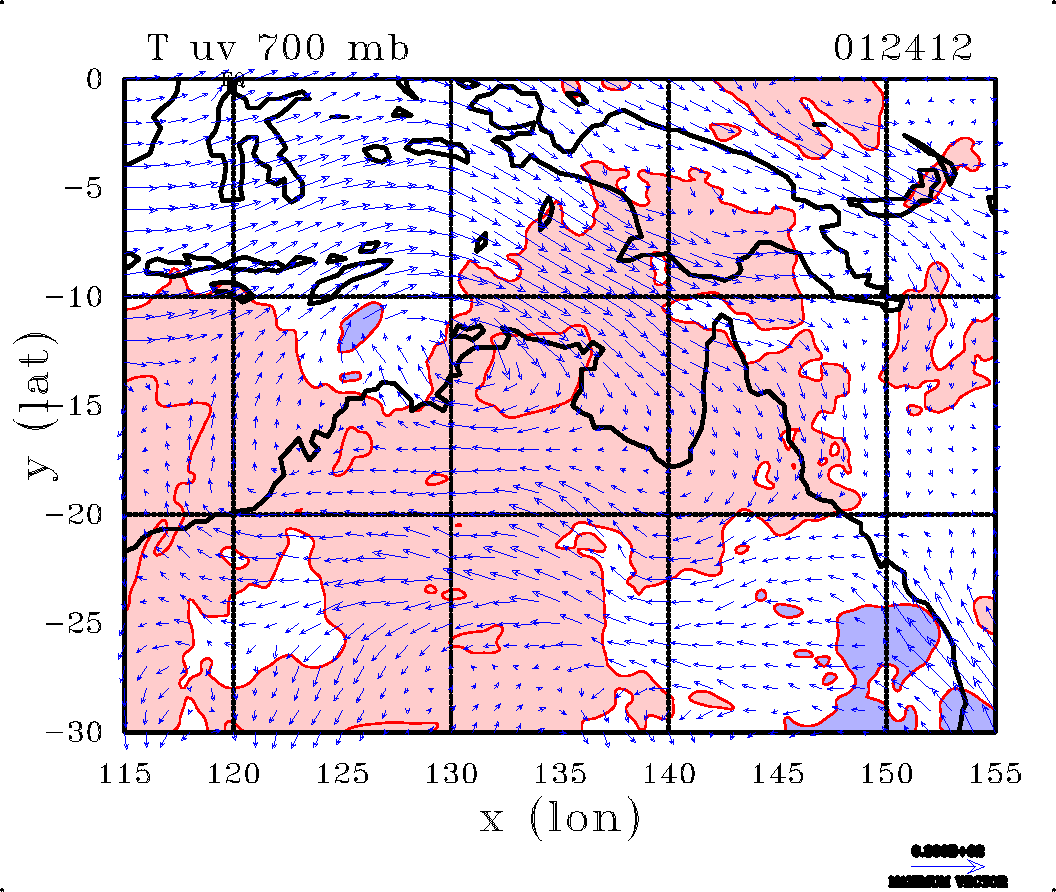
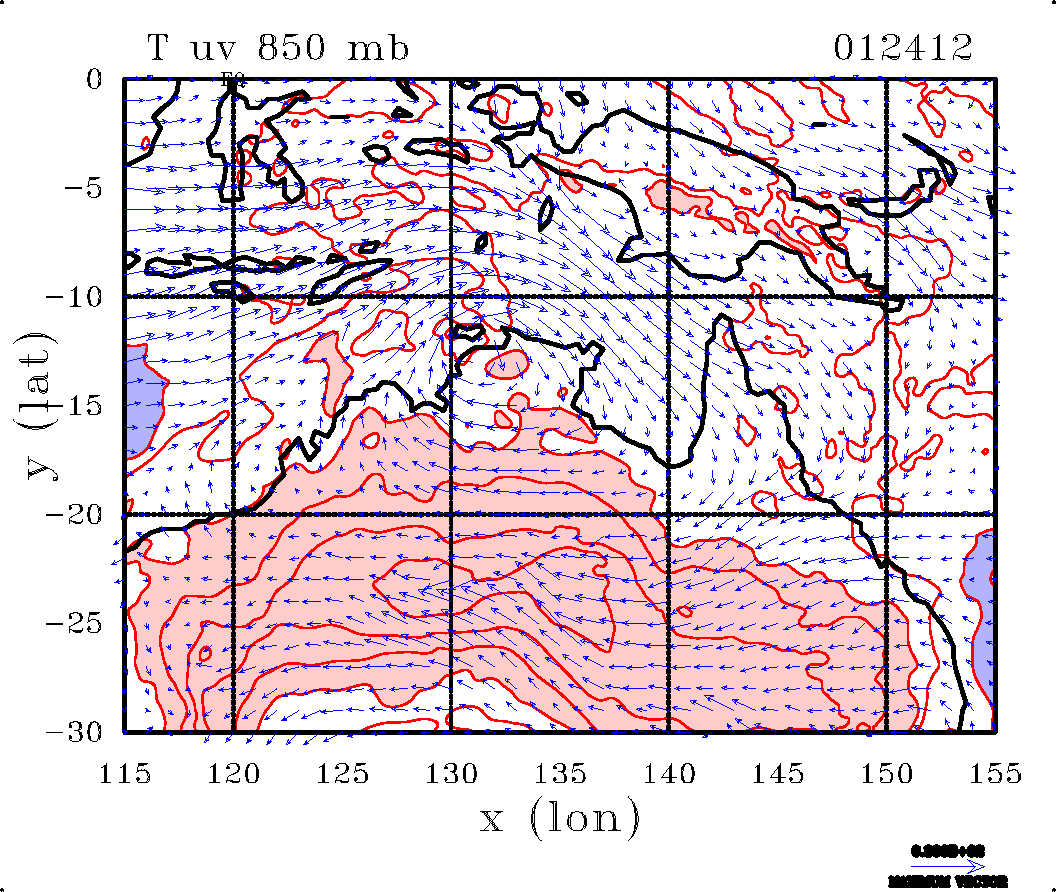
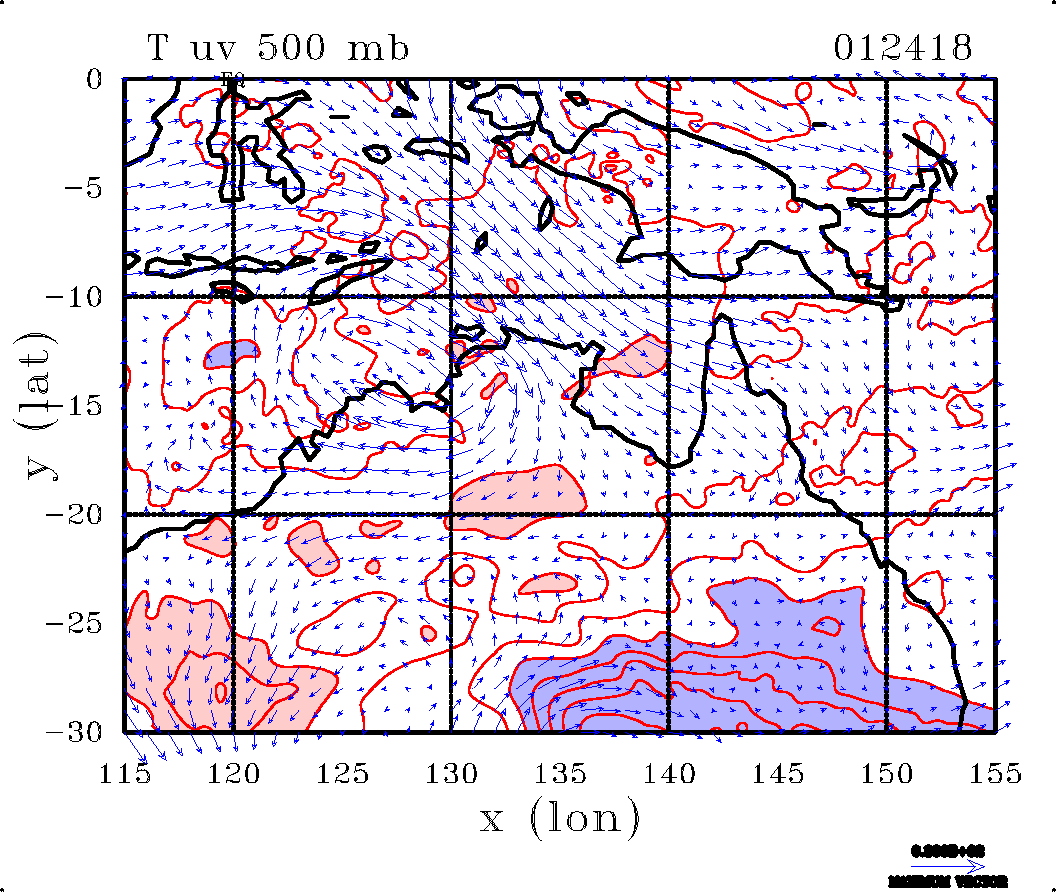
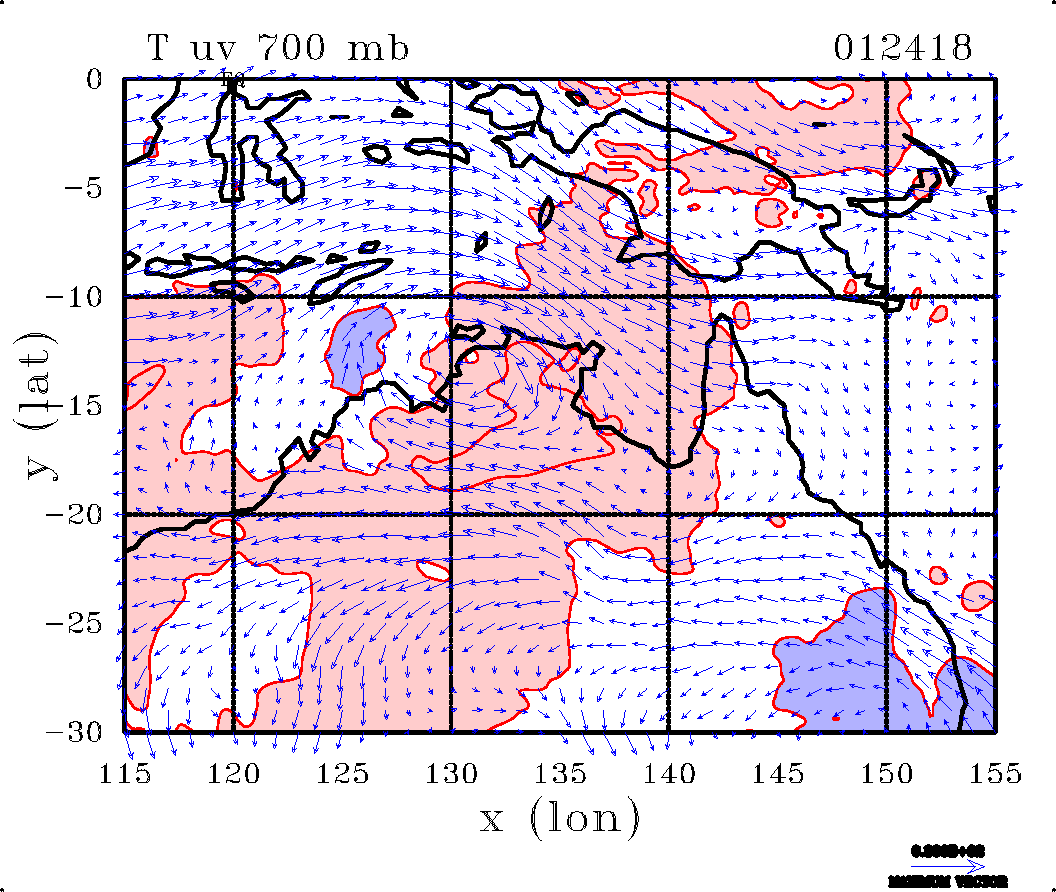
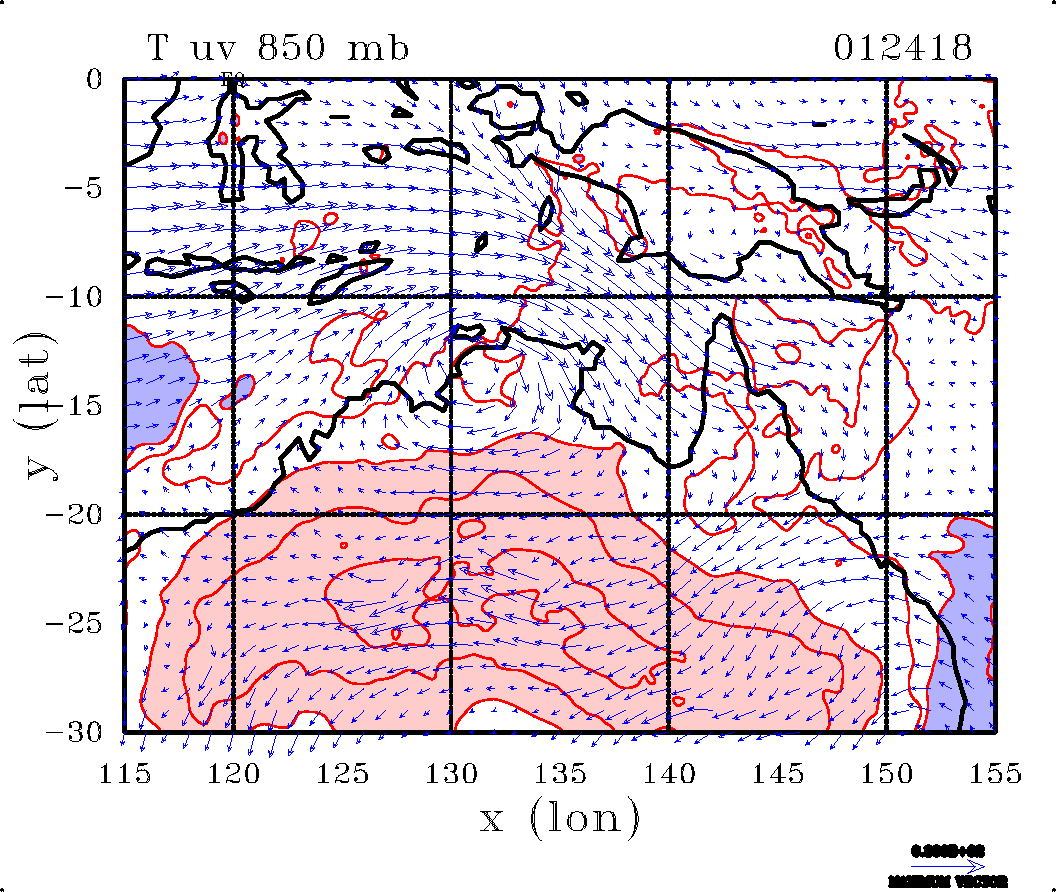
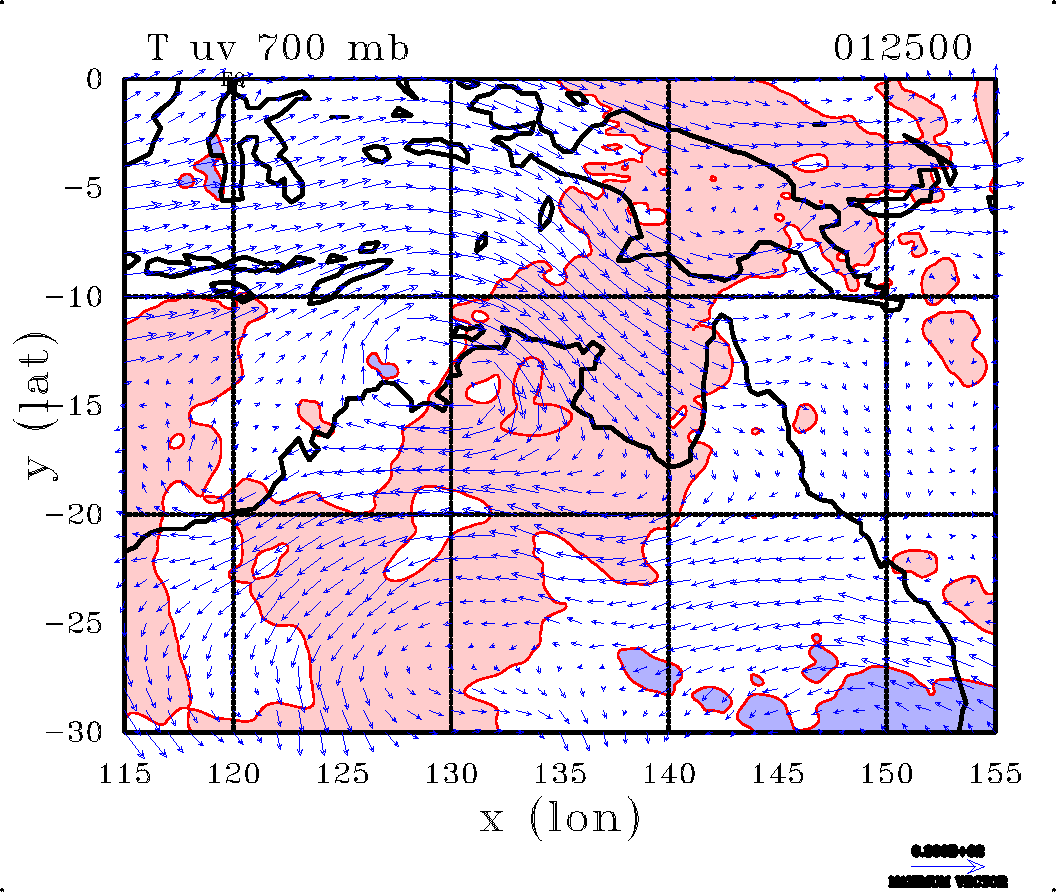
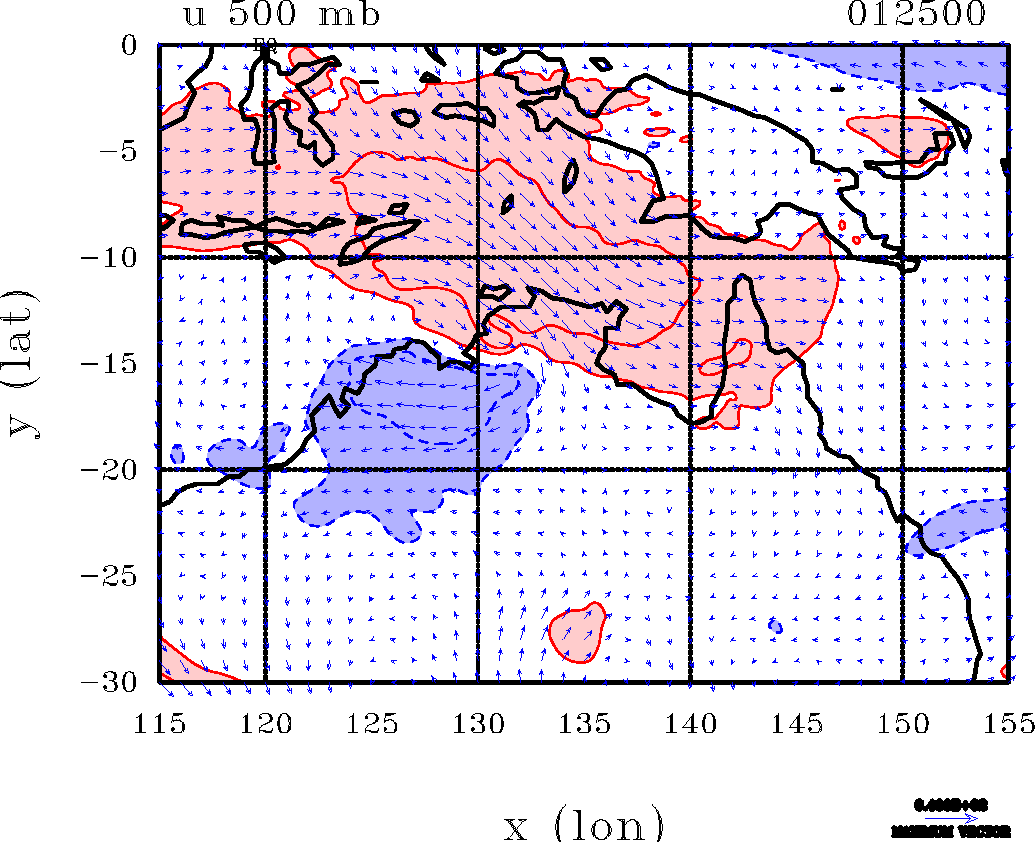
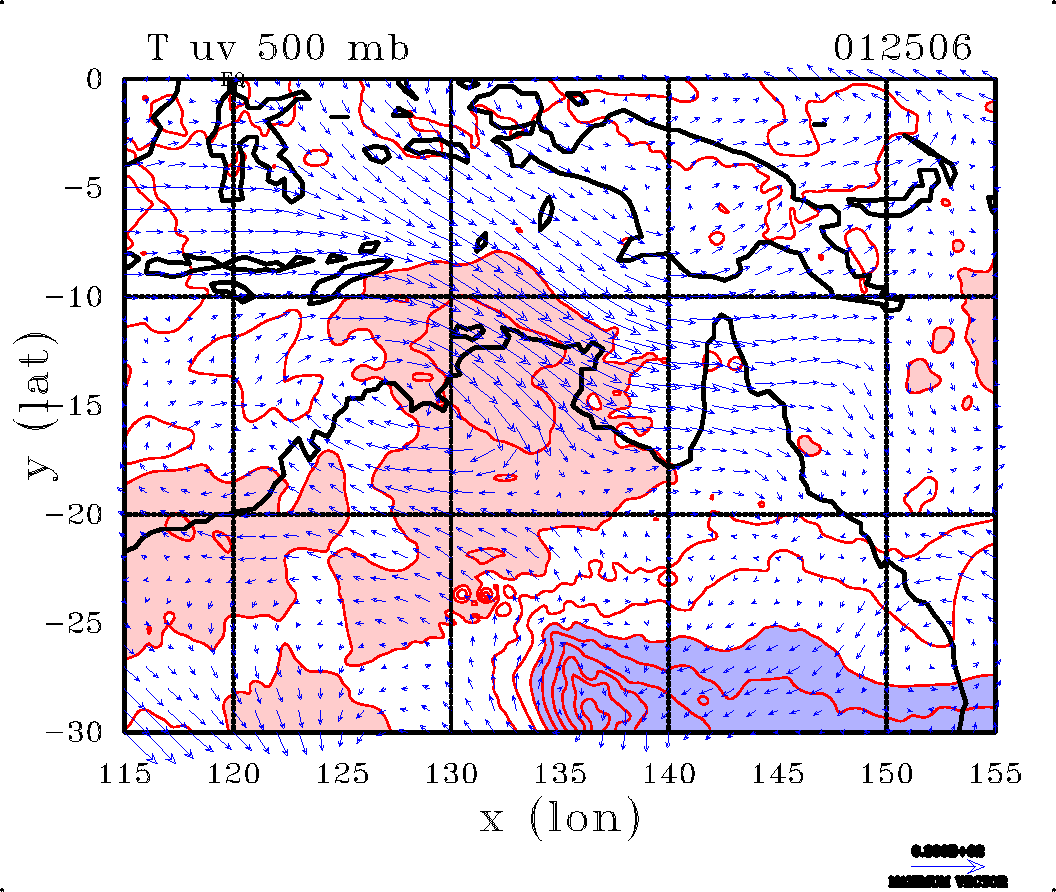
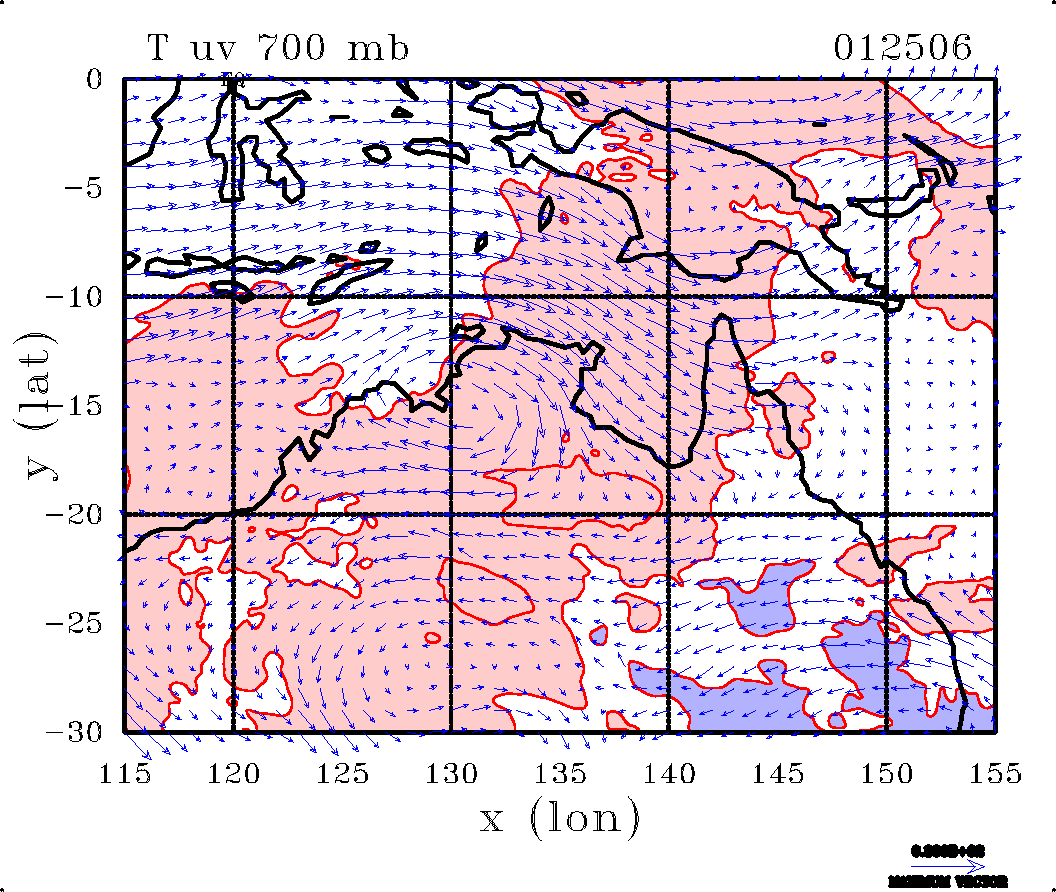
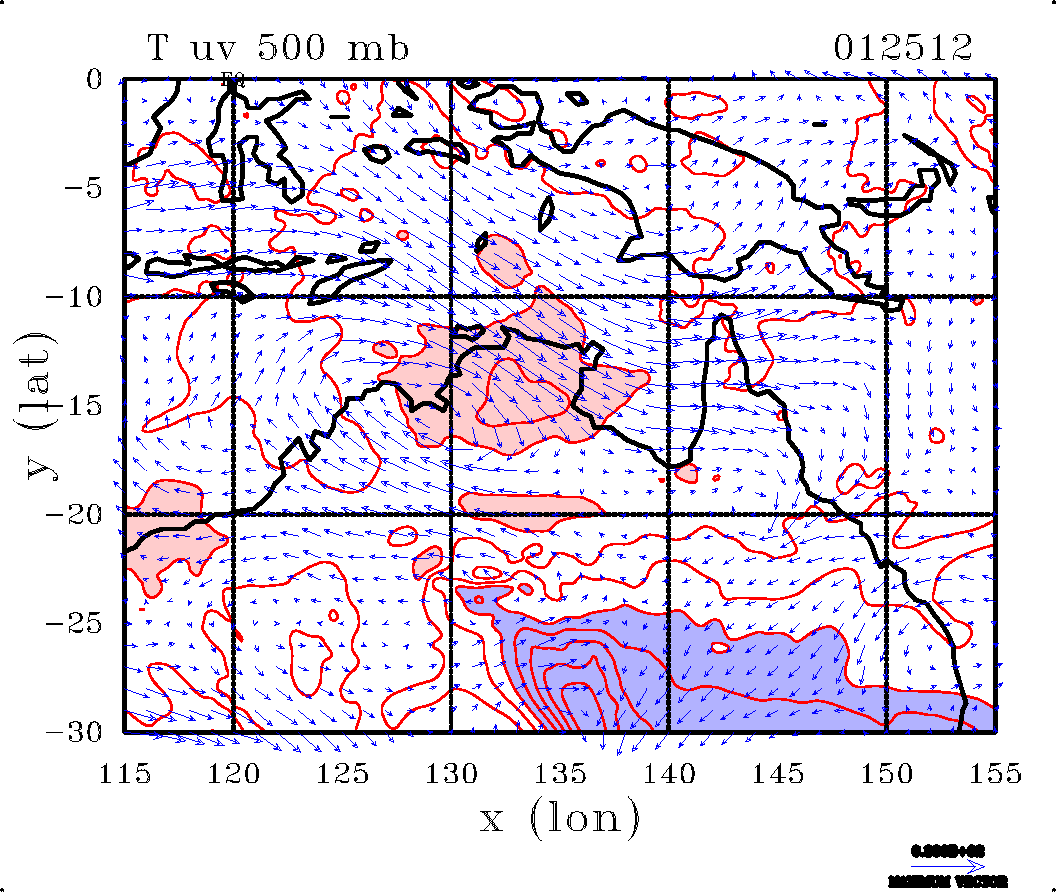
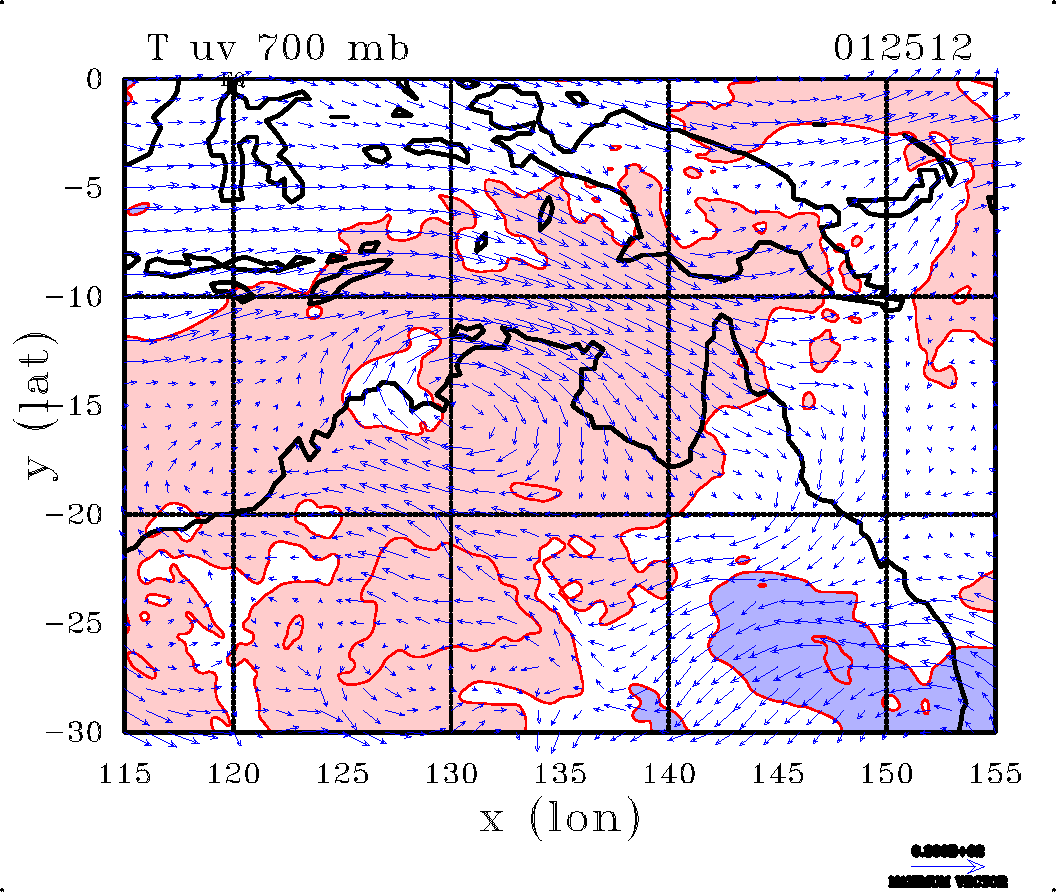
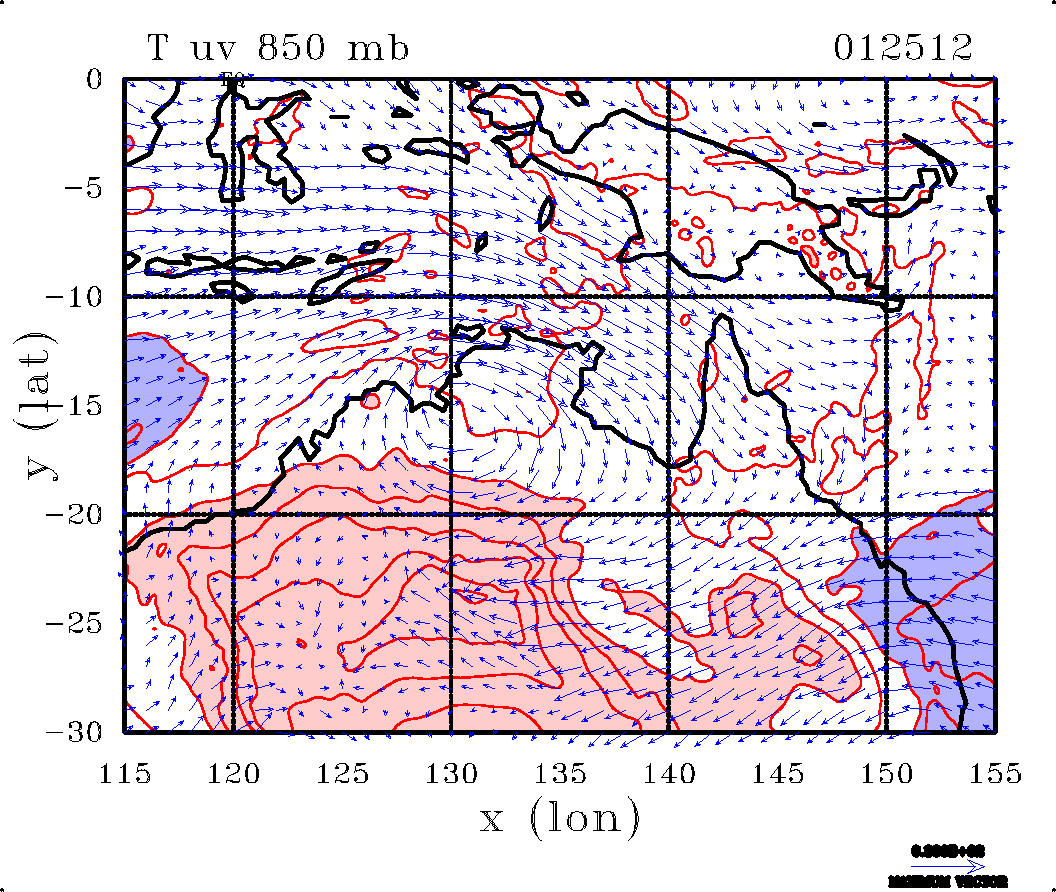
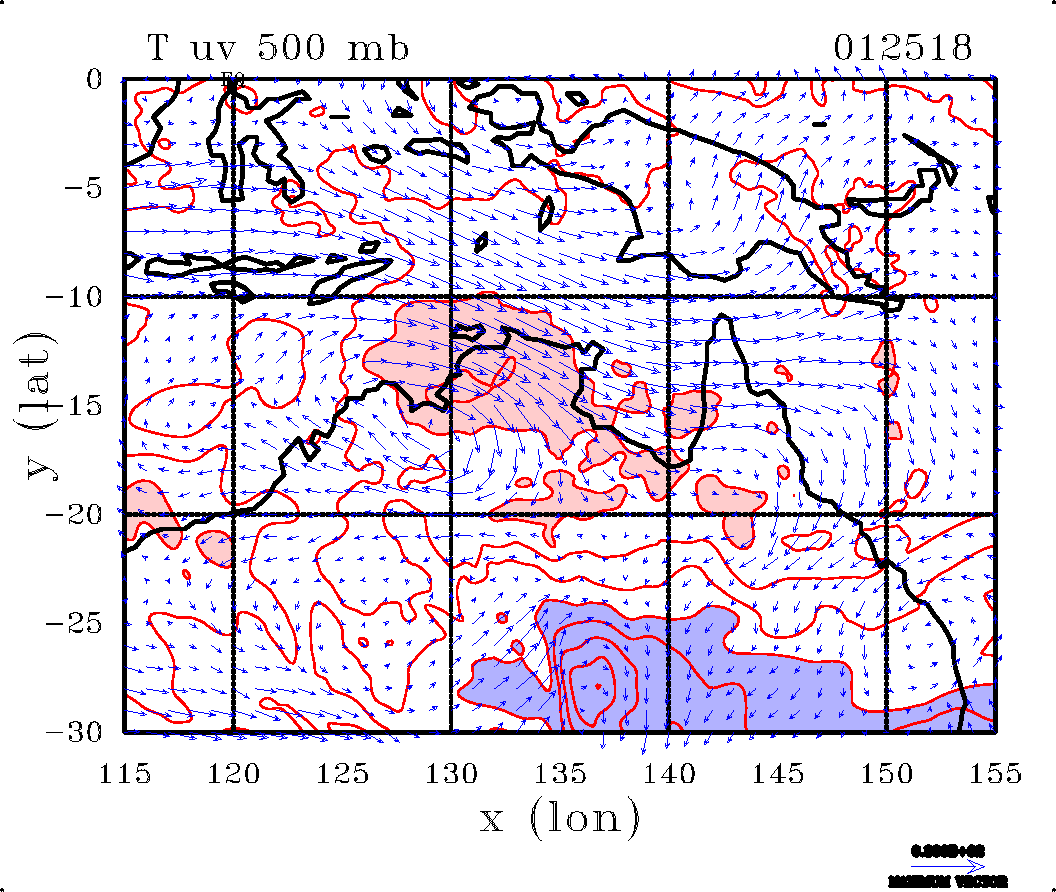
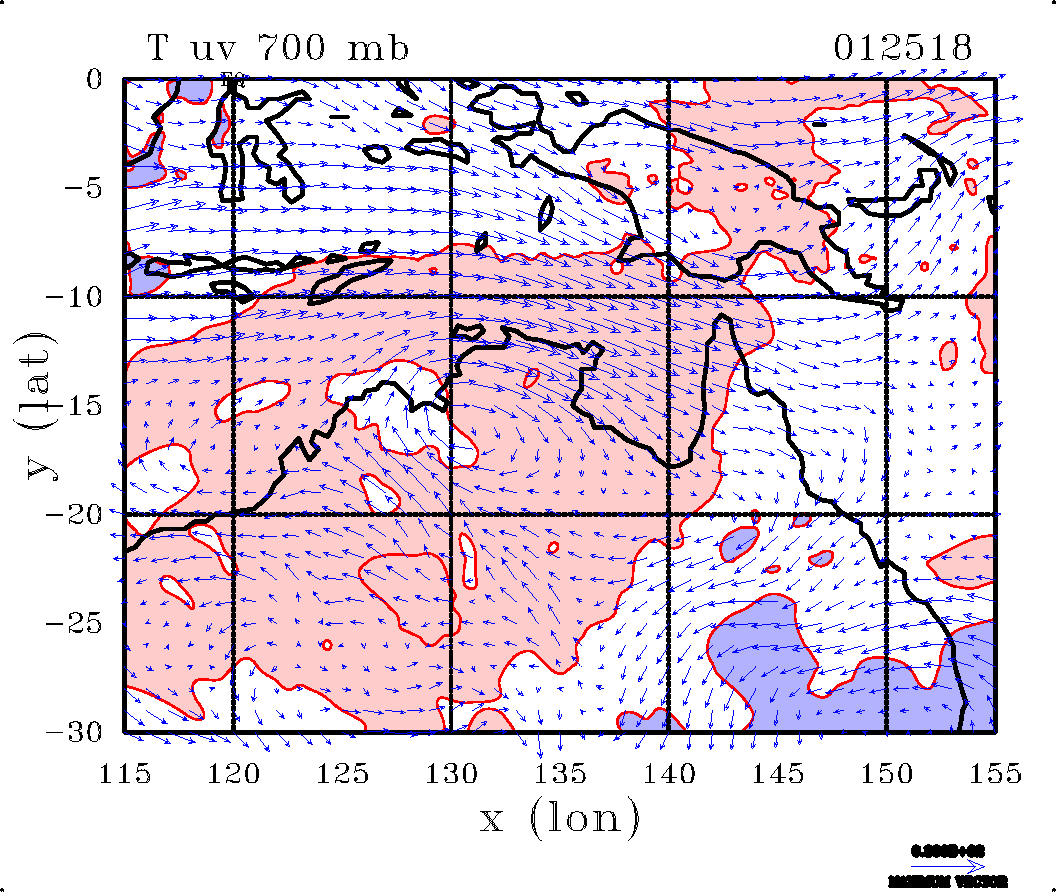
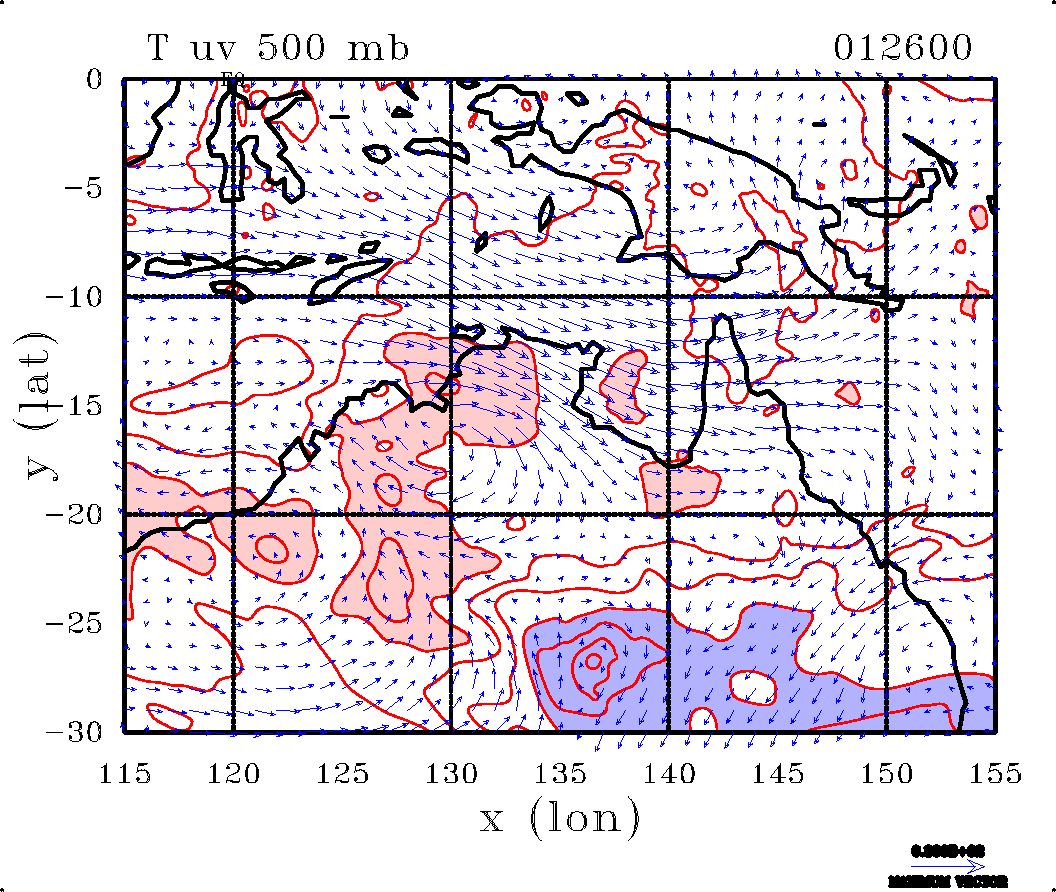
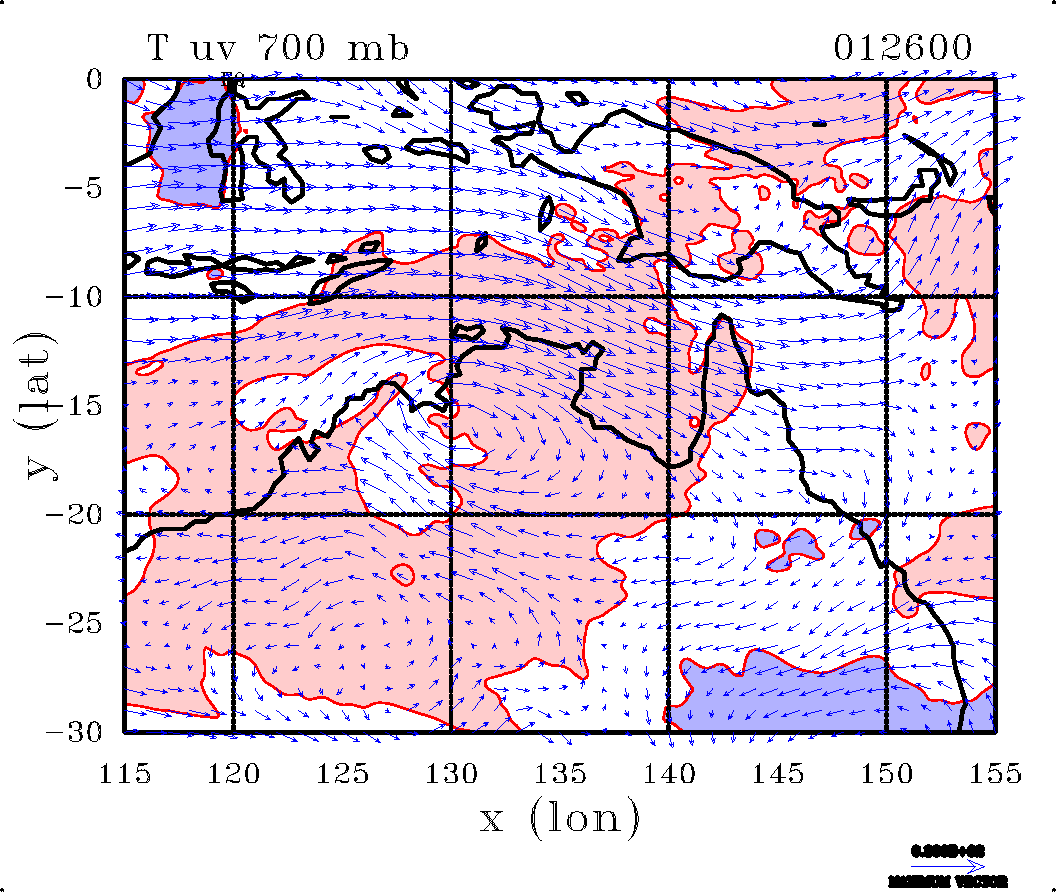
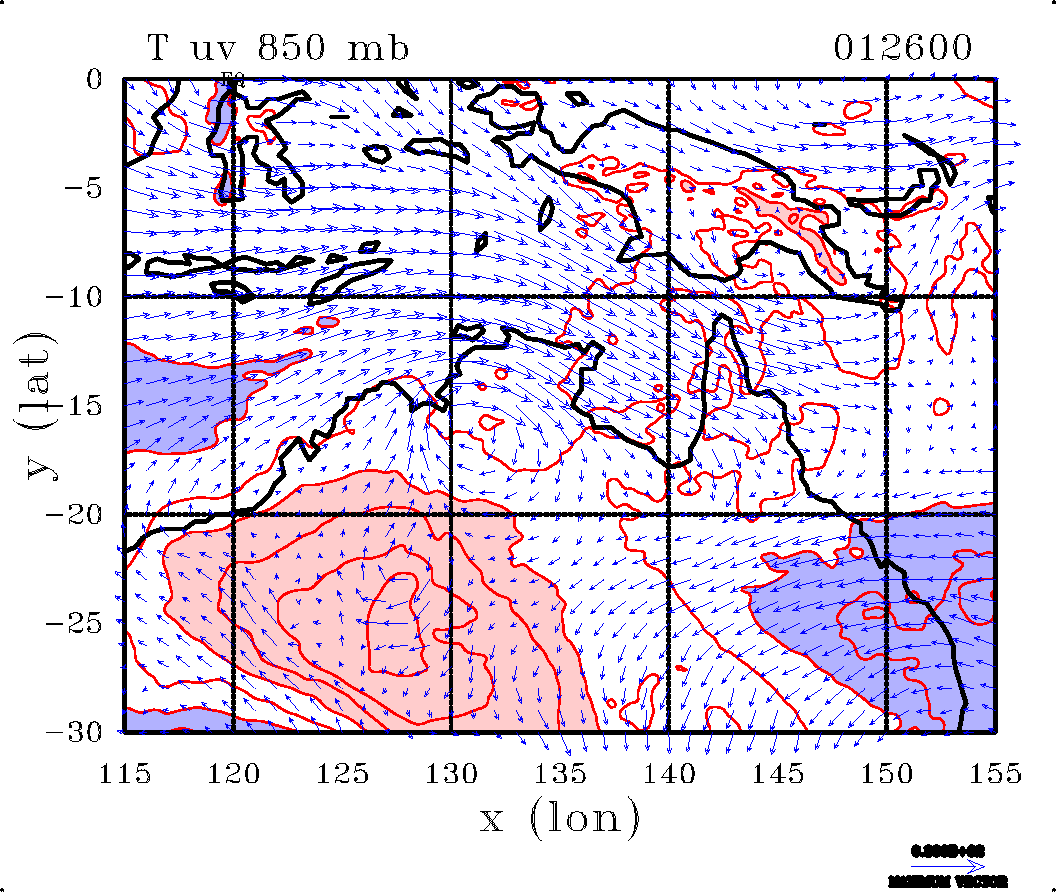
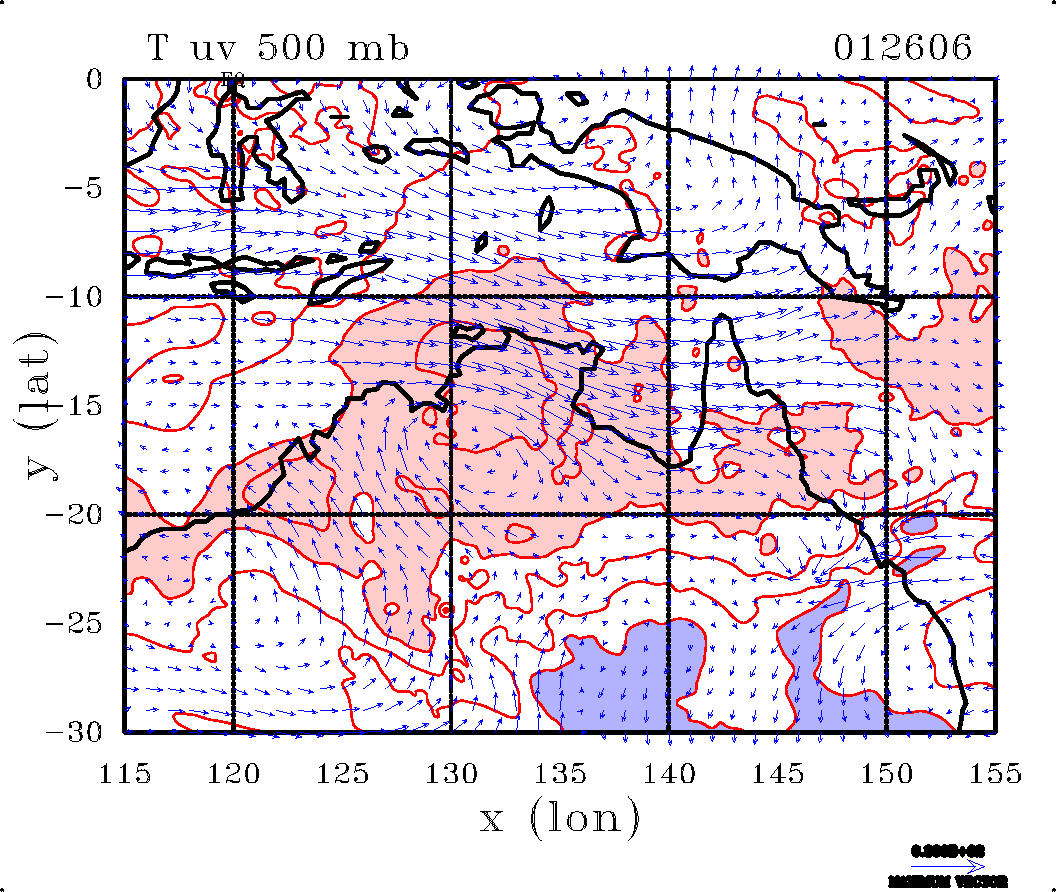
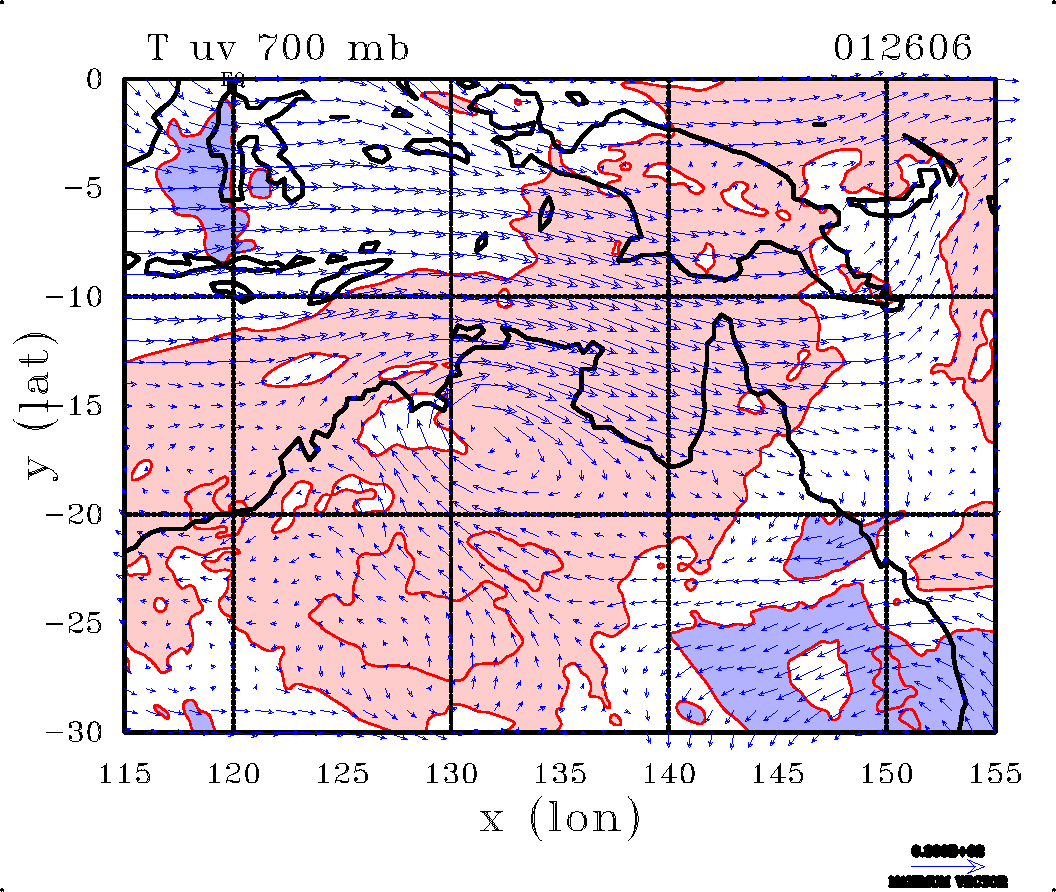
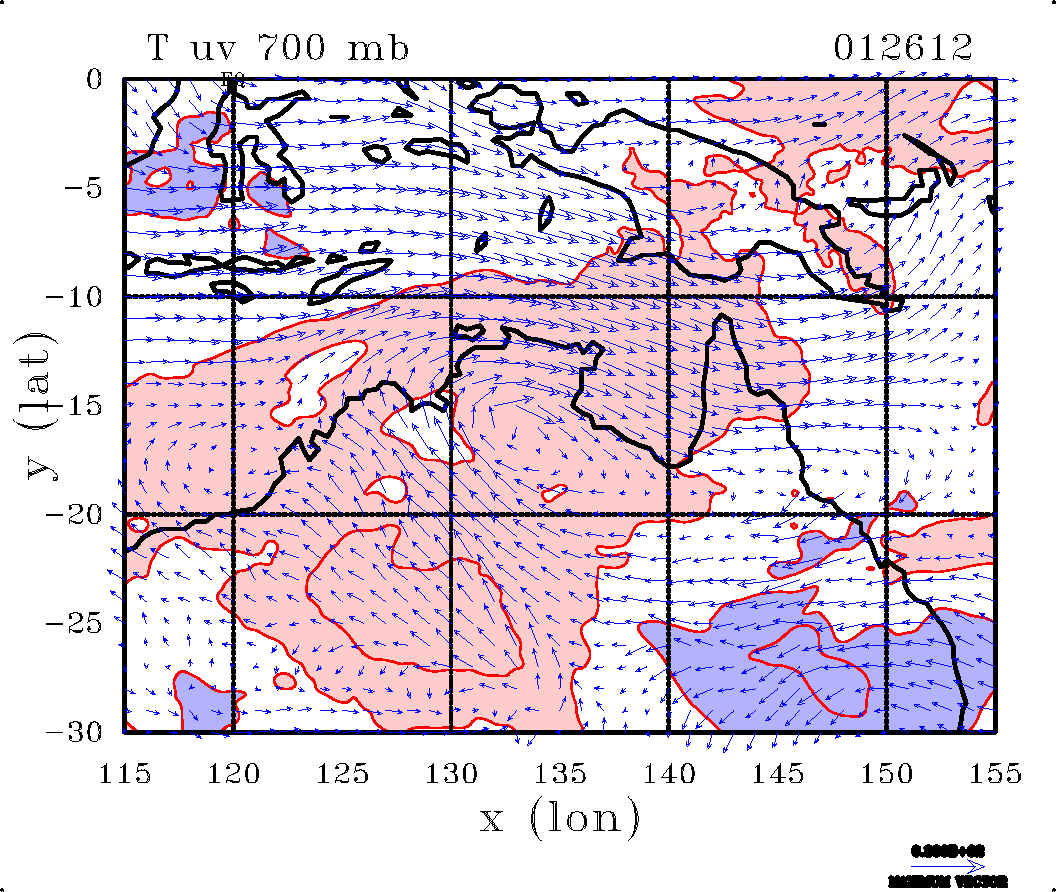
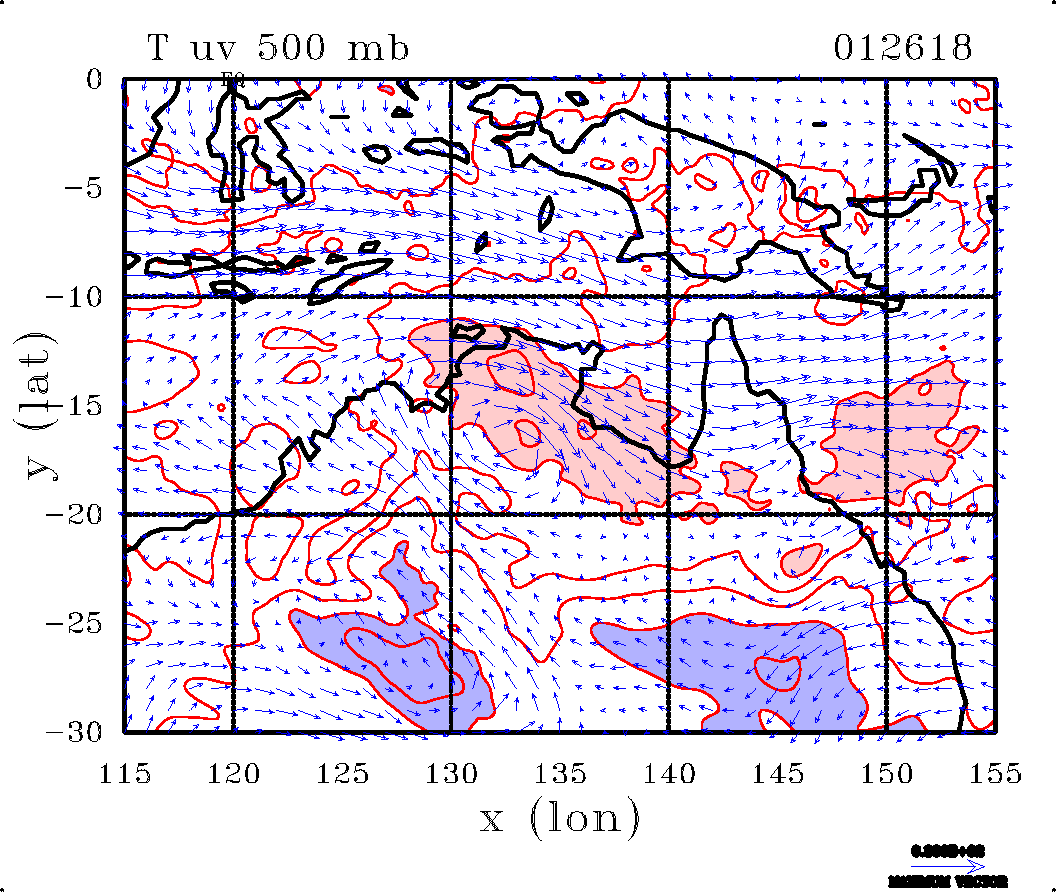
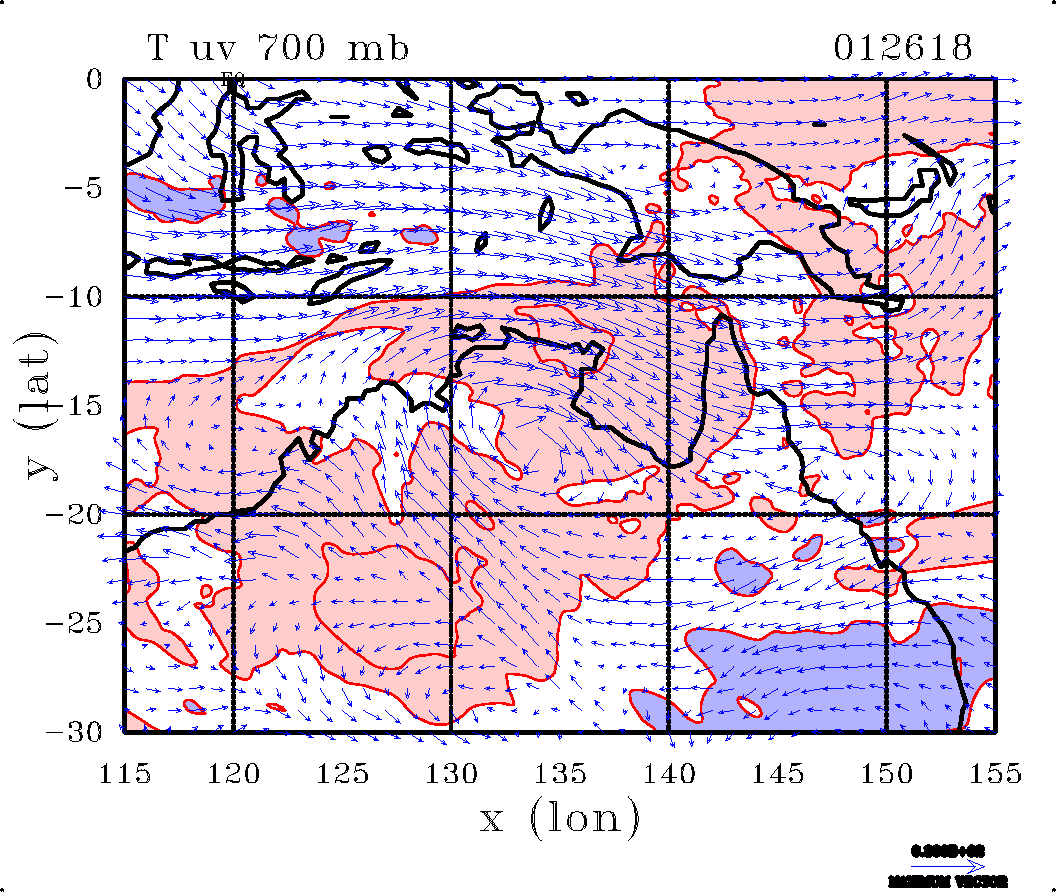
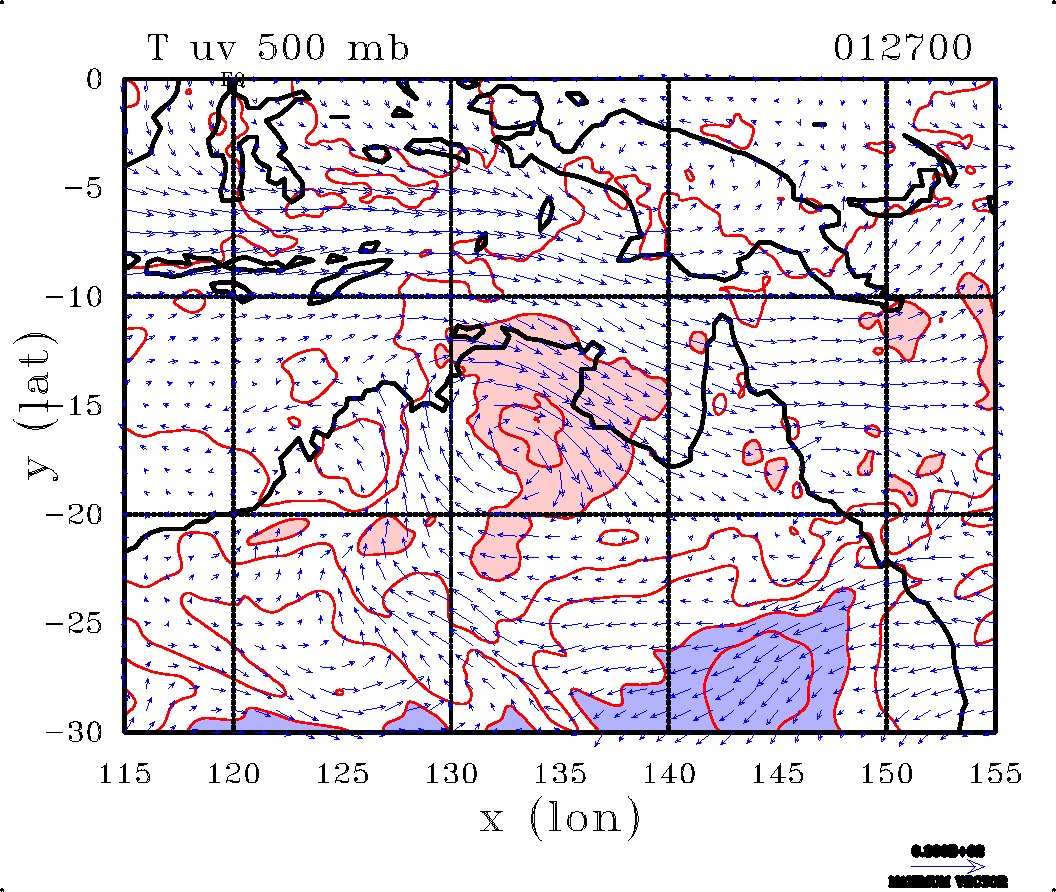
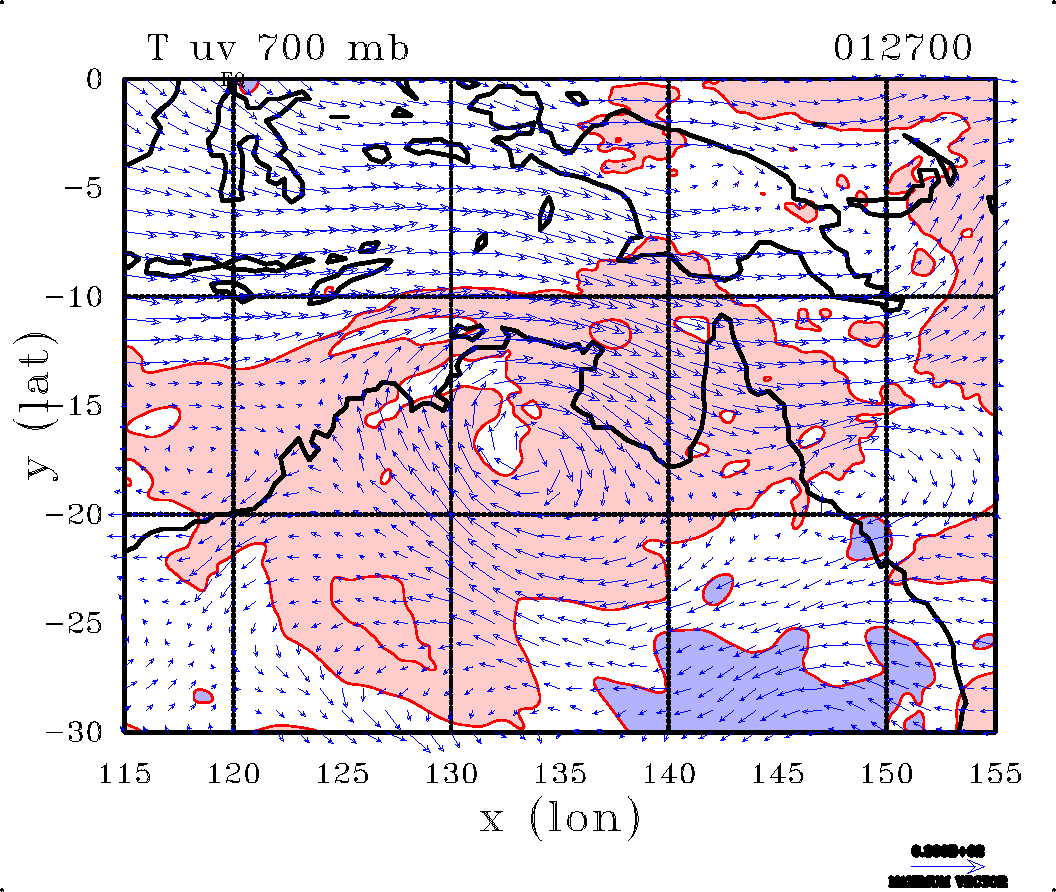
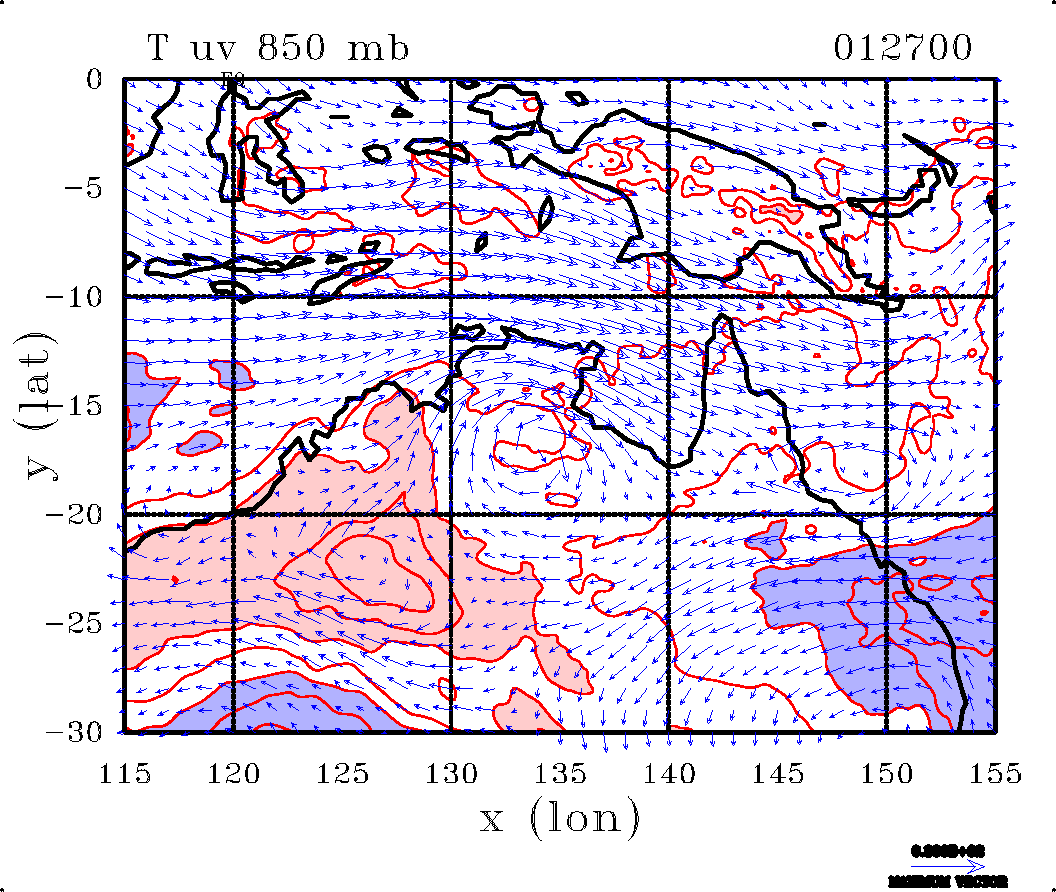
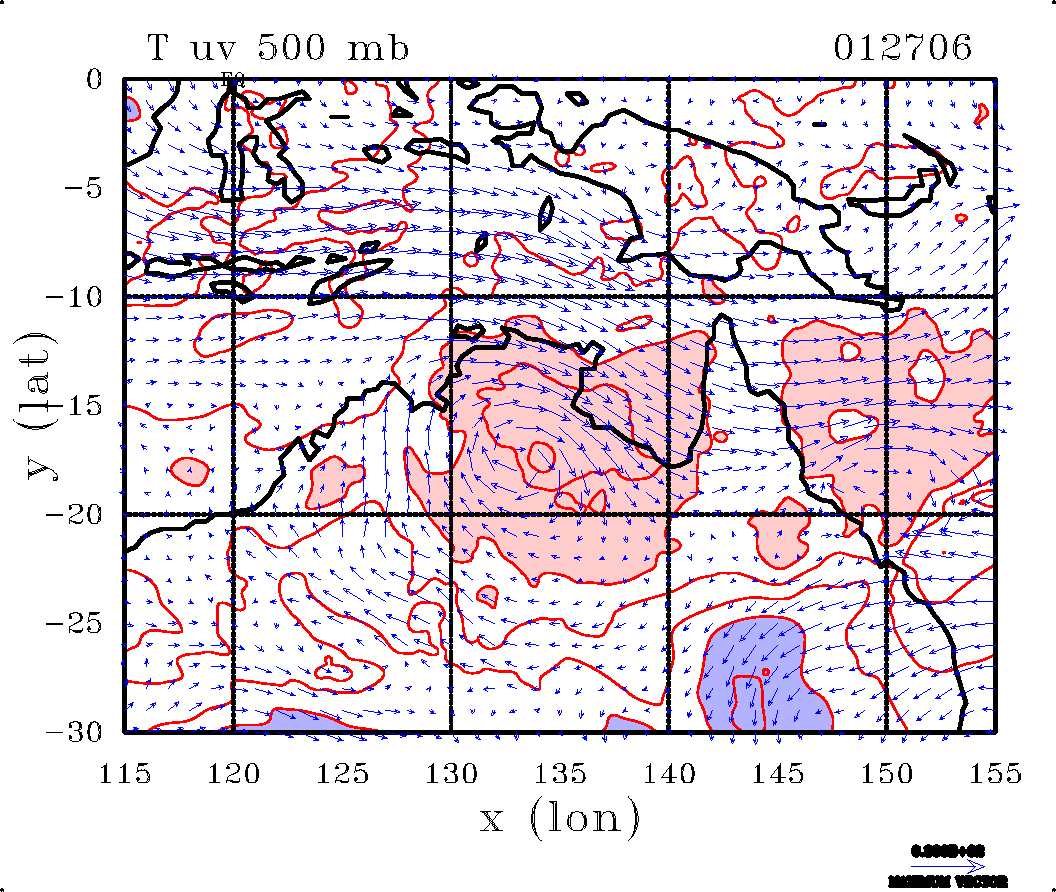
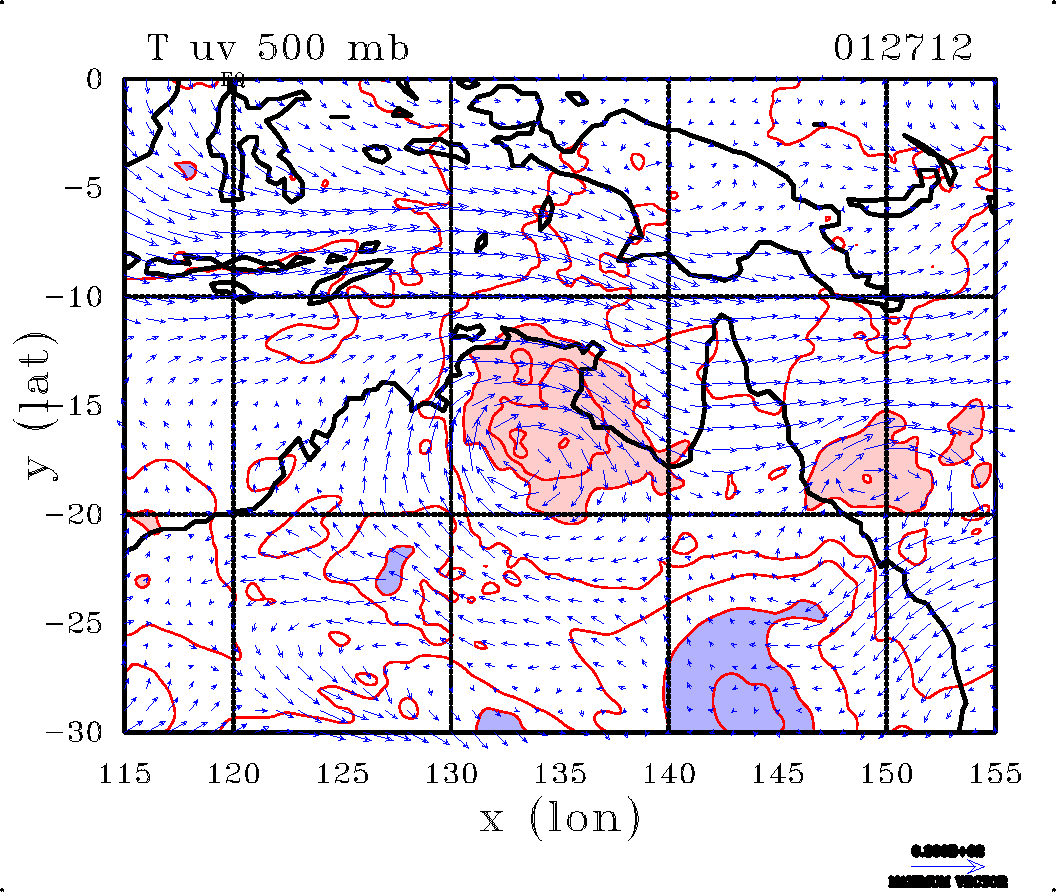
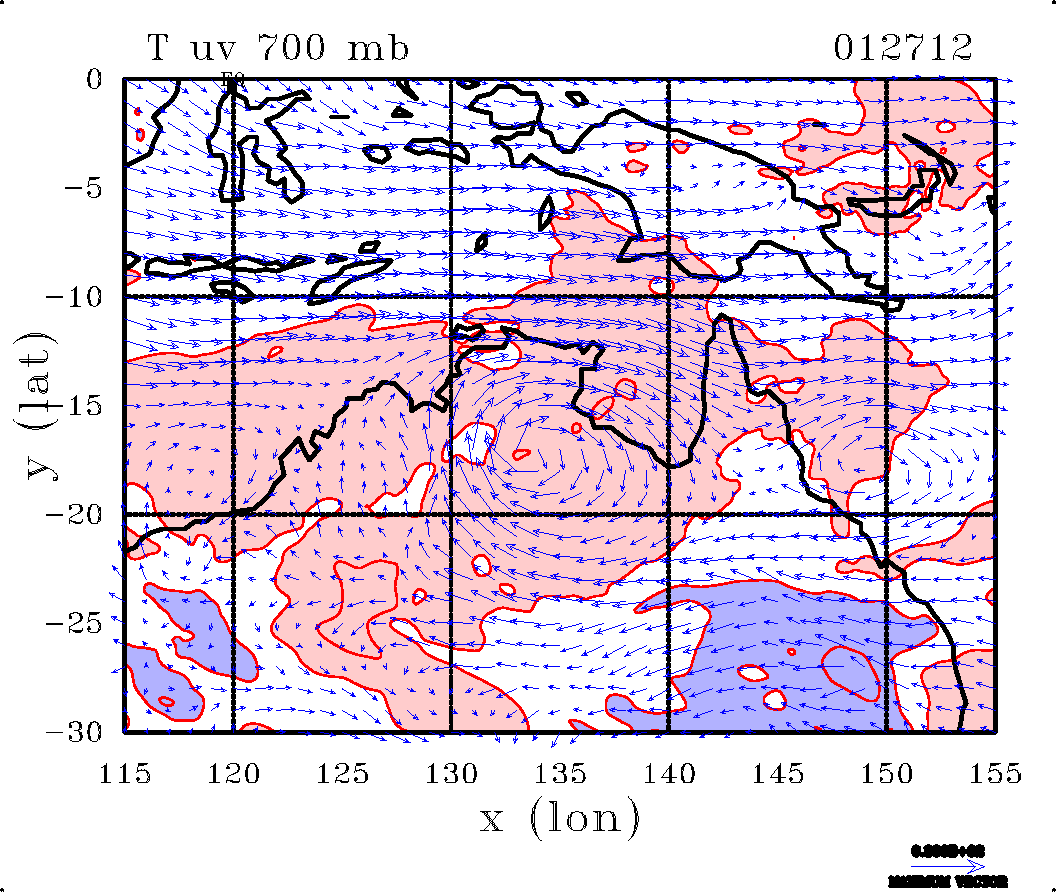
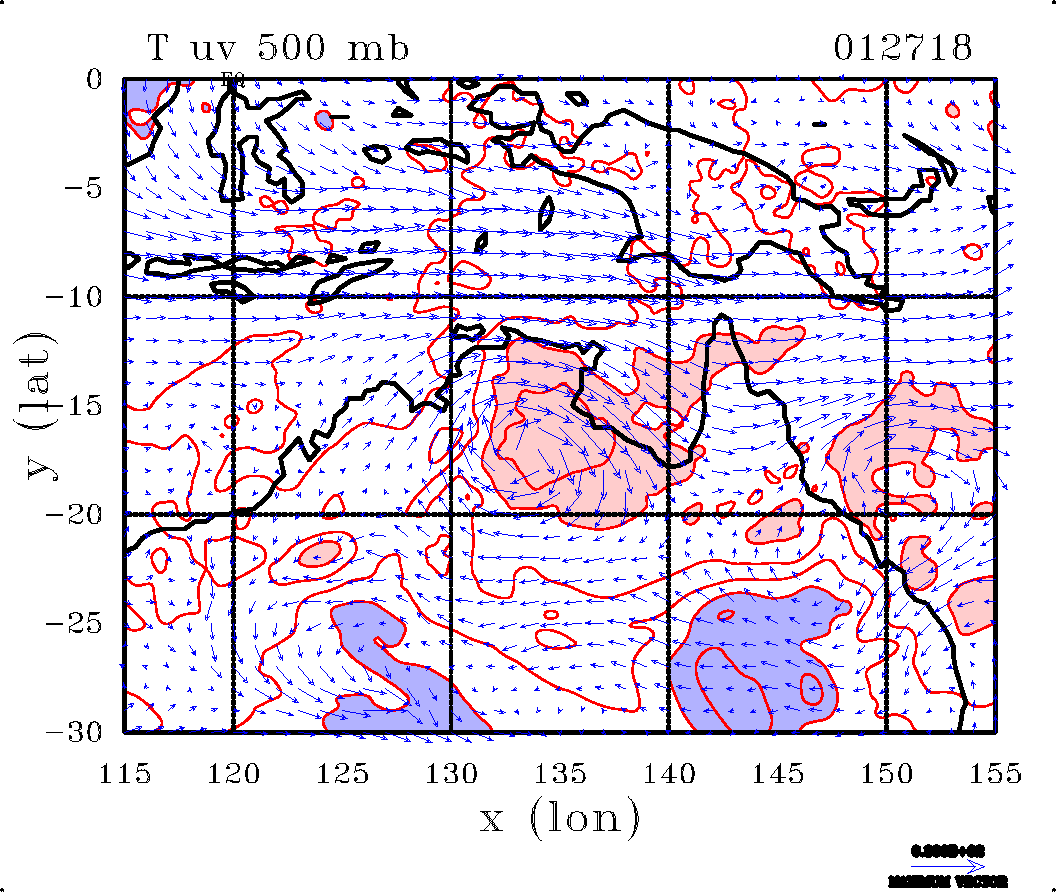
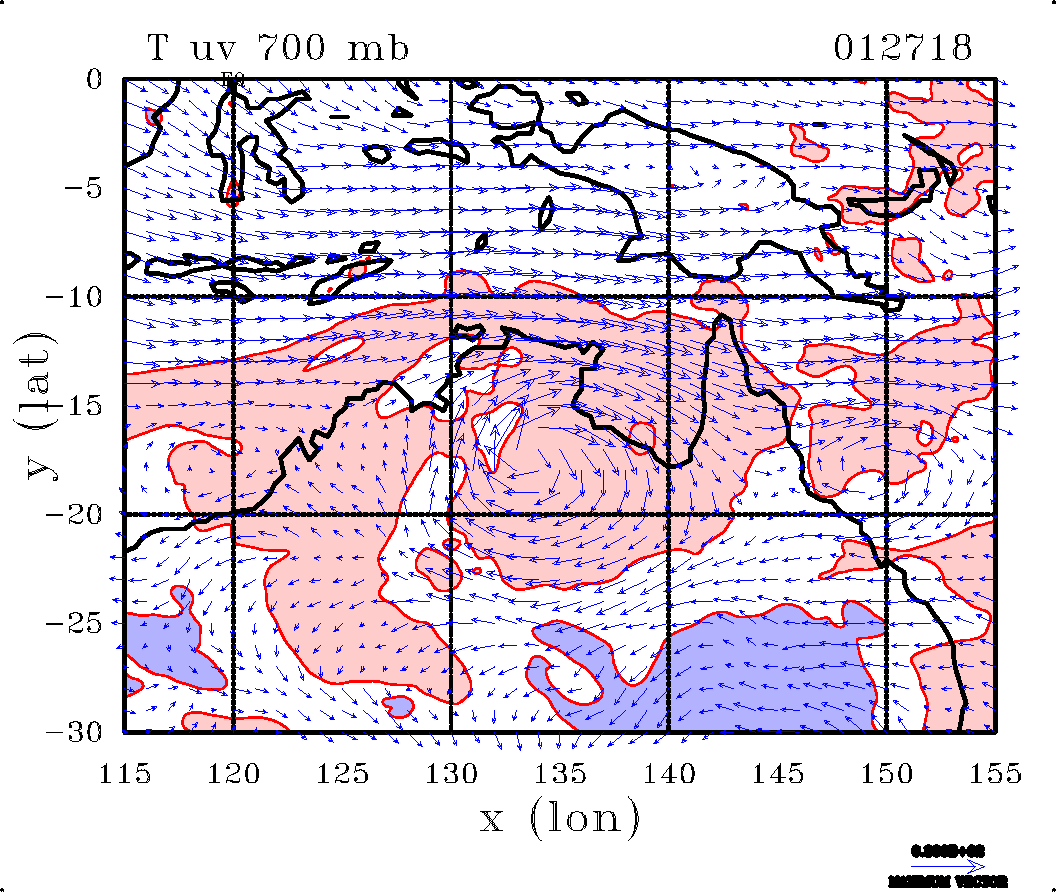
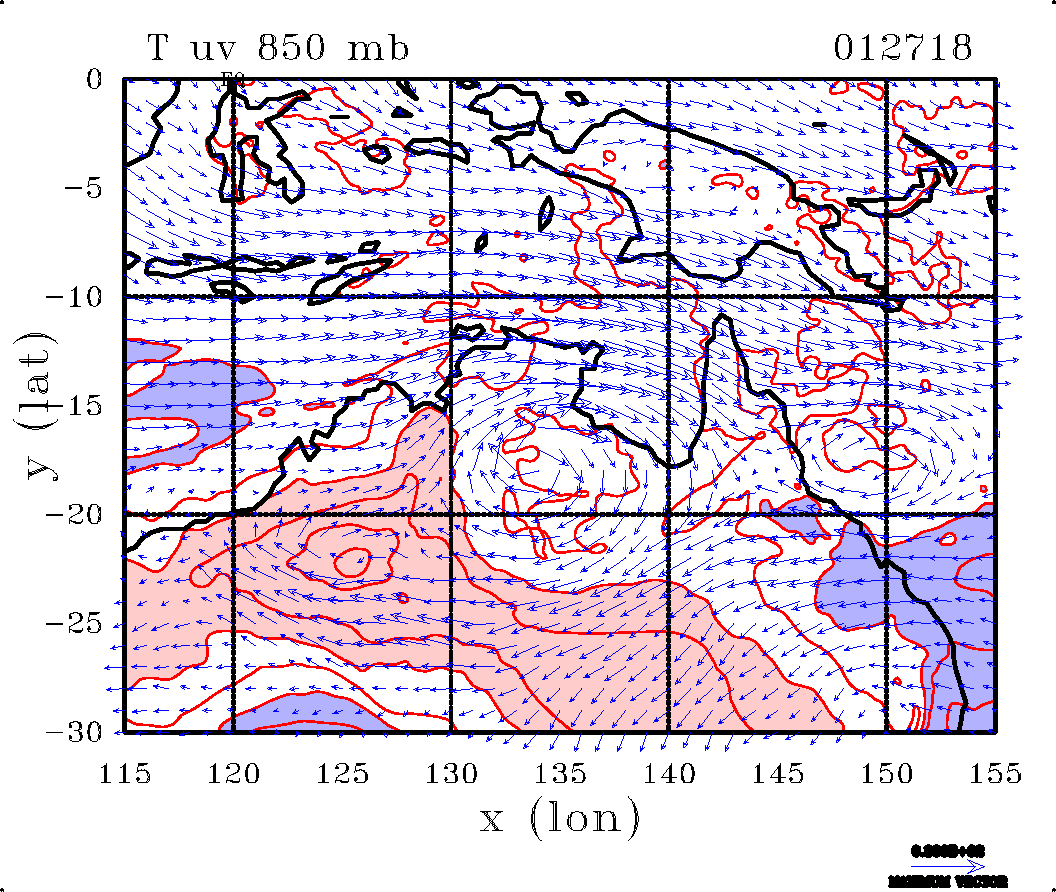
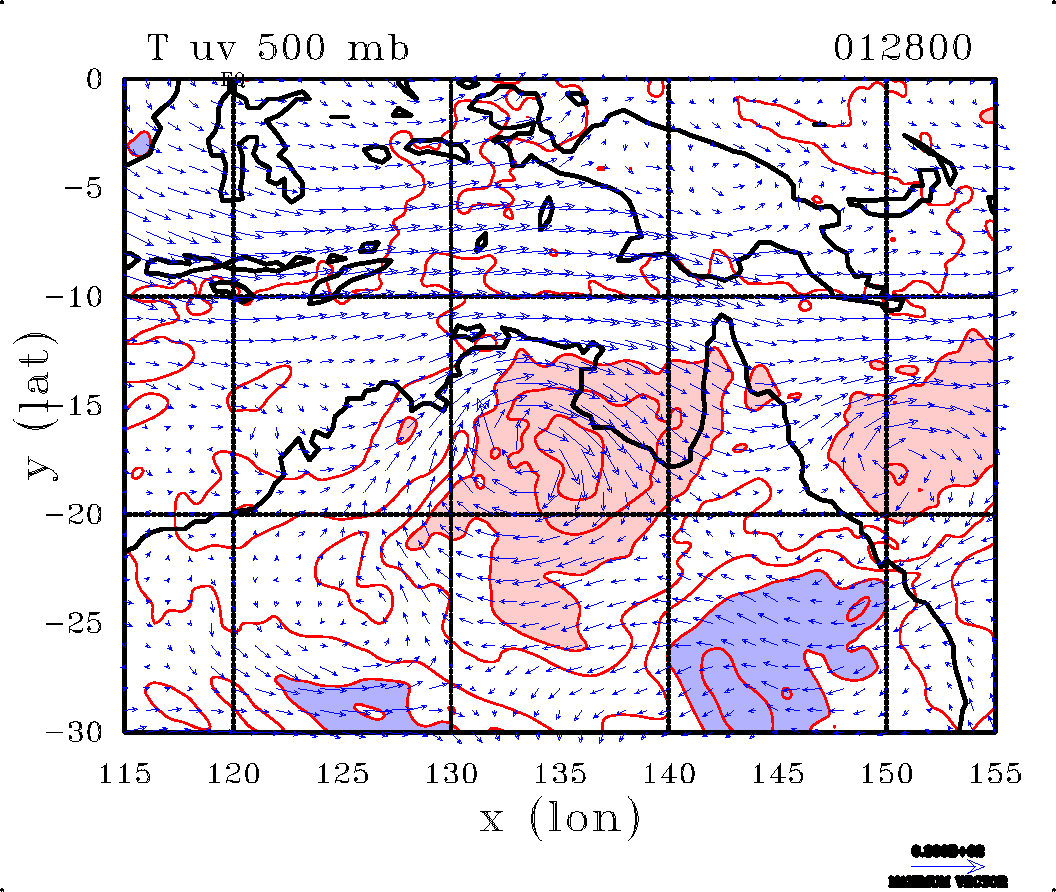
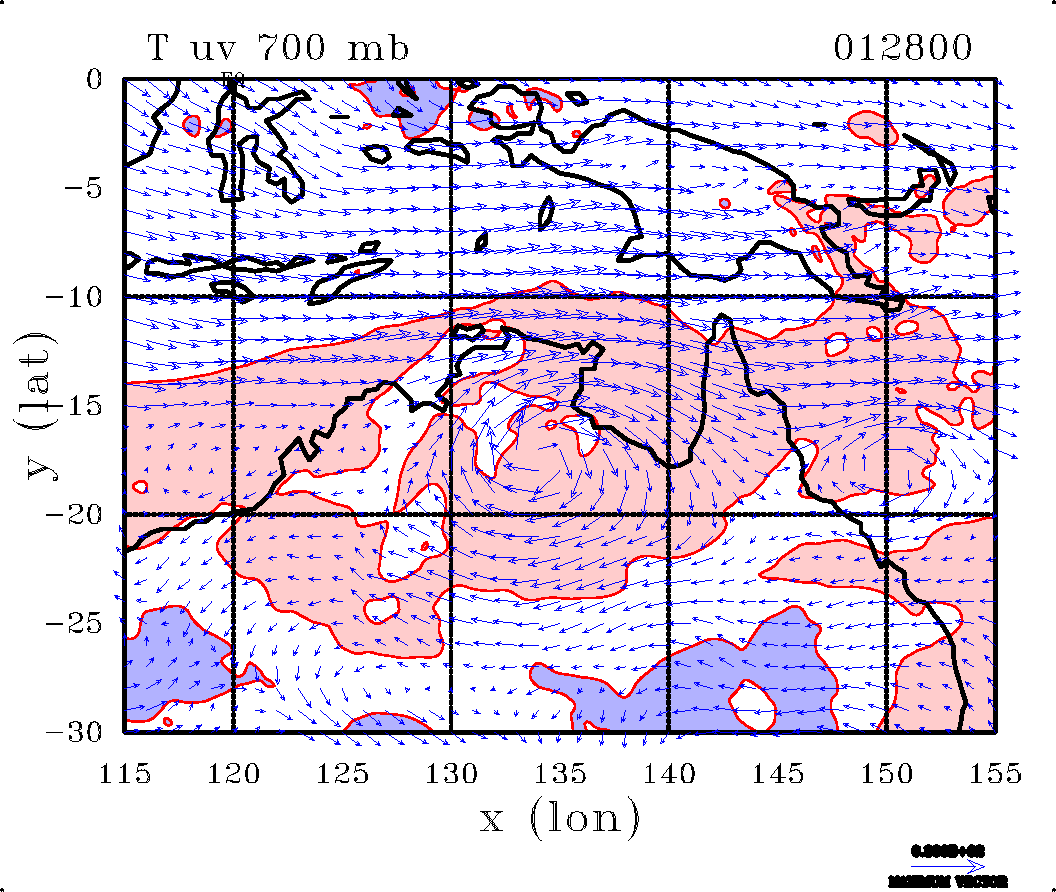
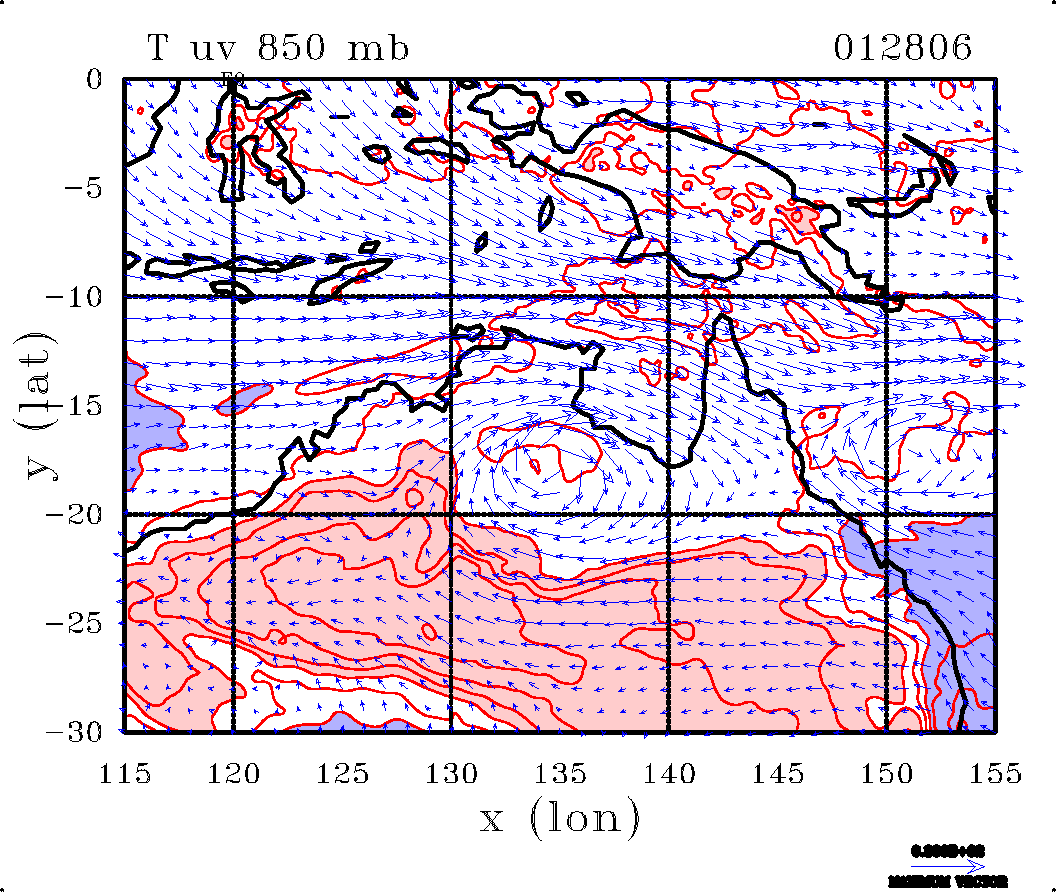
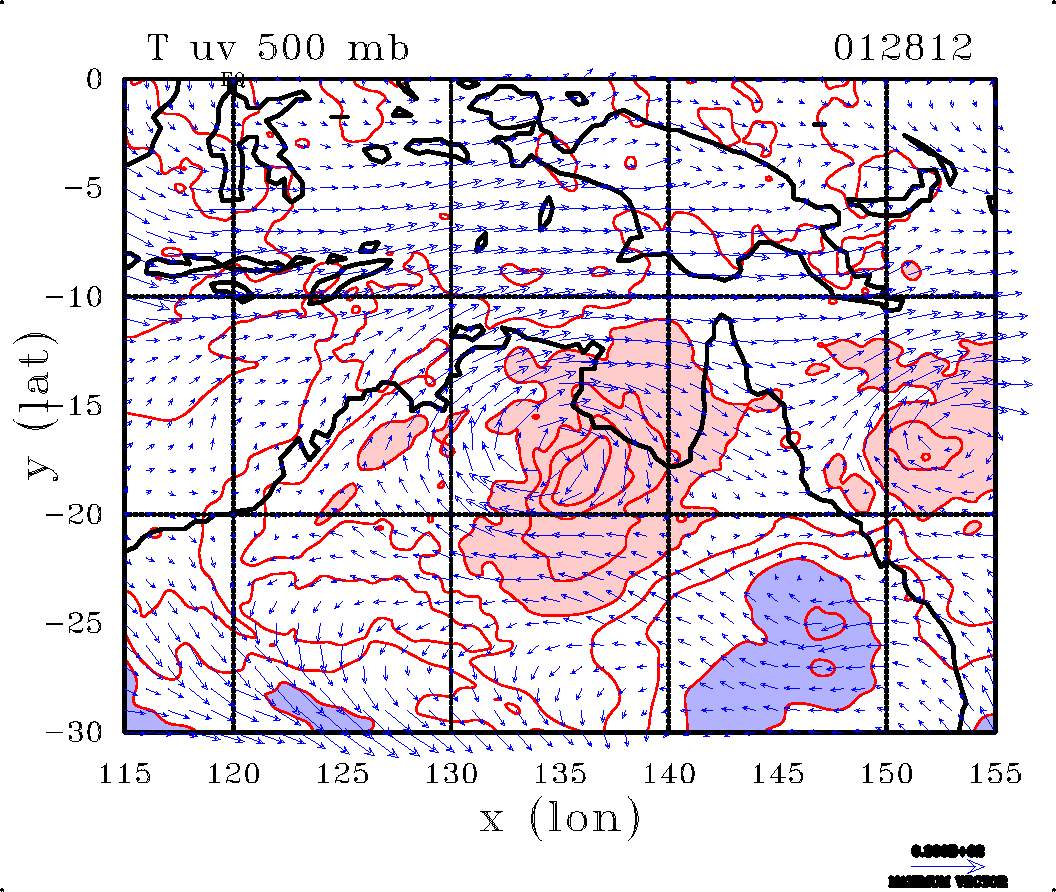
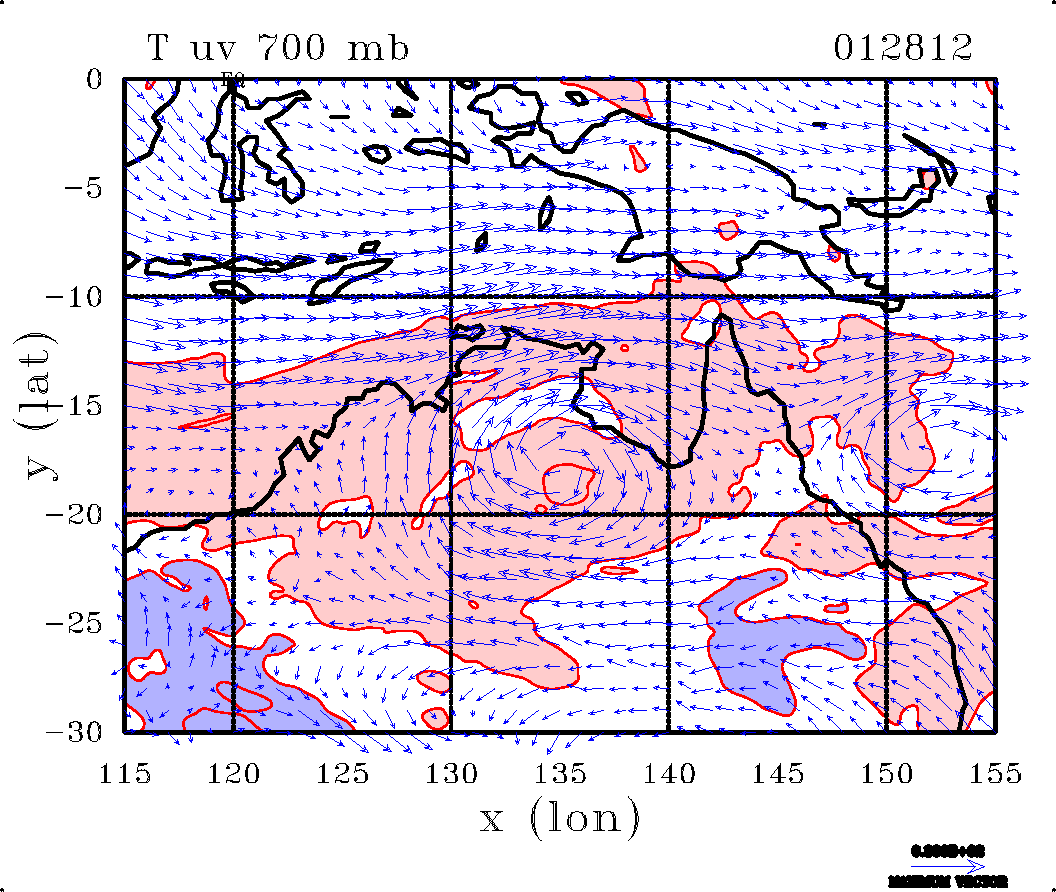
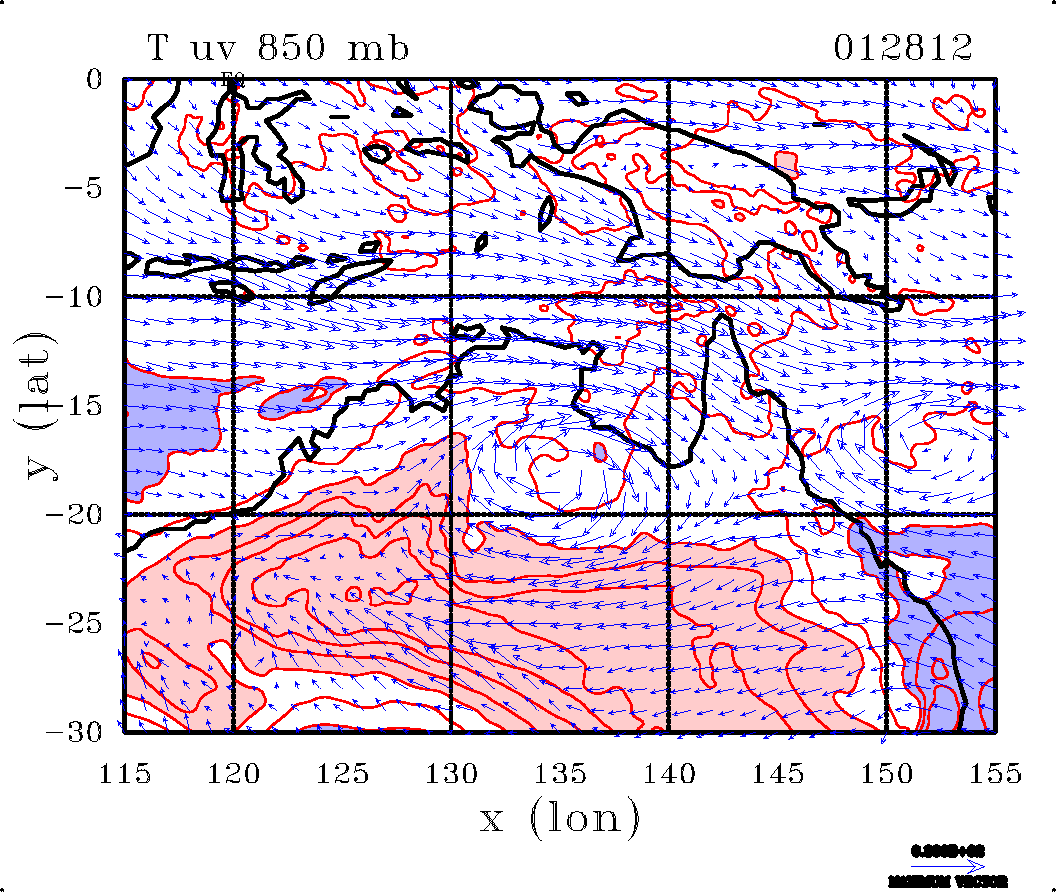
Contours of temperature at selected pressure levels
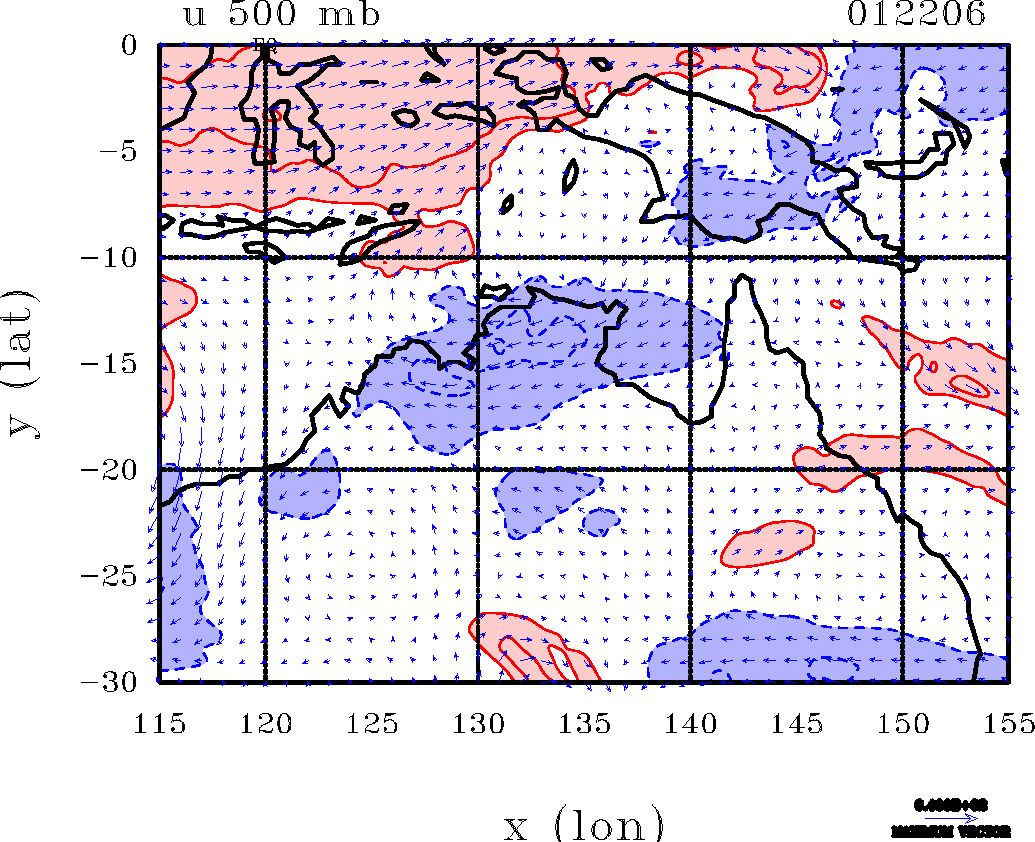
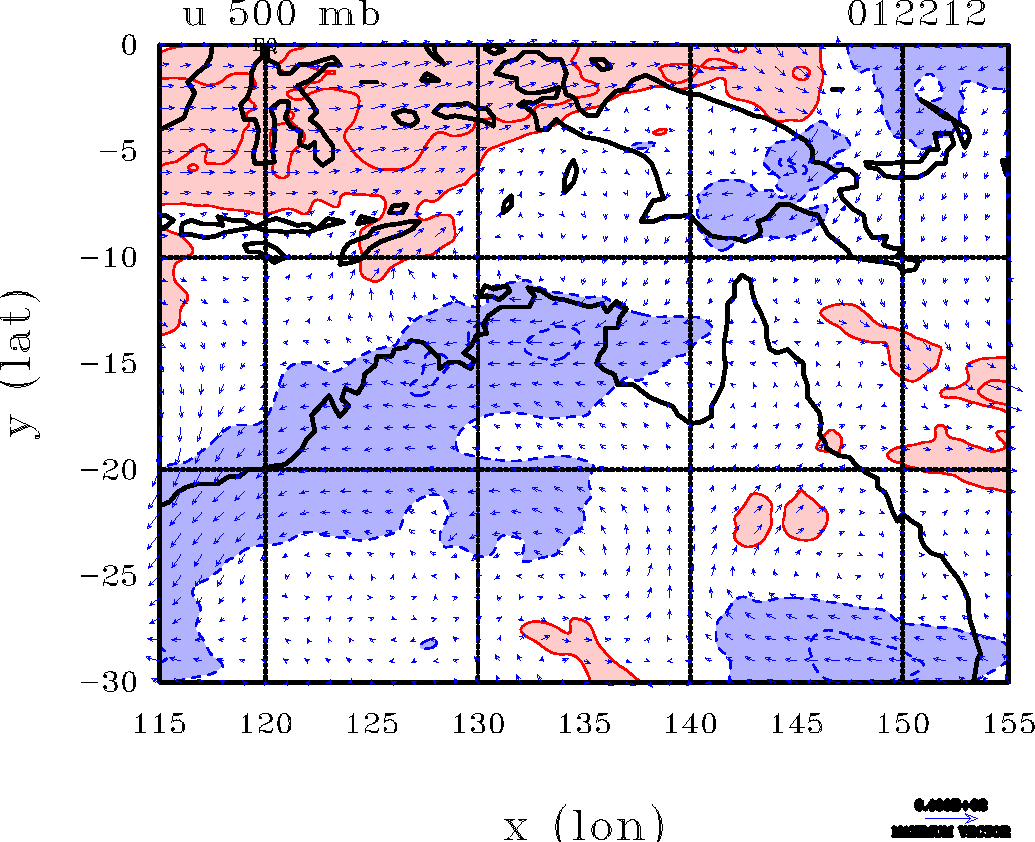
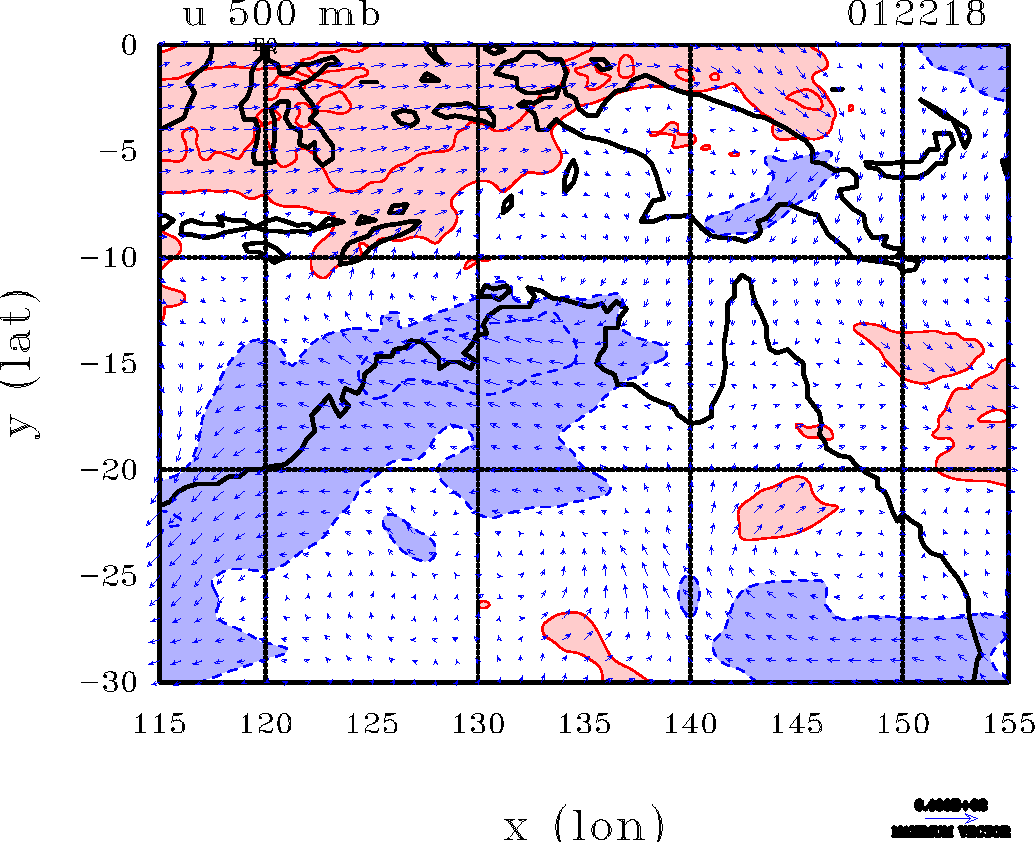
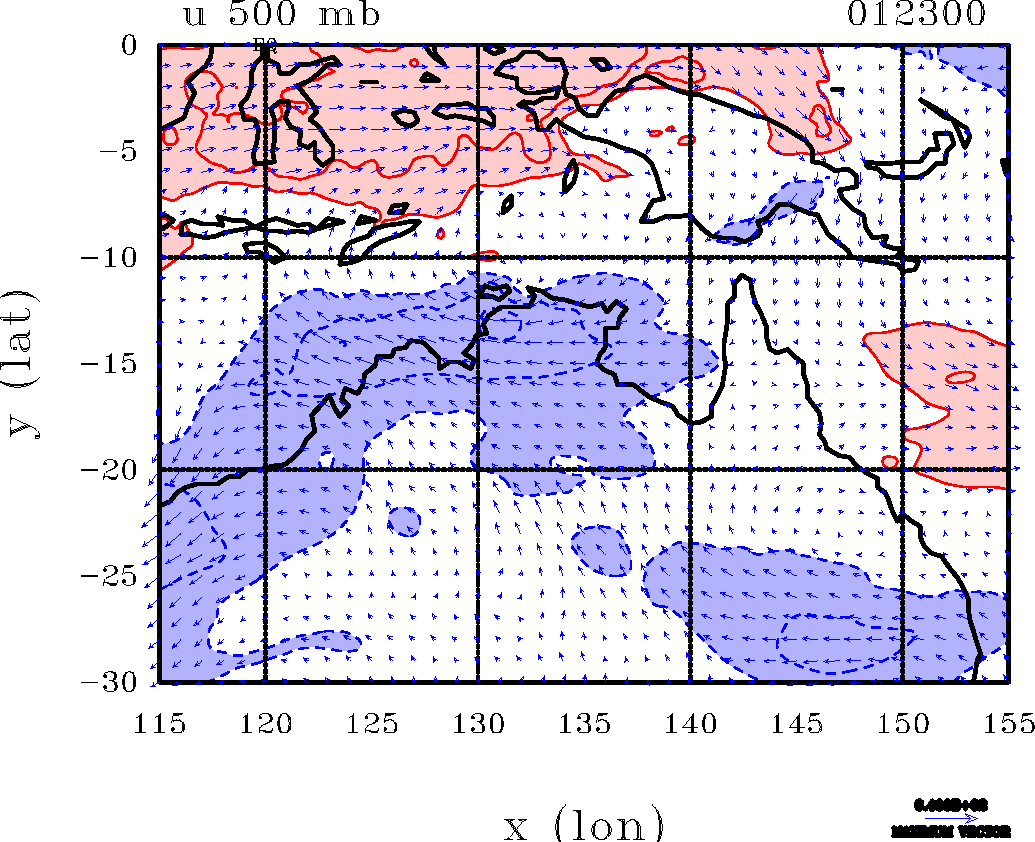
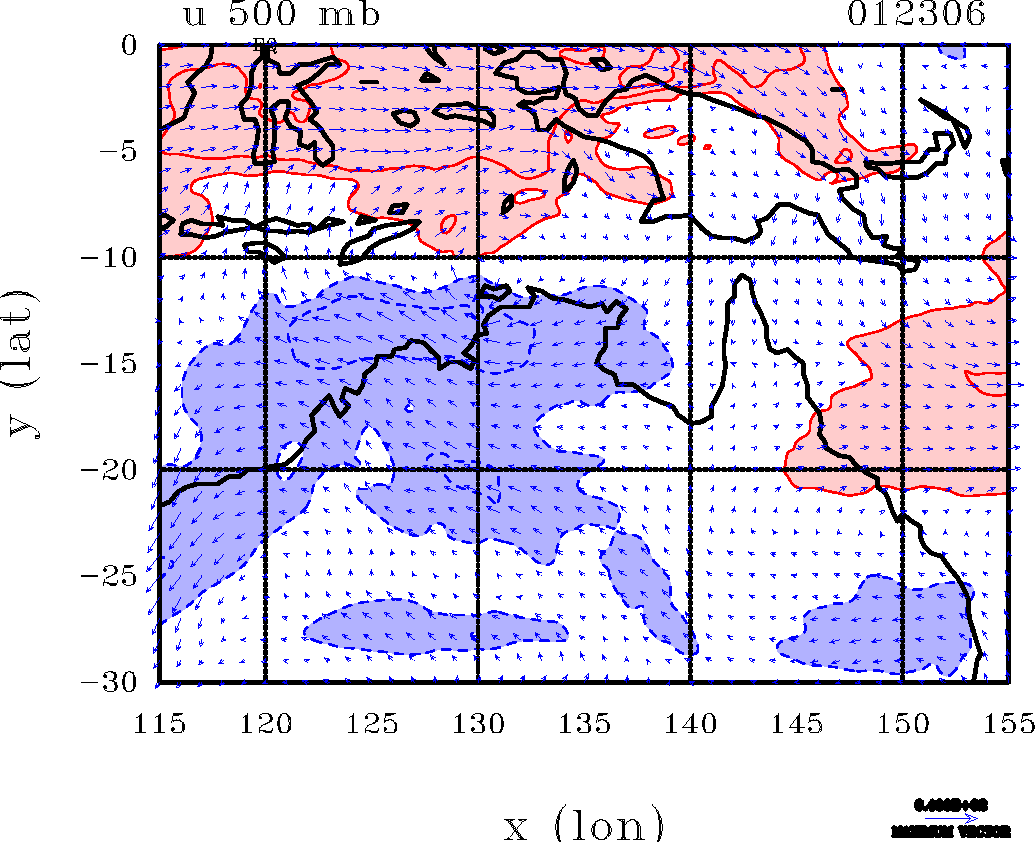
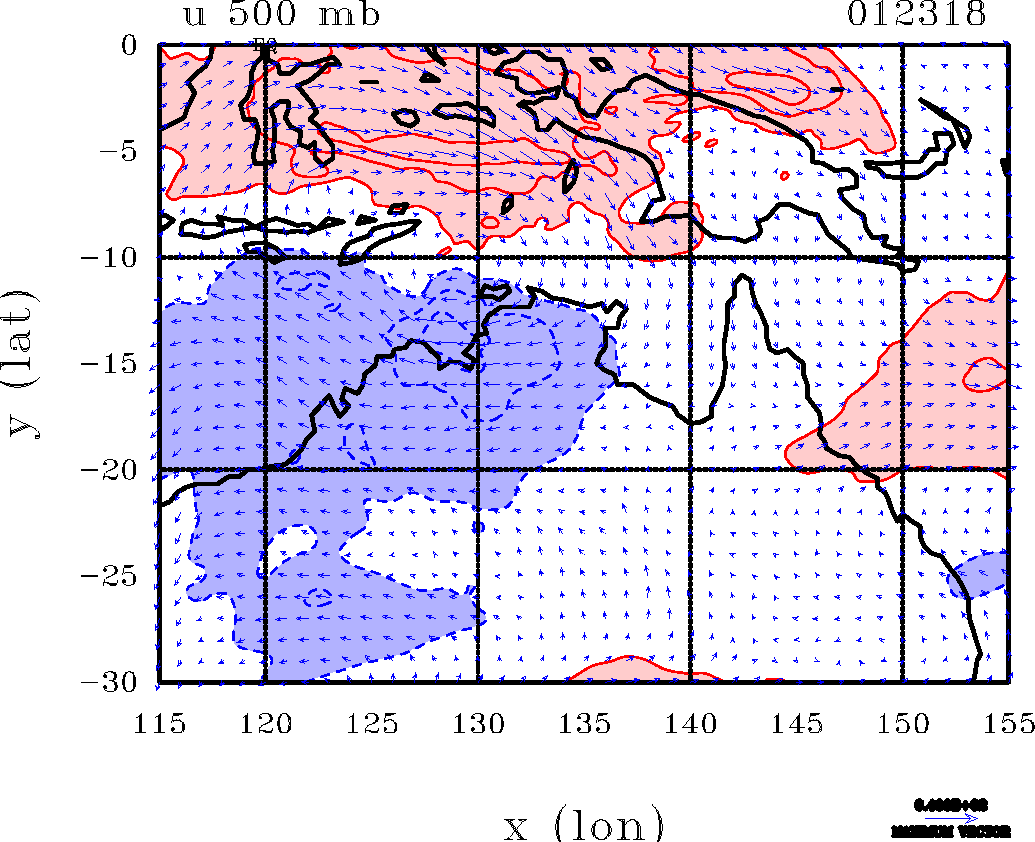
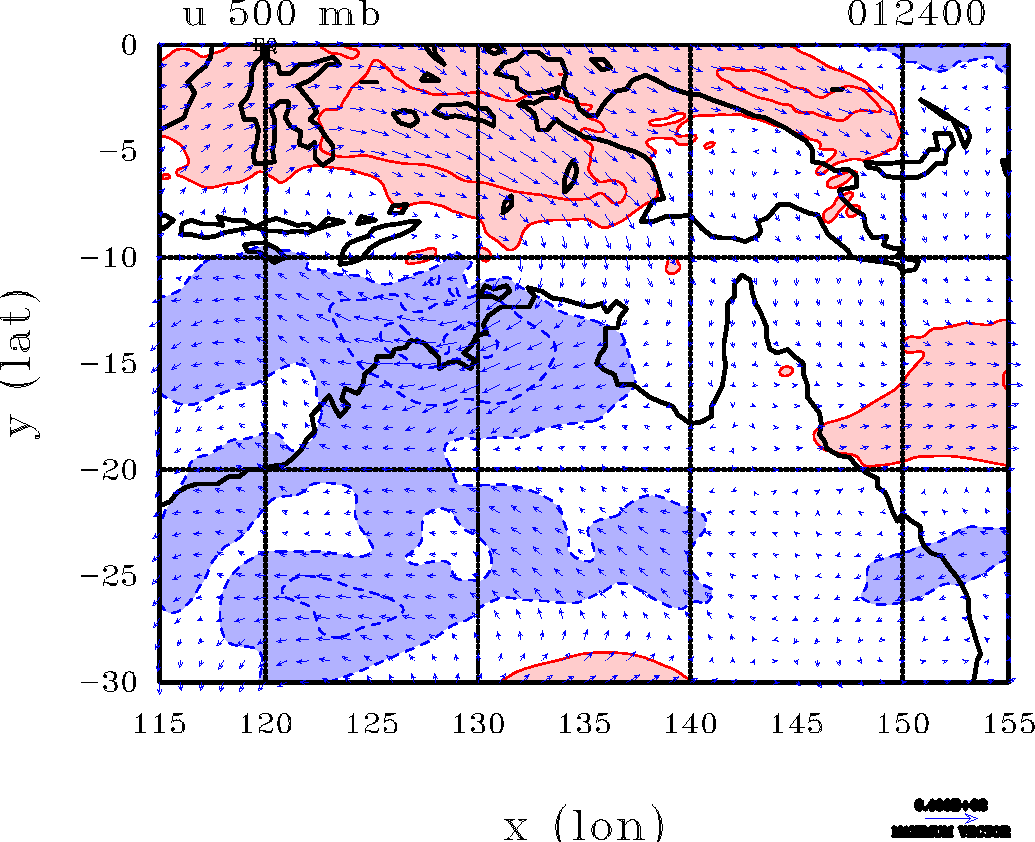
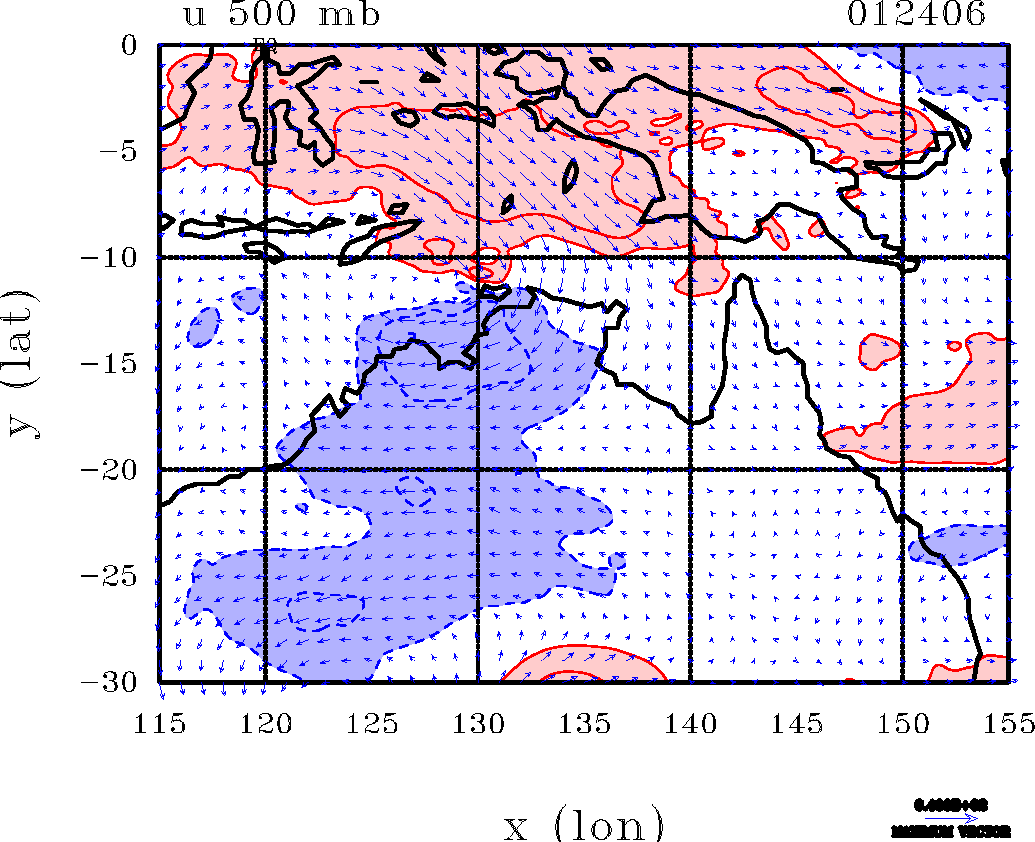
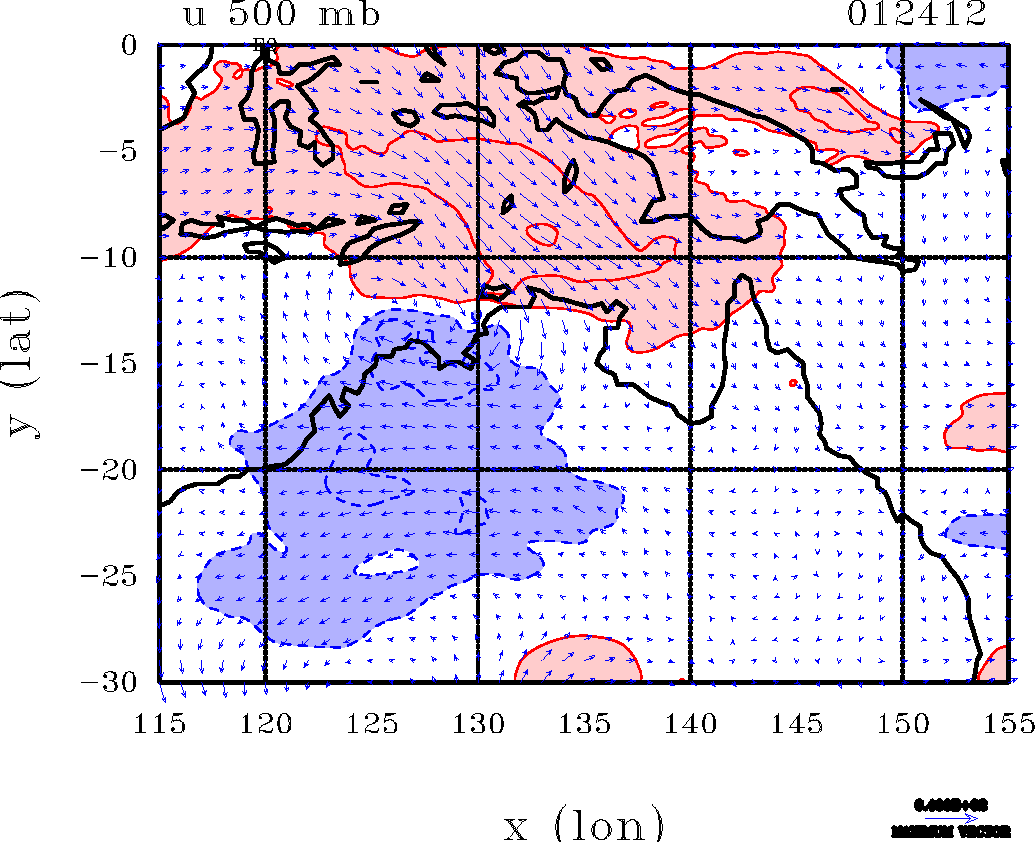
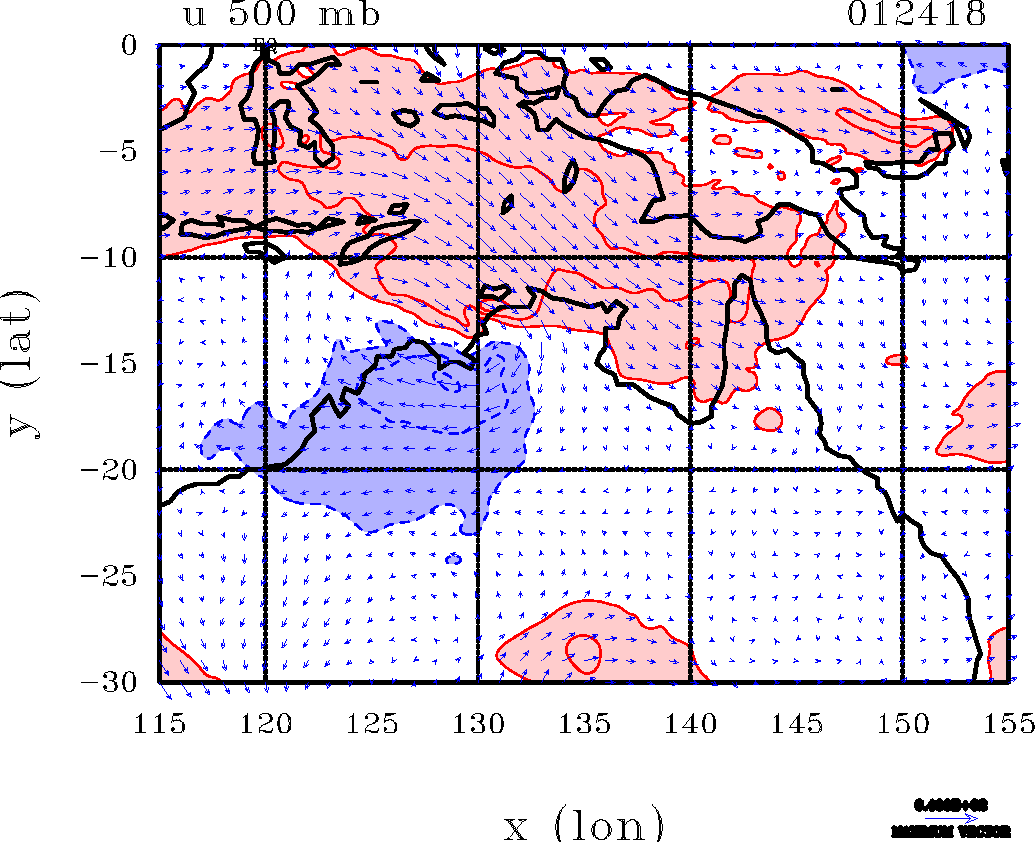
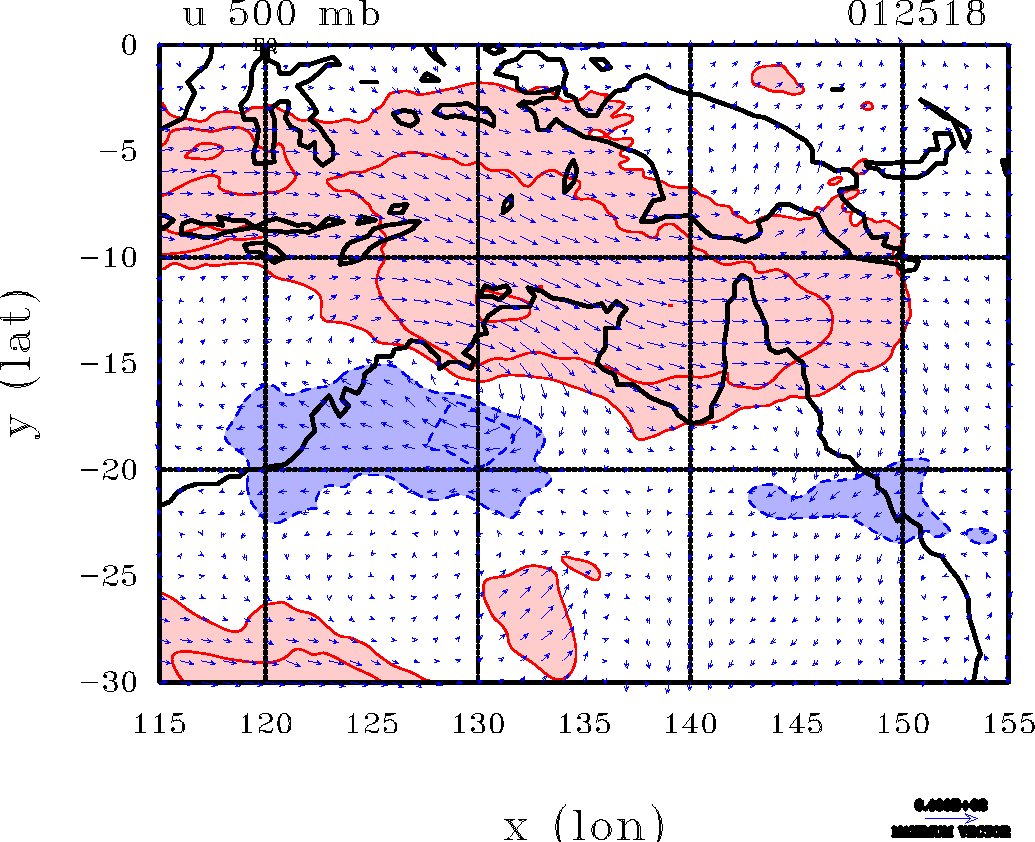
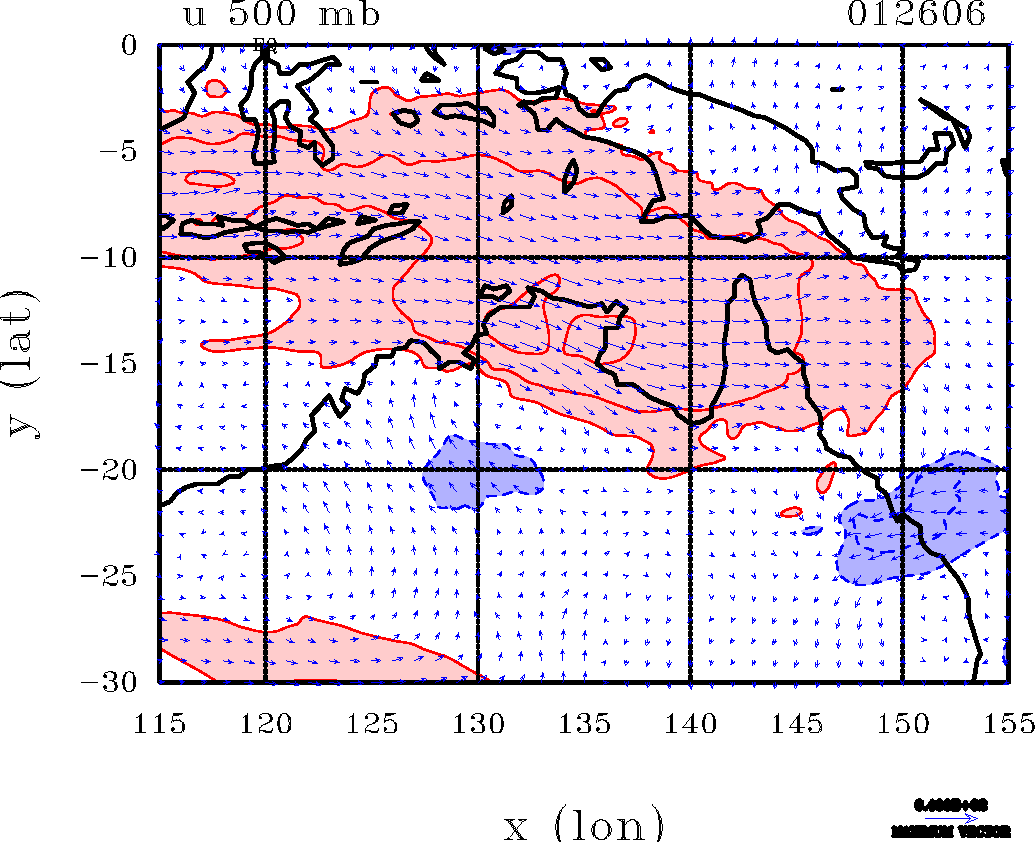
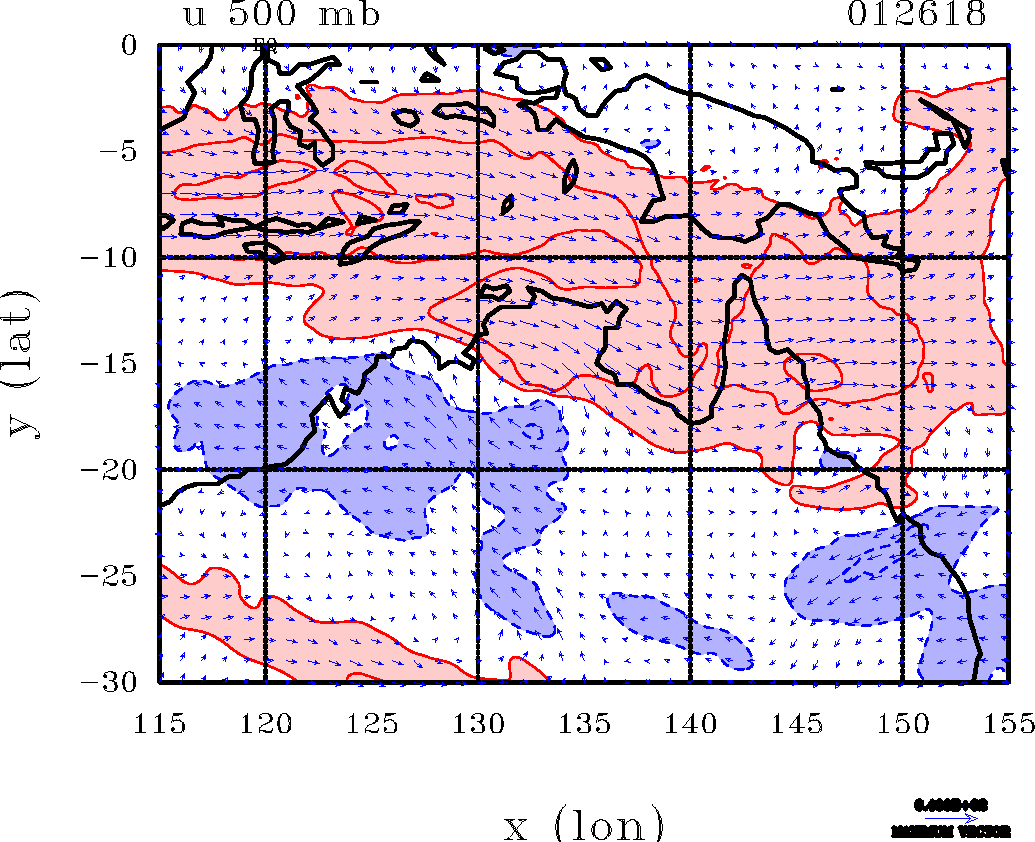
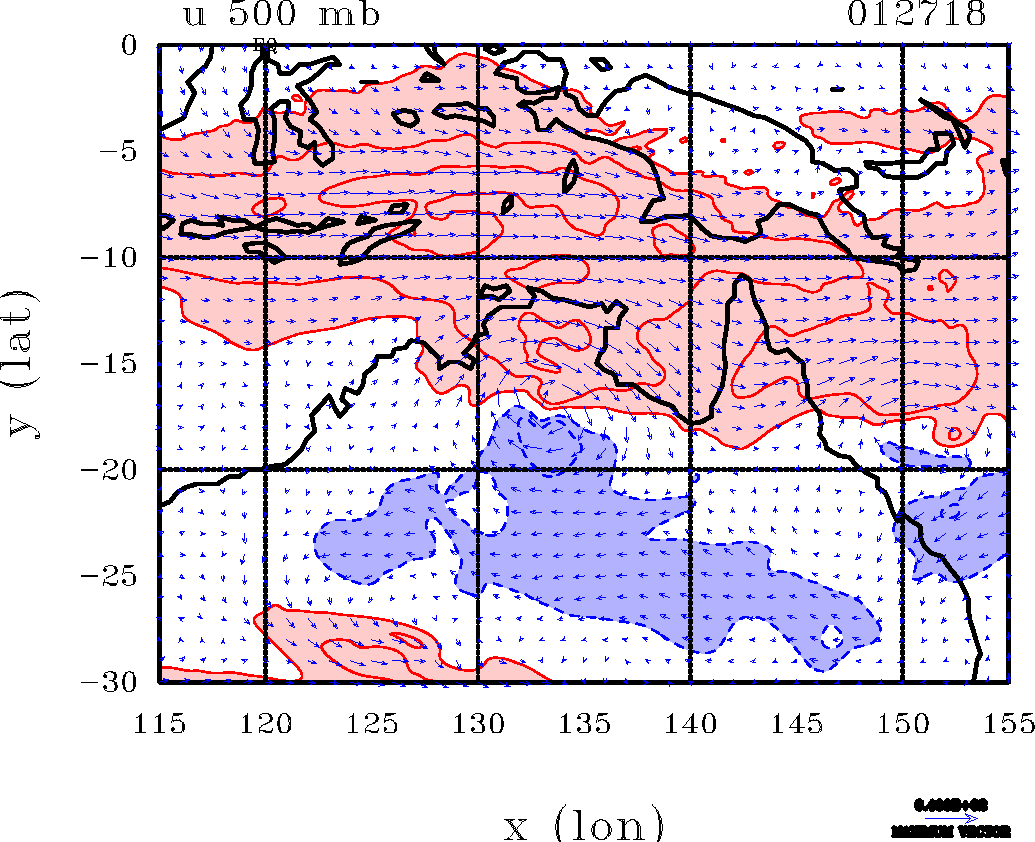
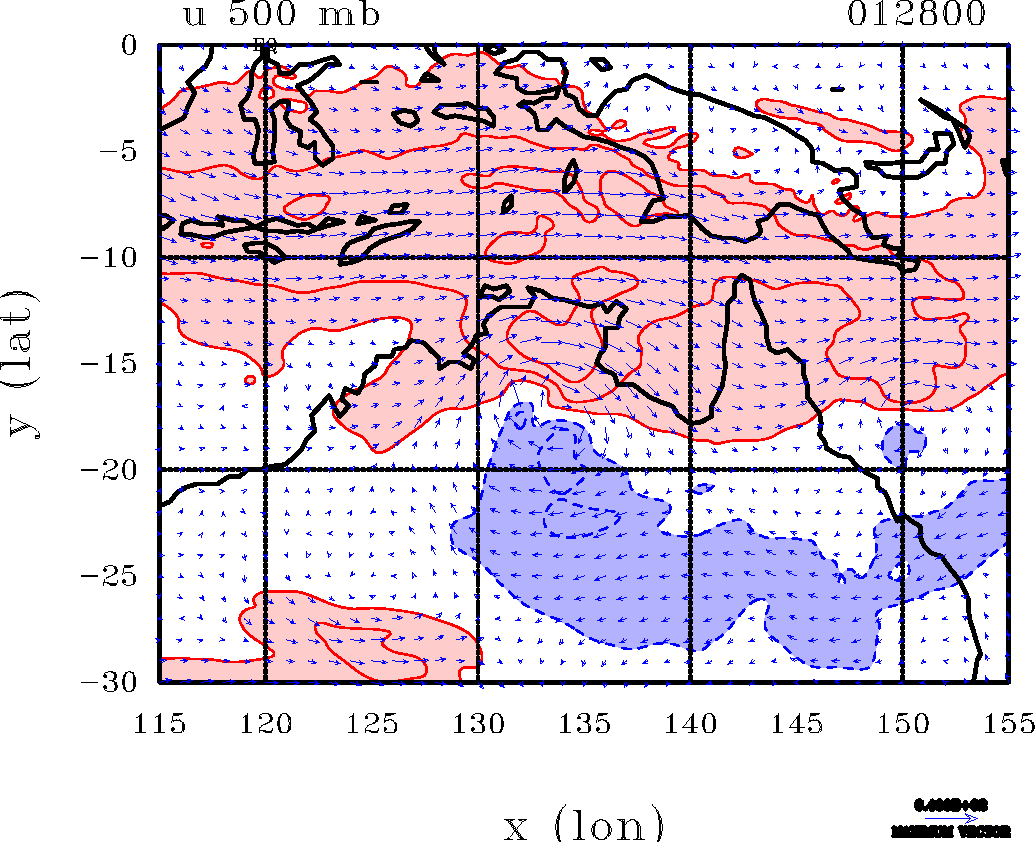
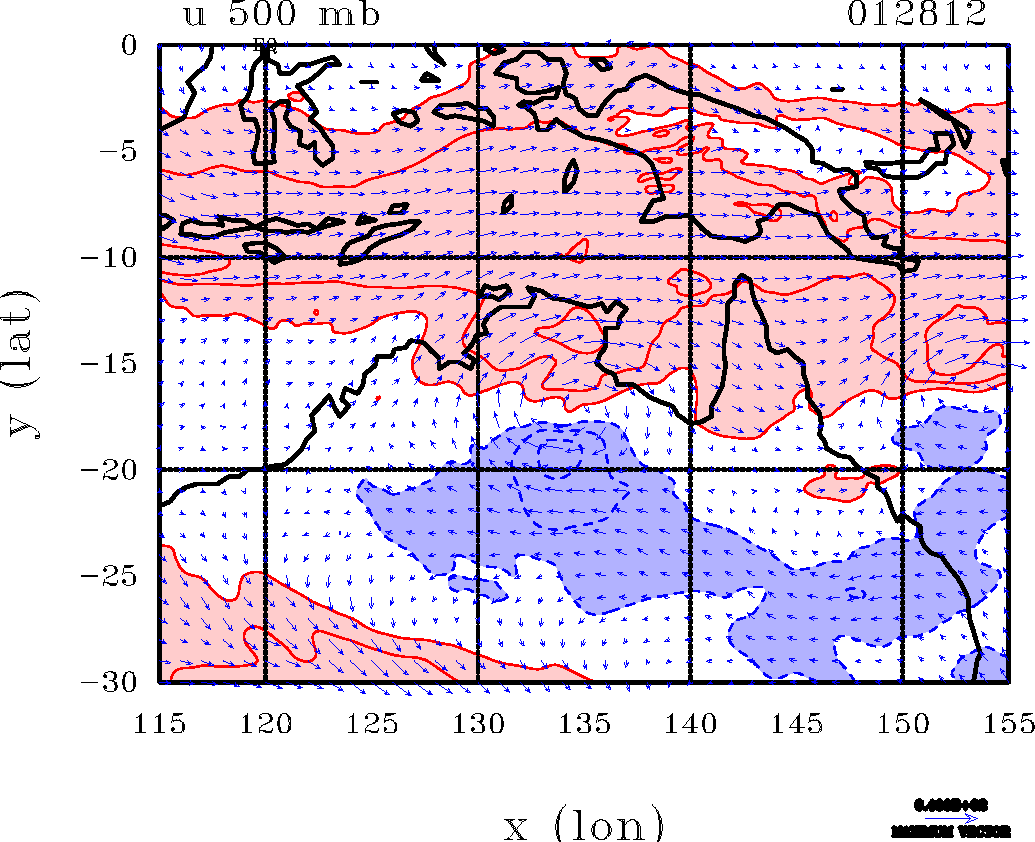
To FIX. he following plots show wind vectors and contours of the zonal velocity component during the genesis and mature stage of the disturbance. Contour levels for the zonal wind are 5 m s-1 up to 500 mb and 10 m s-1 at 200 mb. Regions of westerly zonal wind speed > 5 m s-1 are shaded pink; regions of easterly zonal wind speed < -5 m s-1 shaded light blue. Negative contours blue/dashed.
 |  |
 |
|
 |  |
 |  |
 |  |
 |  |
 |  |
 |  |
 |  |
 |  |
 |  |
 |  |
 |  |
 |  |
 |  |
 |  |
 |  |
 |  |
 |  |
 |  |
 |  |
 |  |
 |  |
 |  |
 |  |
 |  |
 |  |
 |  |
 |  |
 |  |
 |  |
 |  |
 |  |
 |  |
 |  |
 |  |
 |  |
 |  |
 |  |
 |  |
 |  |
 |  |
 |  |
 |  |
 |  |
 |  |
 |  |
 |  |
 |  |
 |  |
 |  |
 |  |
 |  |
 |  |
Copyright © Roger Smith