Northern Territory Tropical Depression Jan 2006
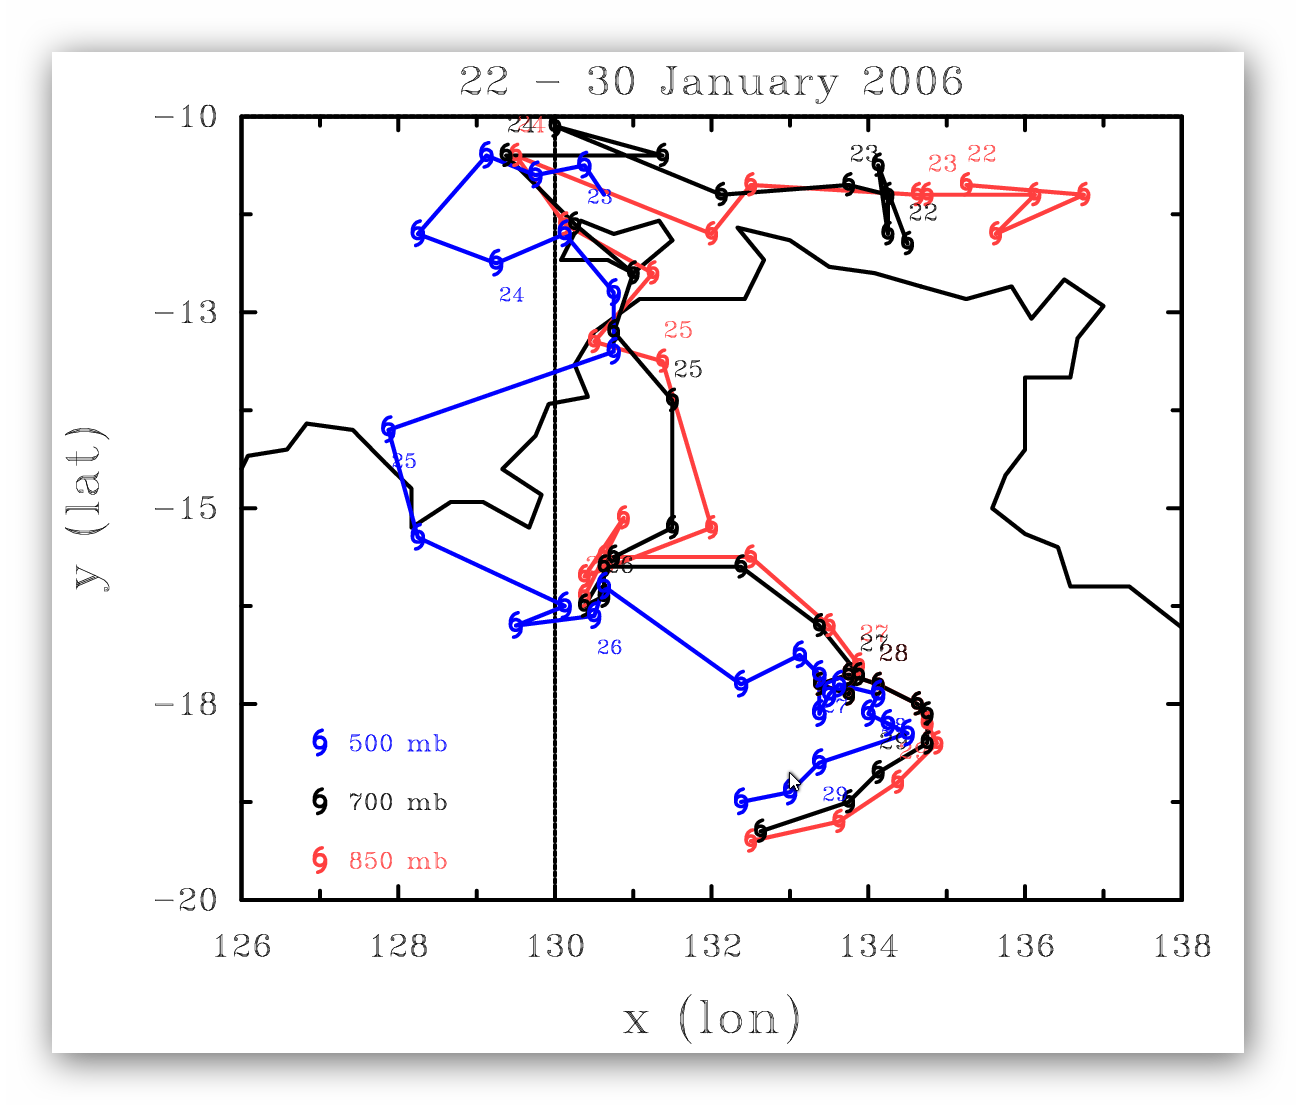
Track (min geopotential at selected heights)
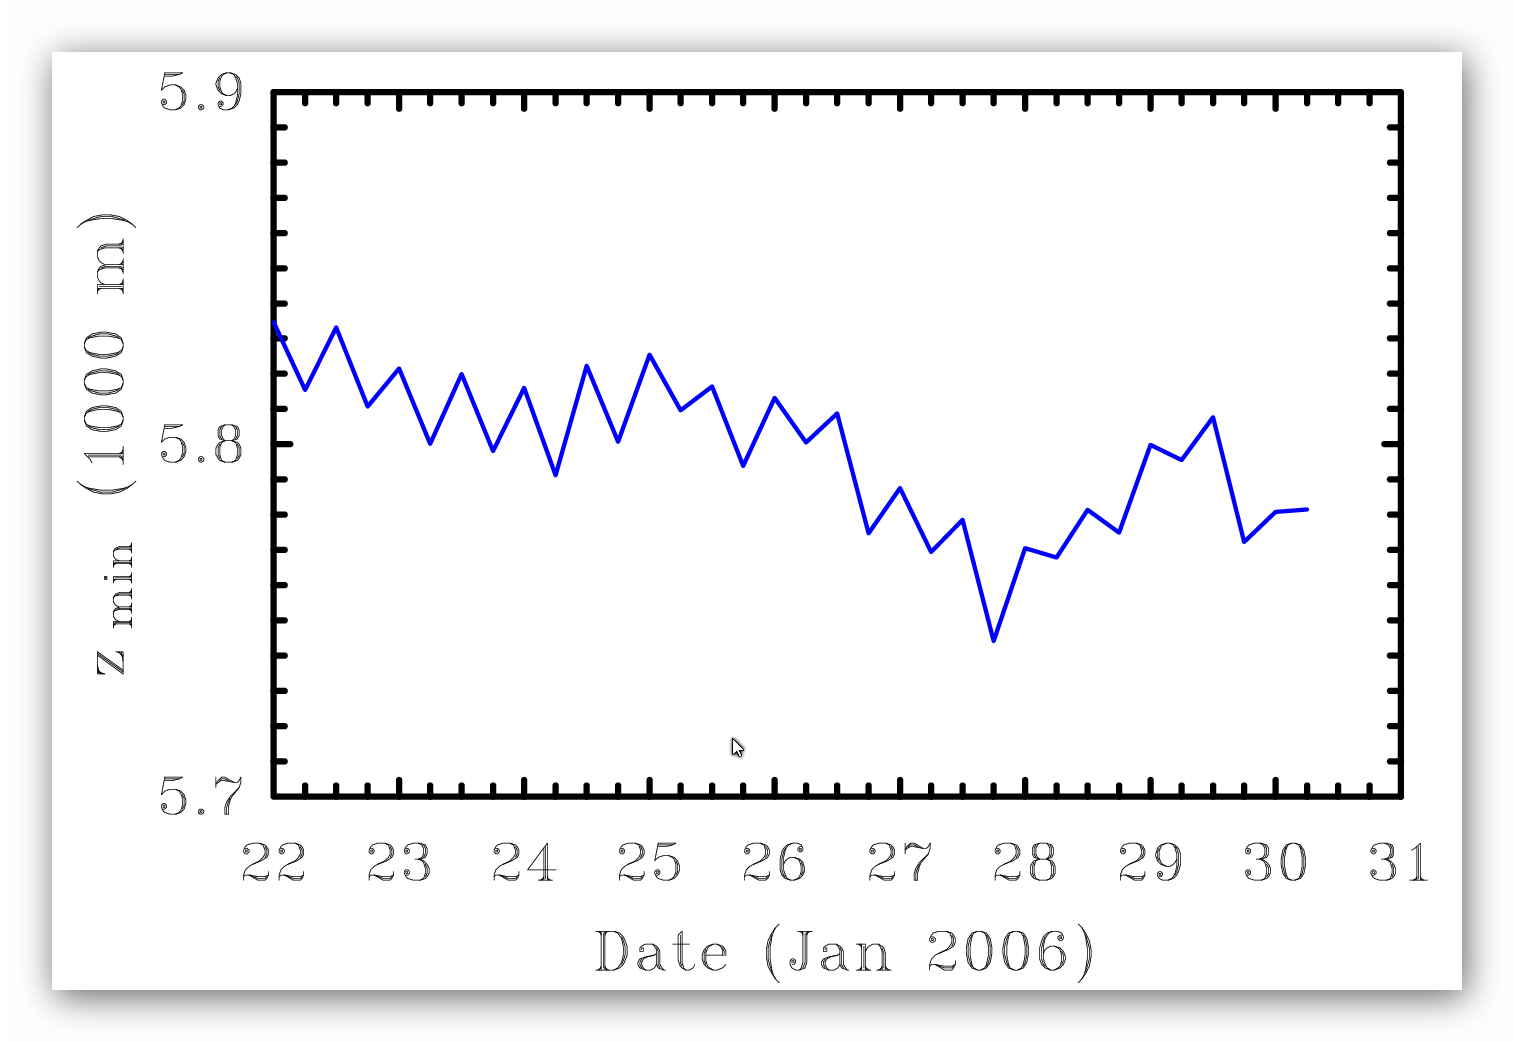
Intensity 850 mb
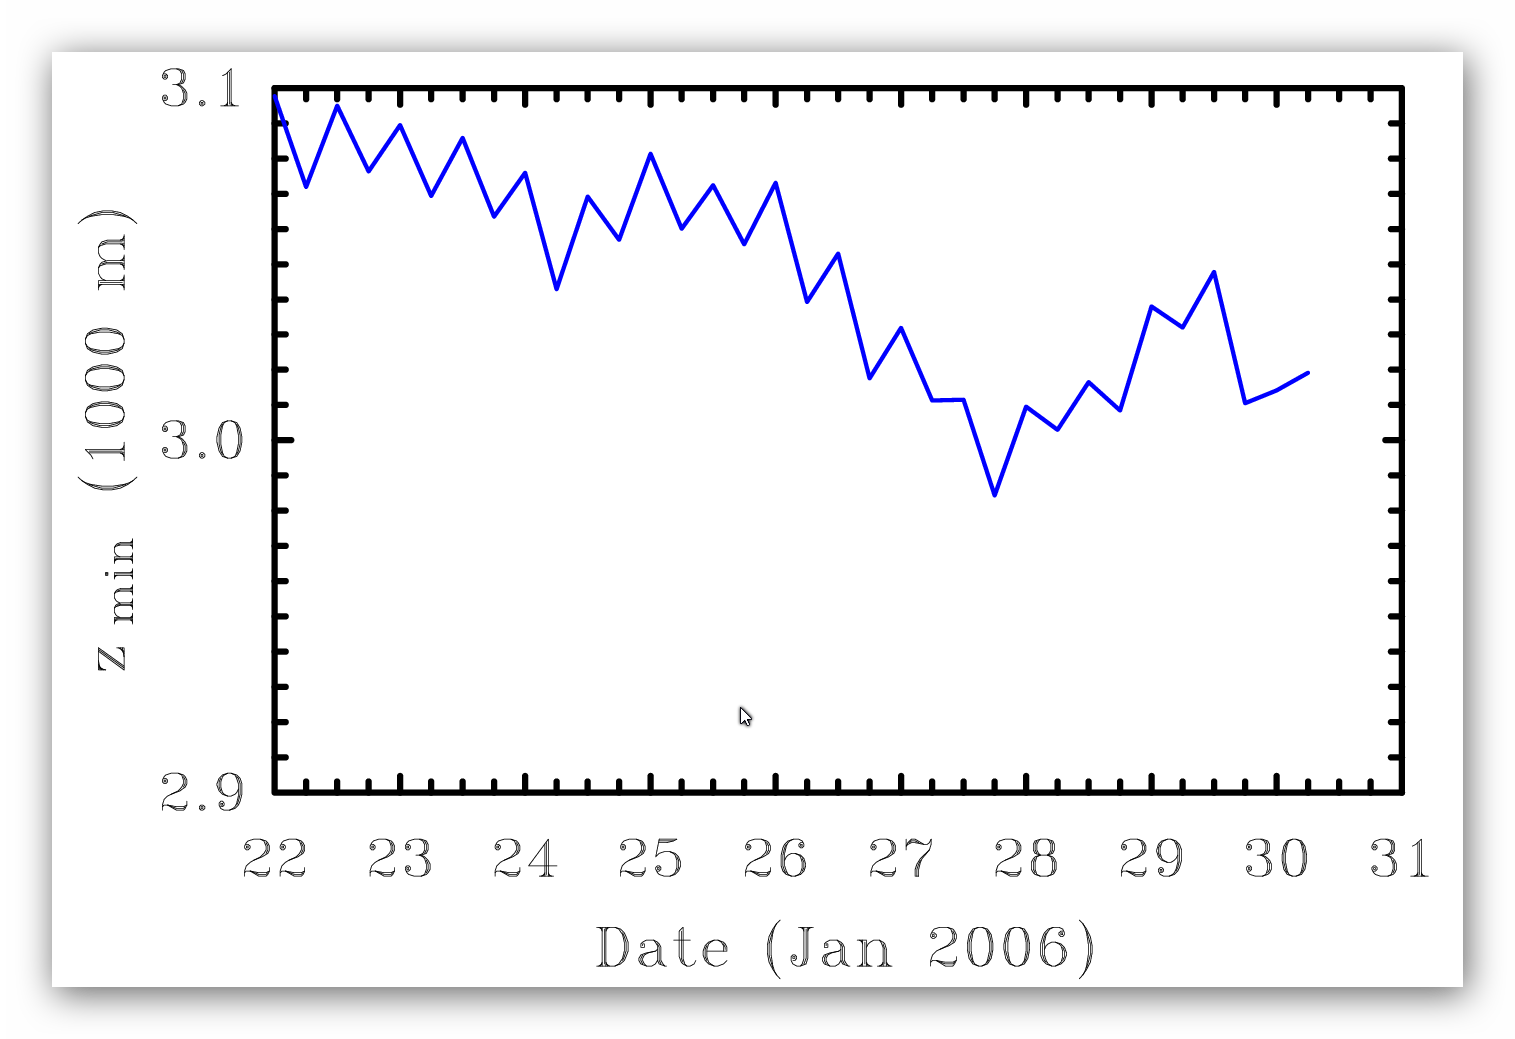
Intensity 700 mb
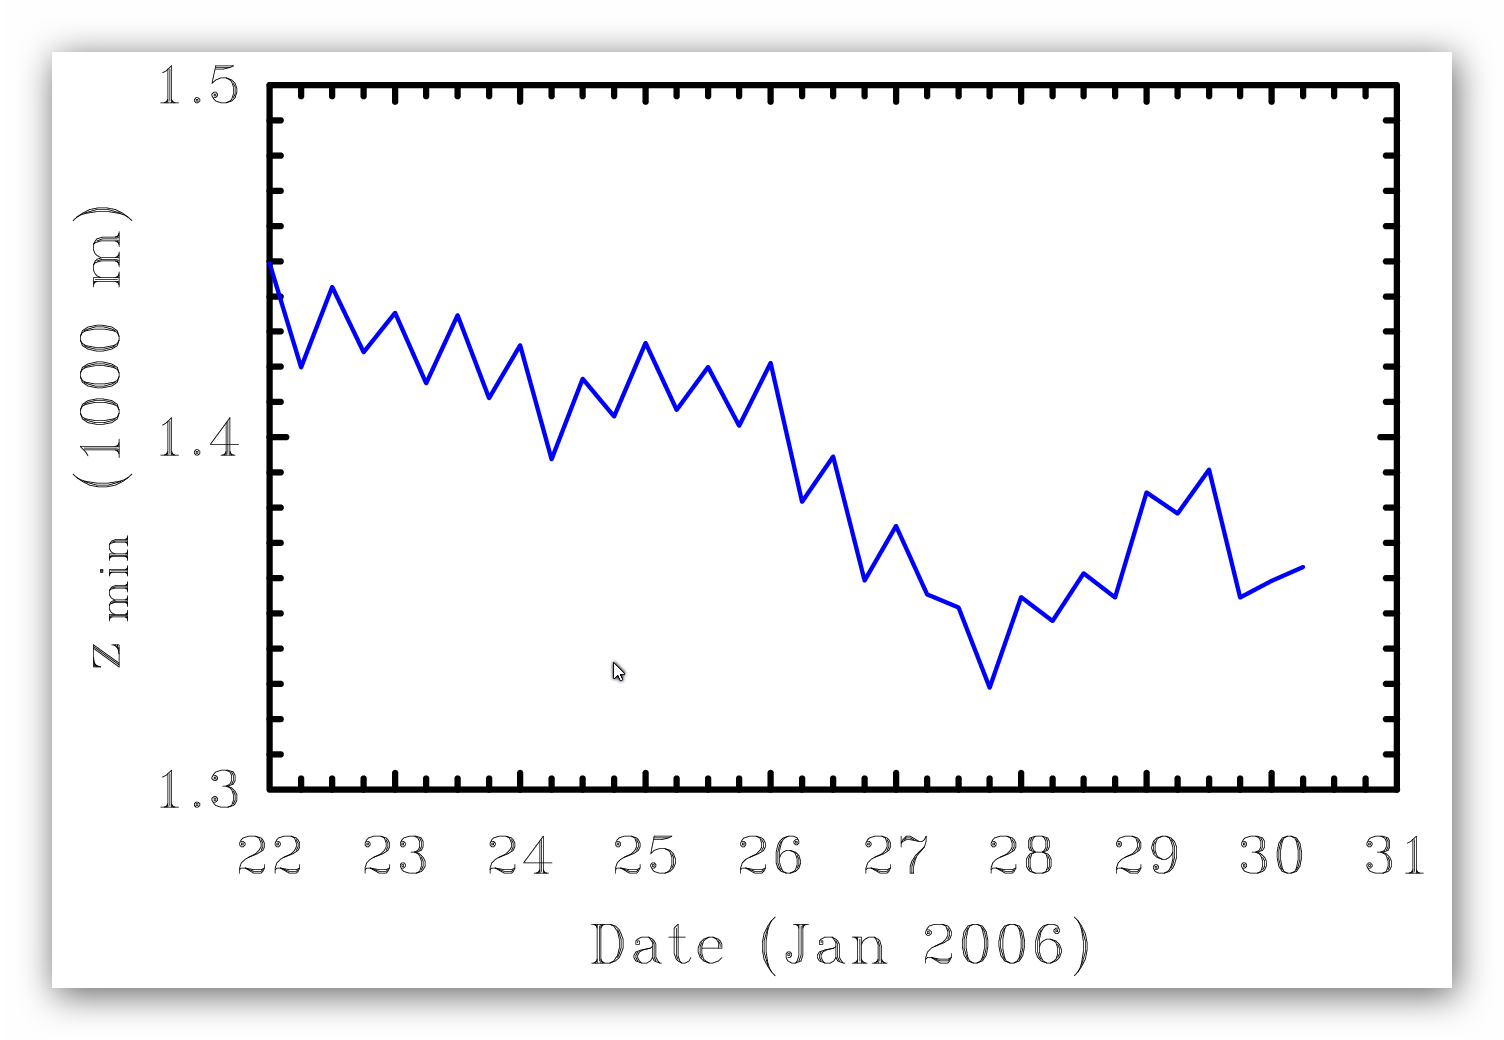
Intensity 500 mb
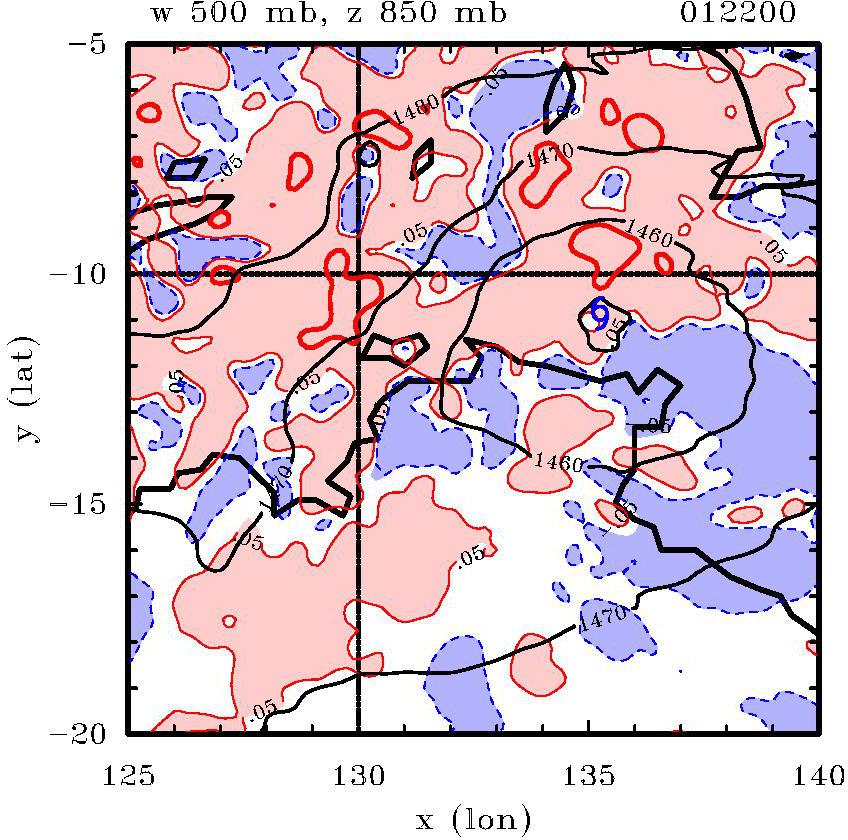
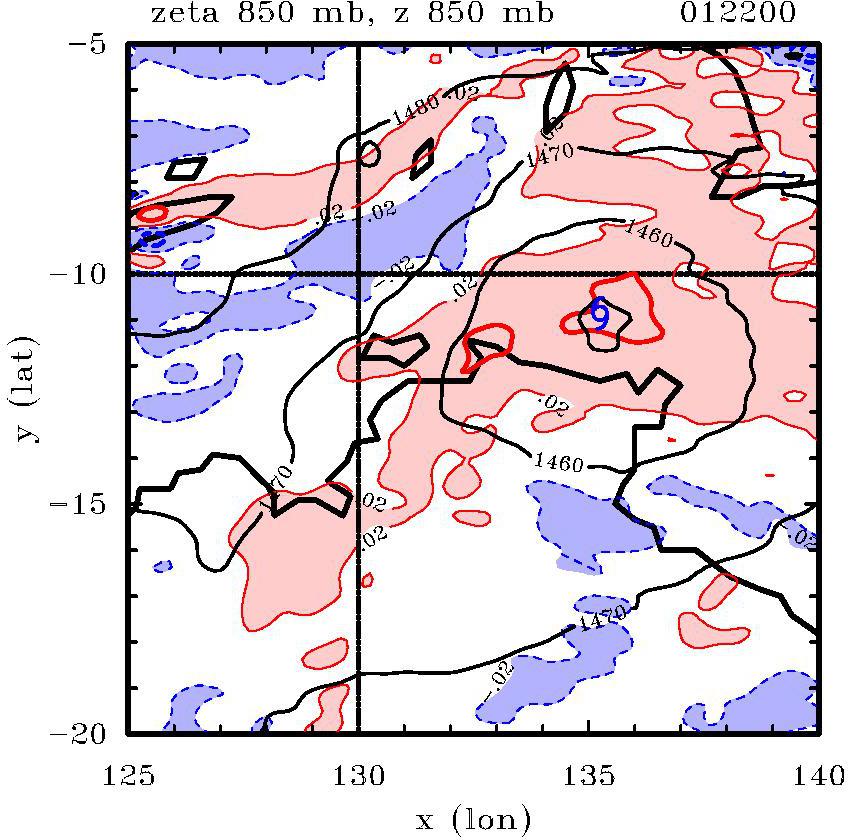
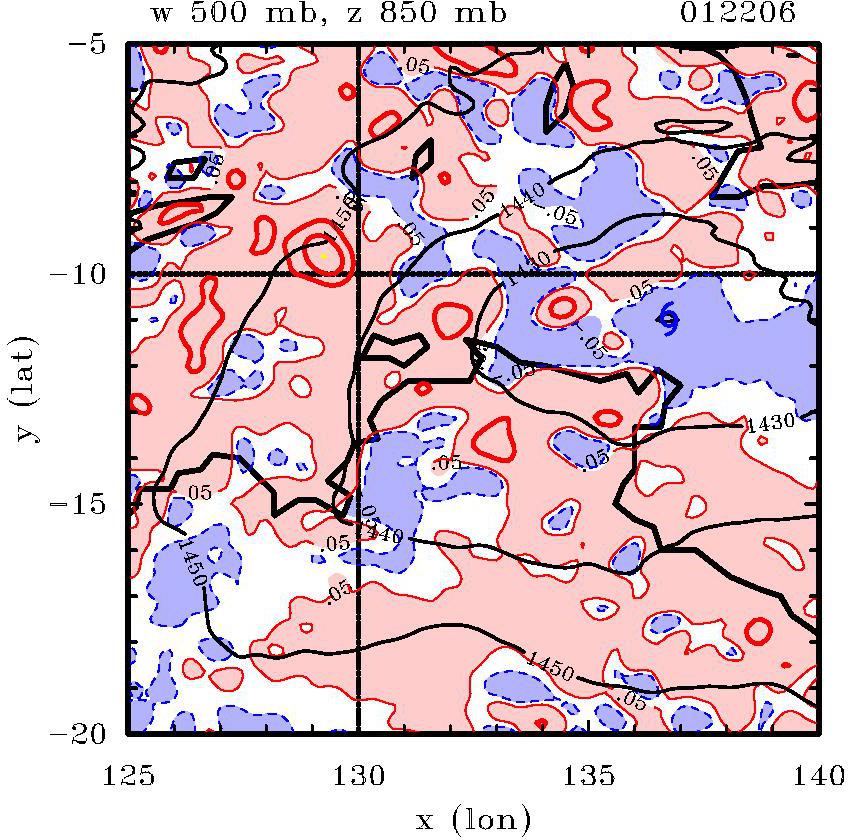
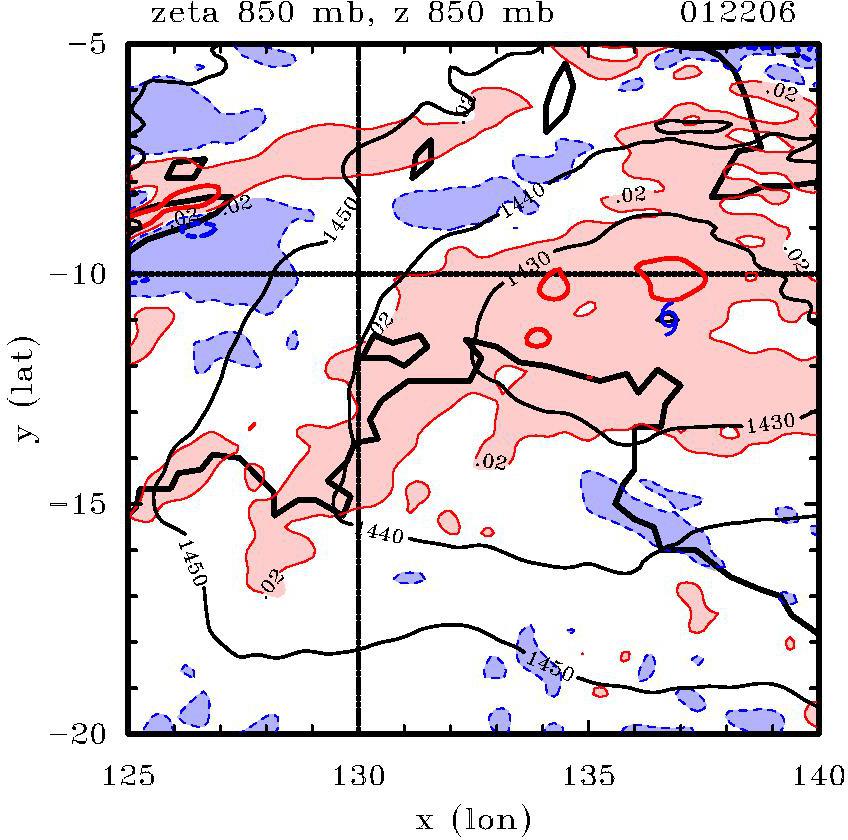
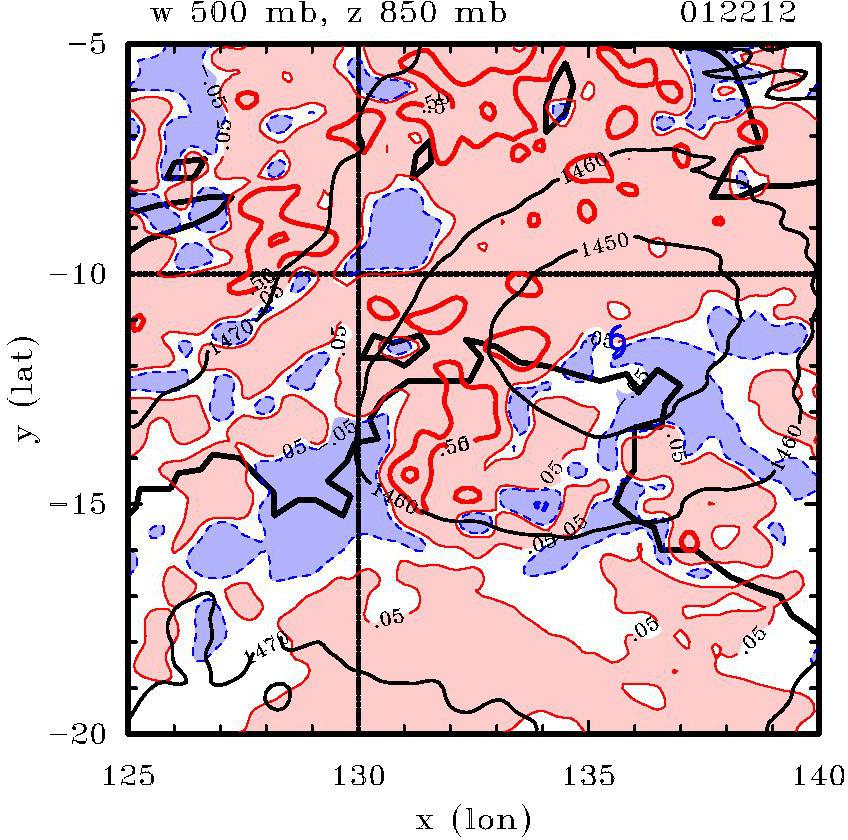
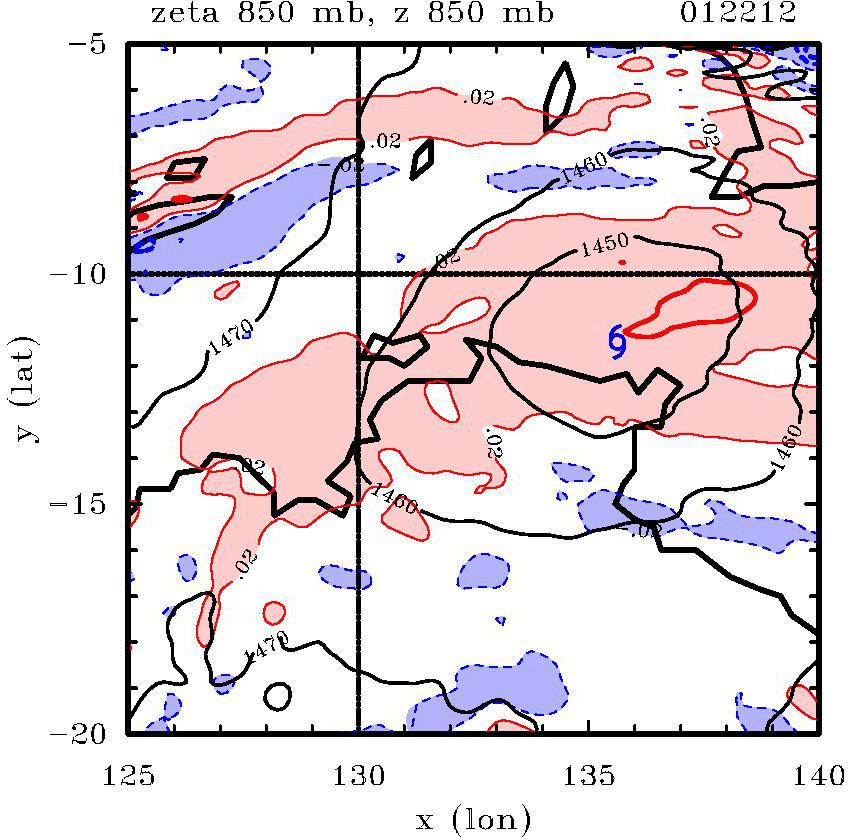
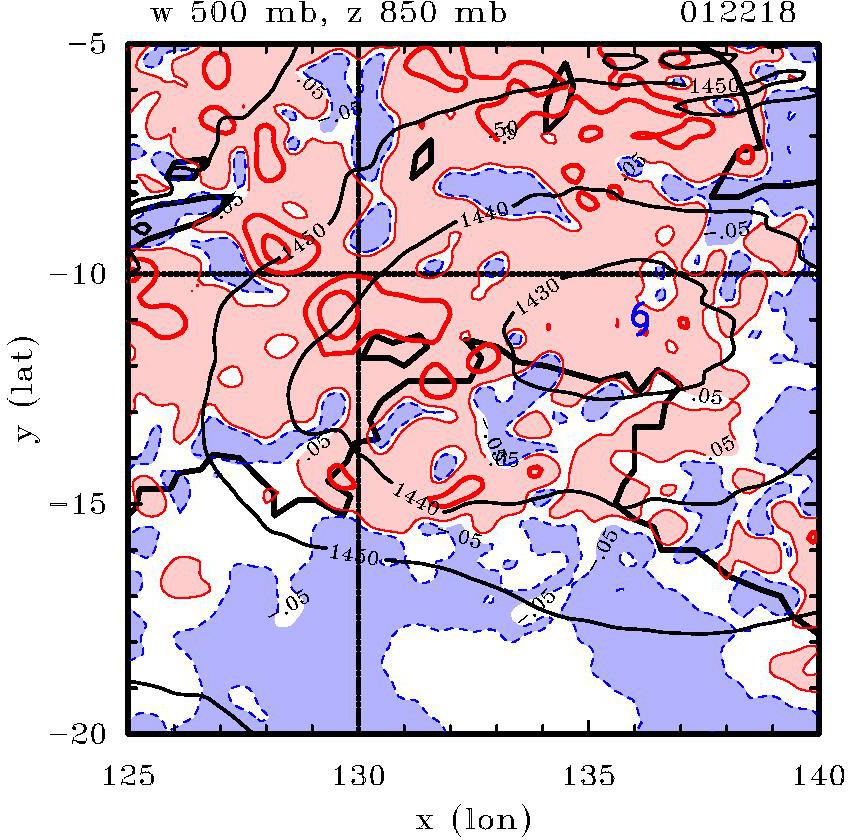
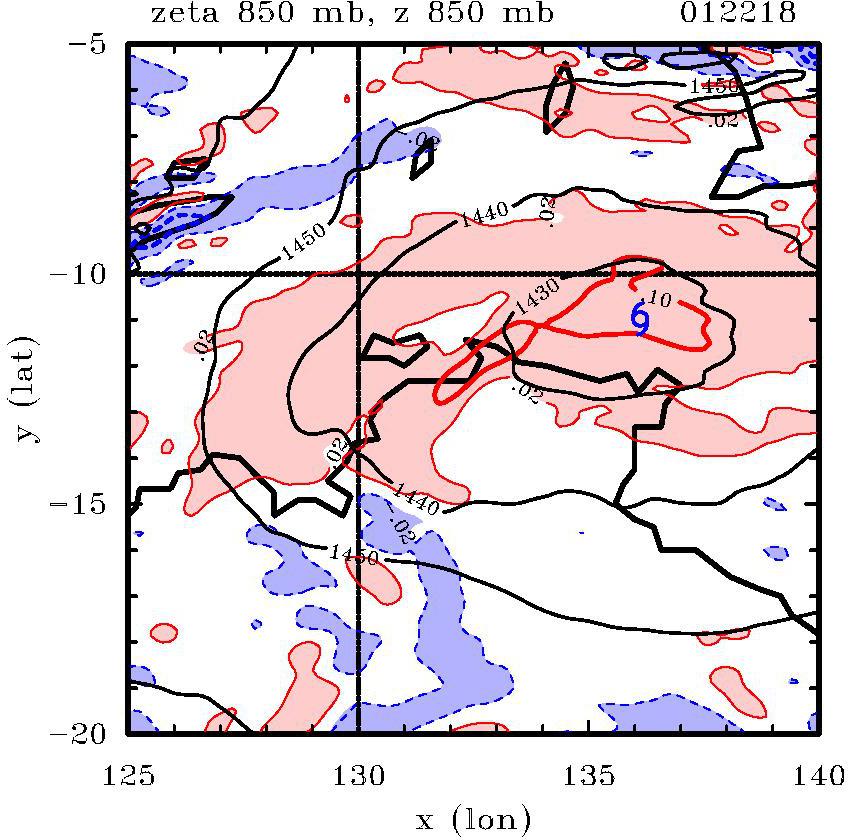
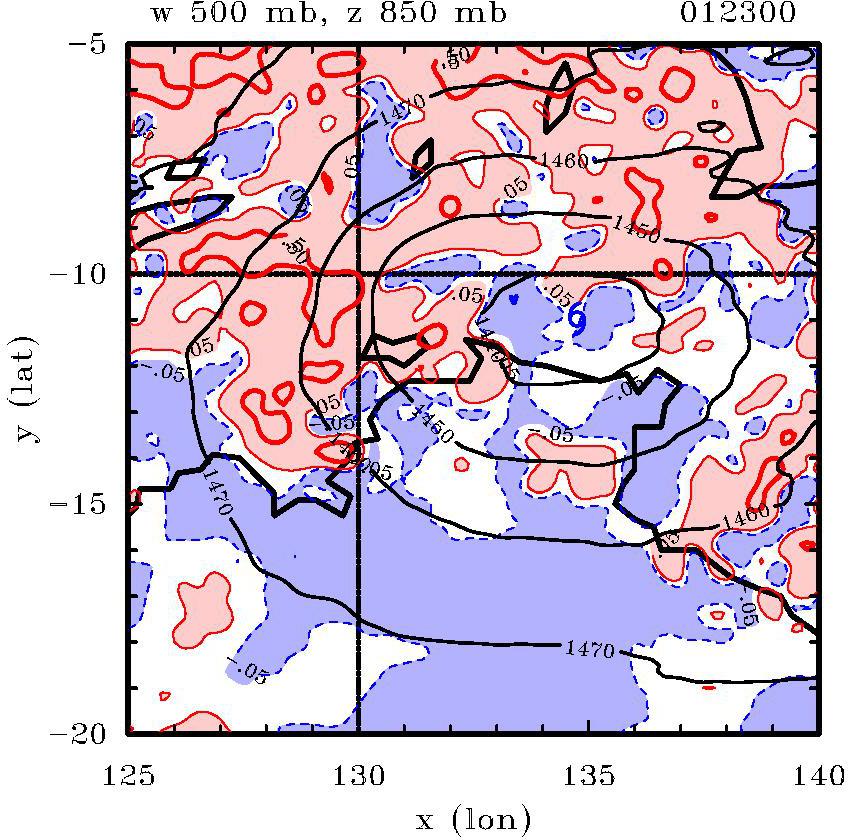
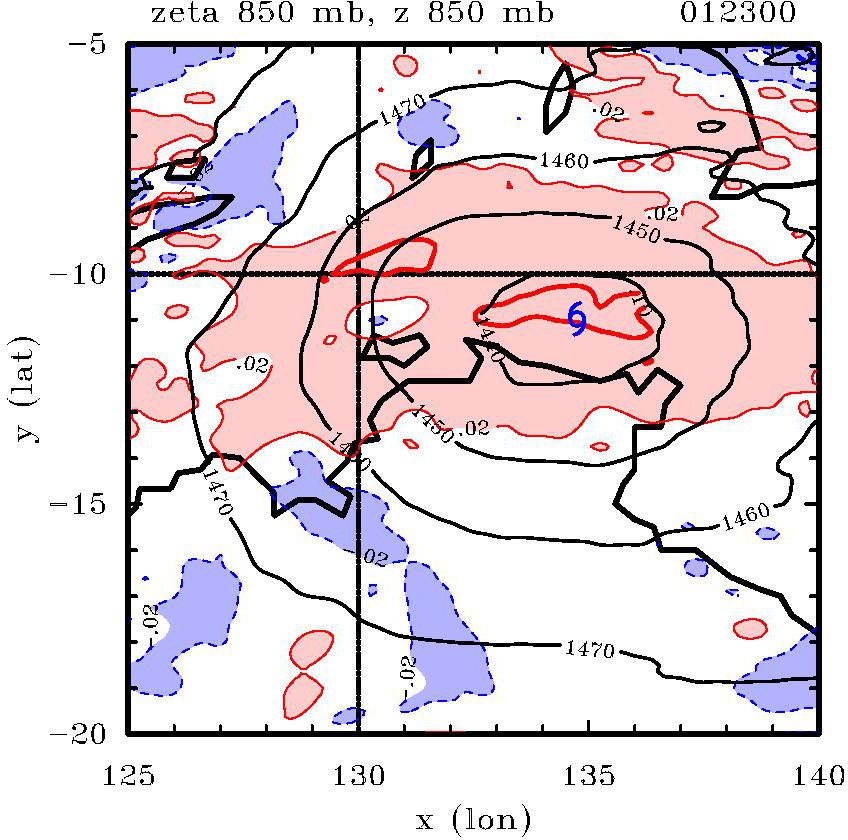
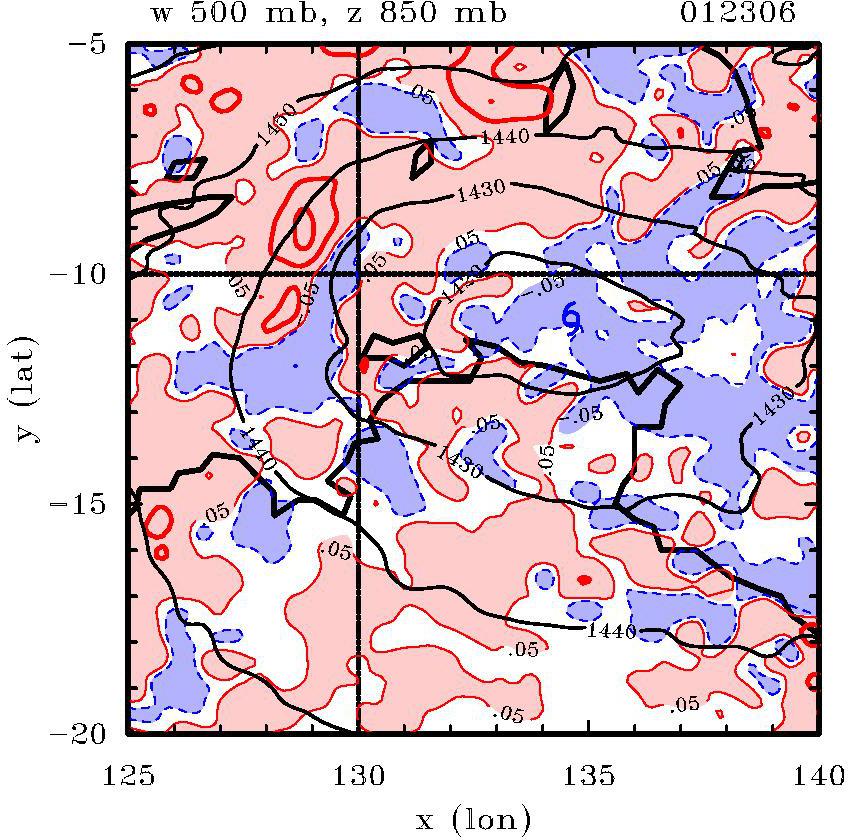
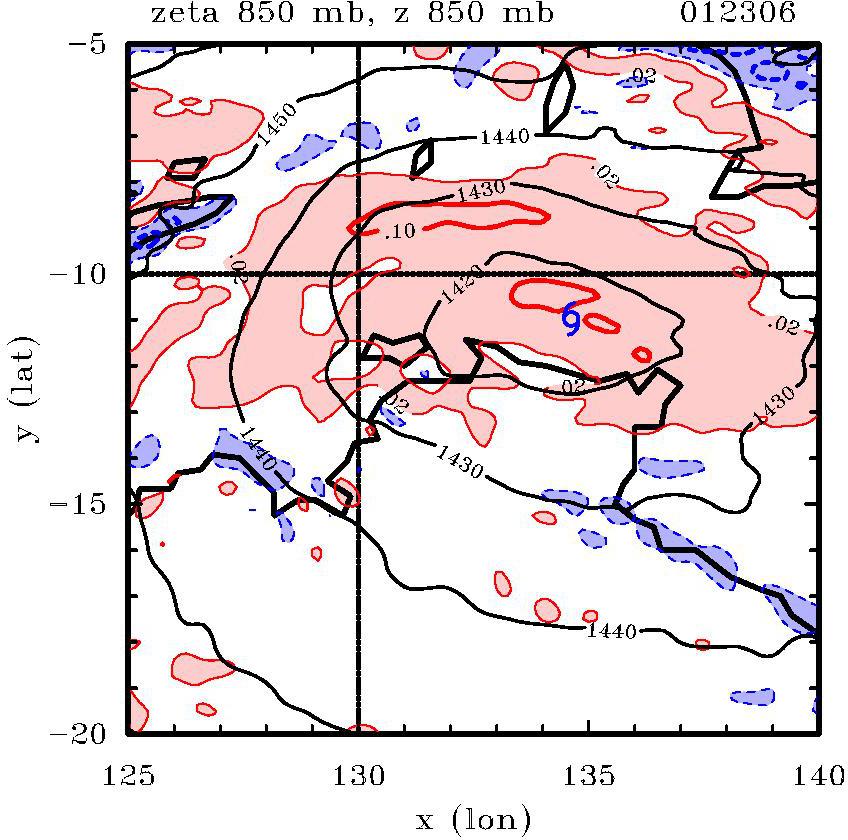
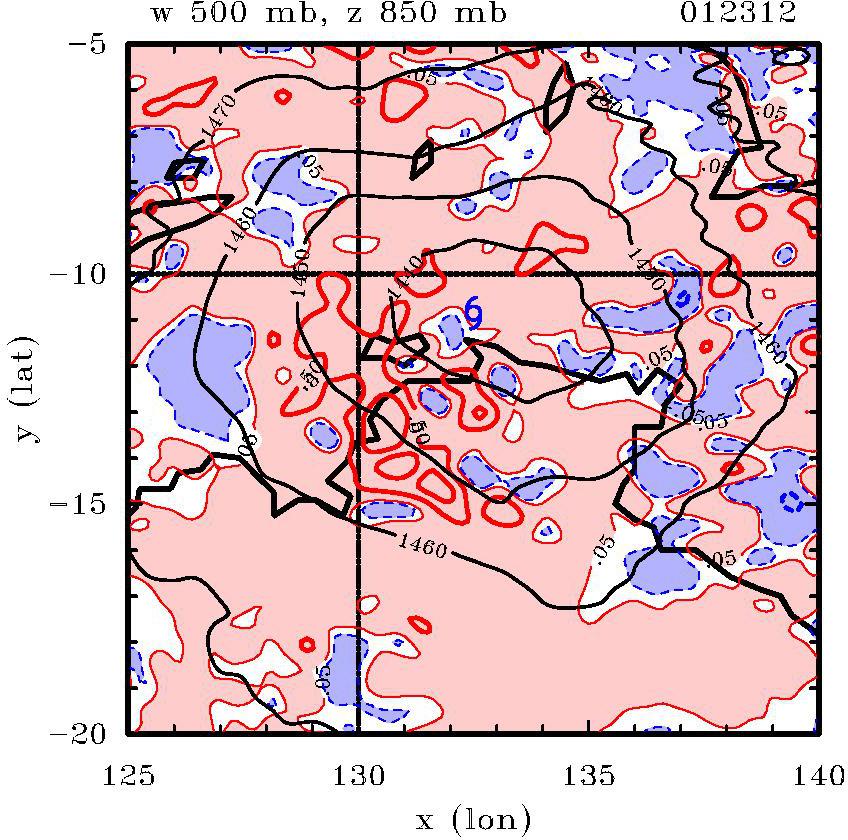
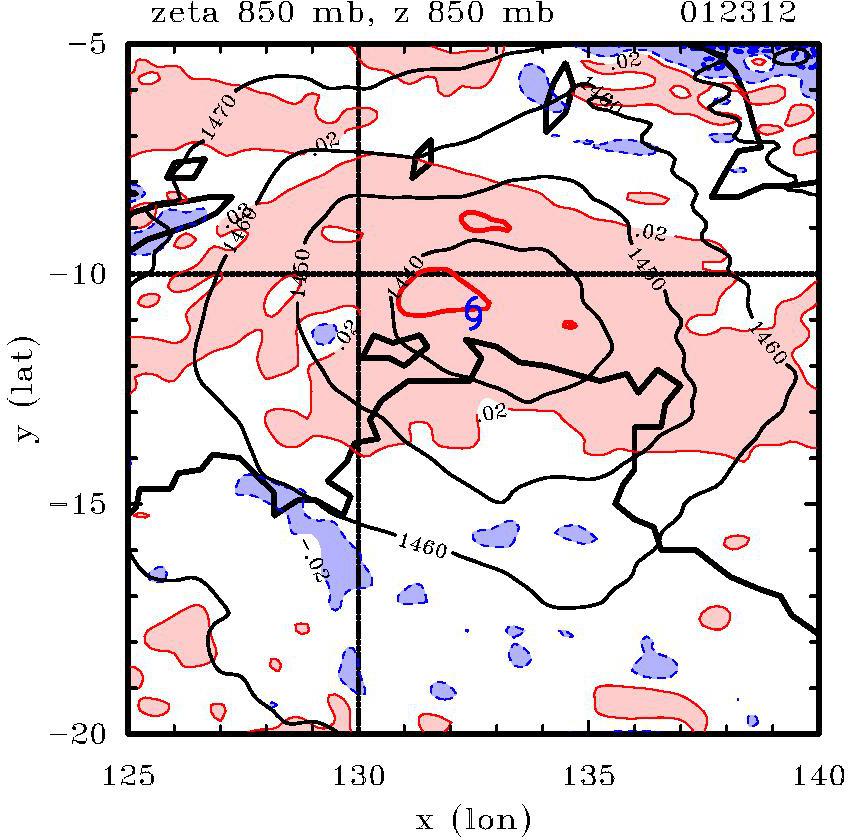
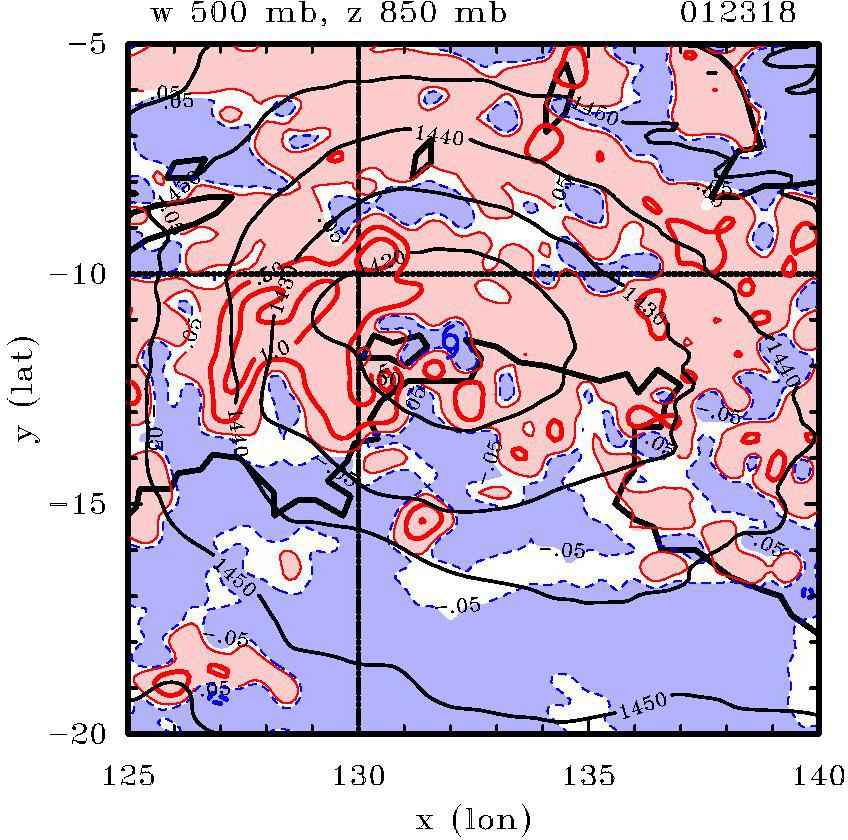
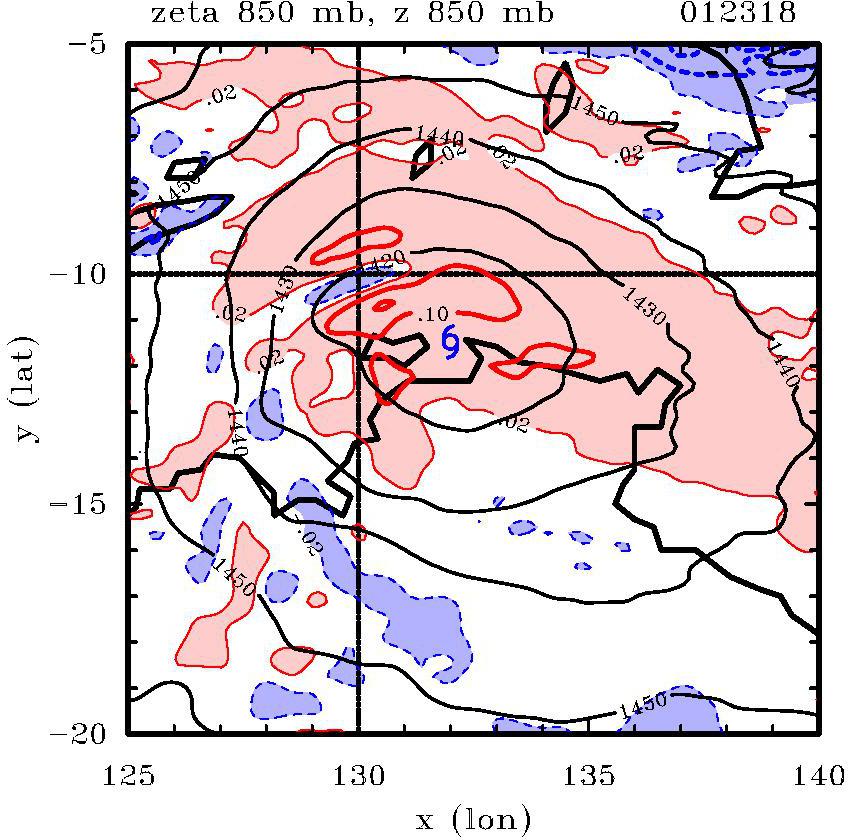
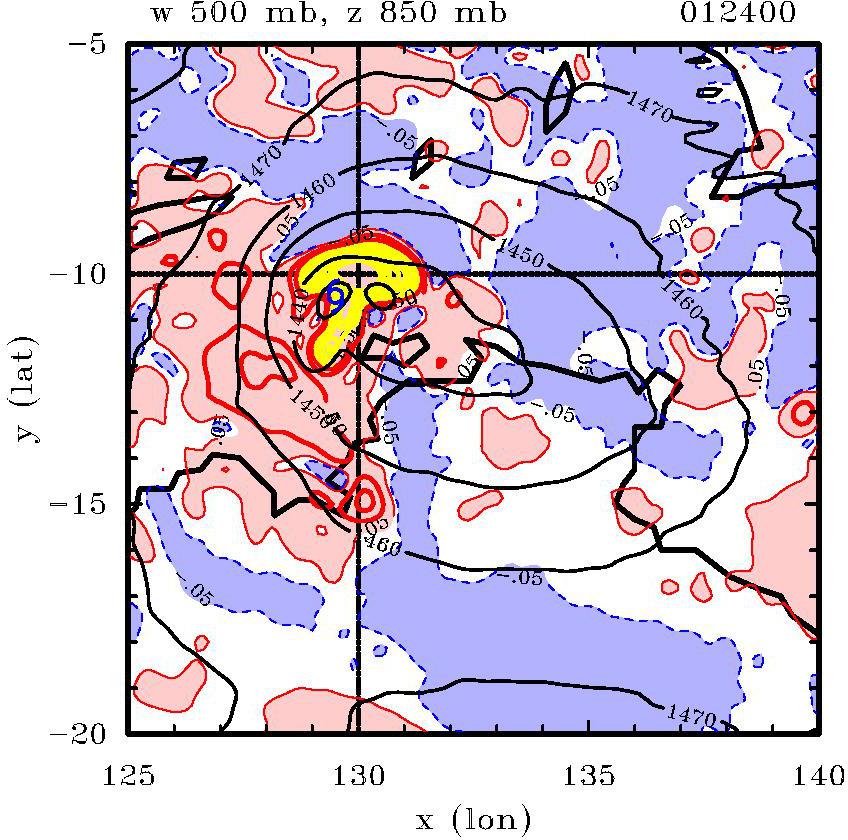
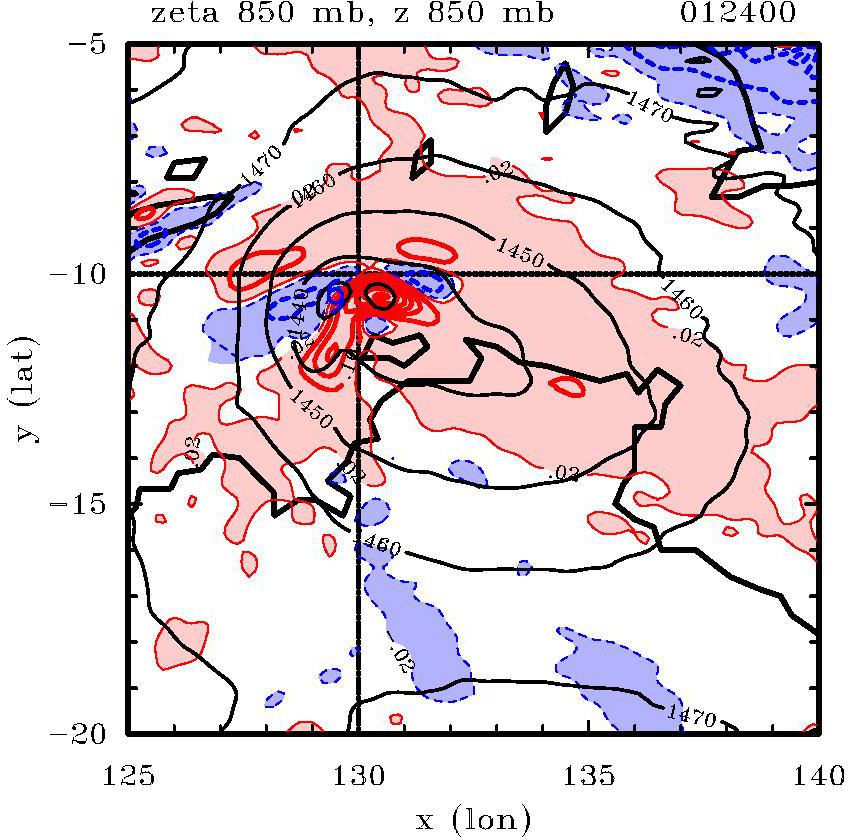
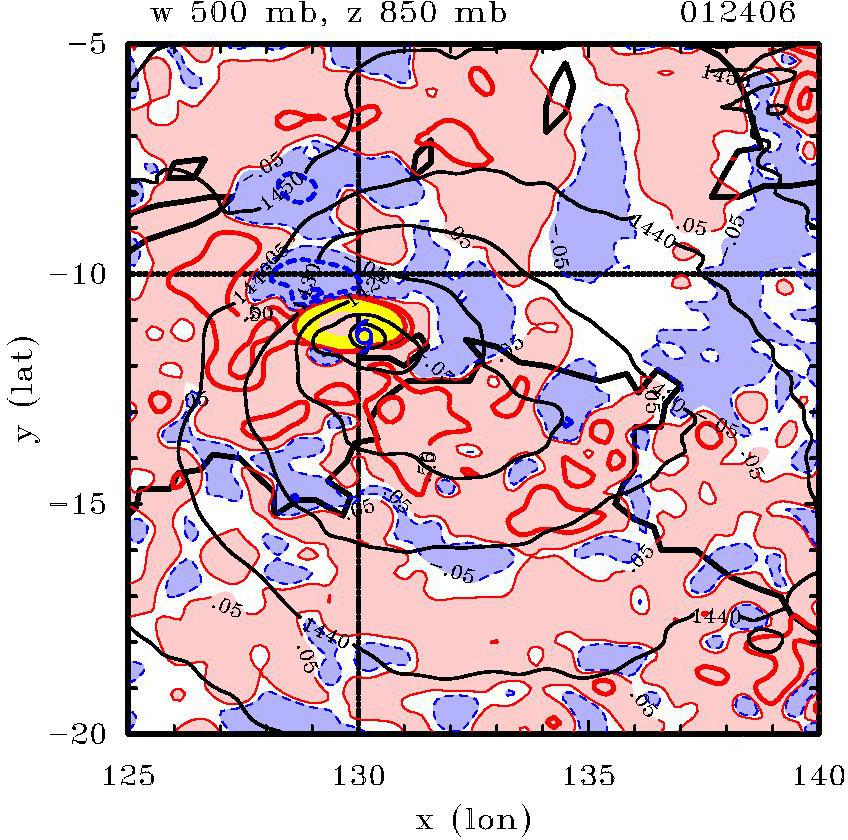
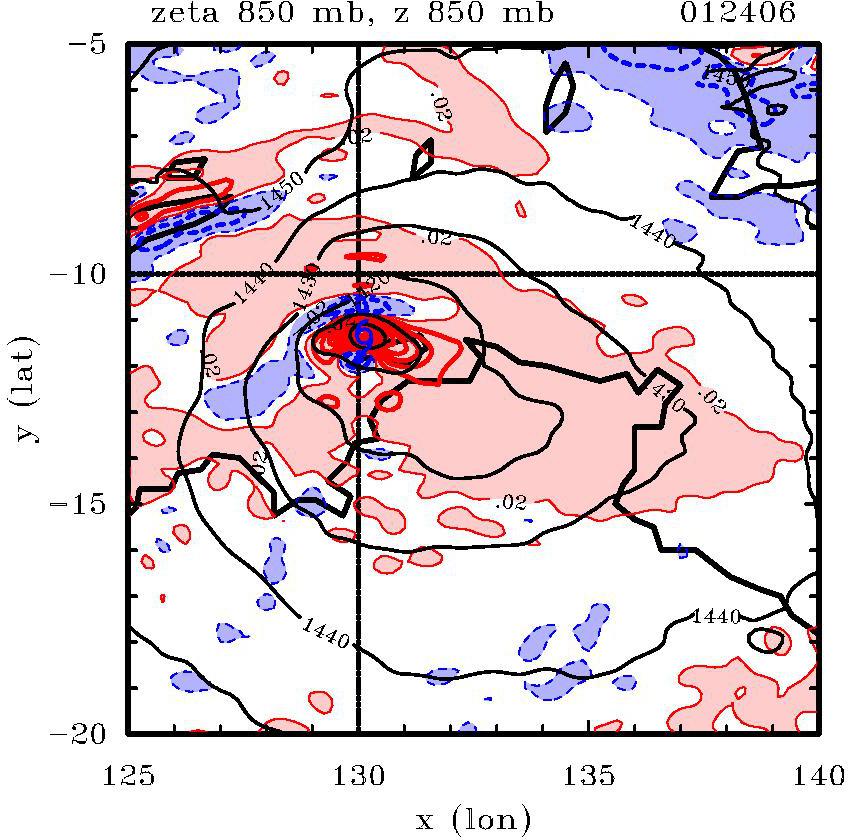
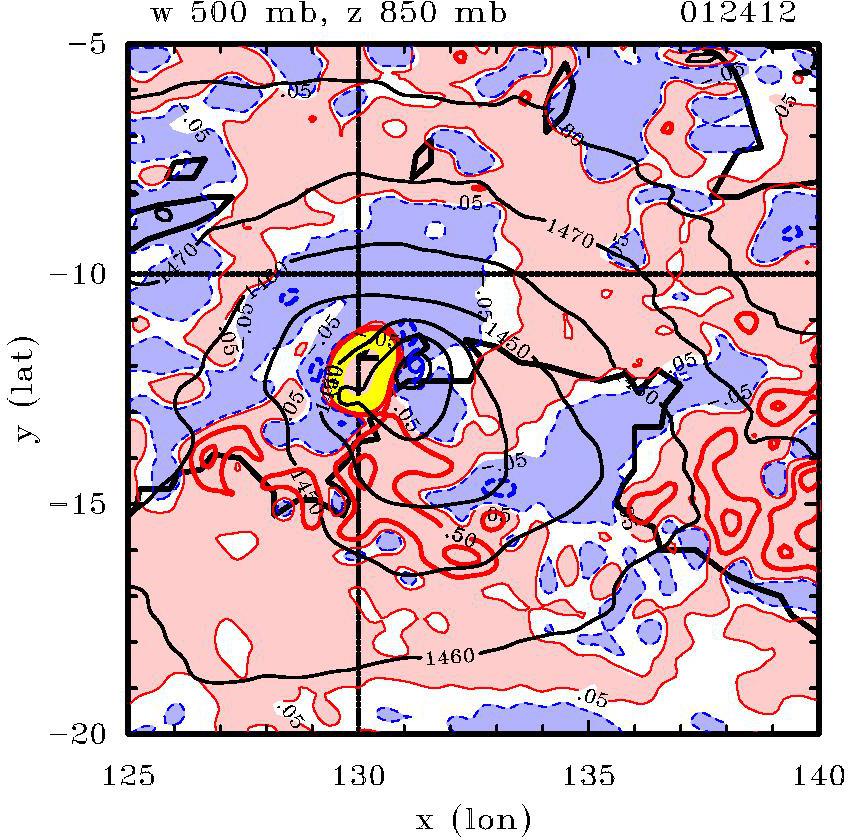
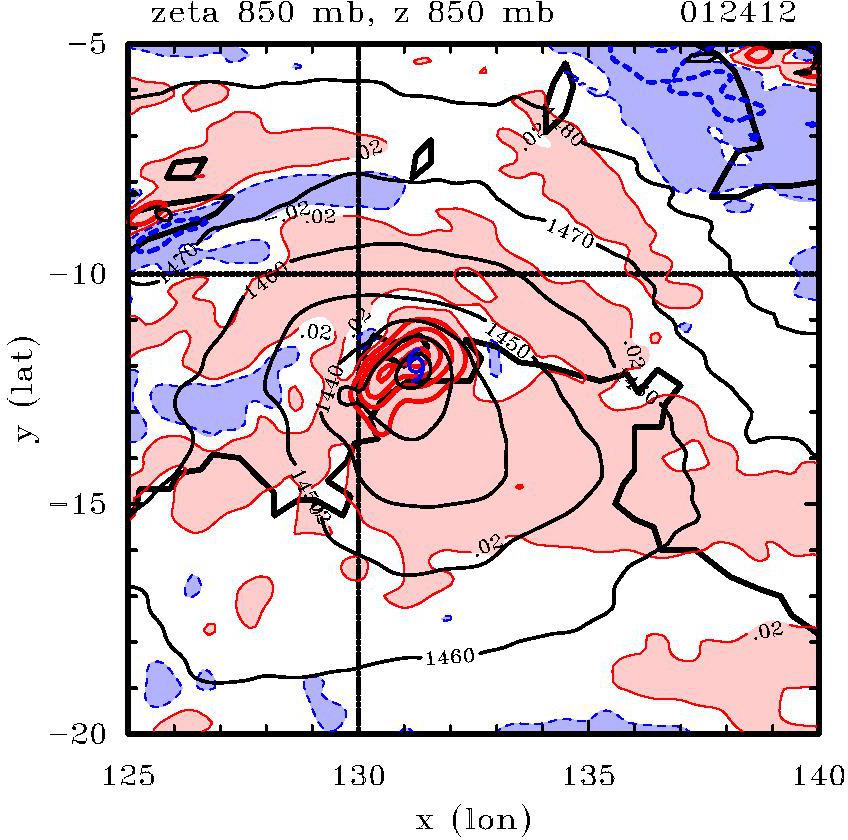
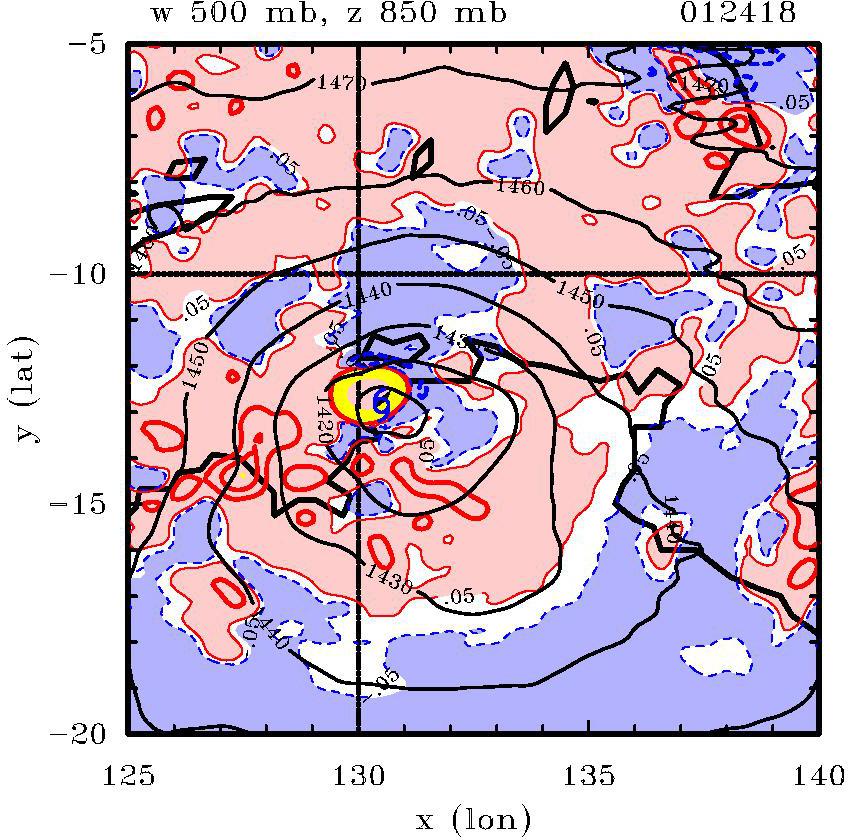
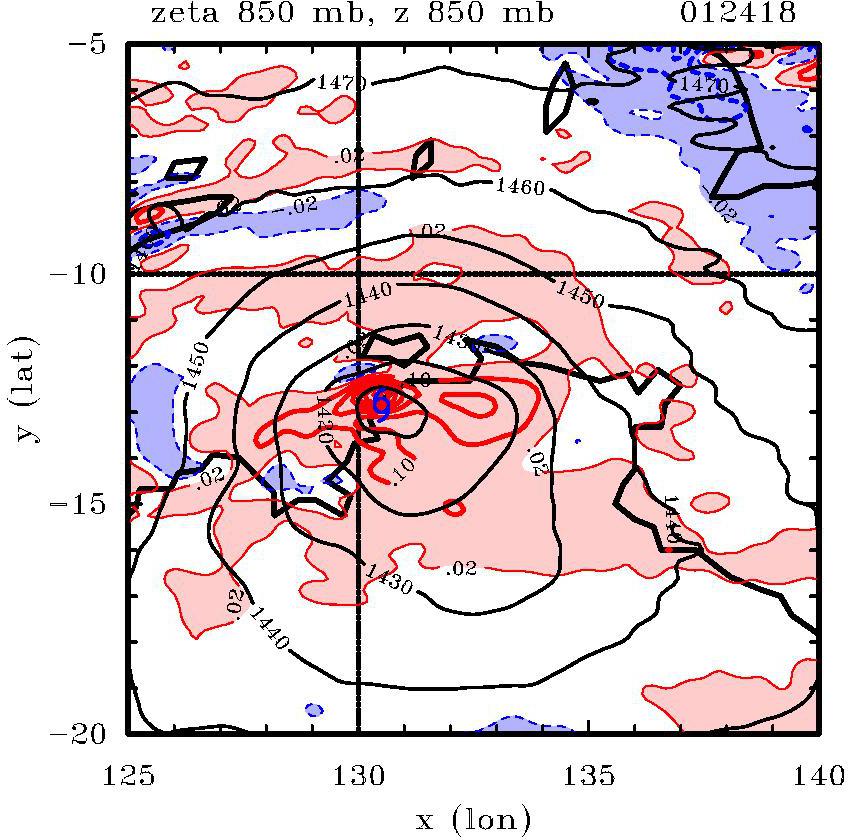
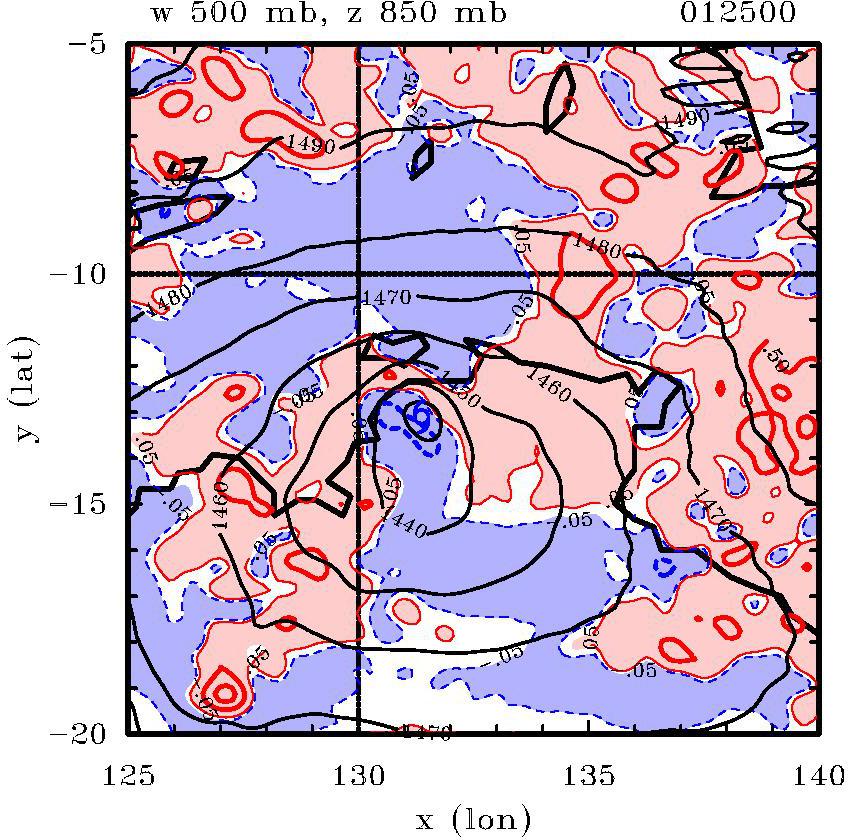
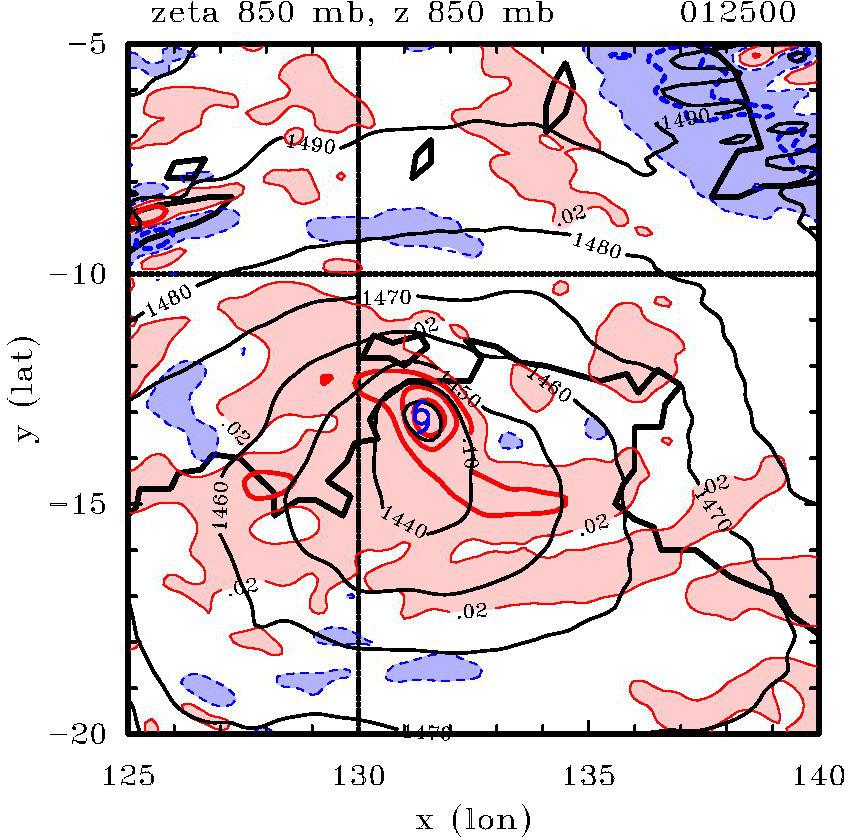
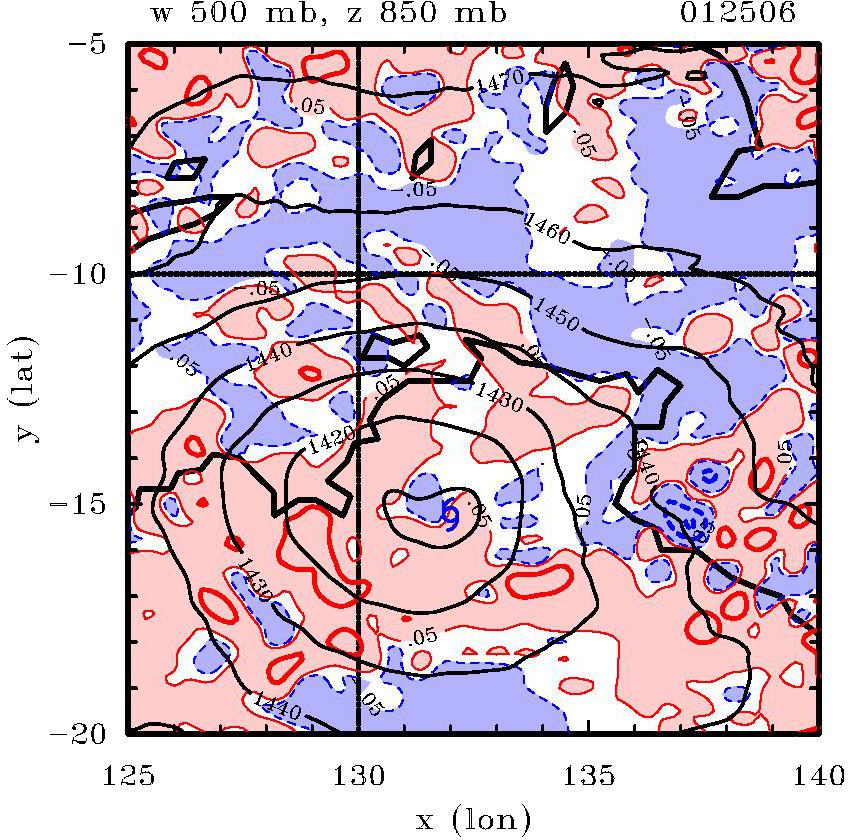
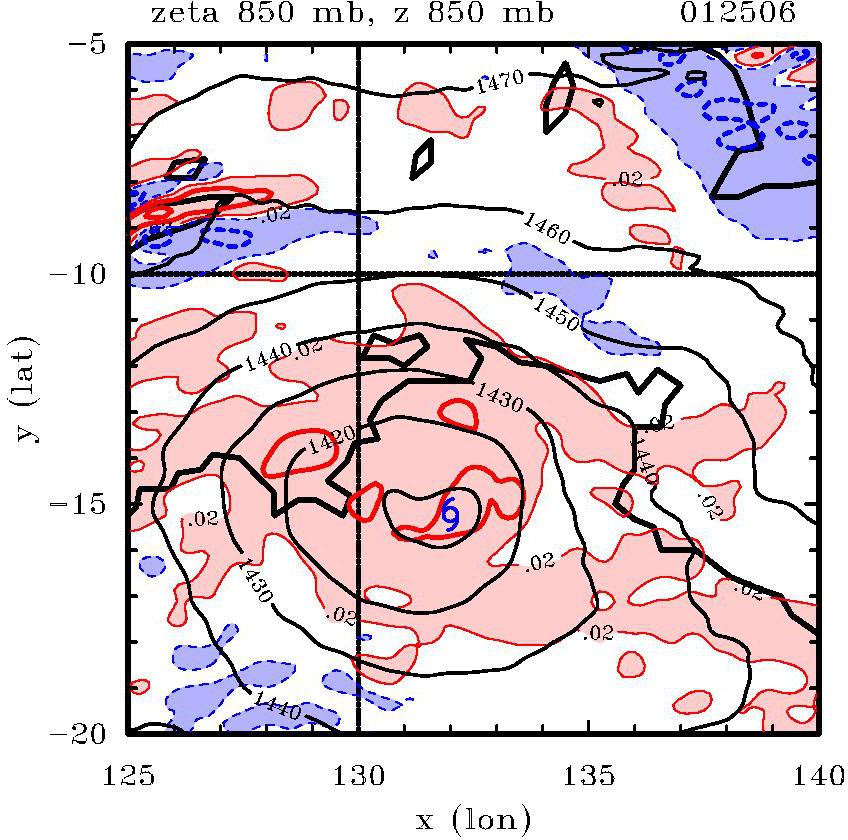
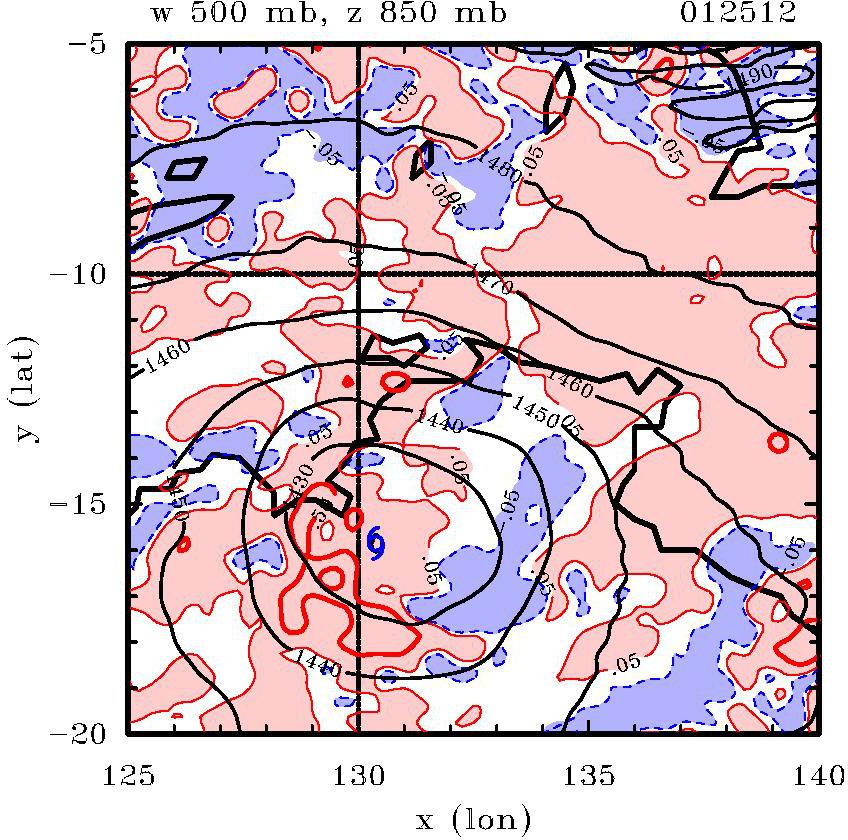
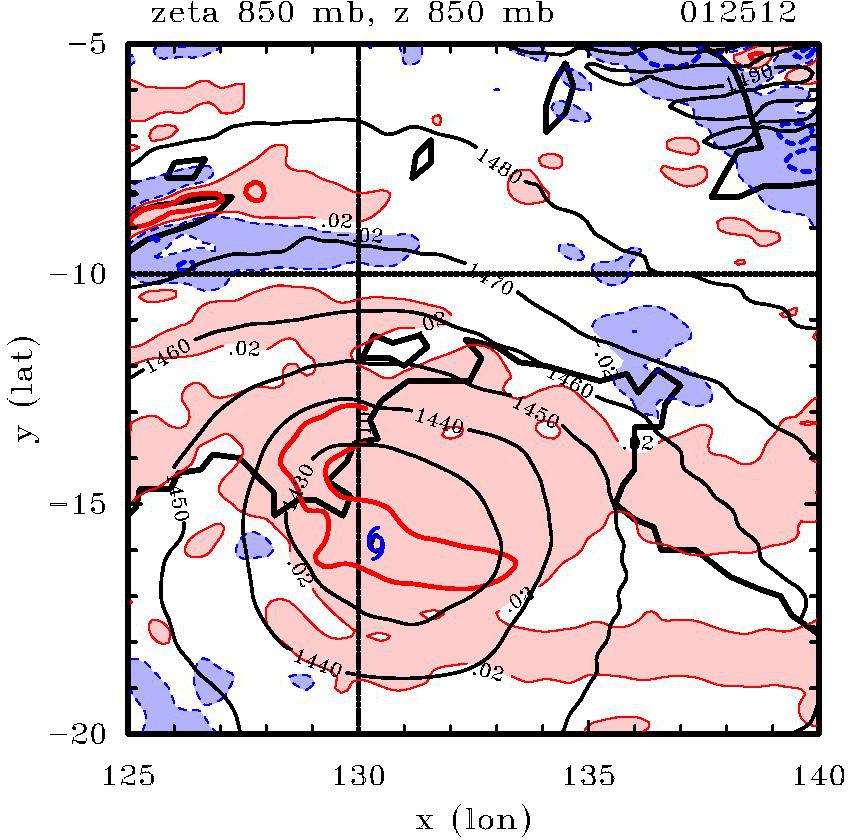
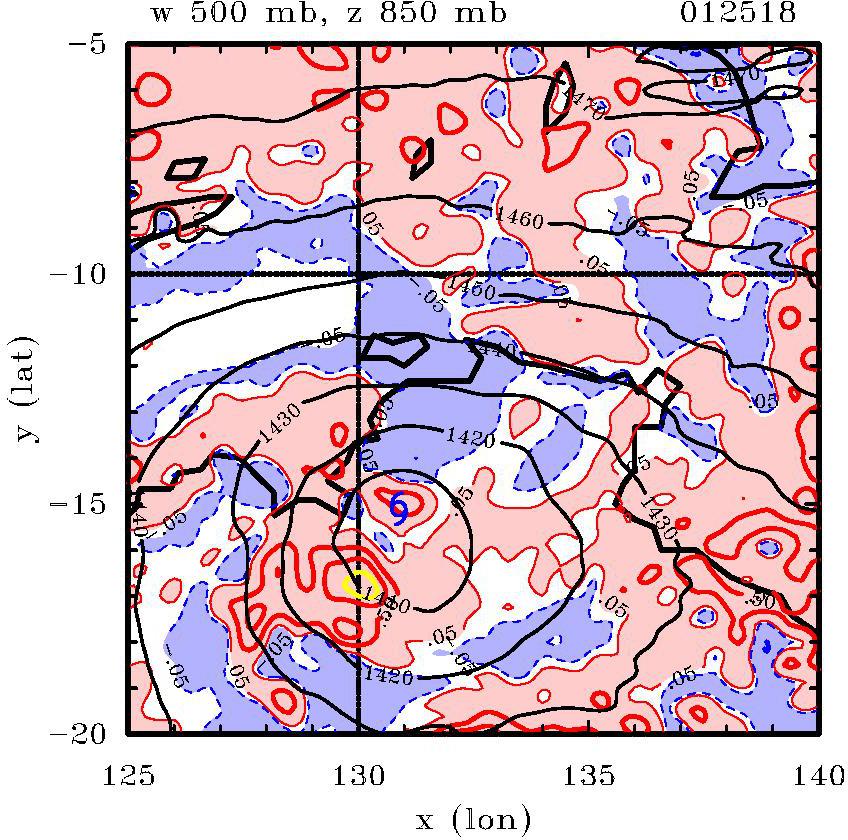
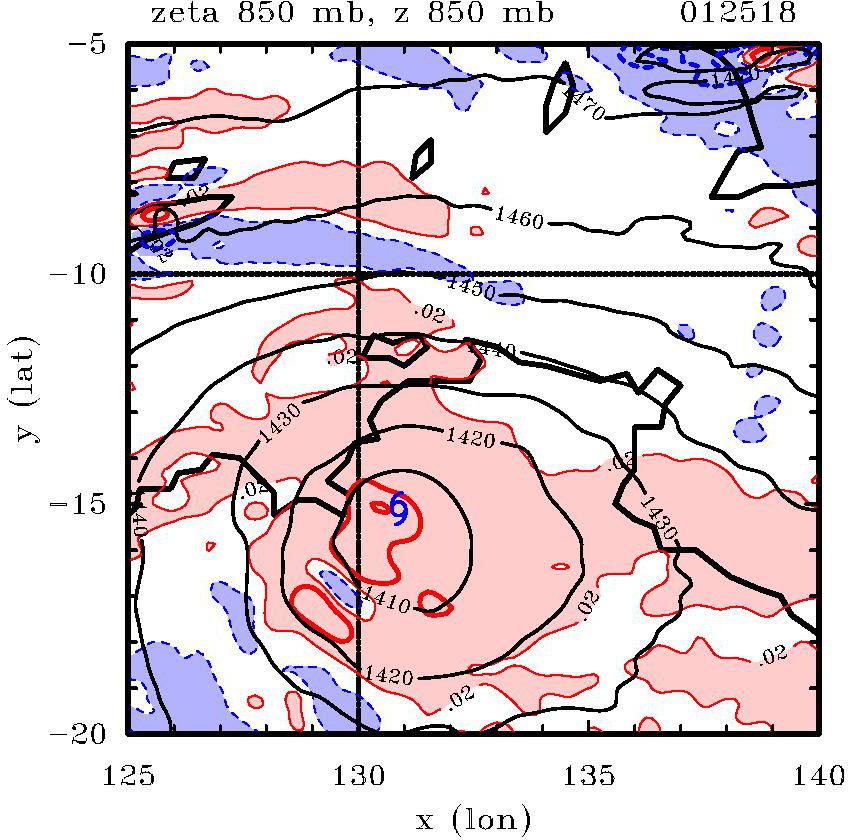
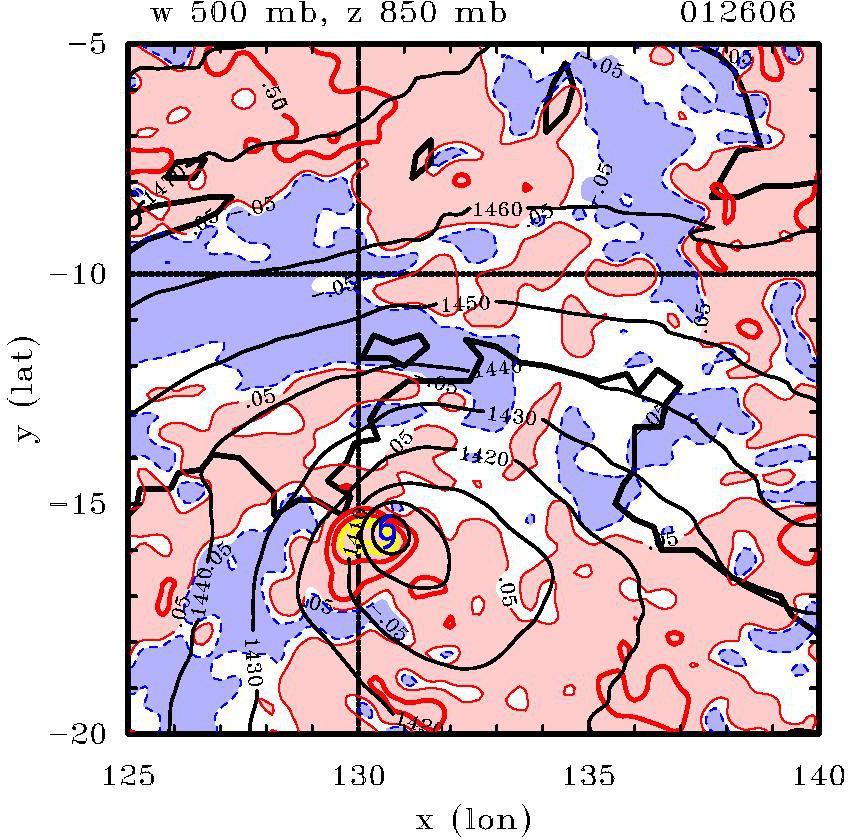
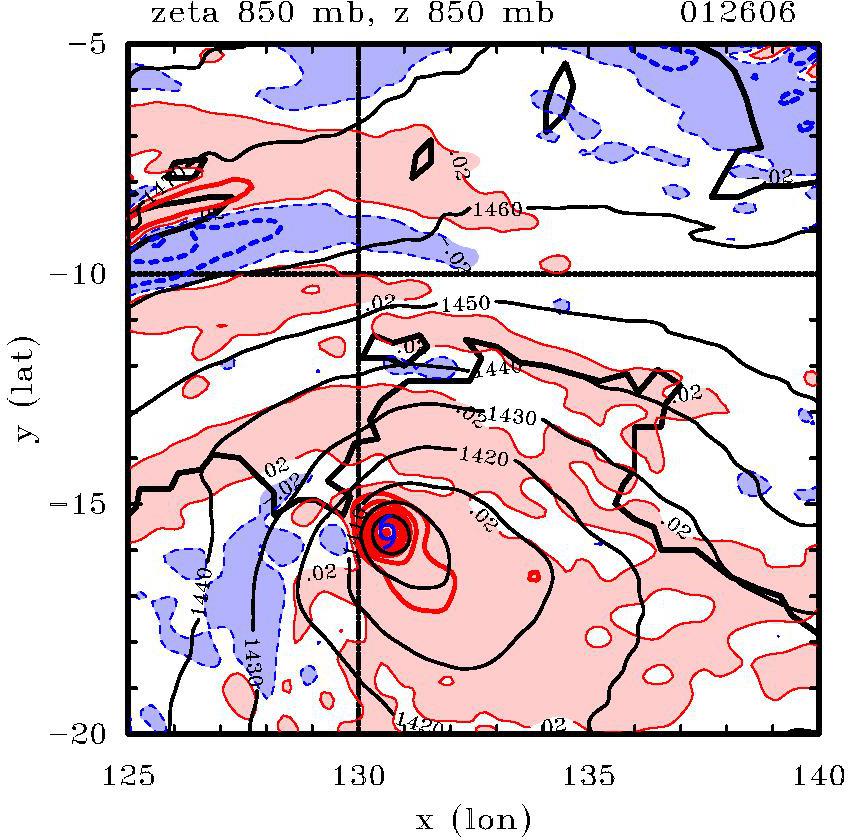
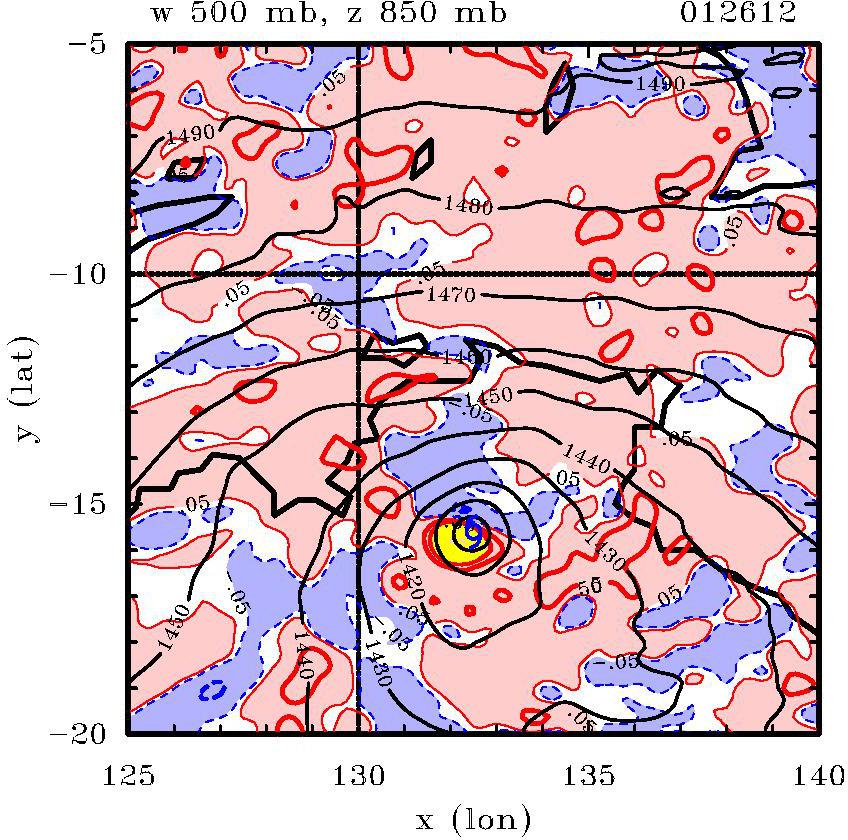
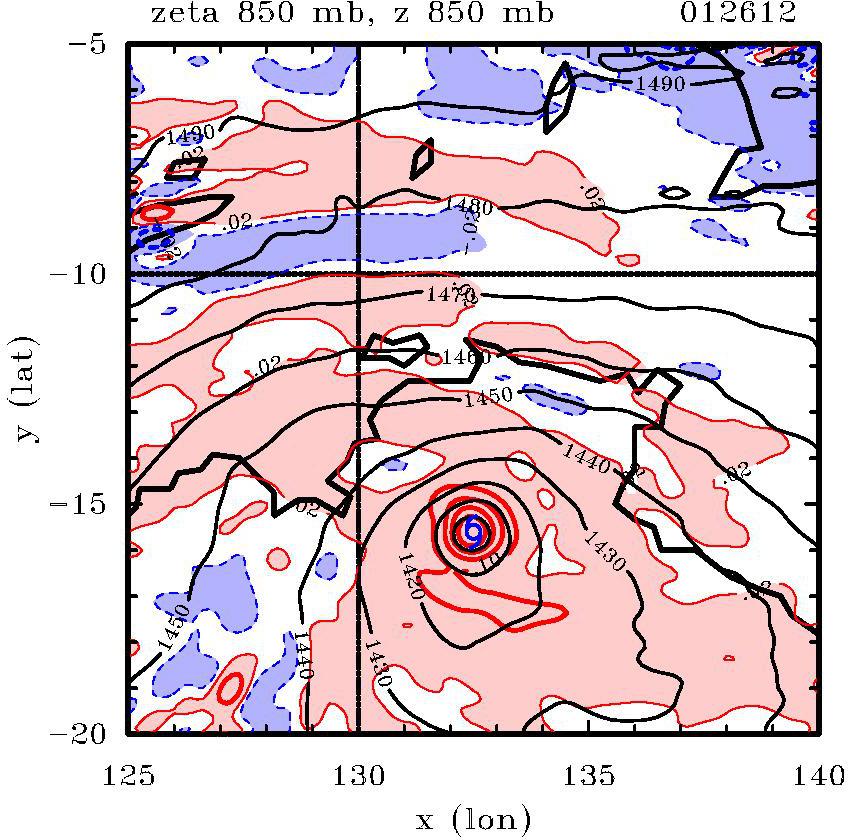
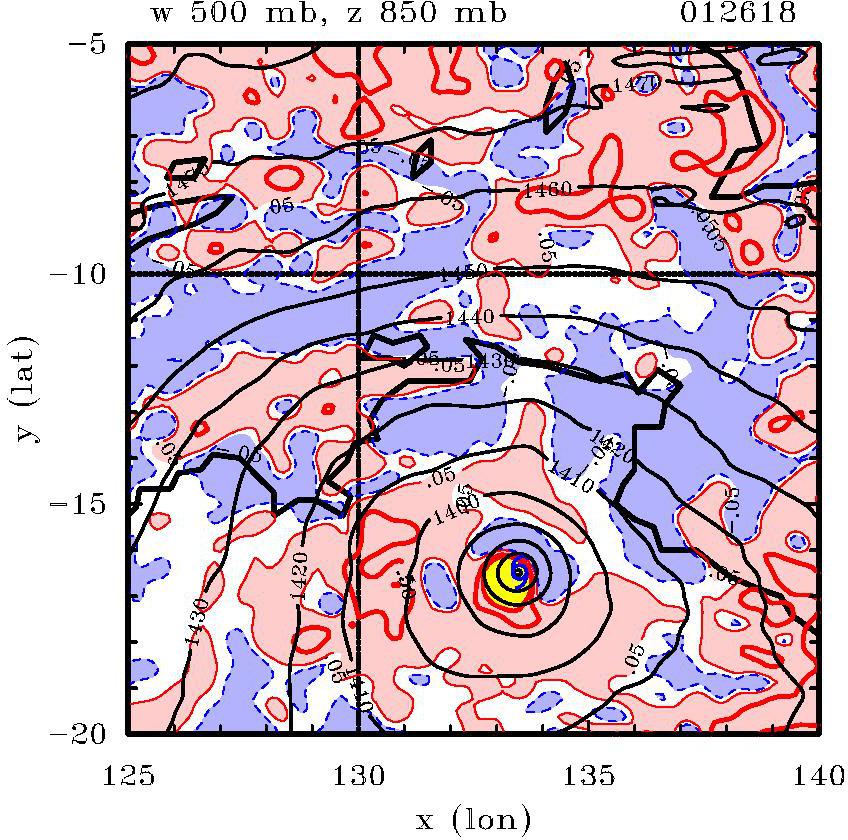
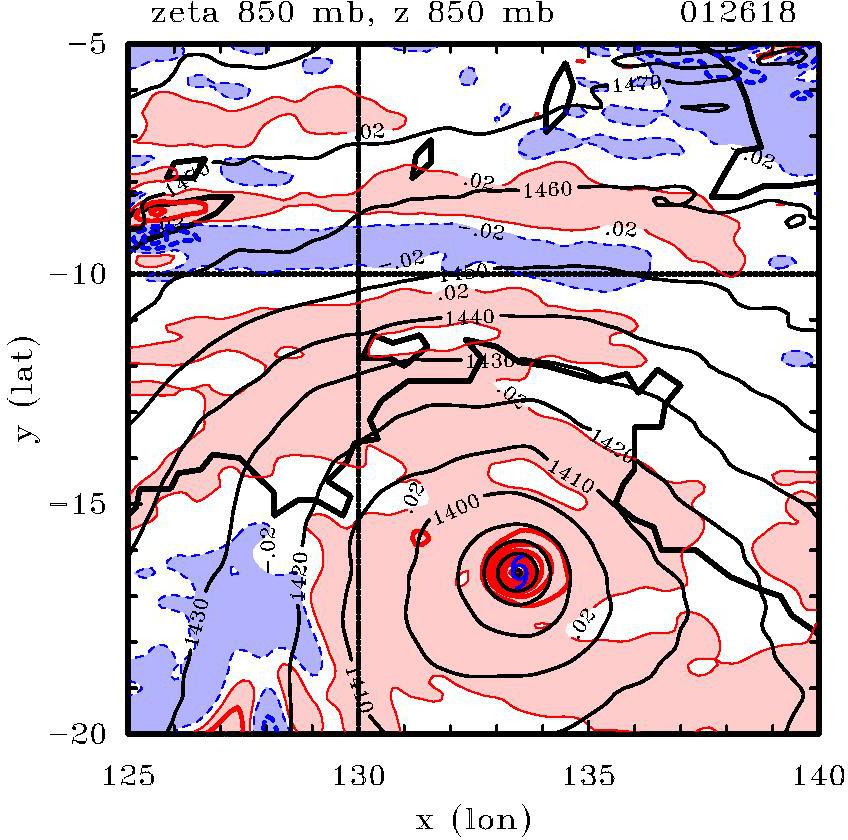
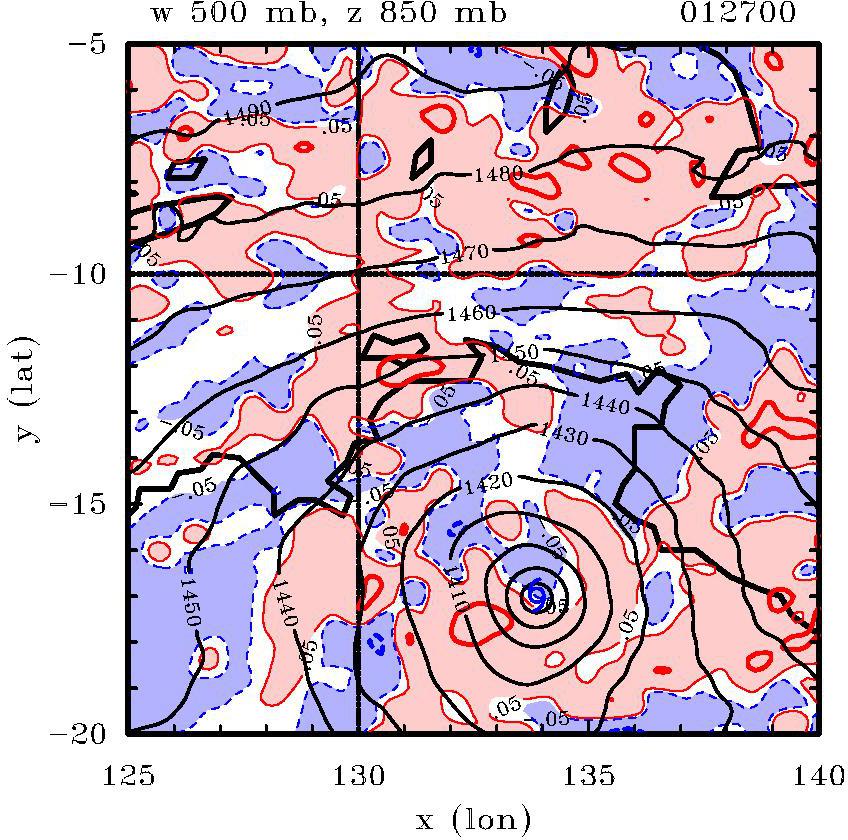
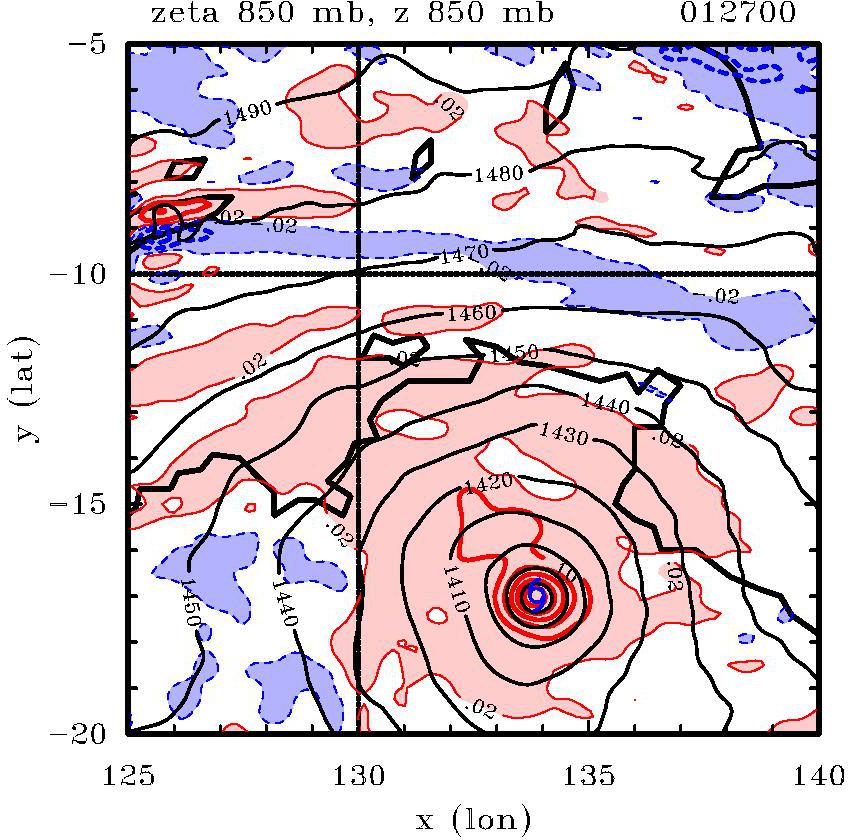
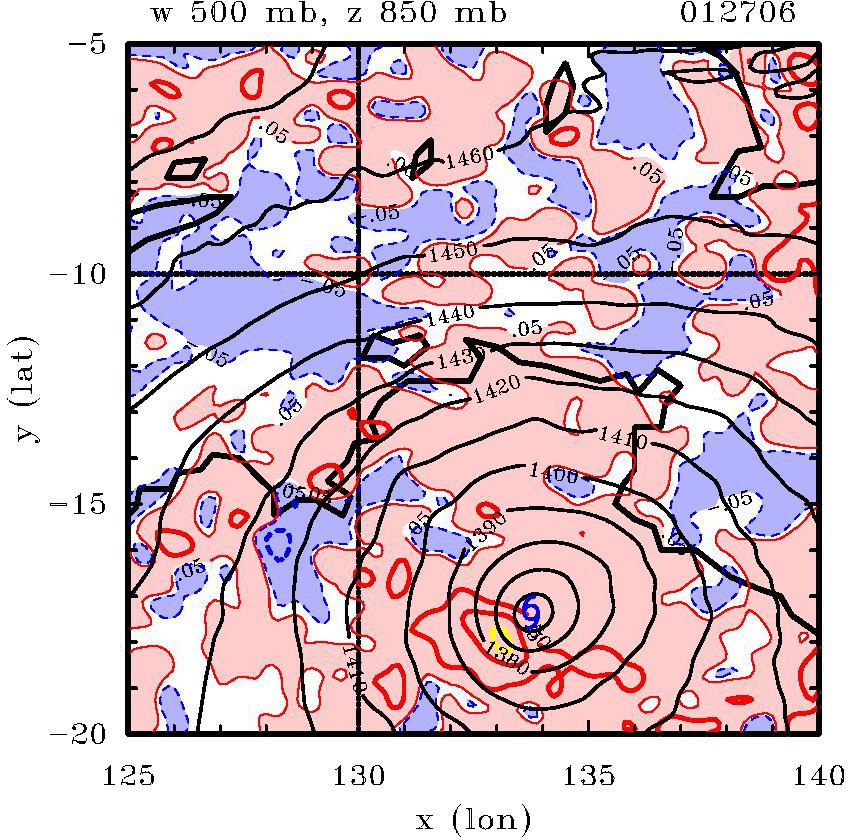
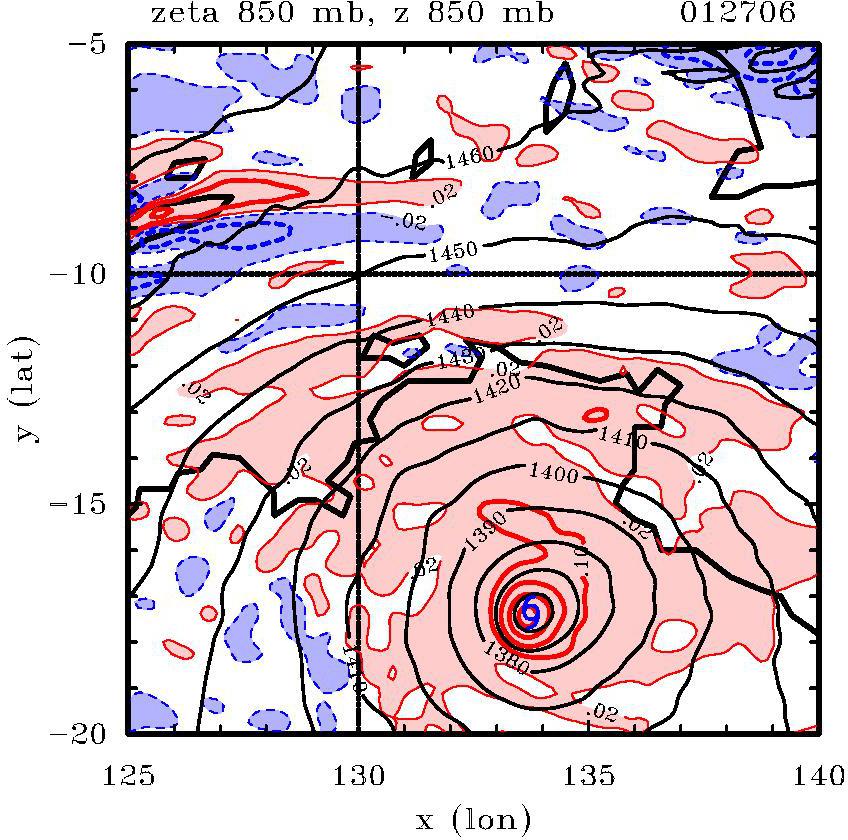
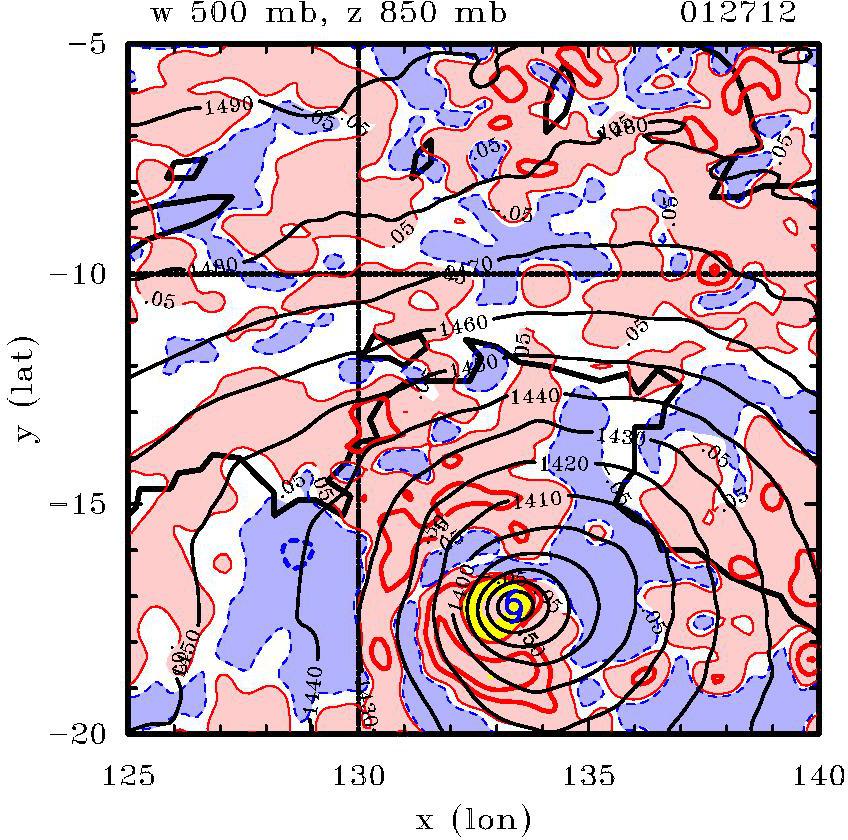
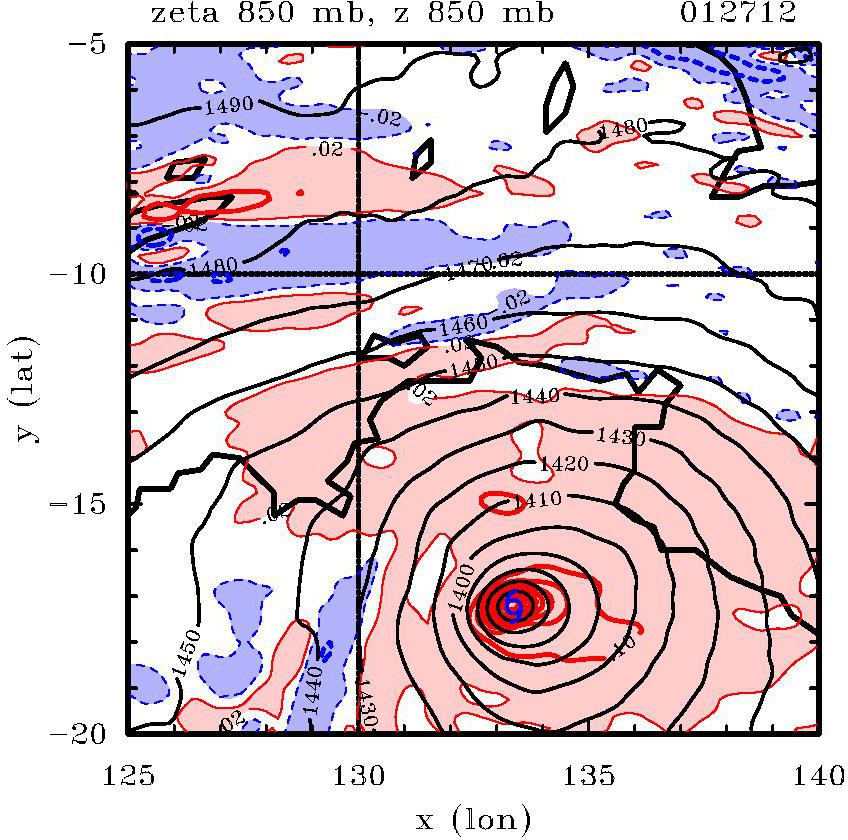
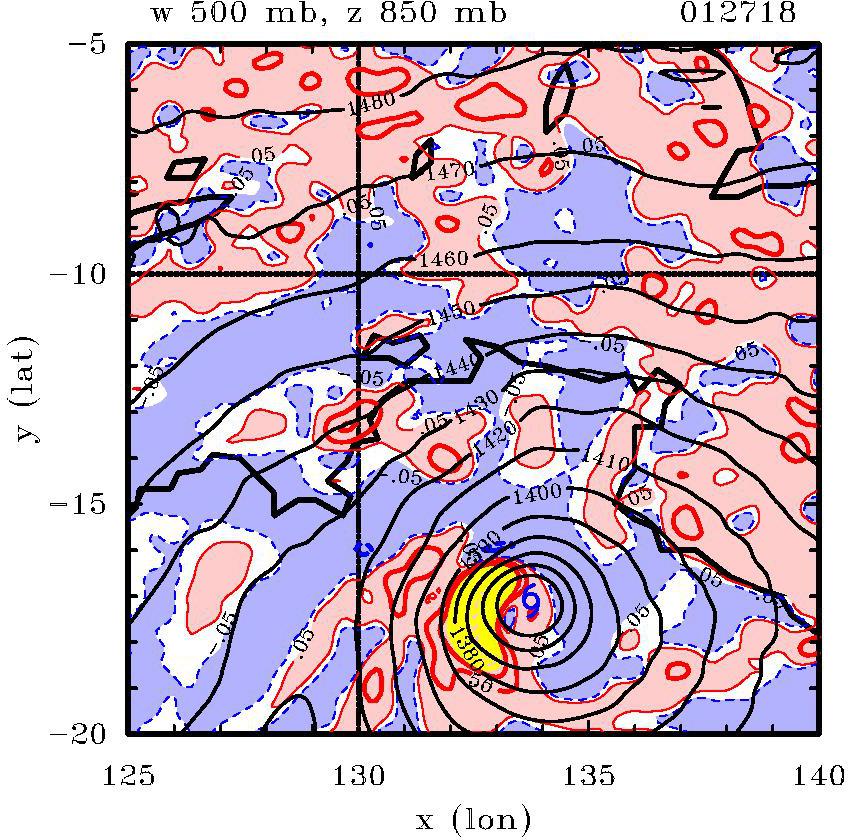
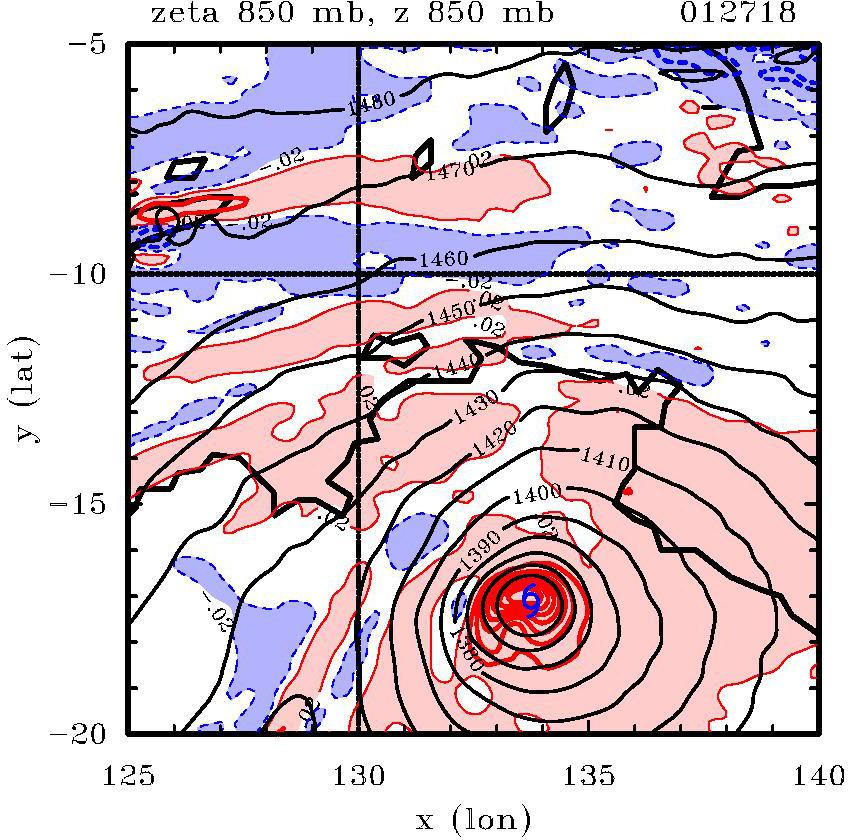
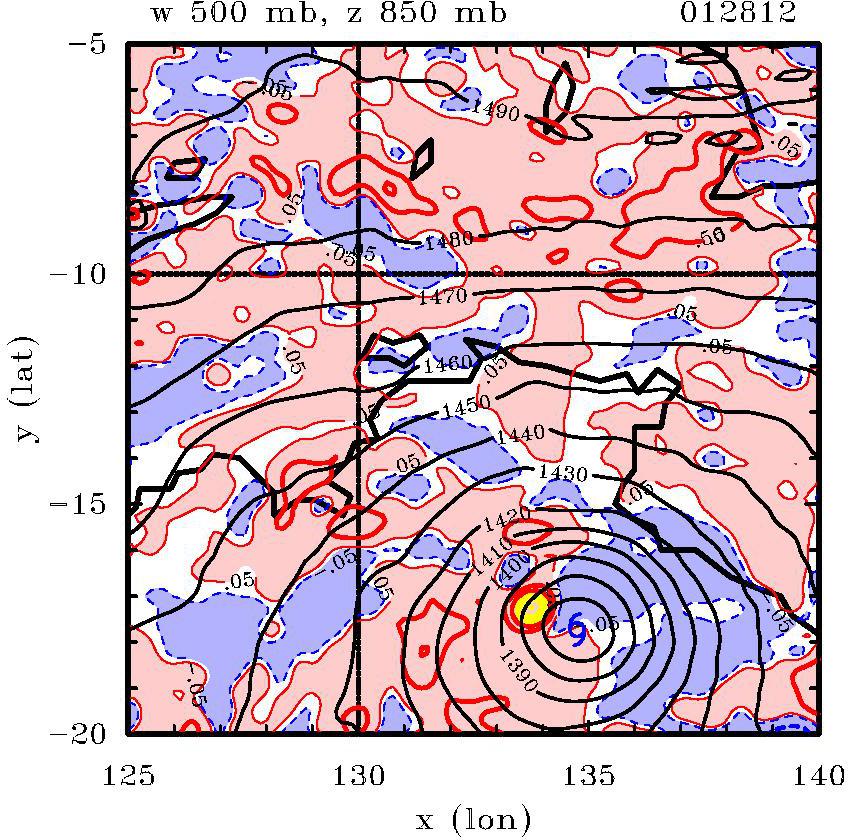
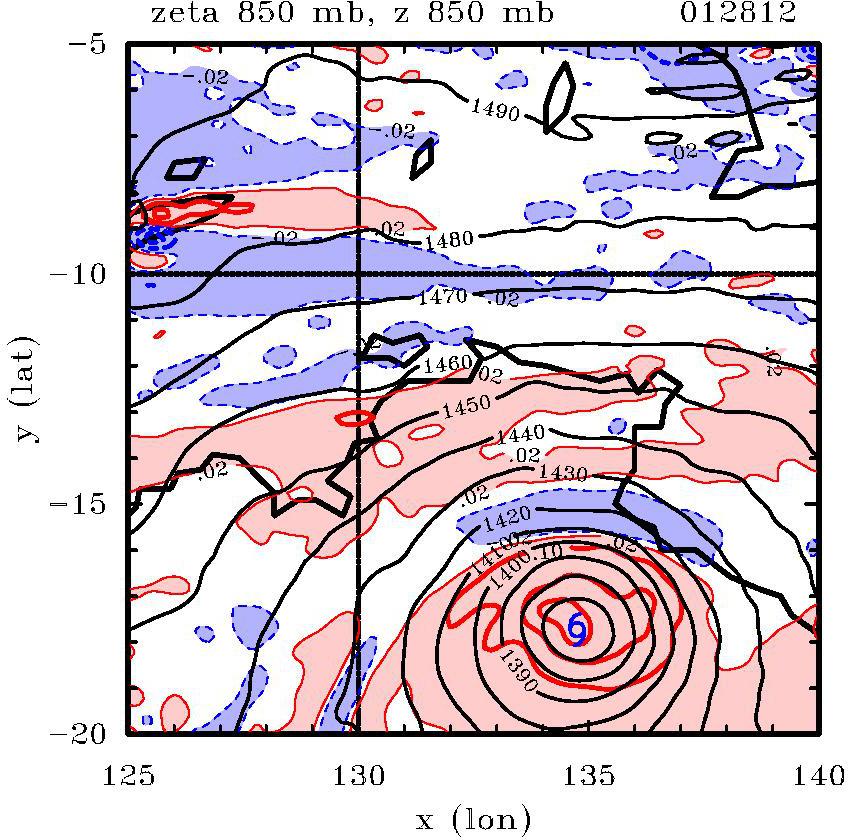
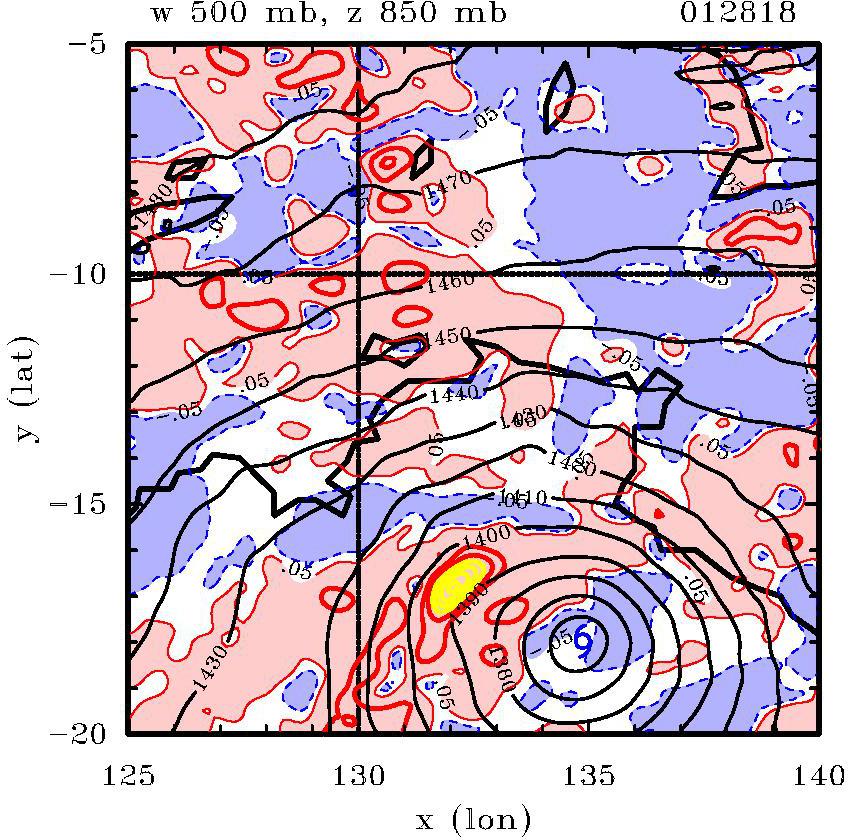
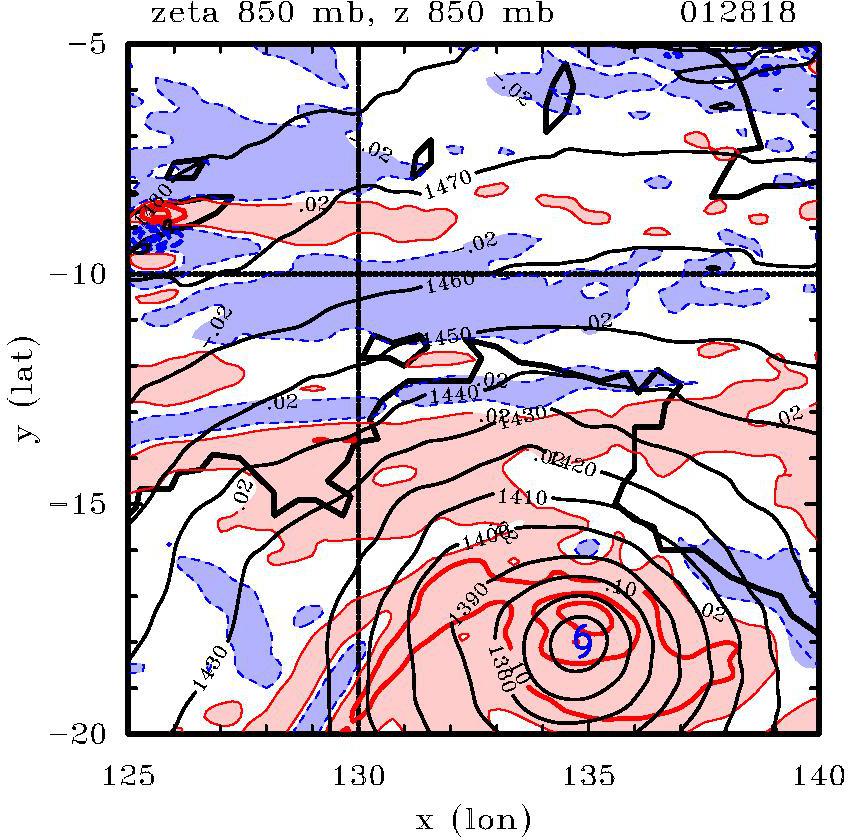
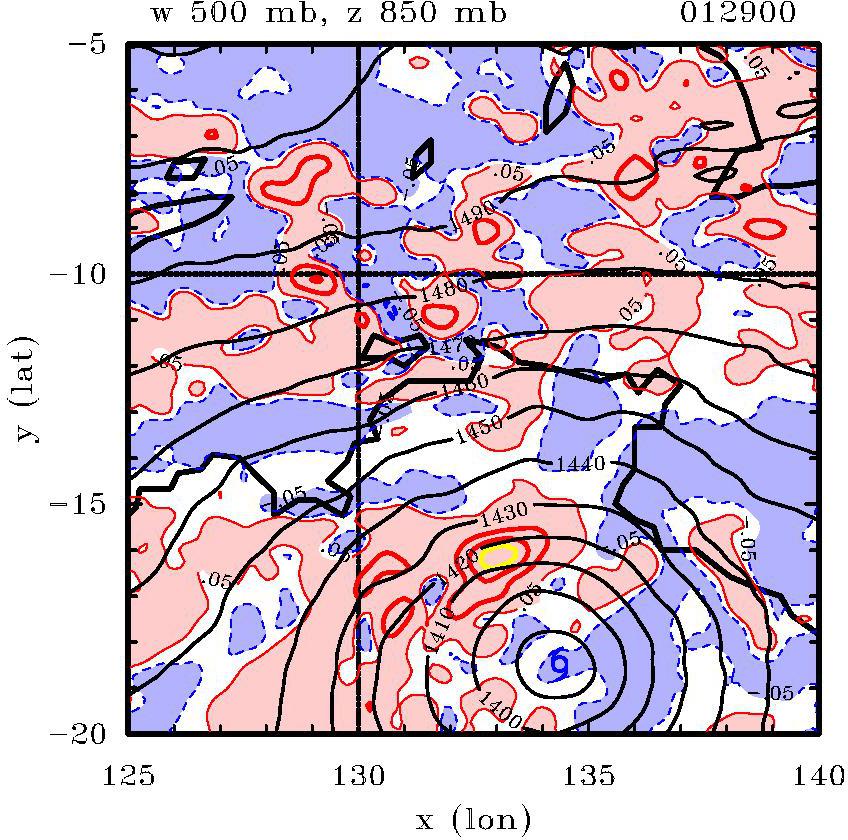
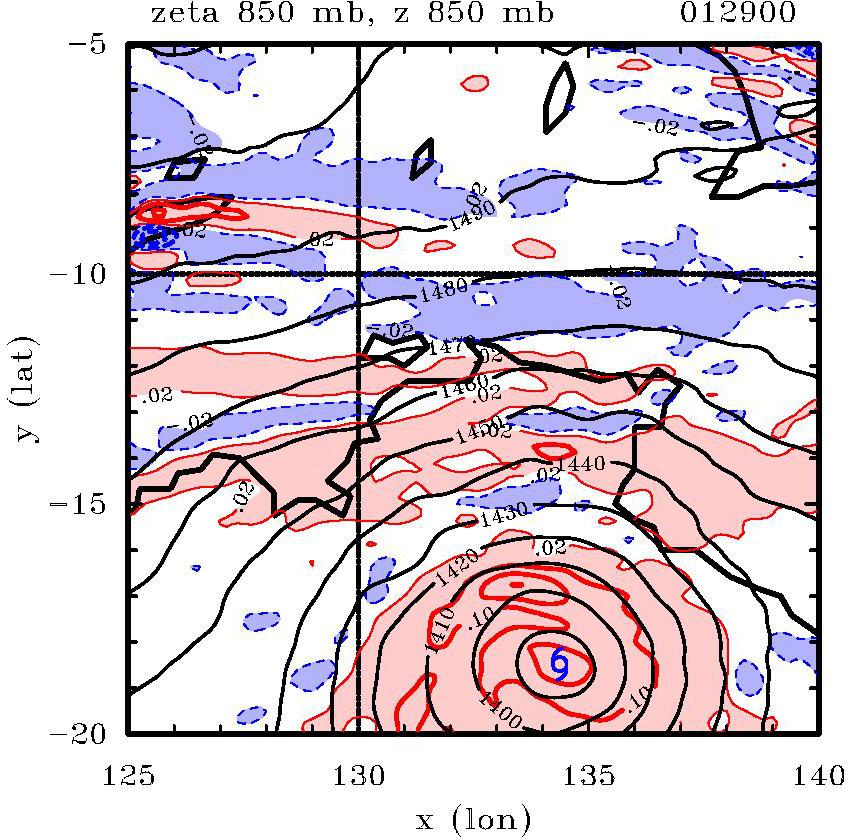
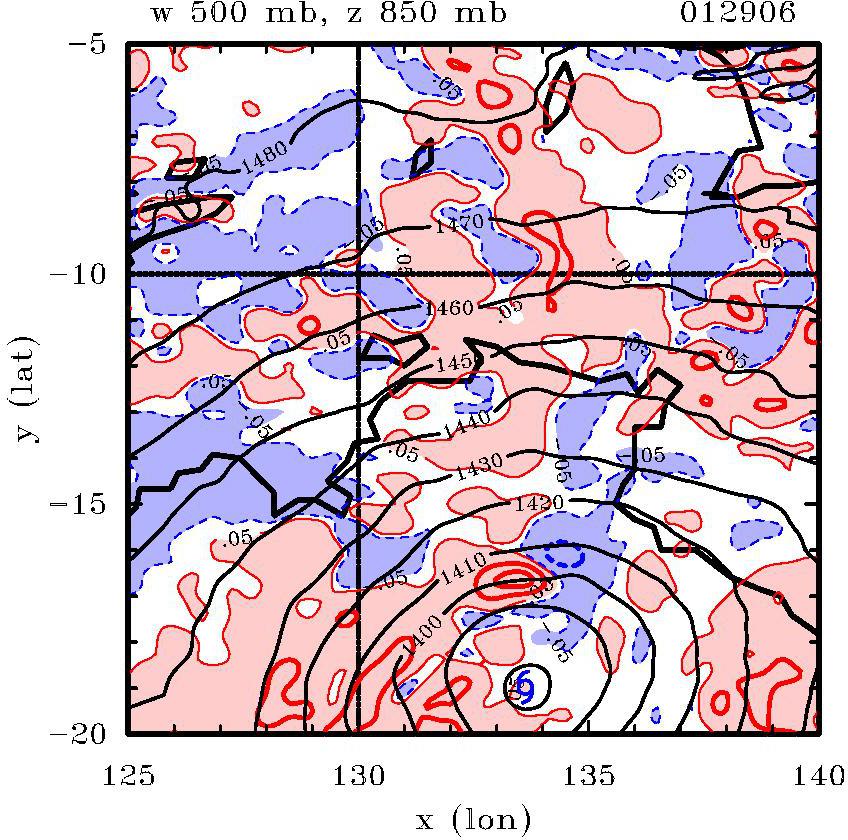
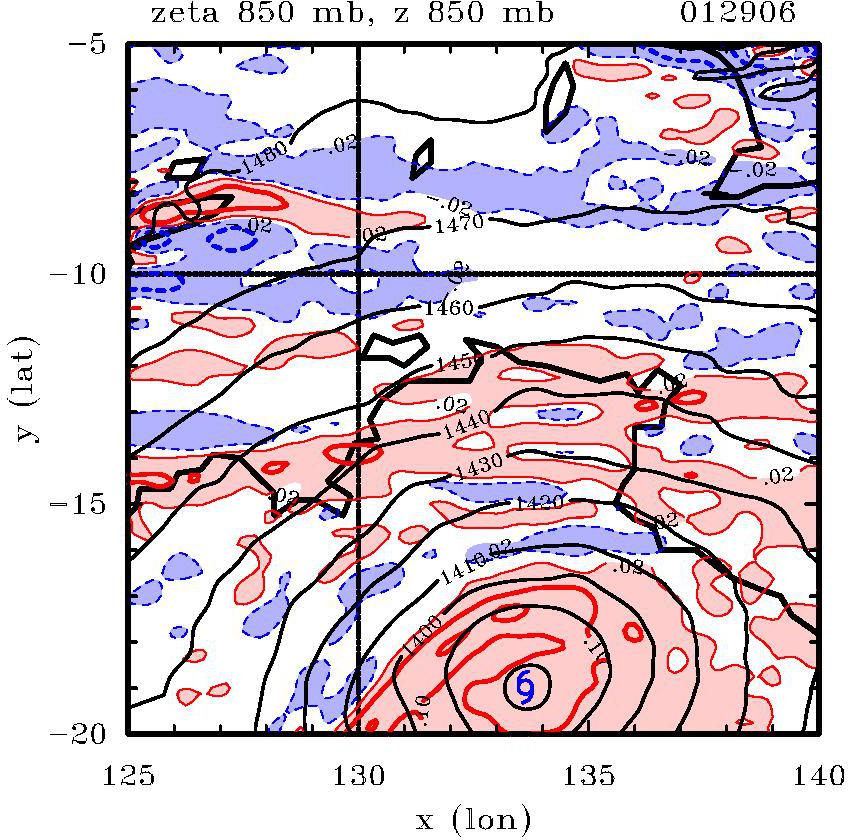
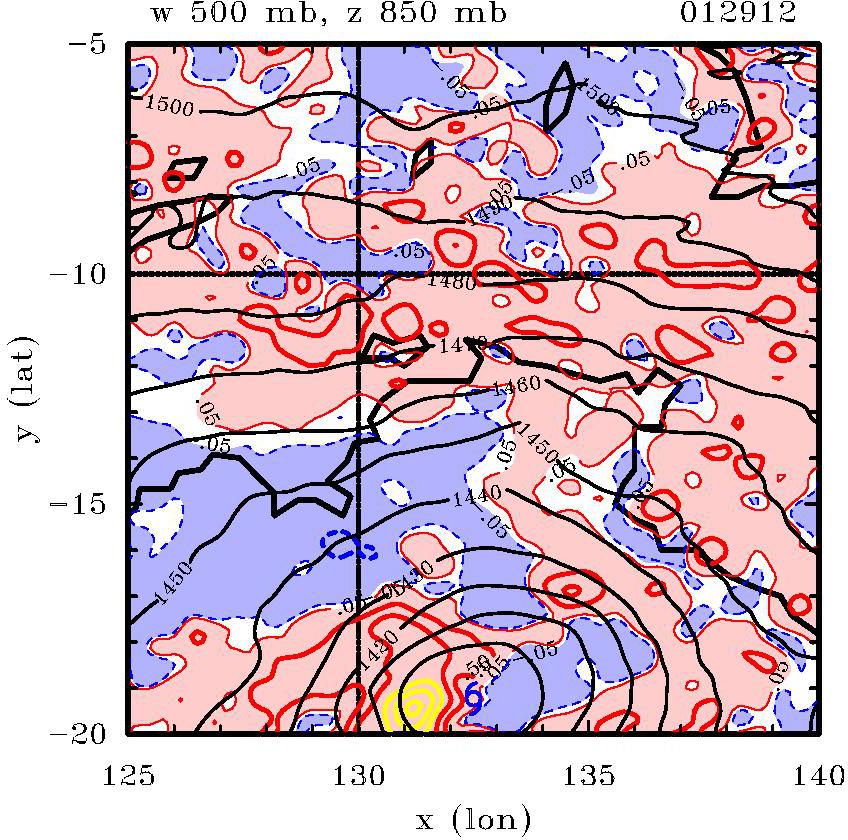
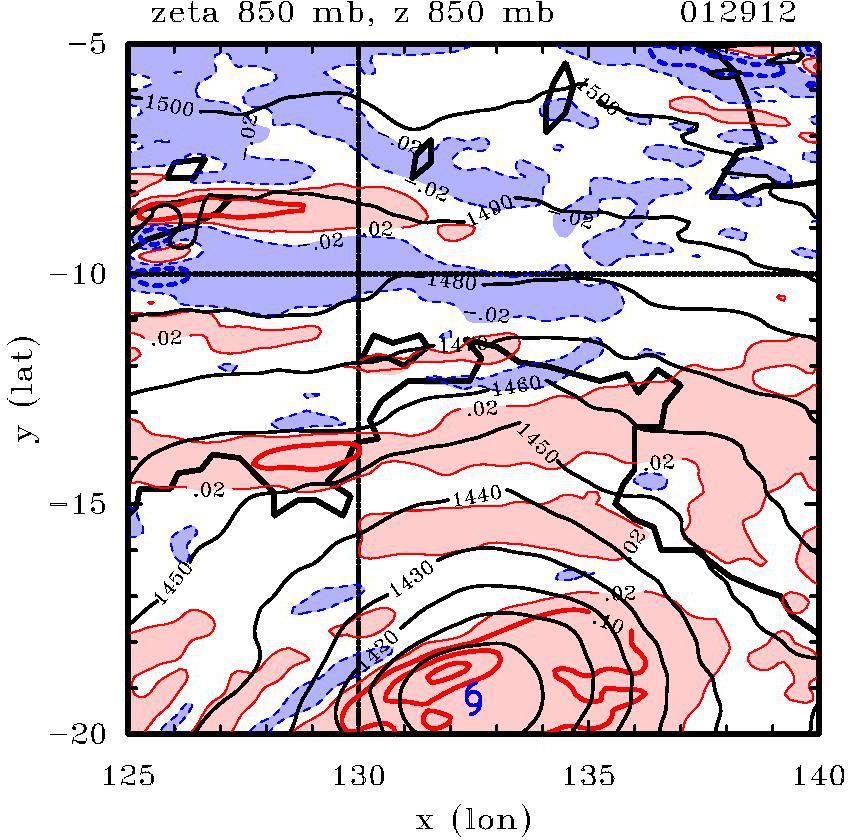
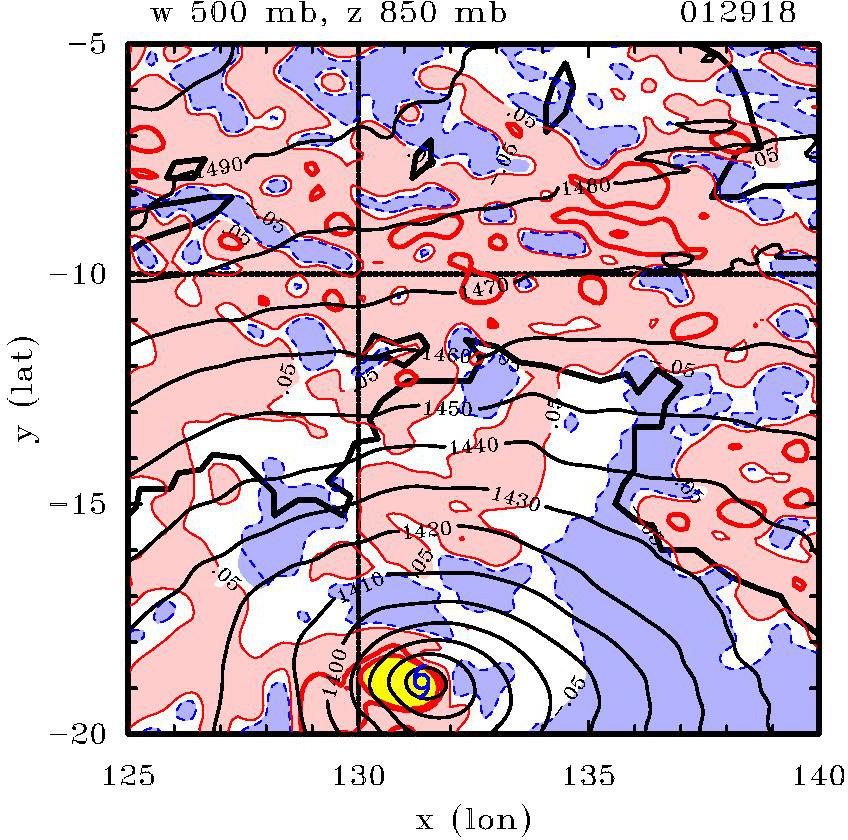
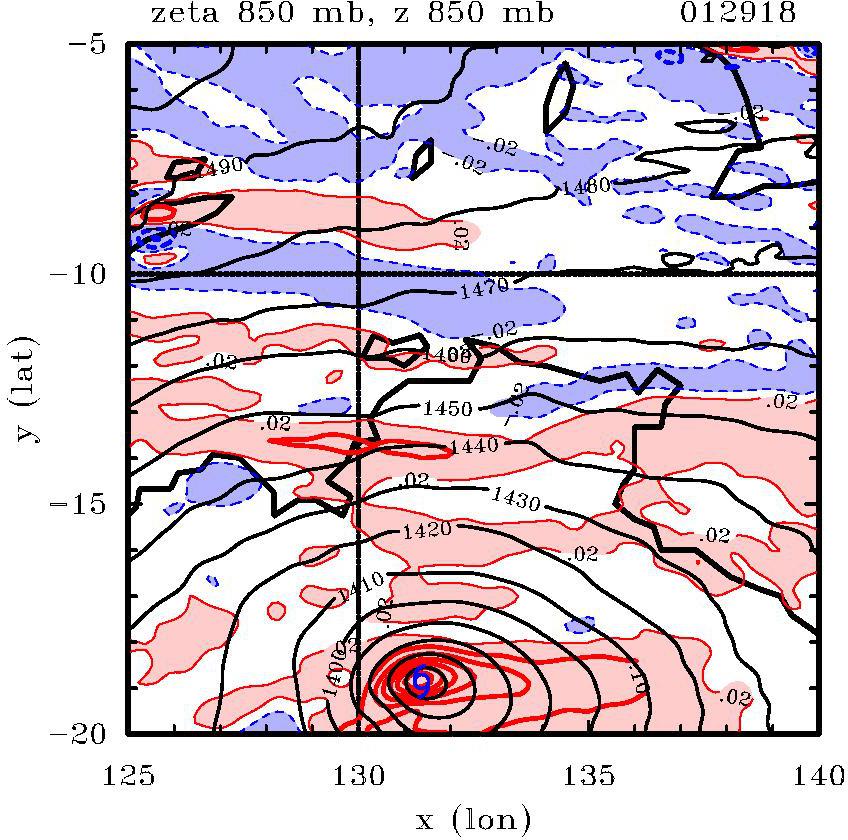
Vertical velocity, vertical vorticity and geopotential height at 850 mb
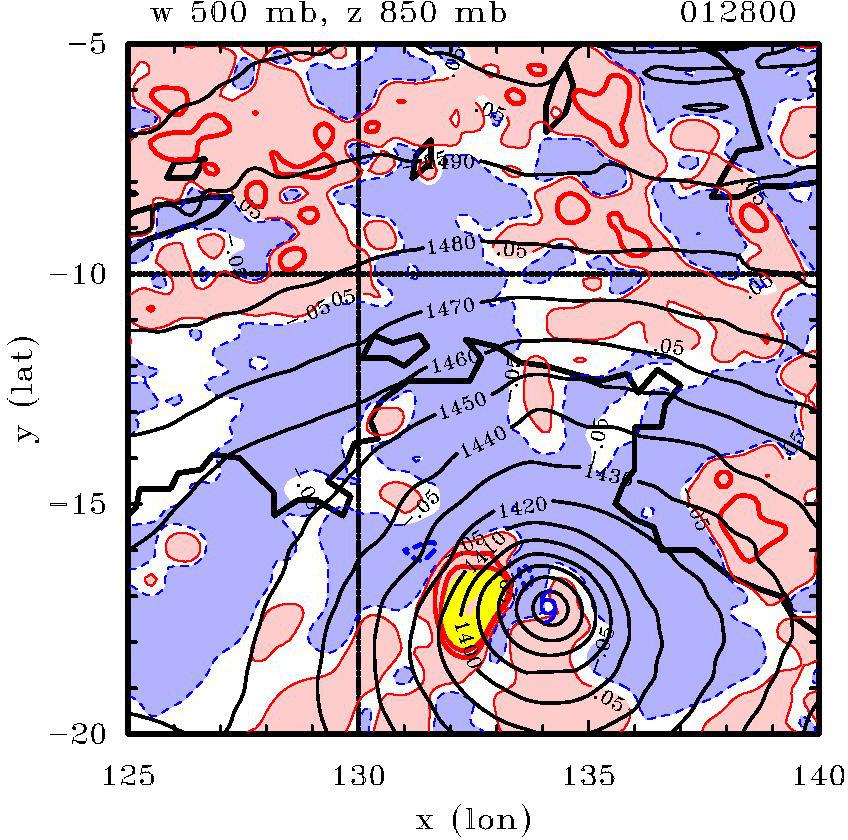
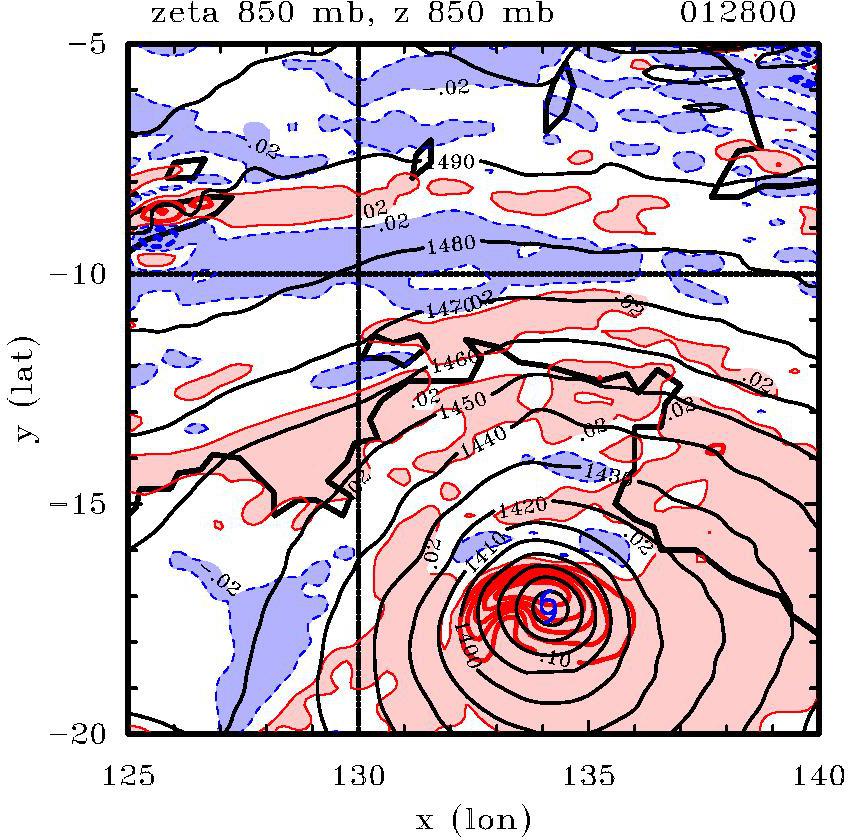
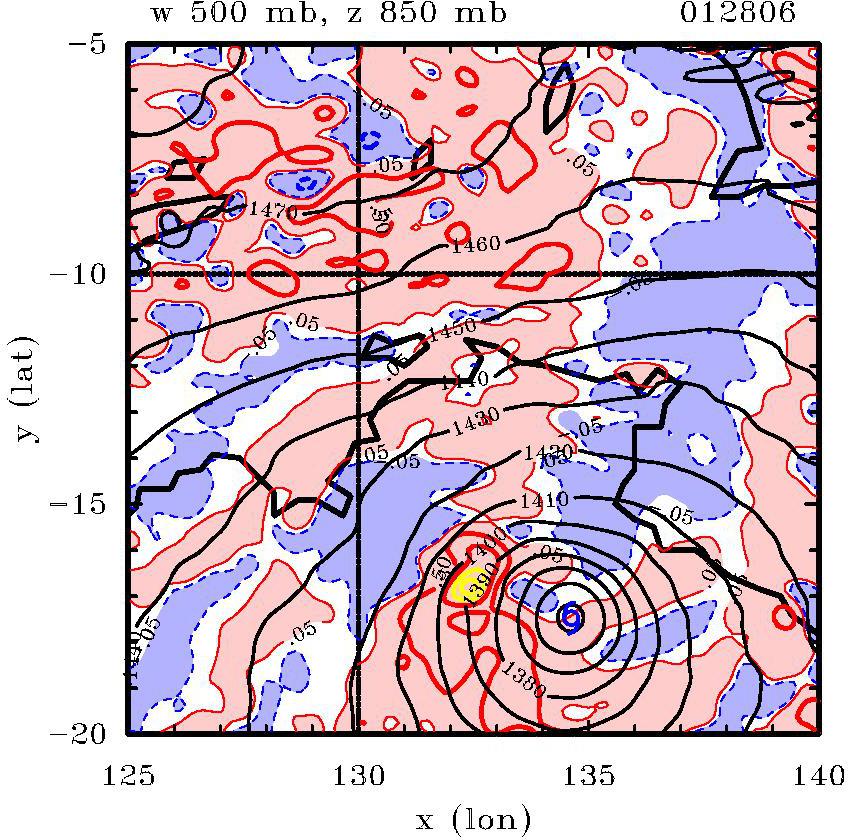
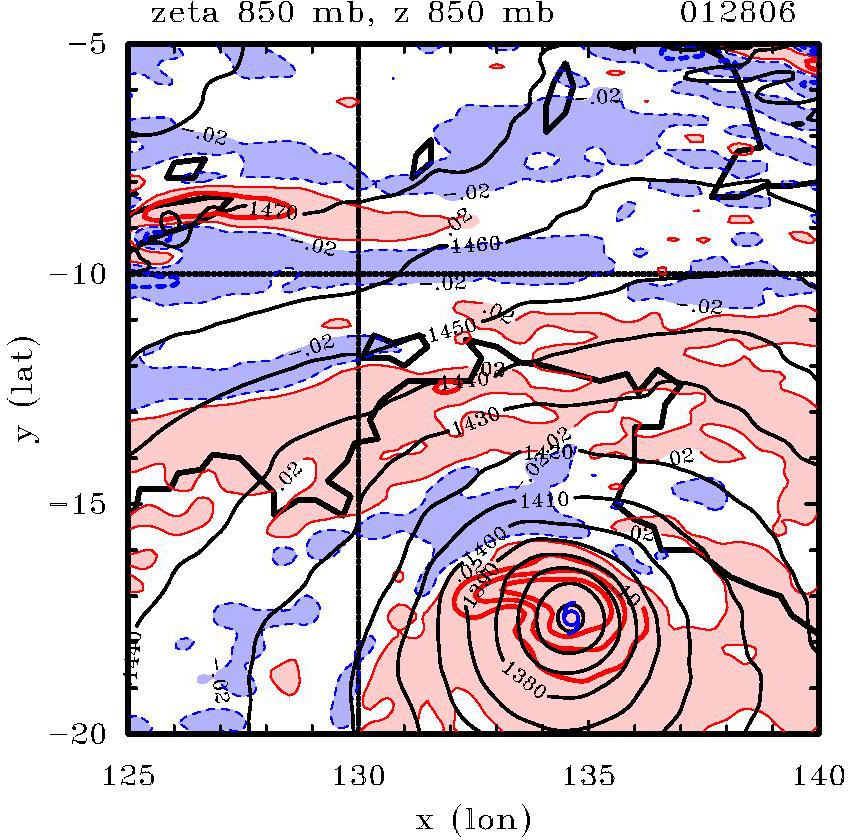
The following plots show contours of vertical velocity (left column) and vertical vorticity (right column) during the genesis and mature stage of the disturbances. In each plot, the contours of geopotential are shown, as is the location of the minimum geopotential (denoted by the cyclone symbol). Contour levels for vertical velocity are: thick red contours 0.5 and 1.0 m s-1; thick yellow contours 1.5 - 5.0 m s-1 in steps of 0.5 m s-1; thick blue contours -1.0 and -0.5 m s-1; thin countours 5 cm s-1 - 45 cm s-1 in steps of 5 cm s-1. Negative contours blue/dashed. Regions of ascent > 5 cm s-1 are shaded pink; regions of subsidence < -5 cm s-1 shaded light blue. Contour levels for vertical vorticity are: thick contours 10-4 s-1 s-1; thin contours 2*10-5 s-1; Negative contours blue/dashed. Regions of cyclonic > 2*10-5 s-1 are shaded pink; regions of anticyclonic vorticity < -2*10-5 s-1 shaded light blue.
22 Jan 00Z | 22 Jan 00Z |
|---|---|
 |  |
22 Jan 06Z | 22 Jan 06Z |
 |  |
22 Jan 12Z | 22 Jan 12Z |
 |  |
22 Jan 18Z | 22 Jan 18Z |
 |  |
23 Jan 00Z | 23 Jan 00Z |
 |  |
23 Jan 06Z | 23 Jan 06Z |
 |  |
23 Jan 12Z | 23 Jan 12Z |
 |  |
23 Jan 18Z | 23 Jan 18Z |
 |  |
24 Jan 00Z | 24 Jan 00Z |
 |  |
24 Jan 06Z | 24 Jan 06Z |
 |  |
24 Jan 12Z | 24 Jan 12Z |
 |  |
24 Jan 18Z | 24 Jan 18Z |
 |  |
25 Jan 00Z | 25 Jan 00Z |
 |  |
25 Jan 06Z | 25 Jan 06Z |
 |  |
25 Jan 12Z | 25 Jan 12Z |
 |  |
25 Jan 18Z | 25 Jan 18Z |
 |  |
26 Jan 00Z | 26 Jan 00Z |
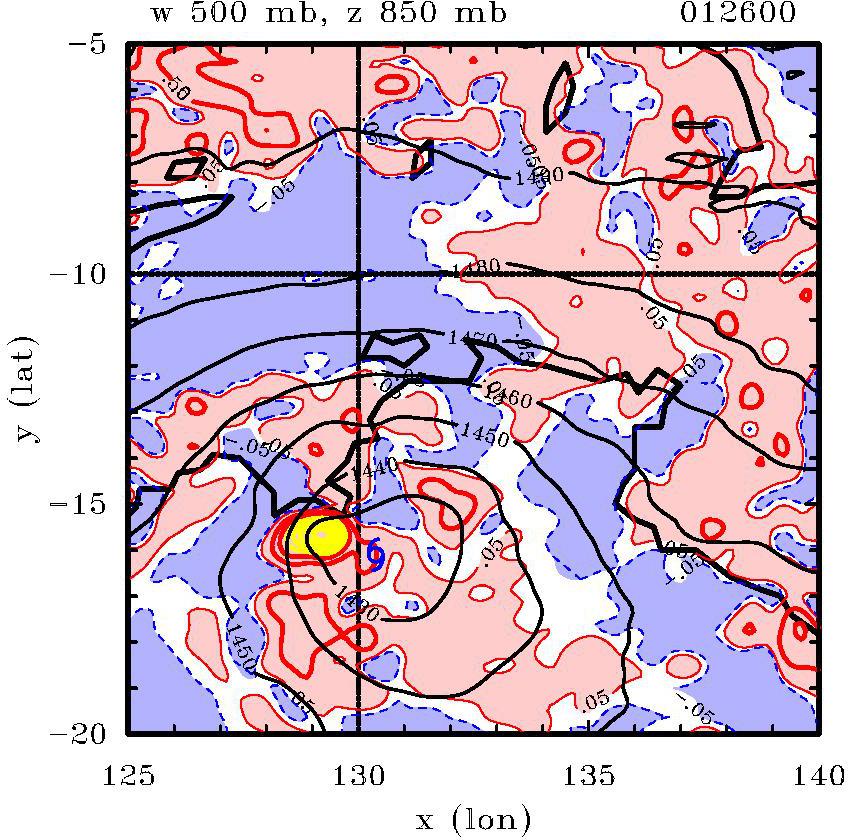 | 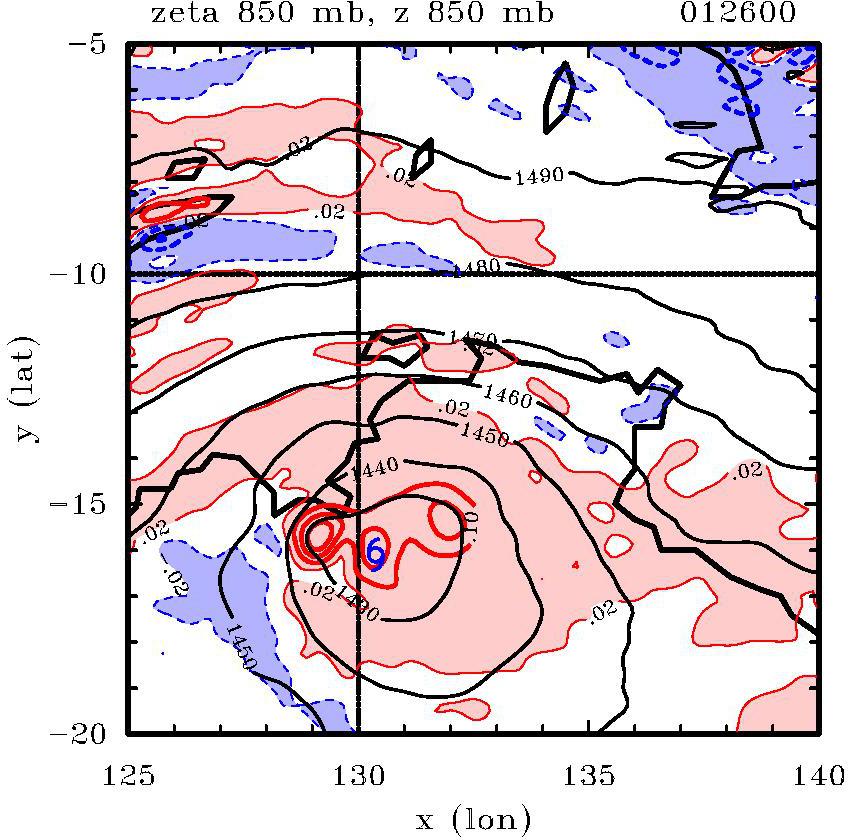 |
26 Jan 06Z | 26 Jan 06Z |
 |  |
26 Jan 12Z | 26 Jan 12Z |
 |  |
26 Jan 18Z | 26 Jan 18Z |
 |  |
27 Jan 00Z | 27 Jan 00Z |
 |  |
27 Jan 06Z | 27 Jan 06Z |
 |  |
27 Jan 12Z | 27 Jan 12Z |
 |  |
27 Jan 18Z | 27 Jan 18Z |
 |  |
28 Jan 00Z | 28 Jan 00Z |
 |  |
28 Jan 06Z | 28 Jan 06Z |
 |  |
28 Jan 12Z | 28 Jan 12Z |
 |  |
28 Jan 18Z | 28 Jan 18Z |
 |  |
29 Jan 00Z | 29 Jan 00Z |
 |  |
29 Jan 06Z | 29 Jan 06Z |
 |  |
29 Jan 12Z | 29 Jan 12Z |
 |  |
29 Jan 18Z | 29 Jan 18Z |
 |  |
30 Jan 00Z | 30 Jan 00Z |
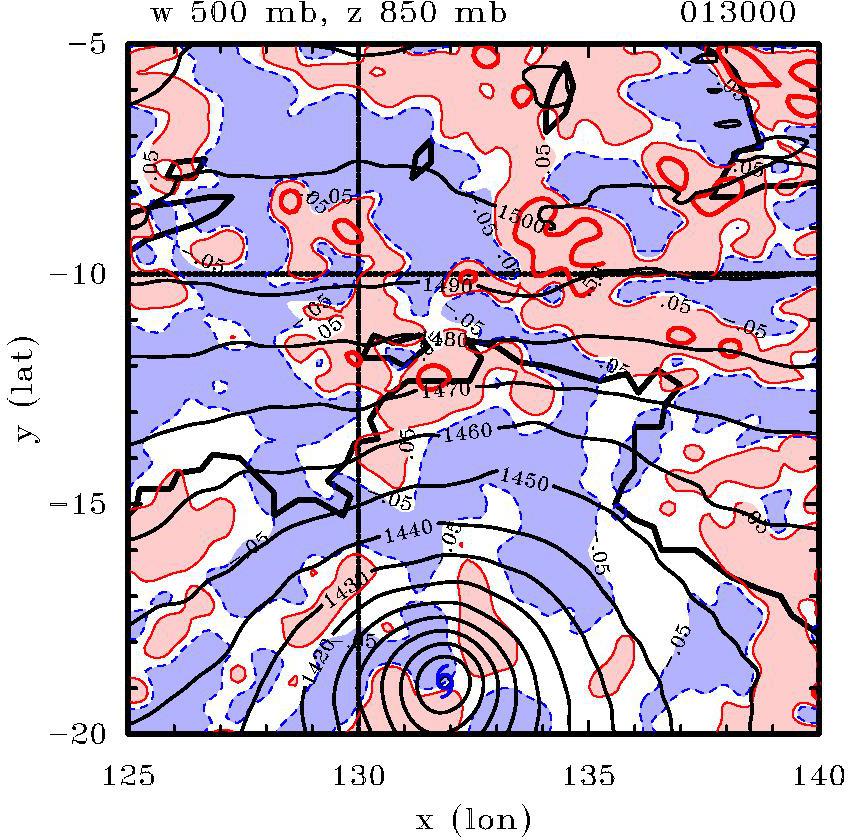 | 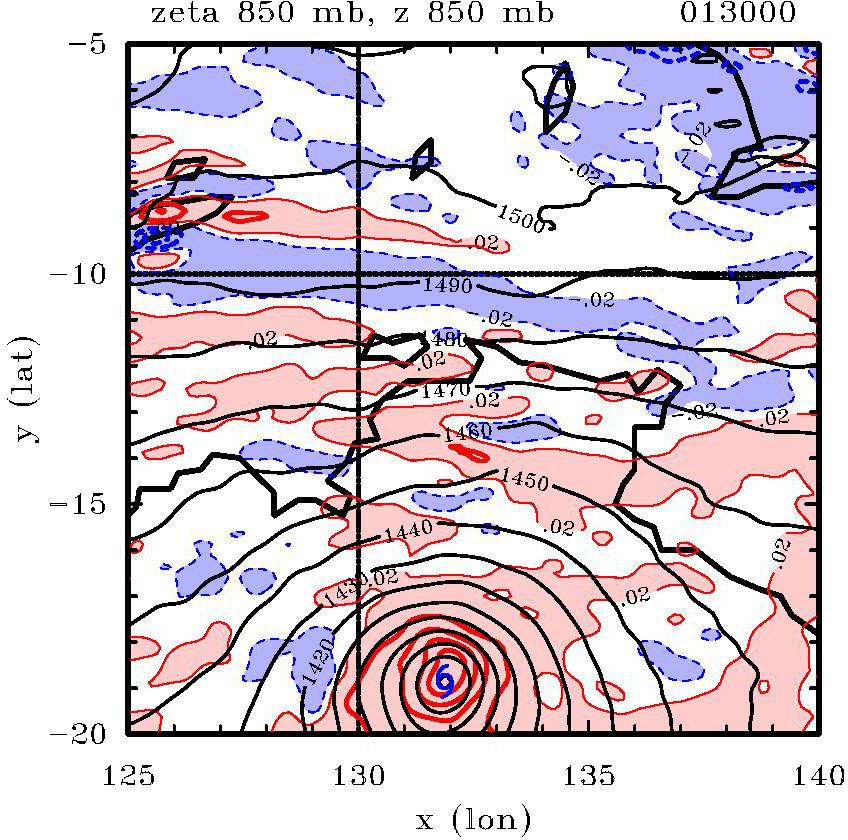 |
30 Jan 06Z | 30 Jan 06Z |
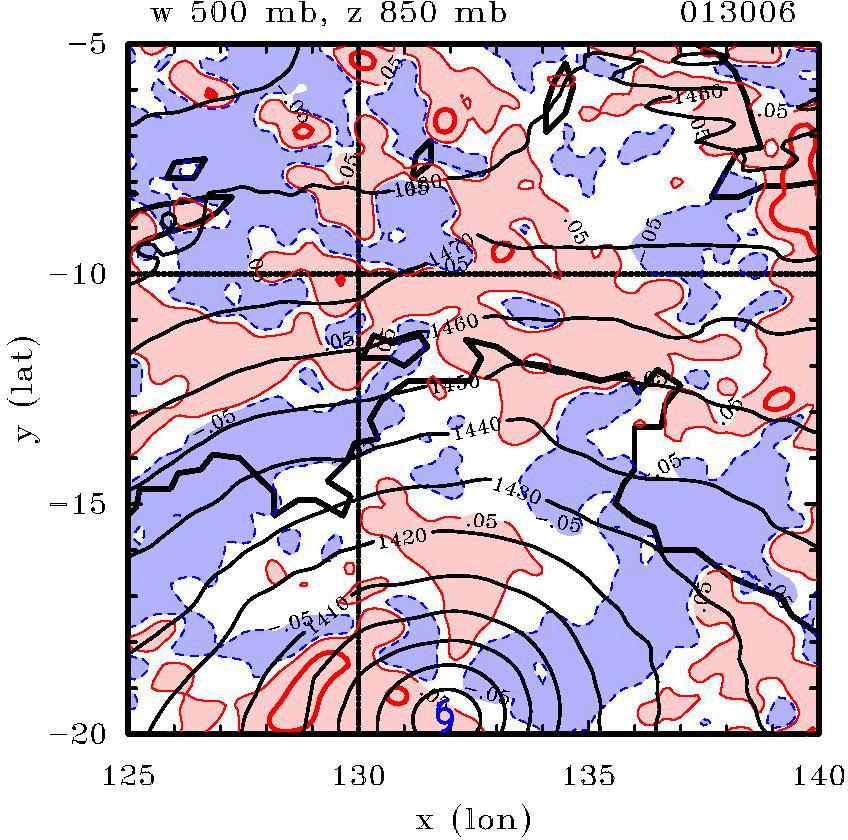 | 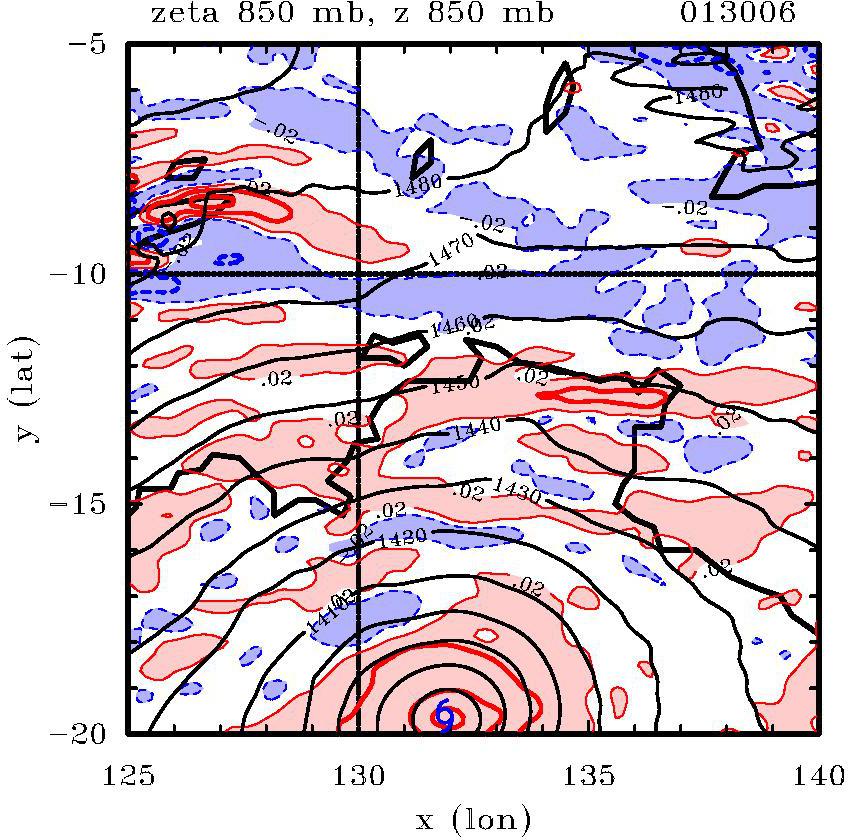 |
Copyright © Roger Smith