Tropical Storm Gaston Sep 2010
Track of Gaston
 To be inserted To be inserted |
Notation is: L = low, D = depression, S = tropical storm, the cyclone symbol denotes a hurricane. |
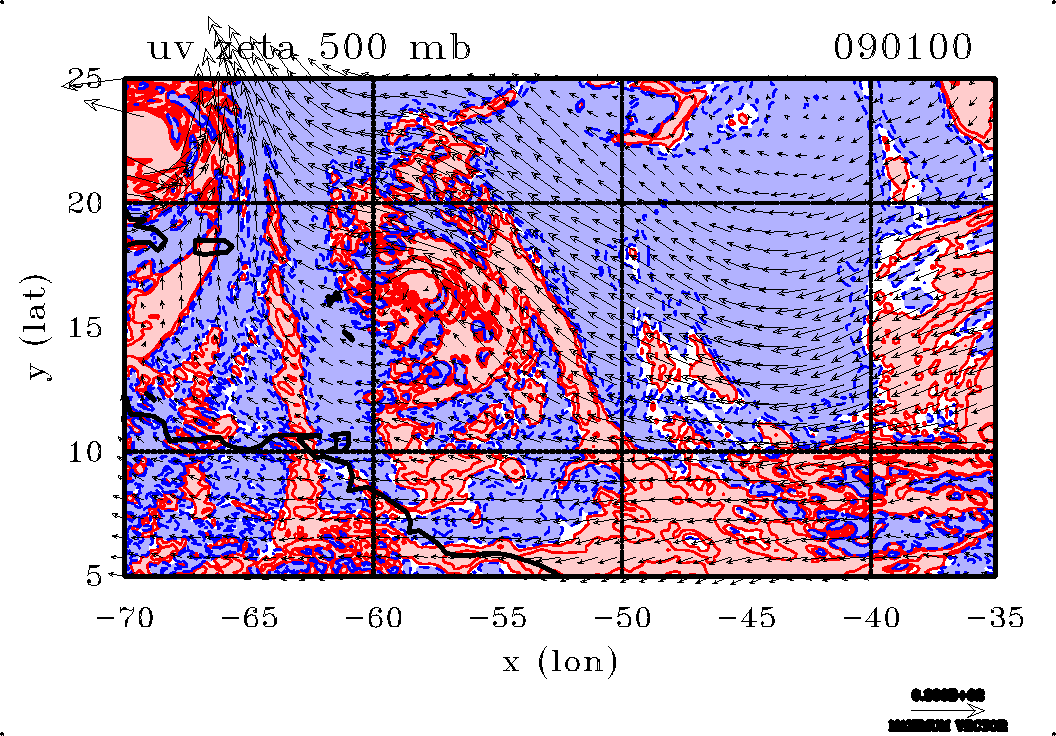
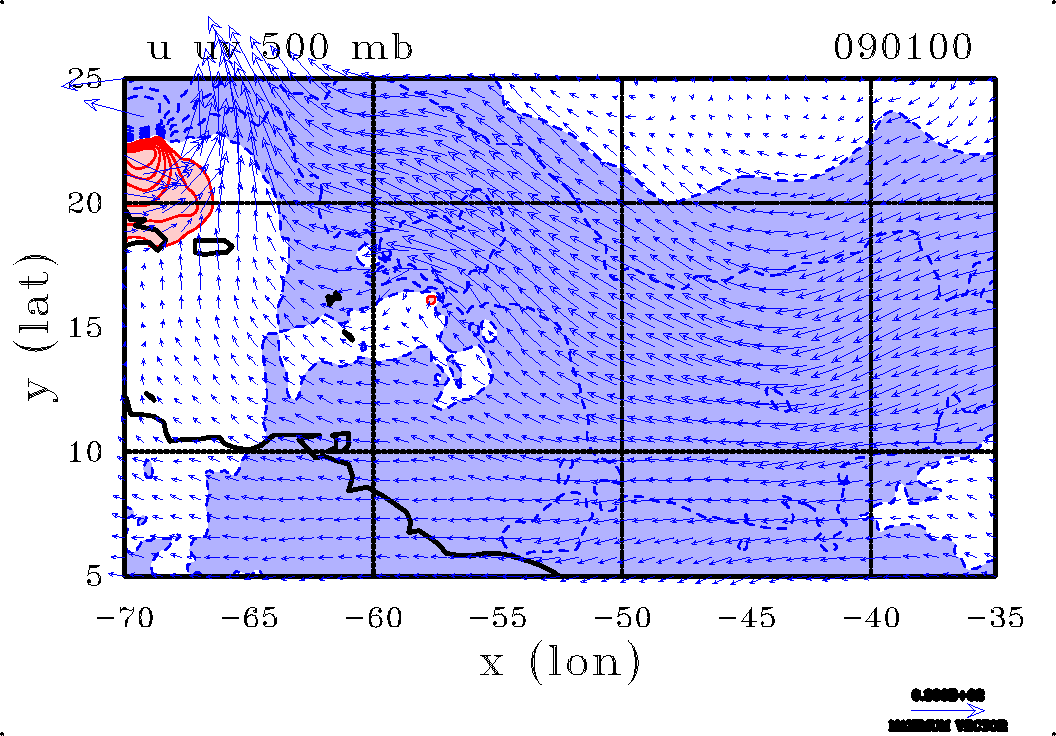
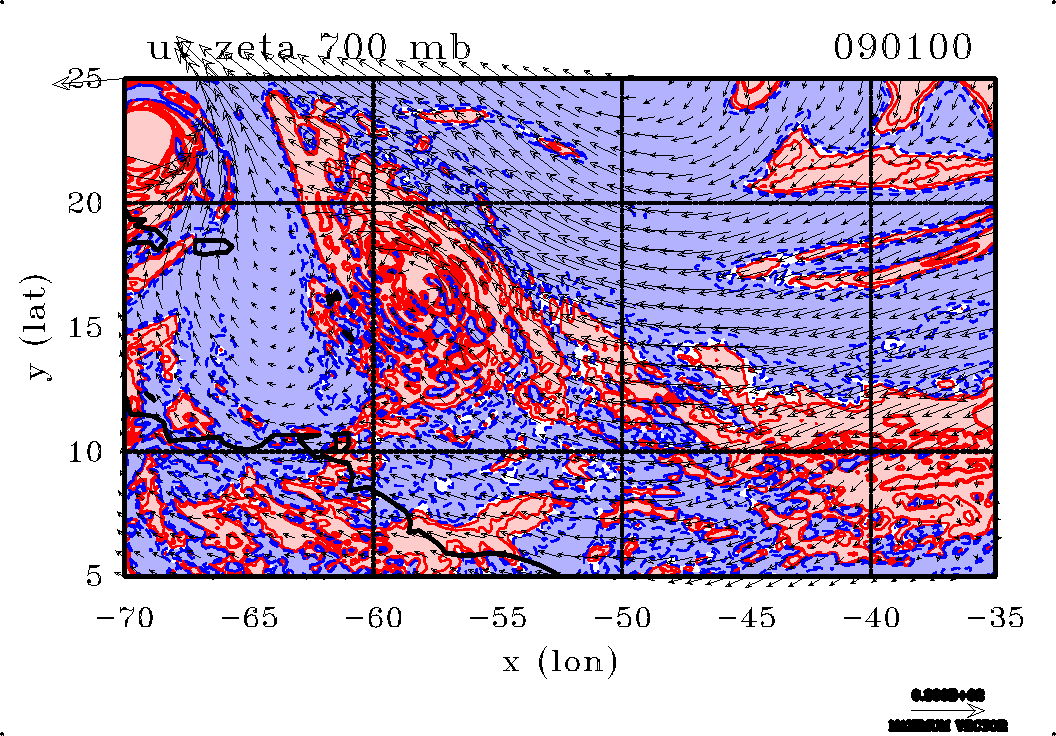
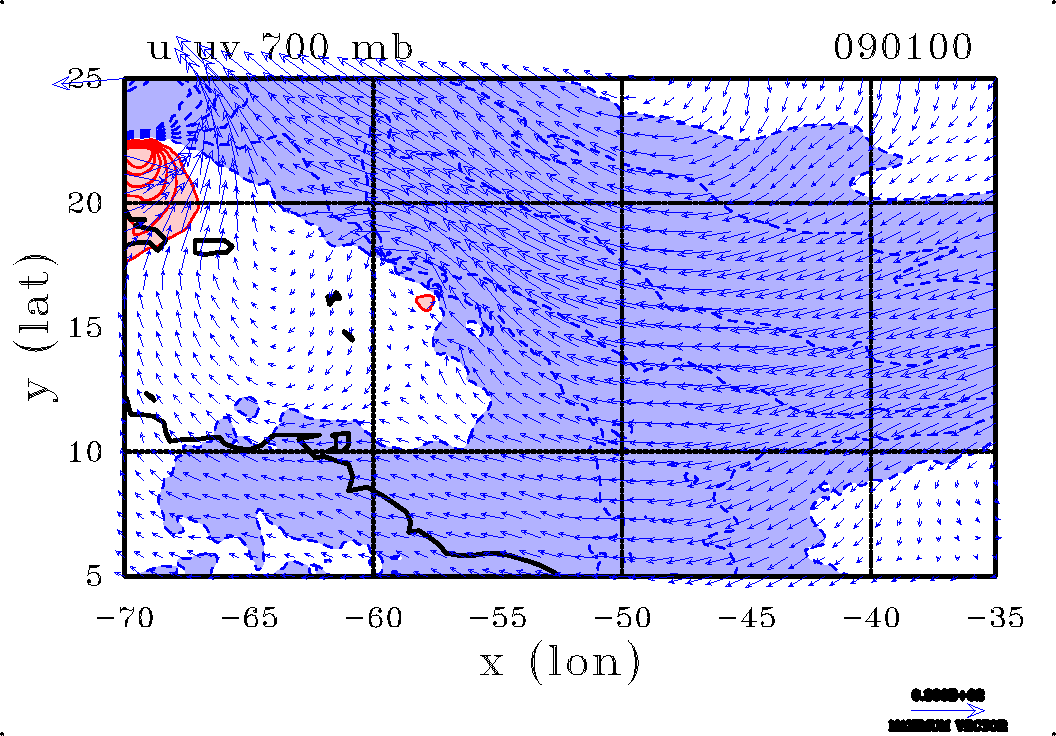
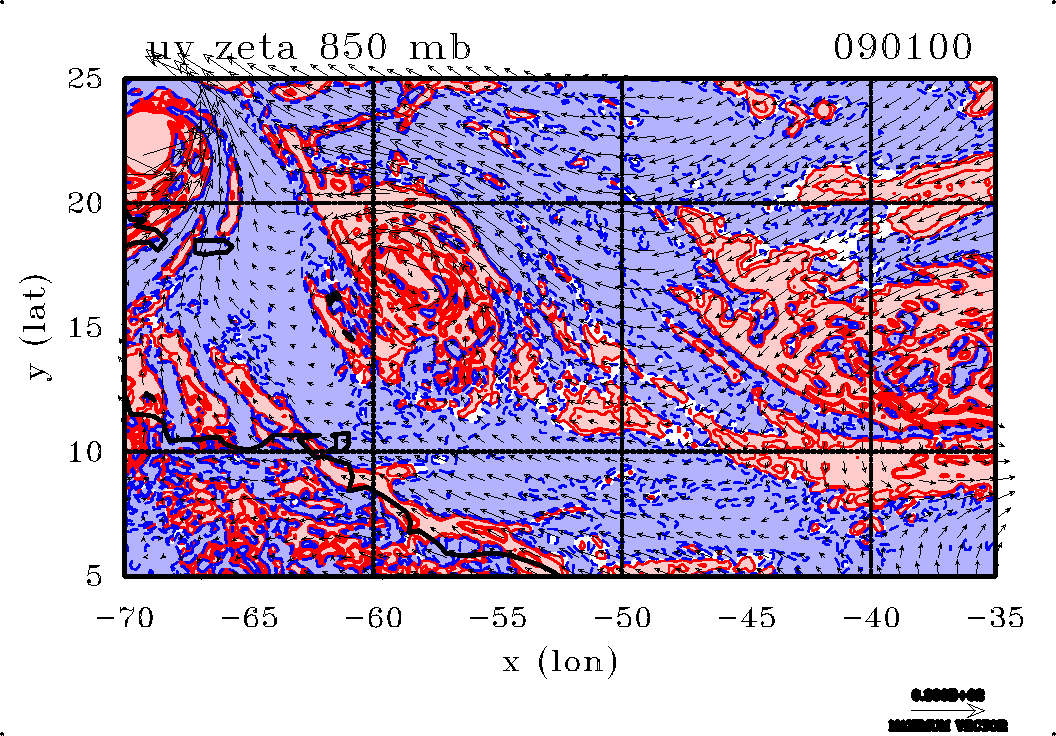
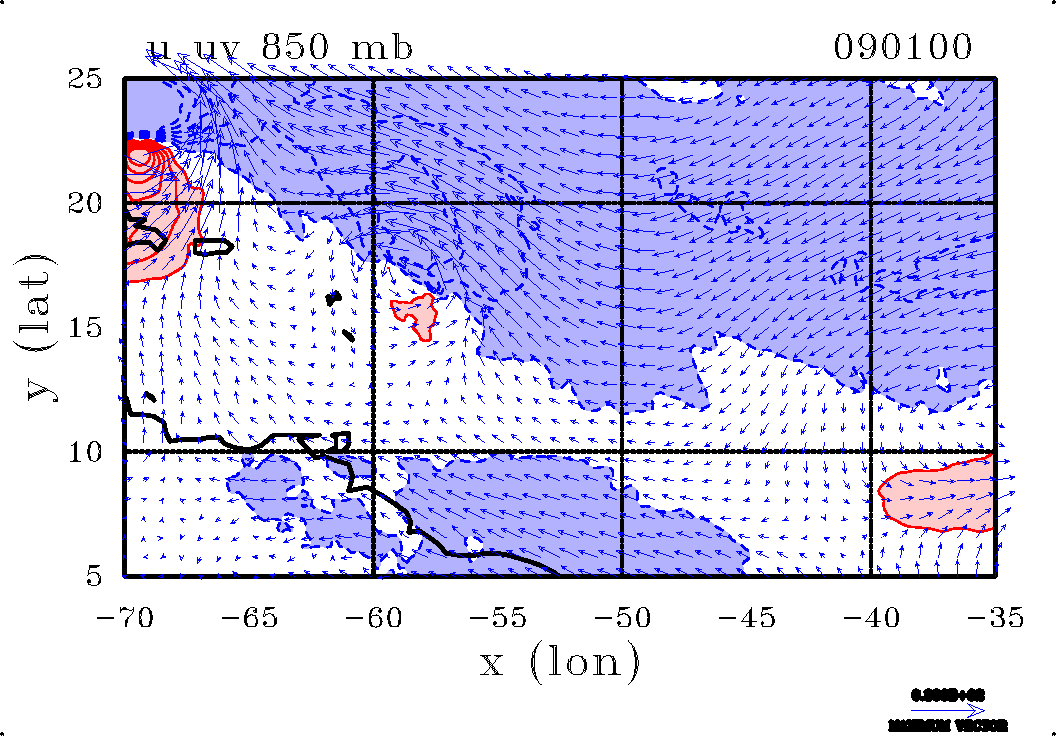
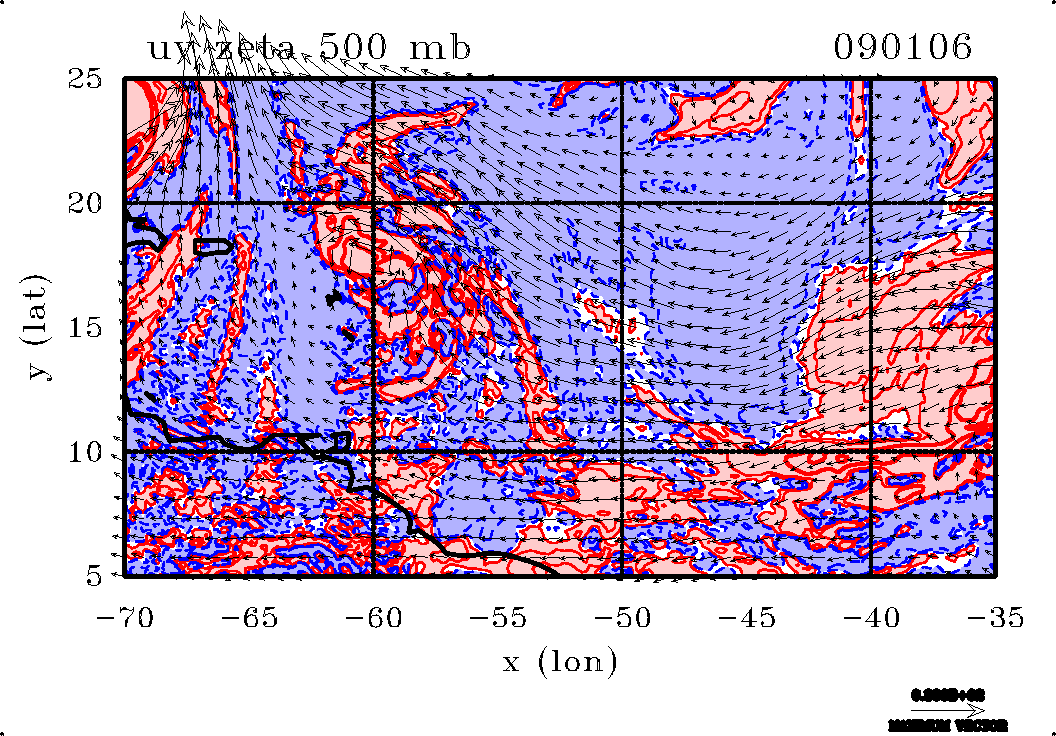
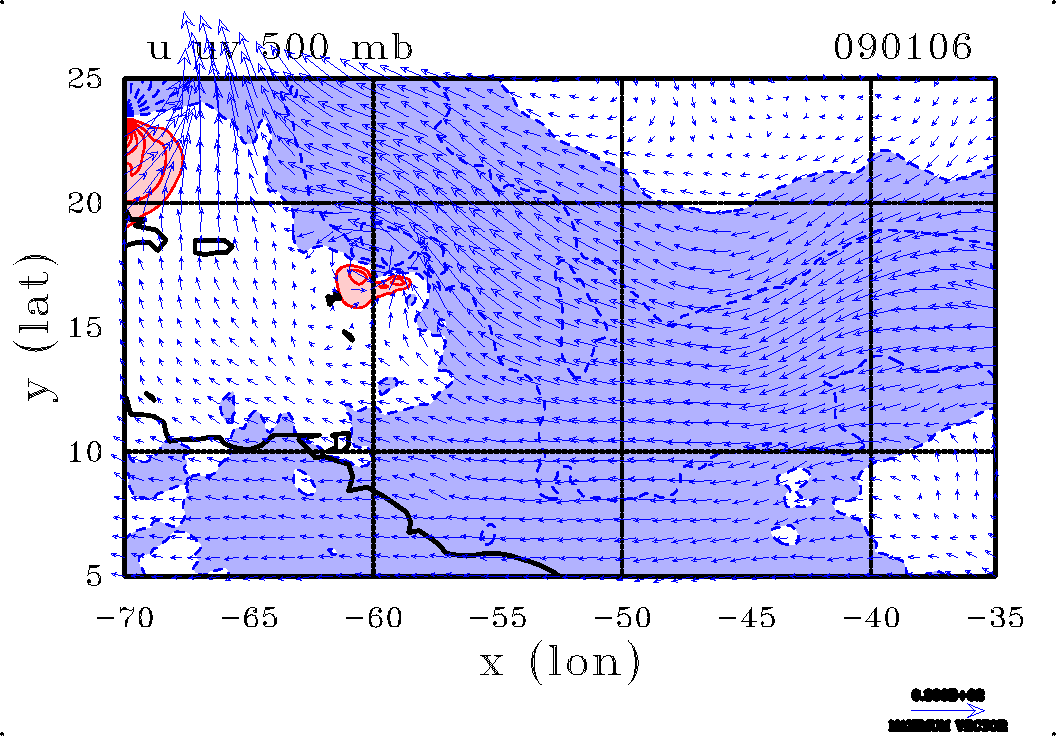
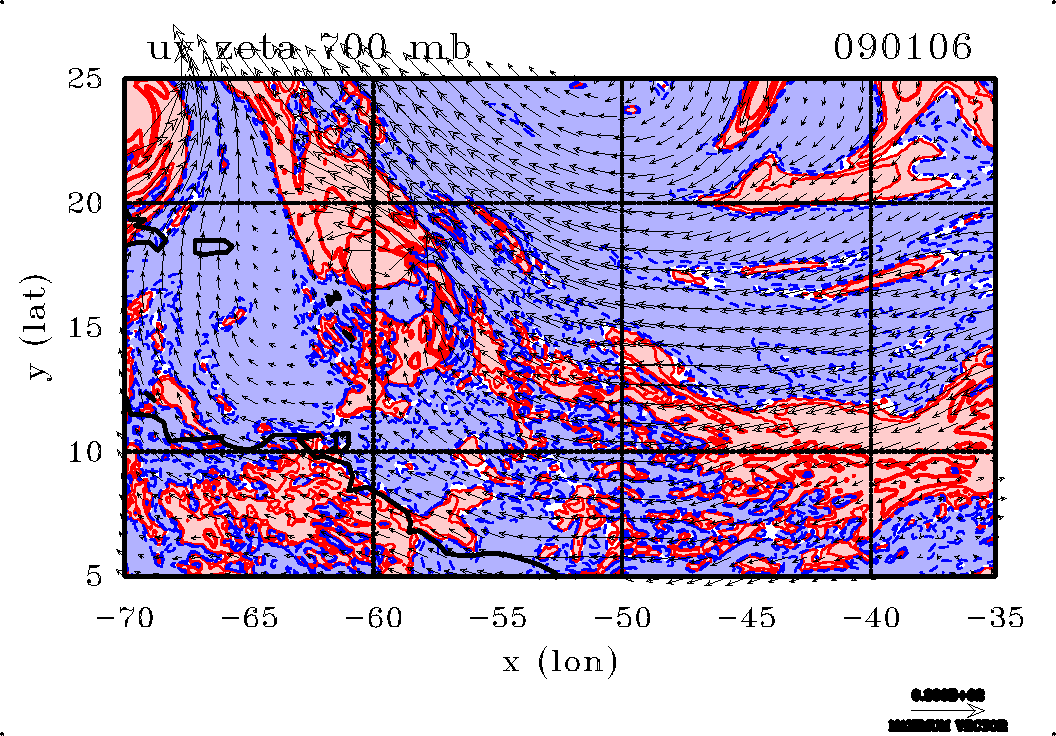
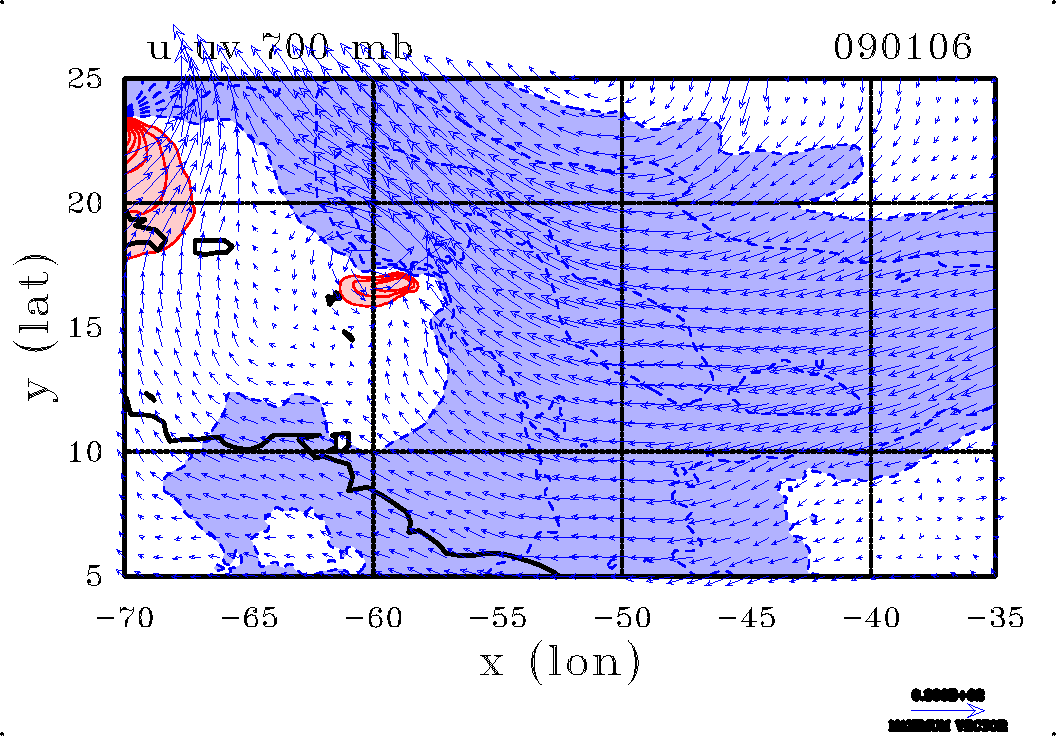
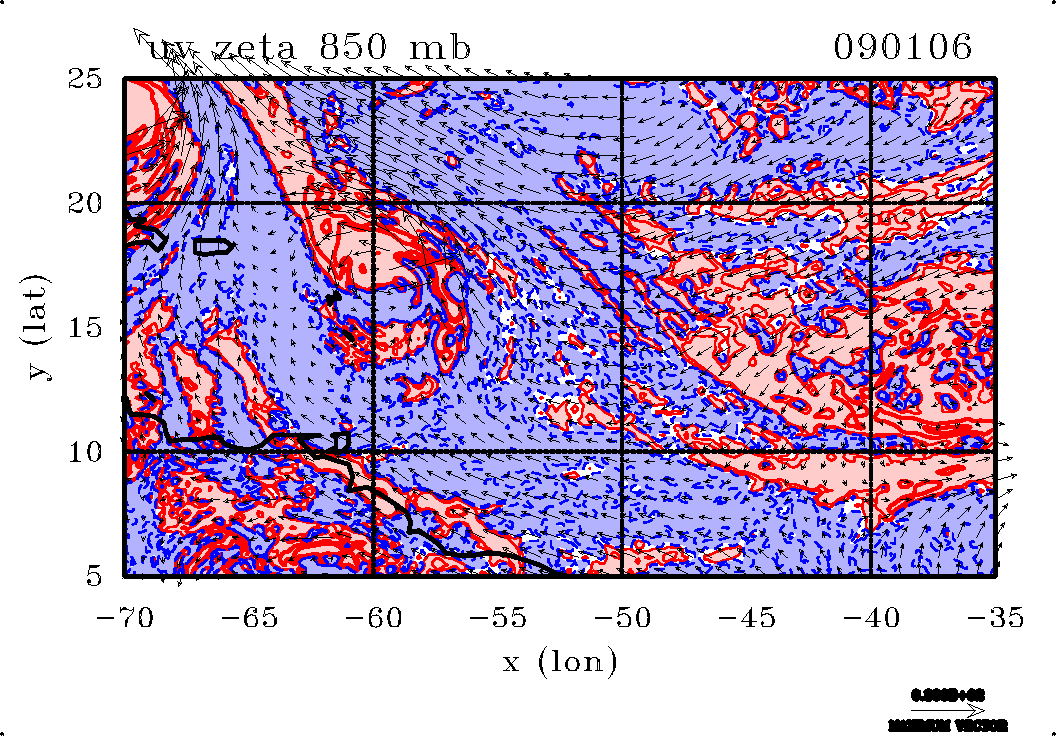
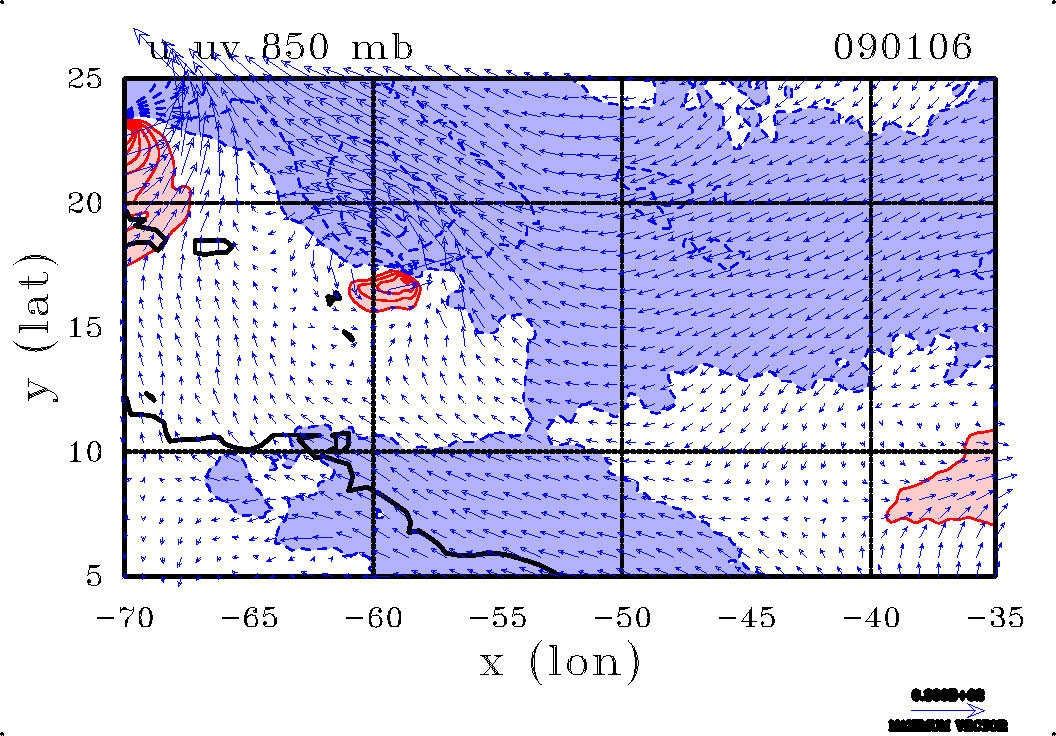
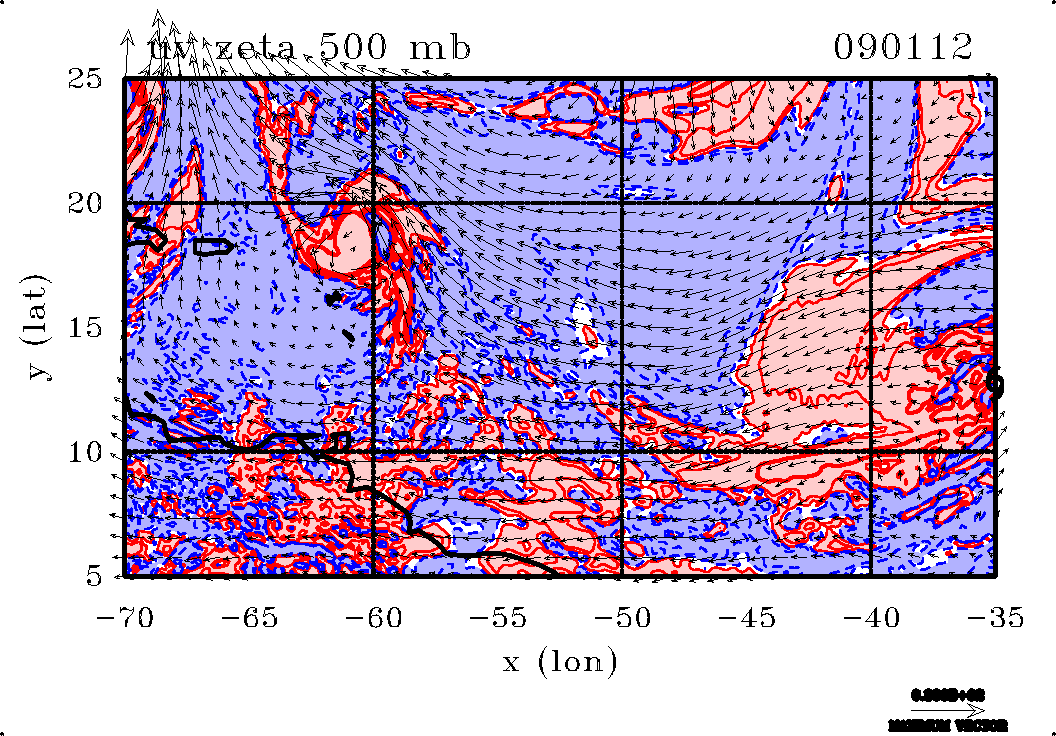
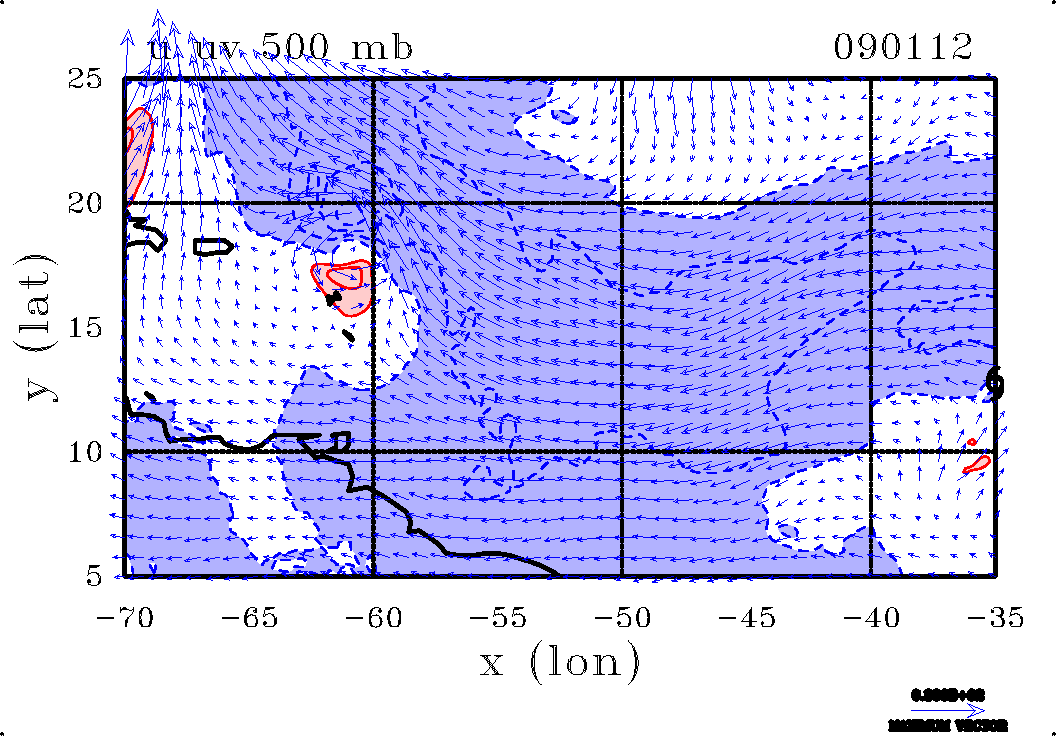
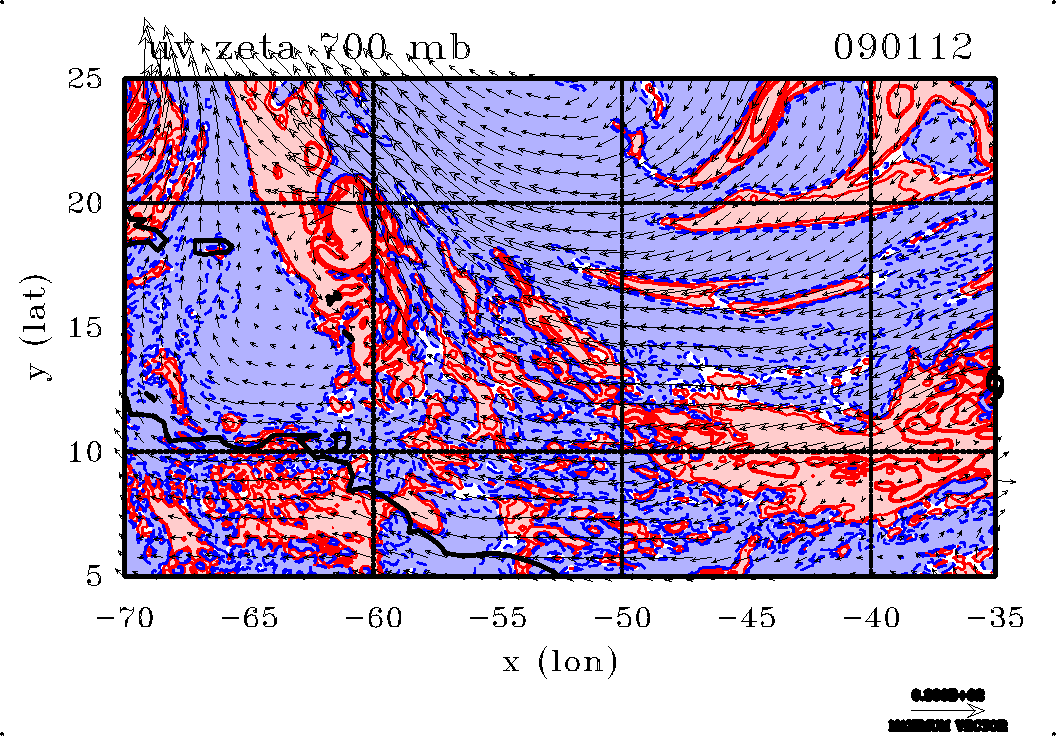
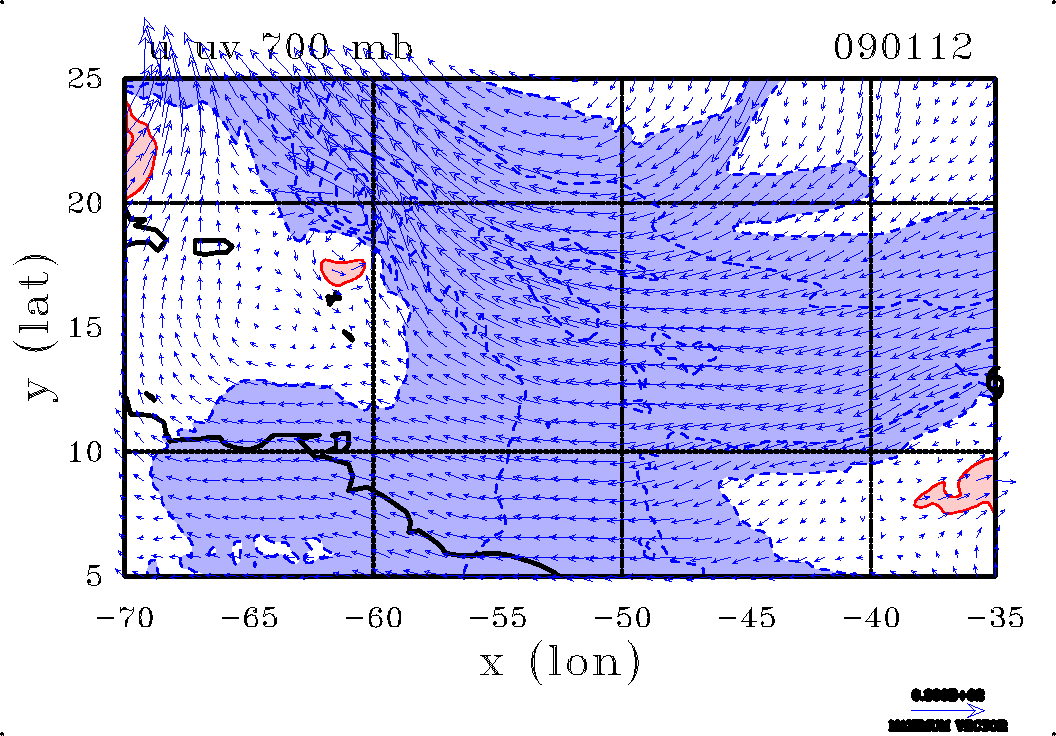
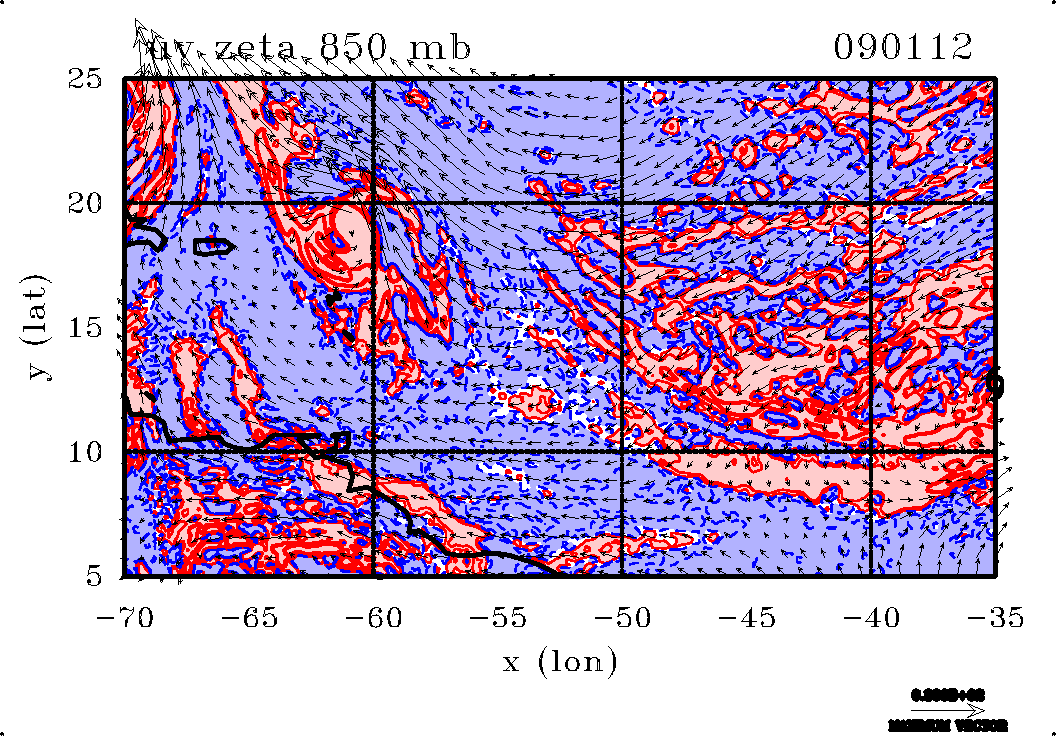
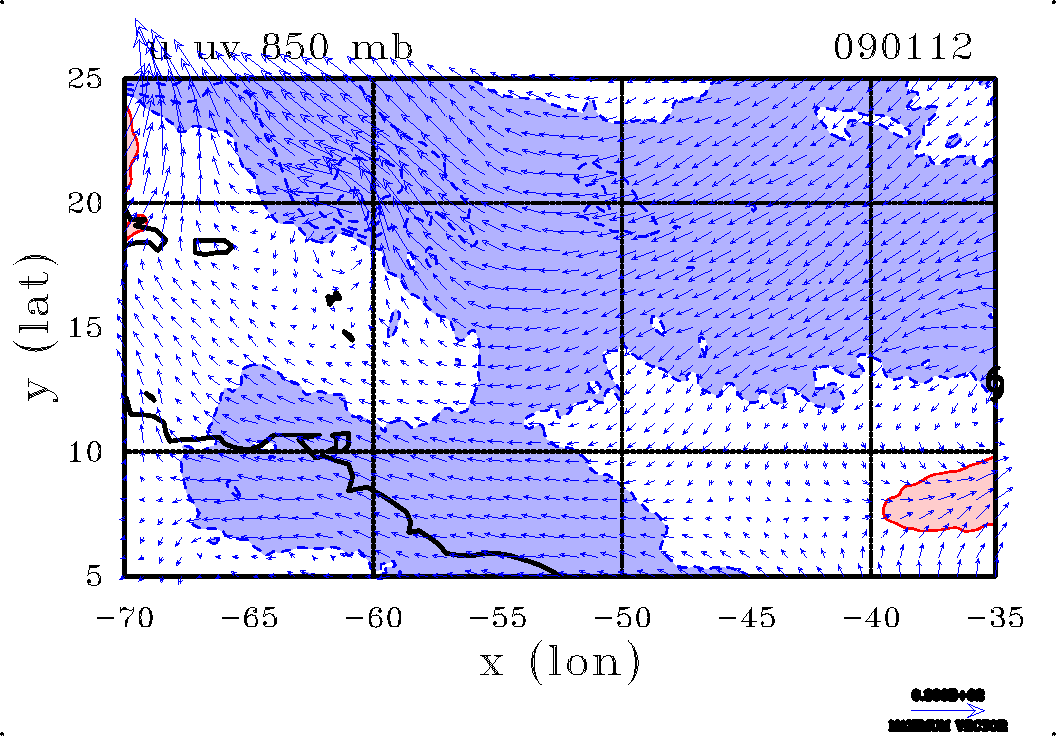
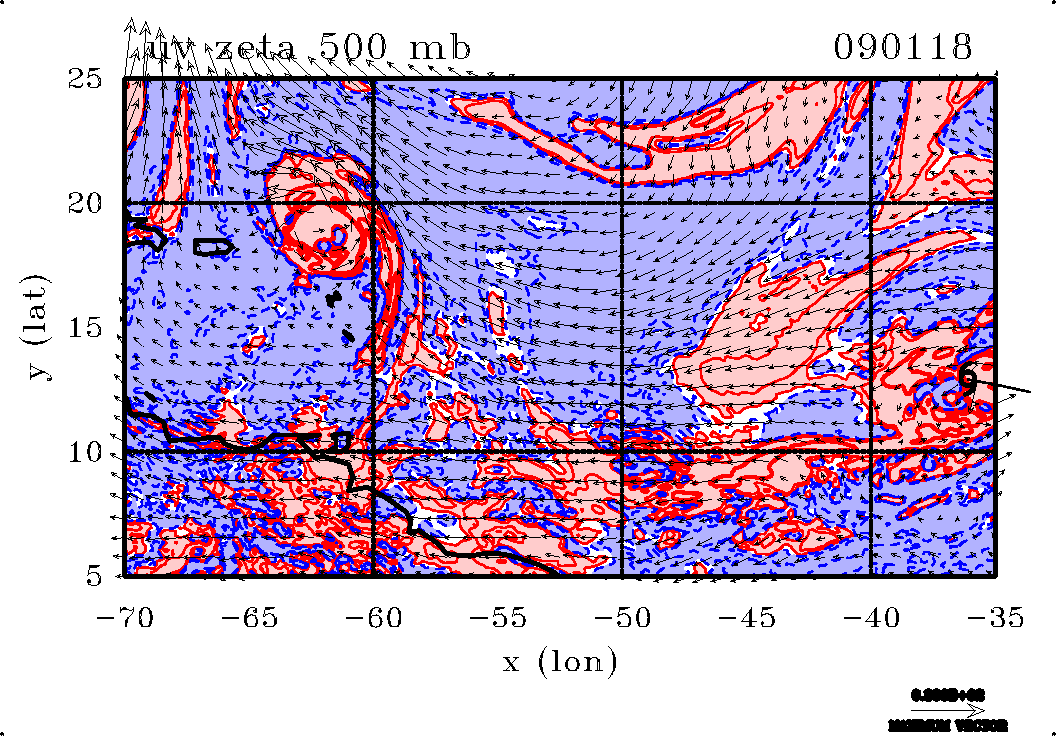
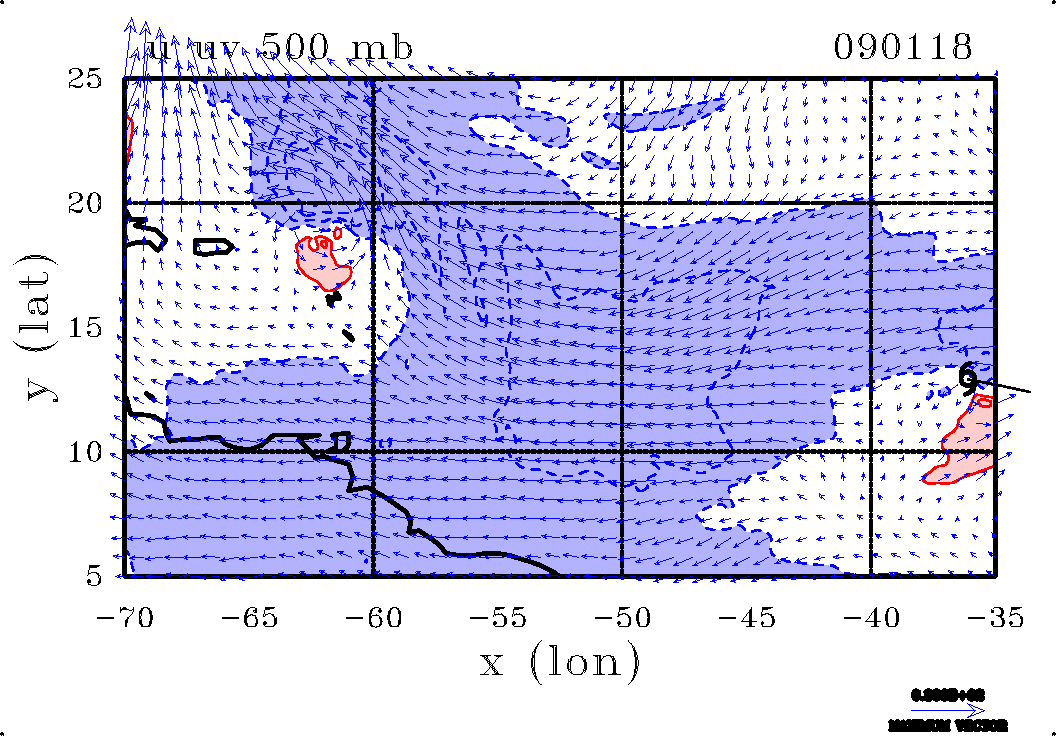
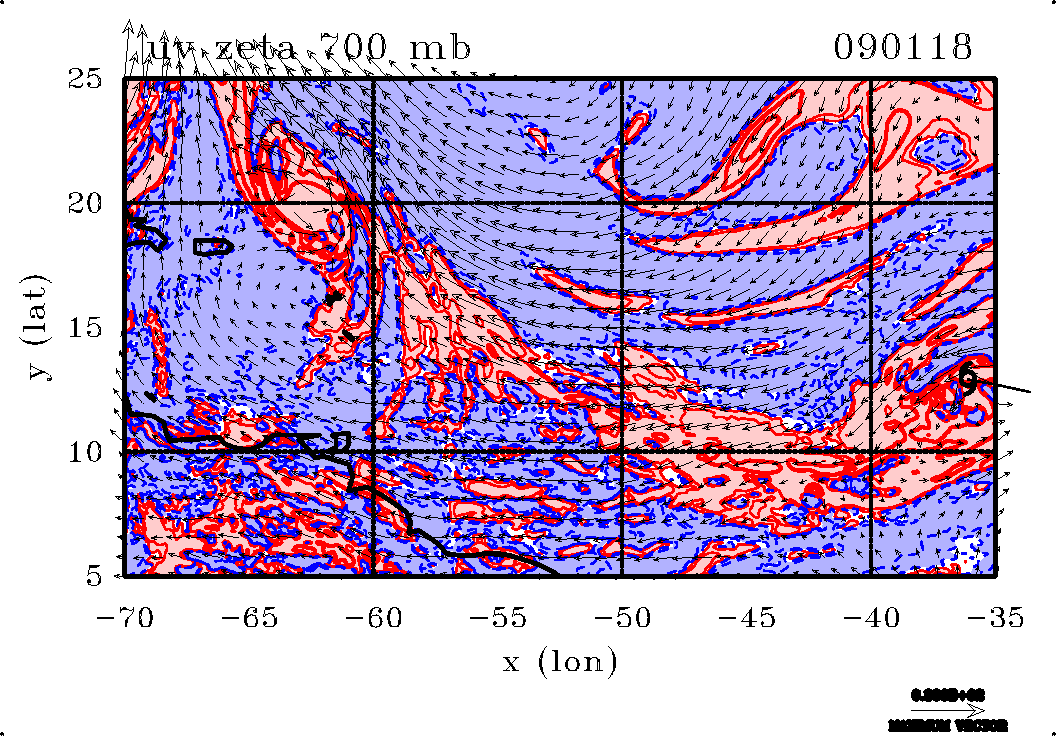
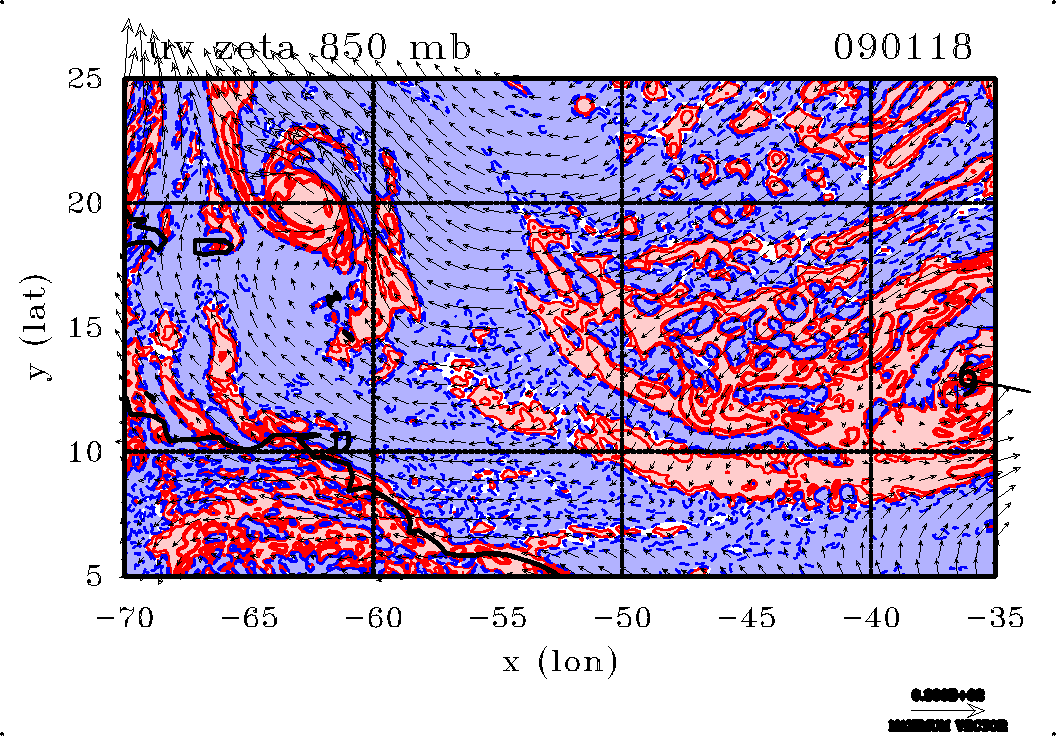
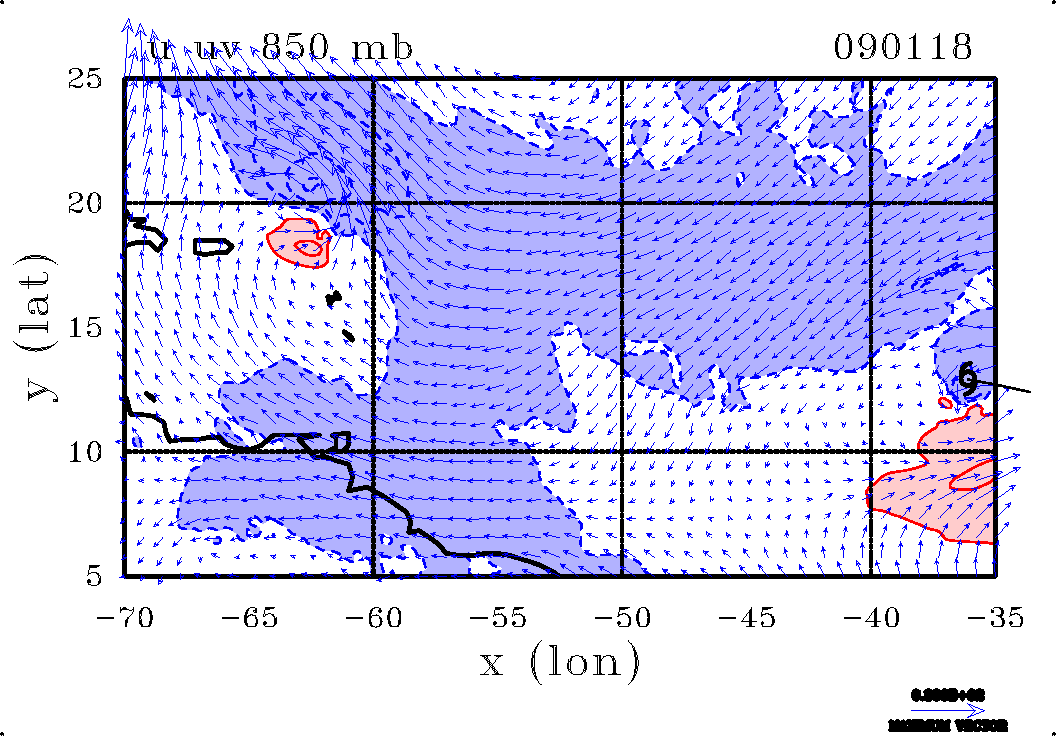
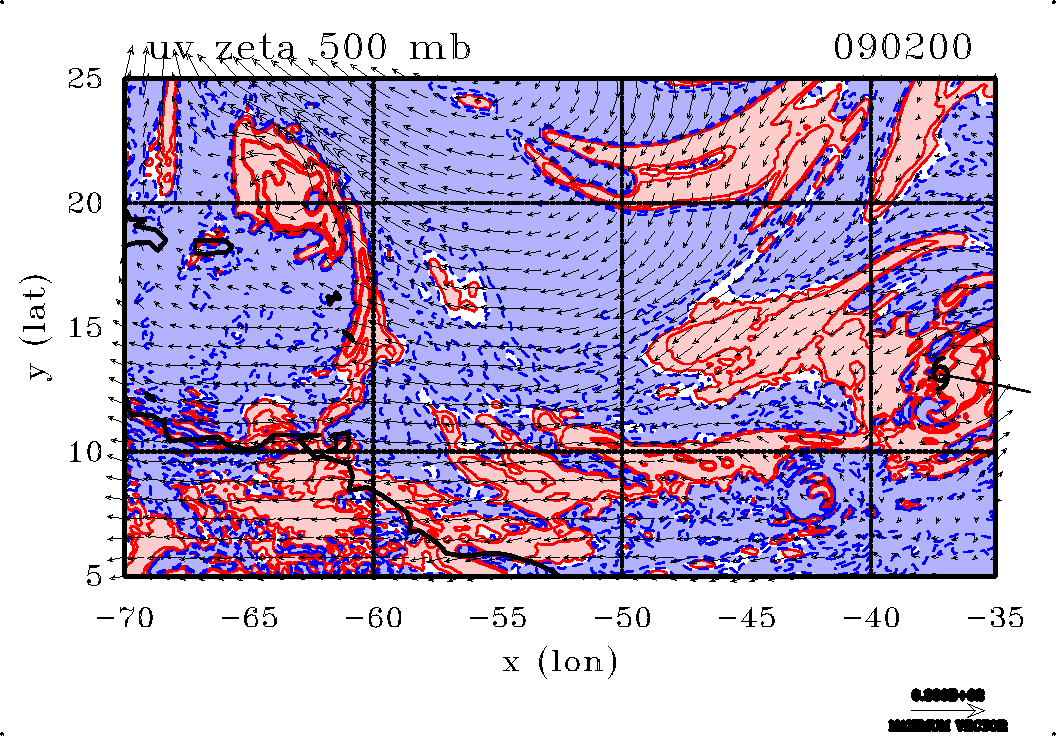
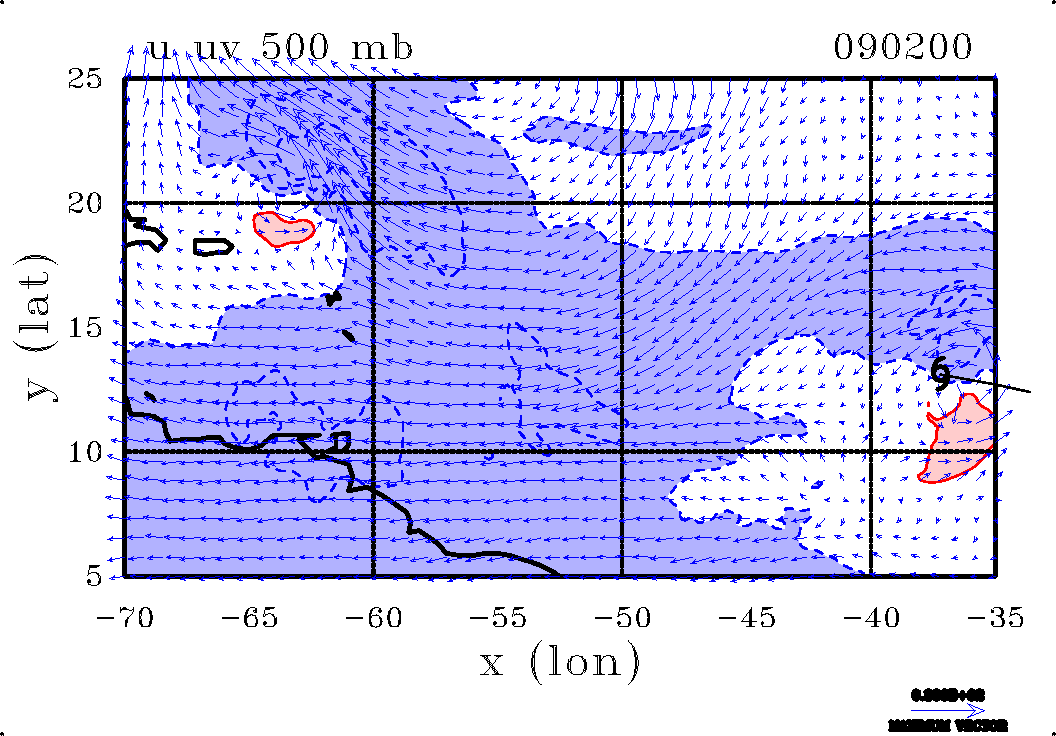
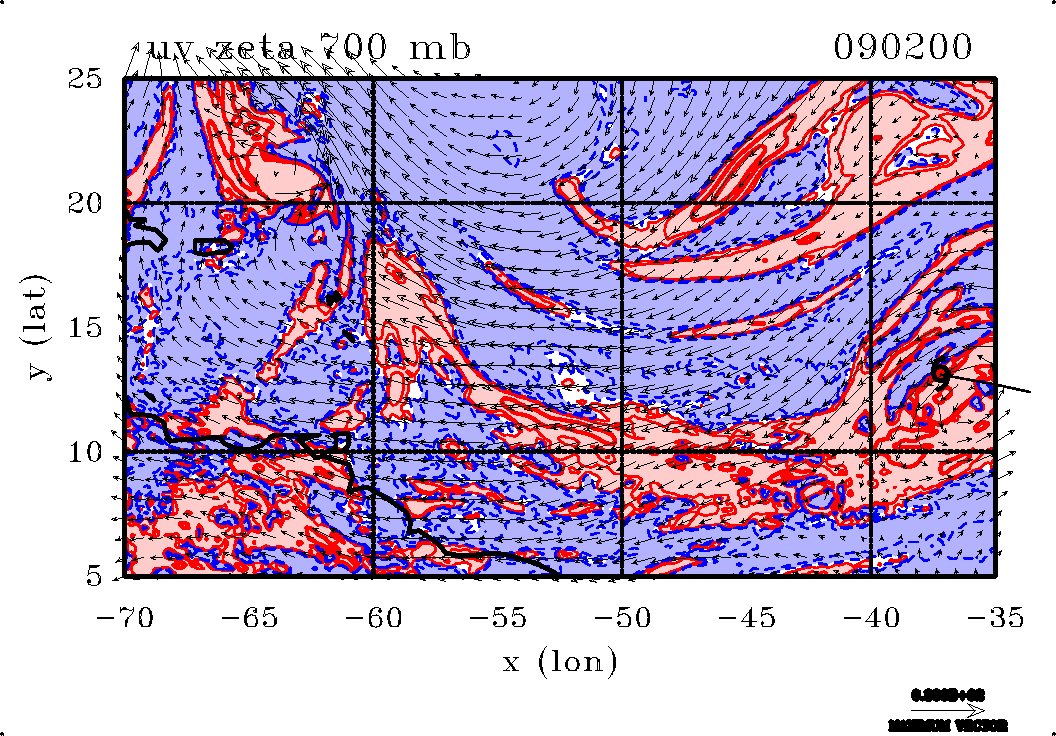
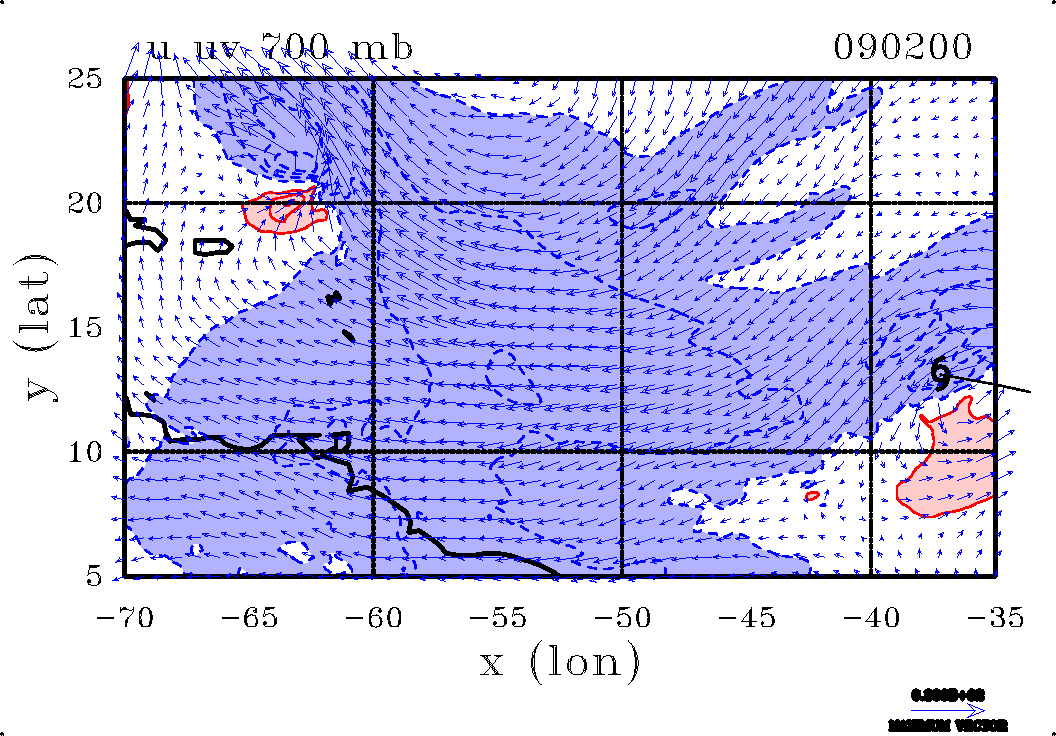
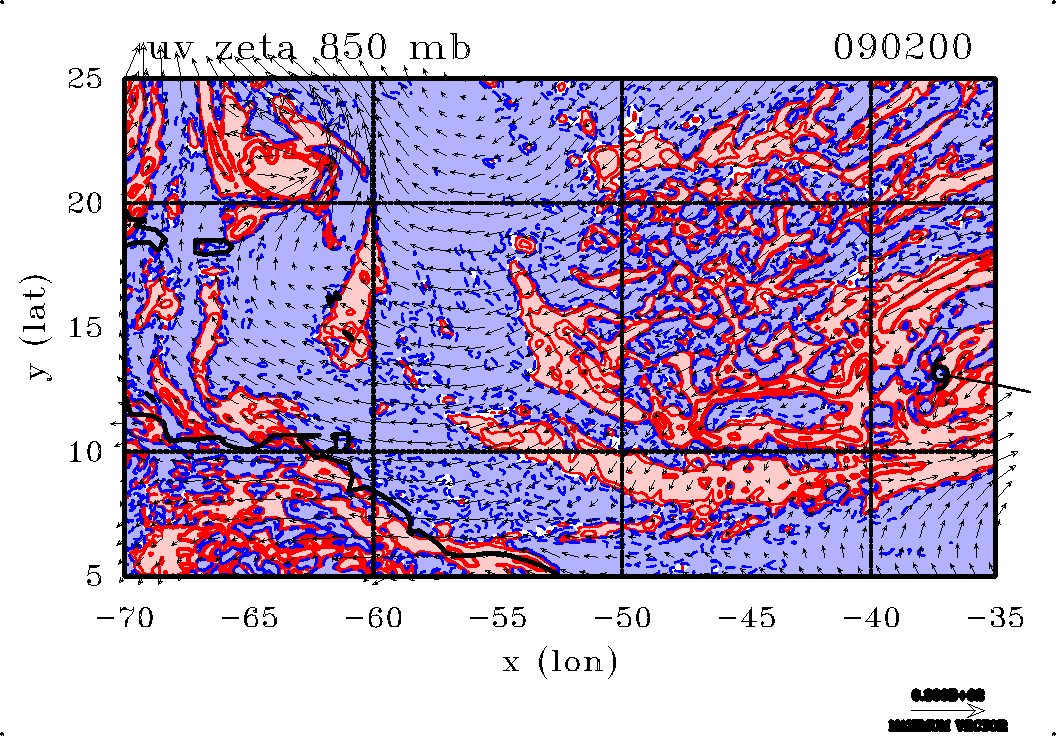
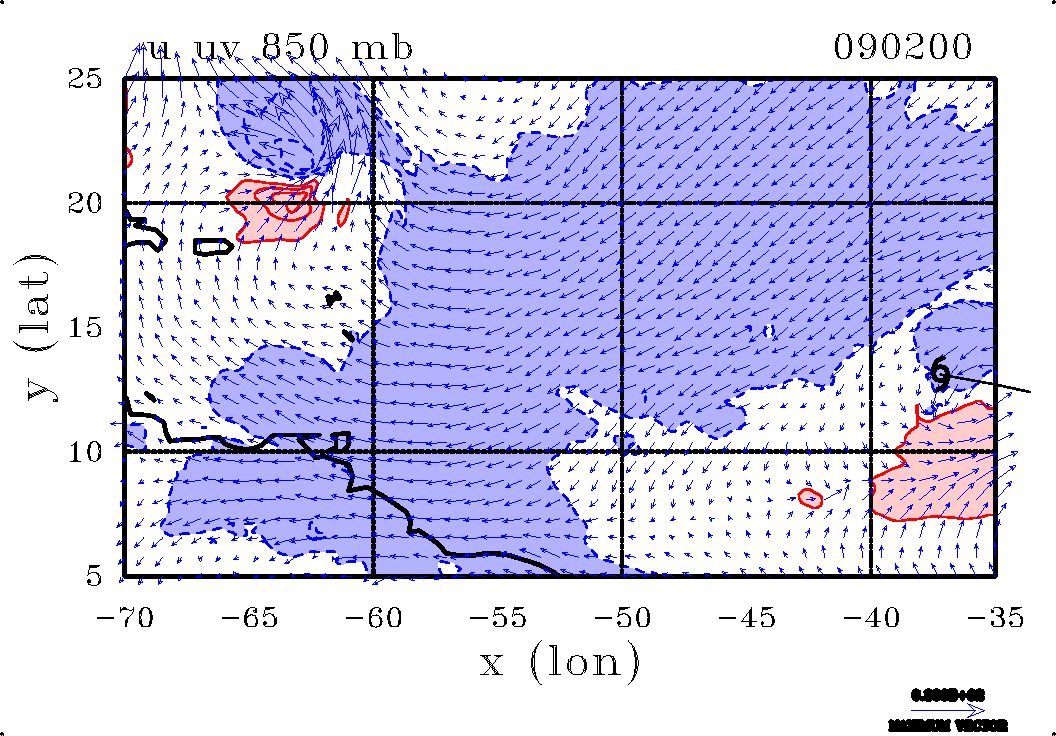
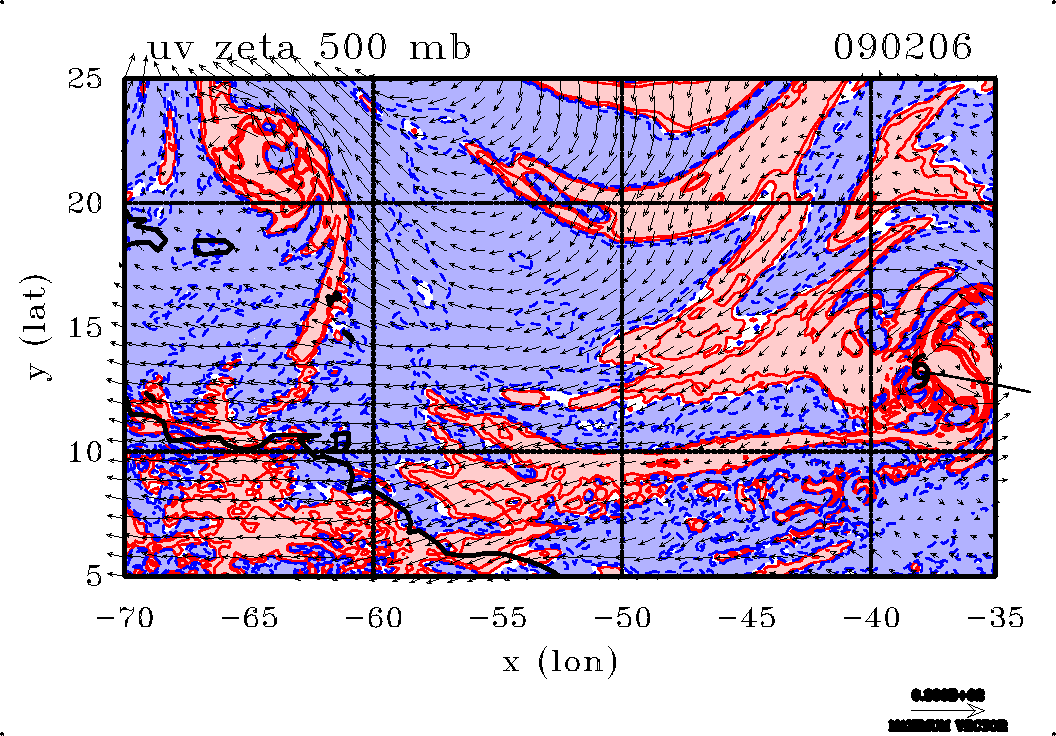
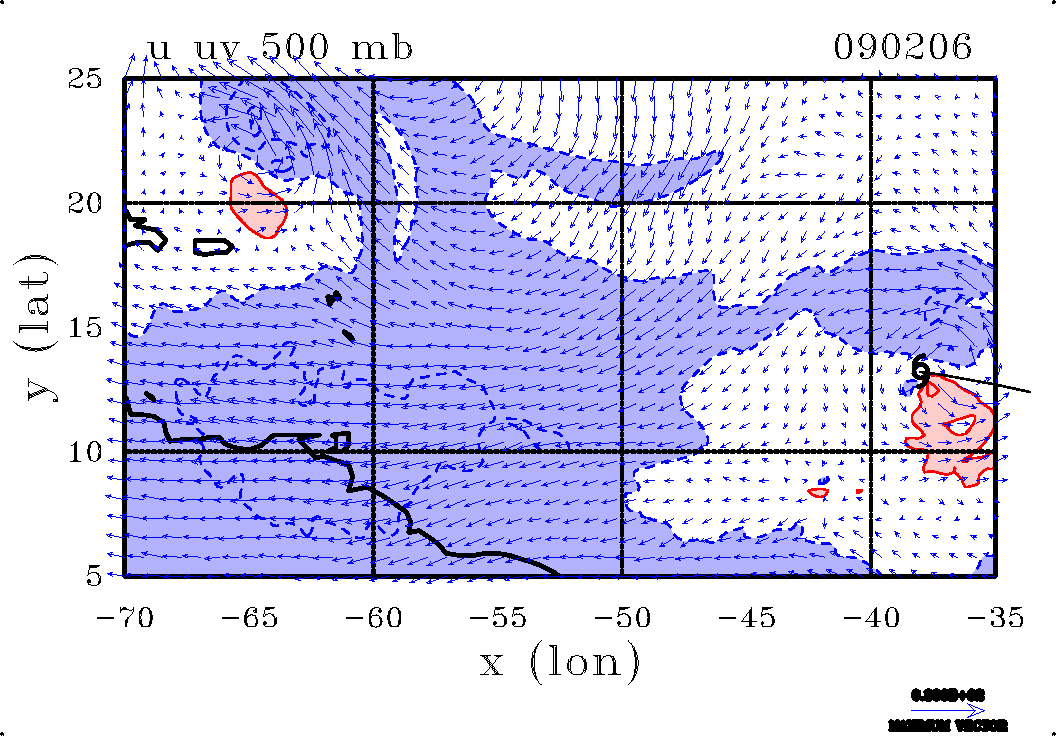
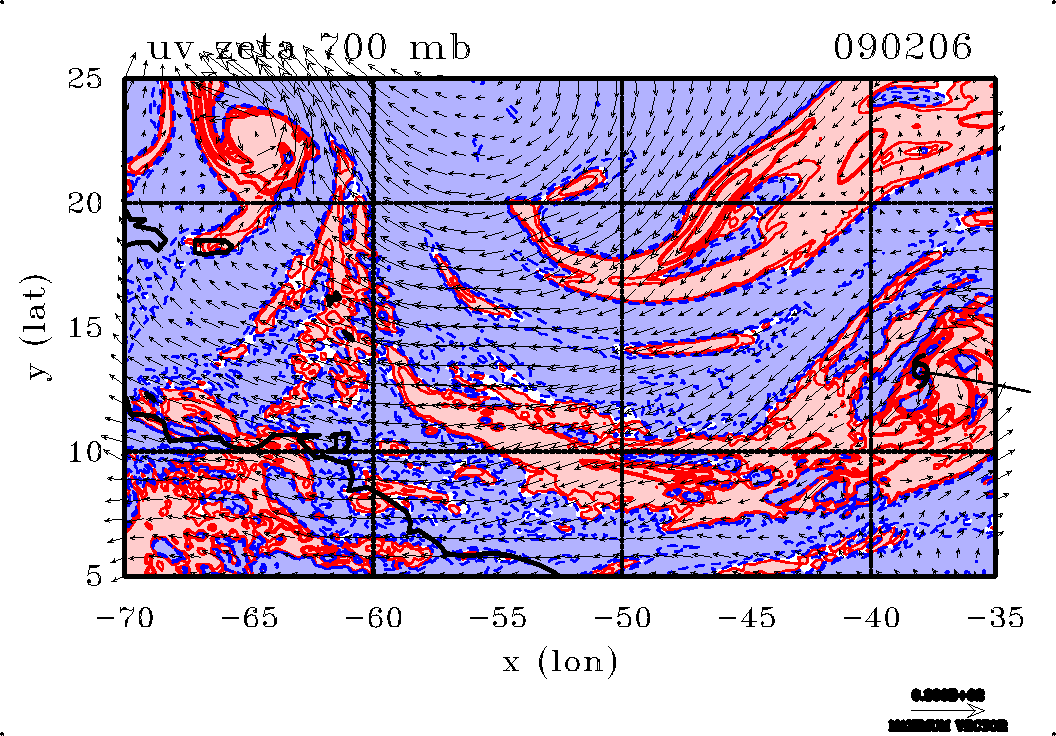
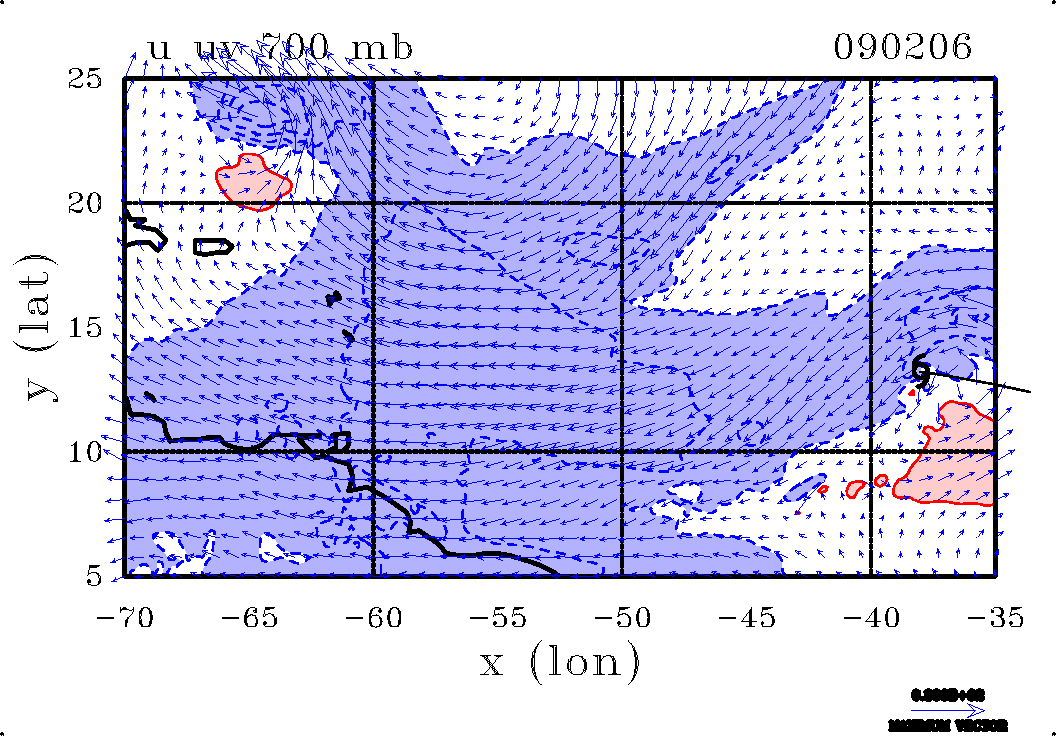
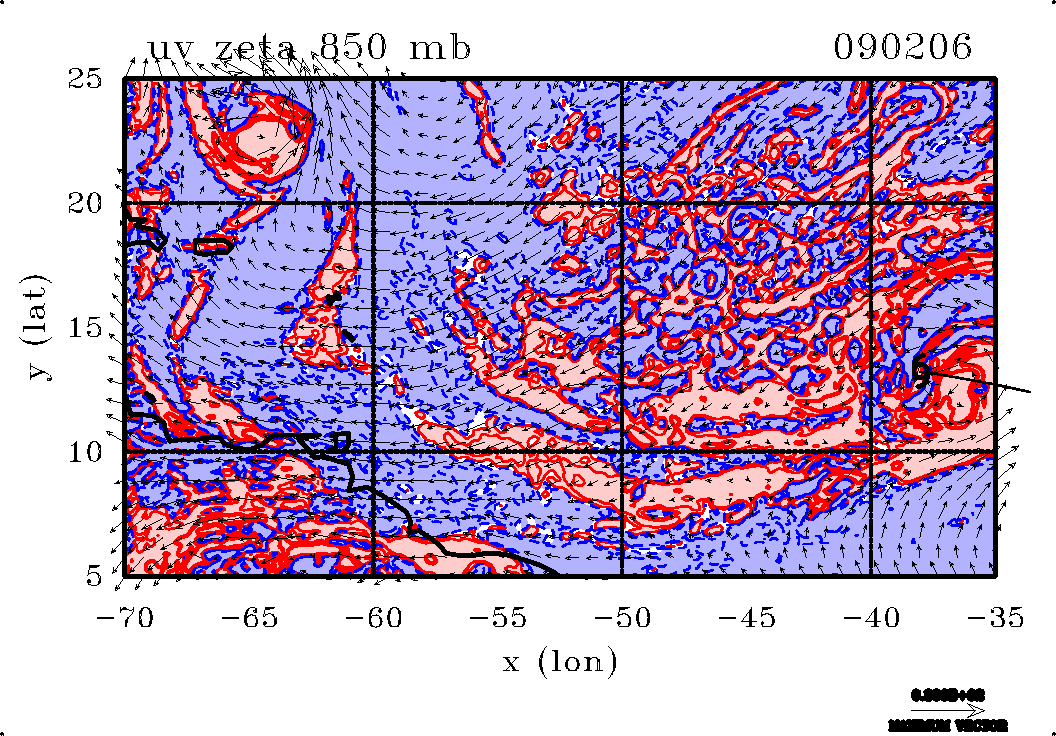
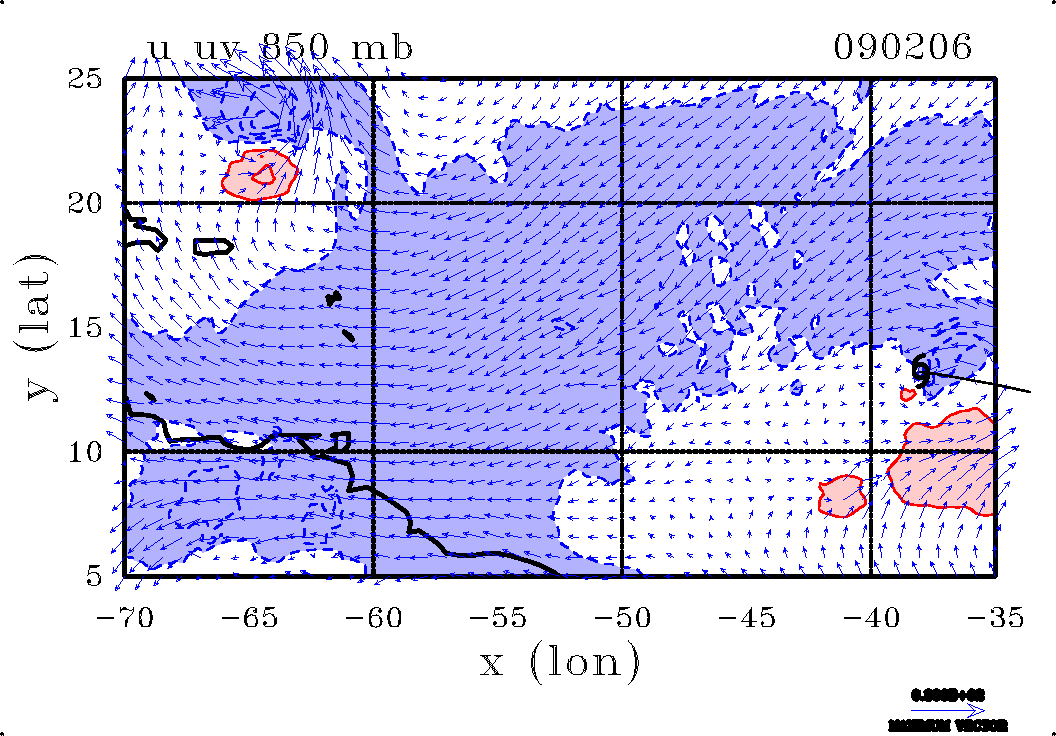
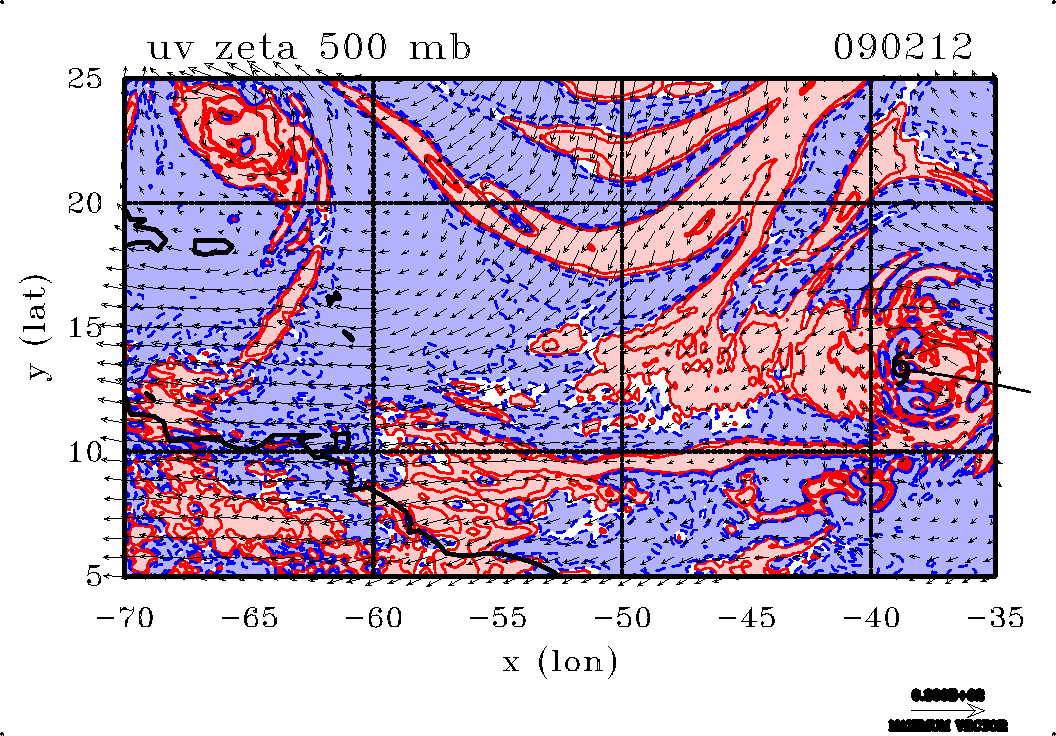
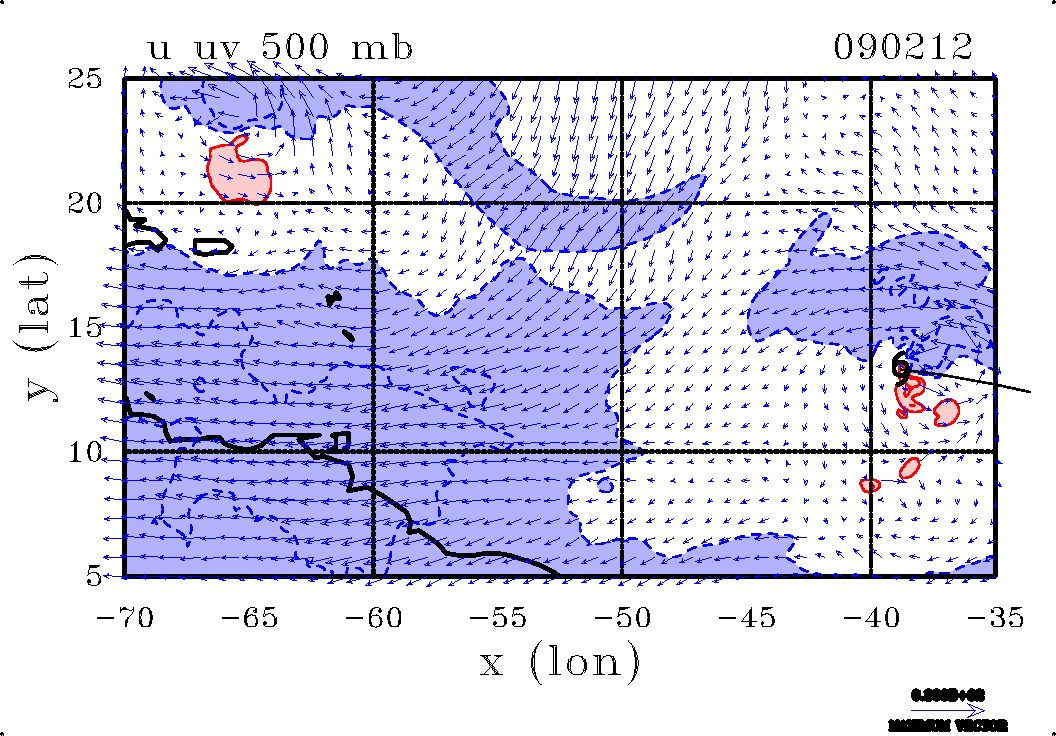
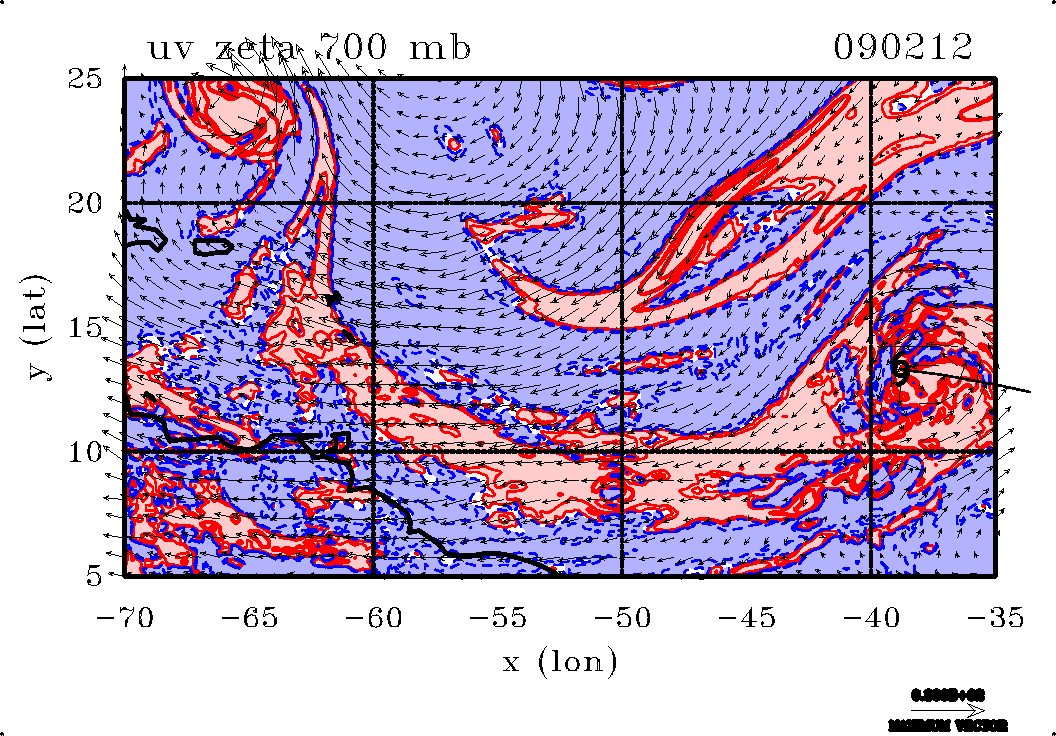
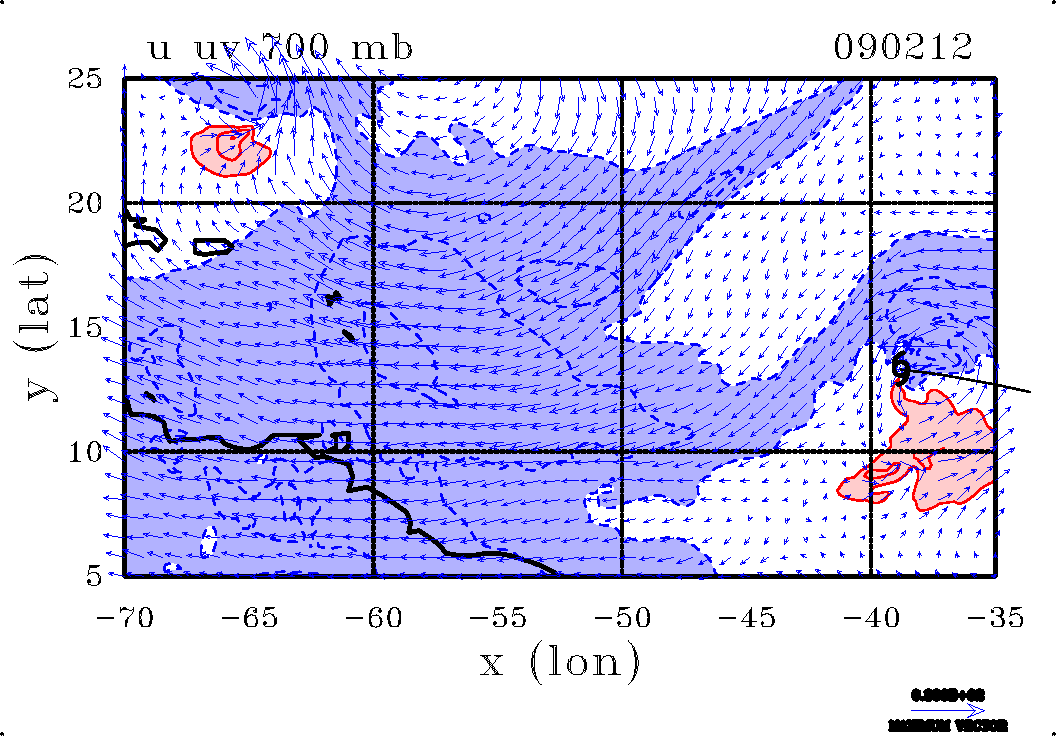
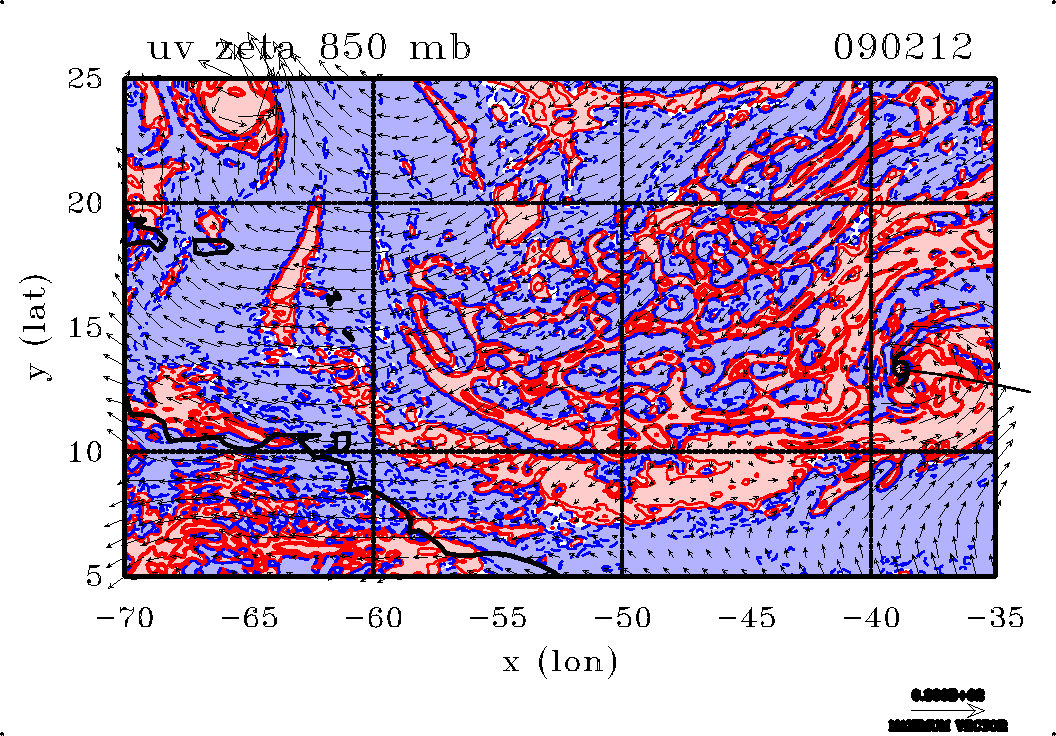
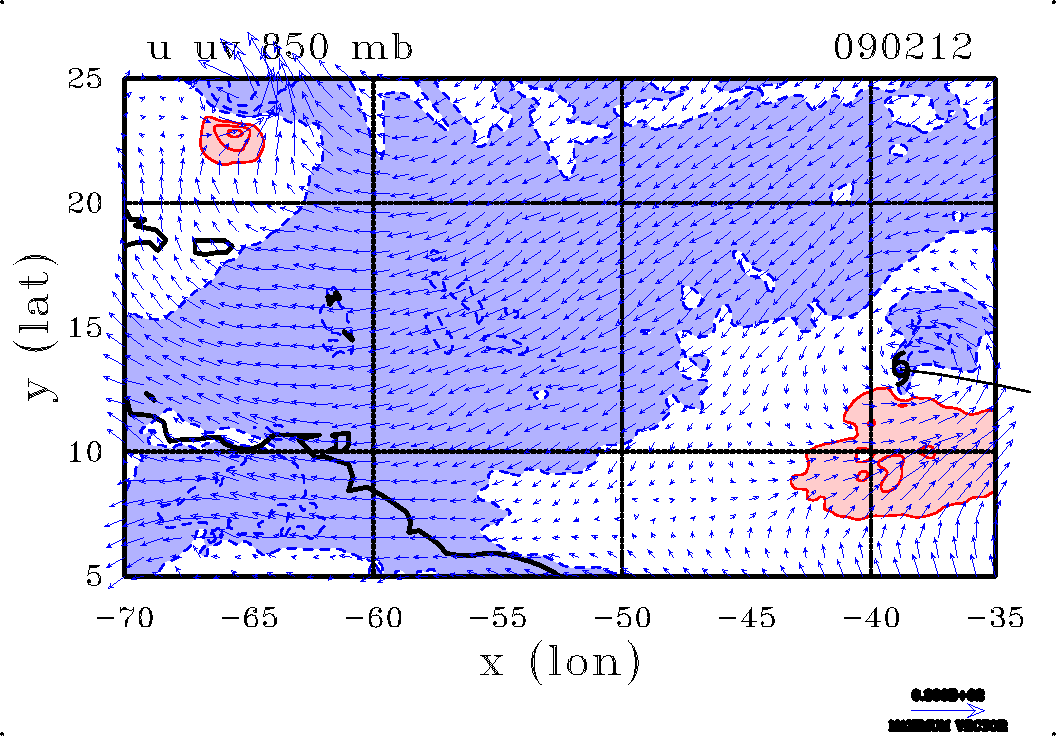
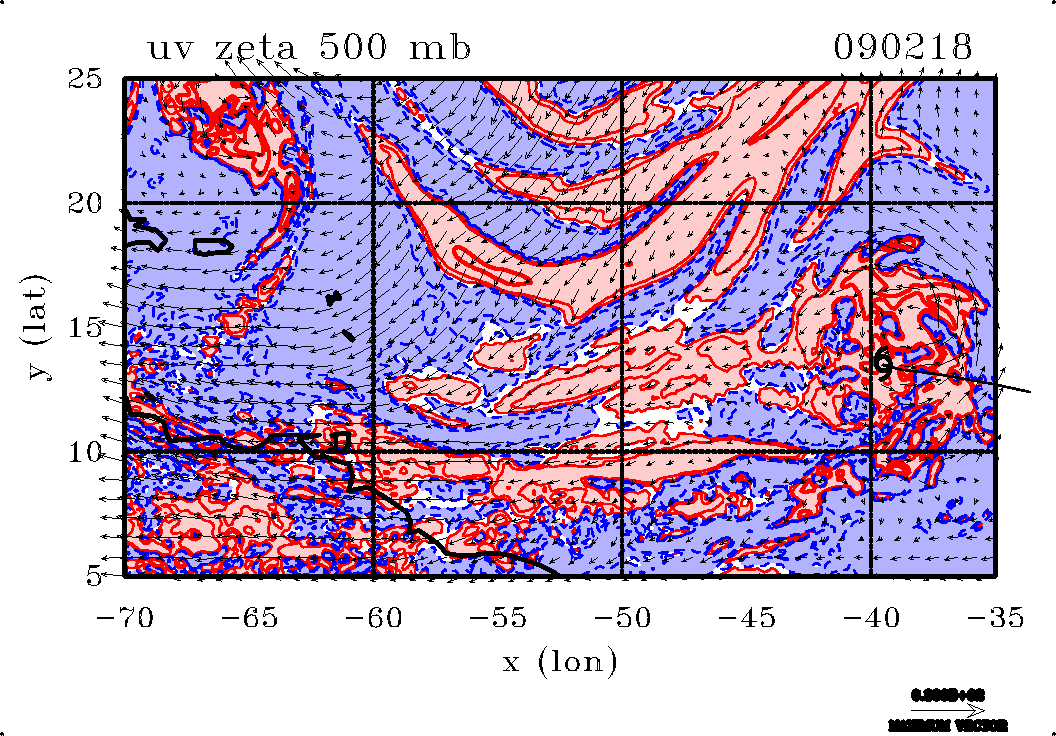
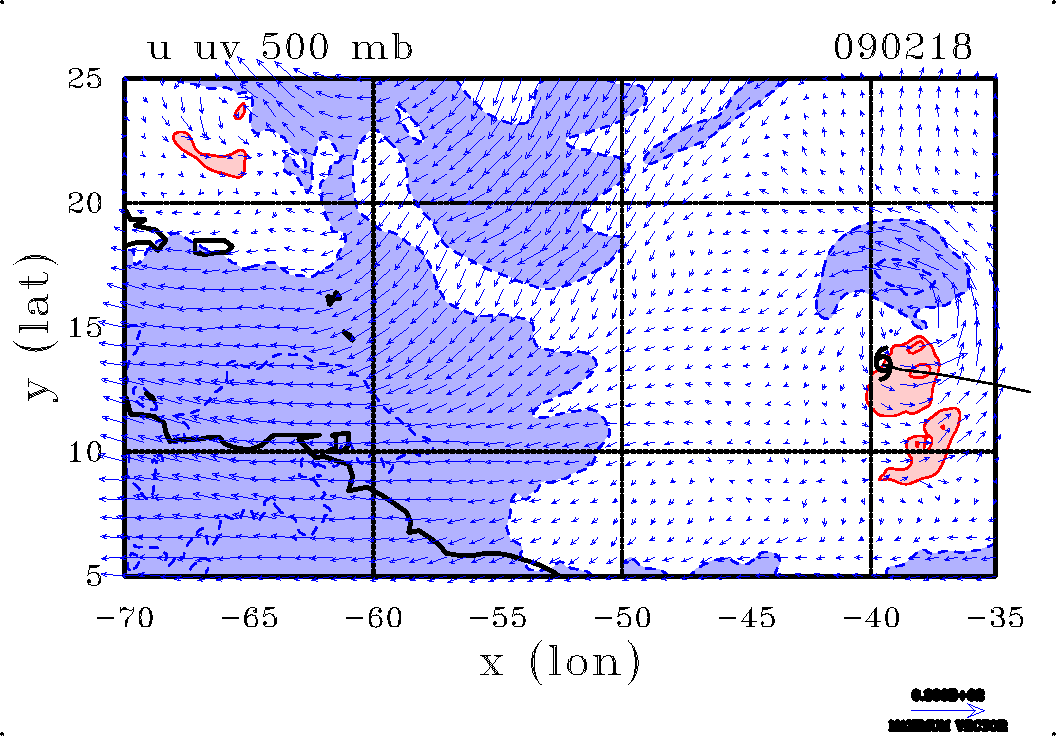
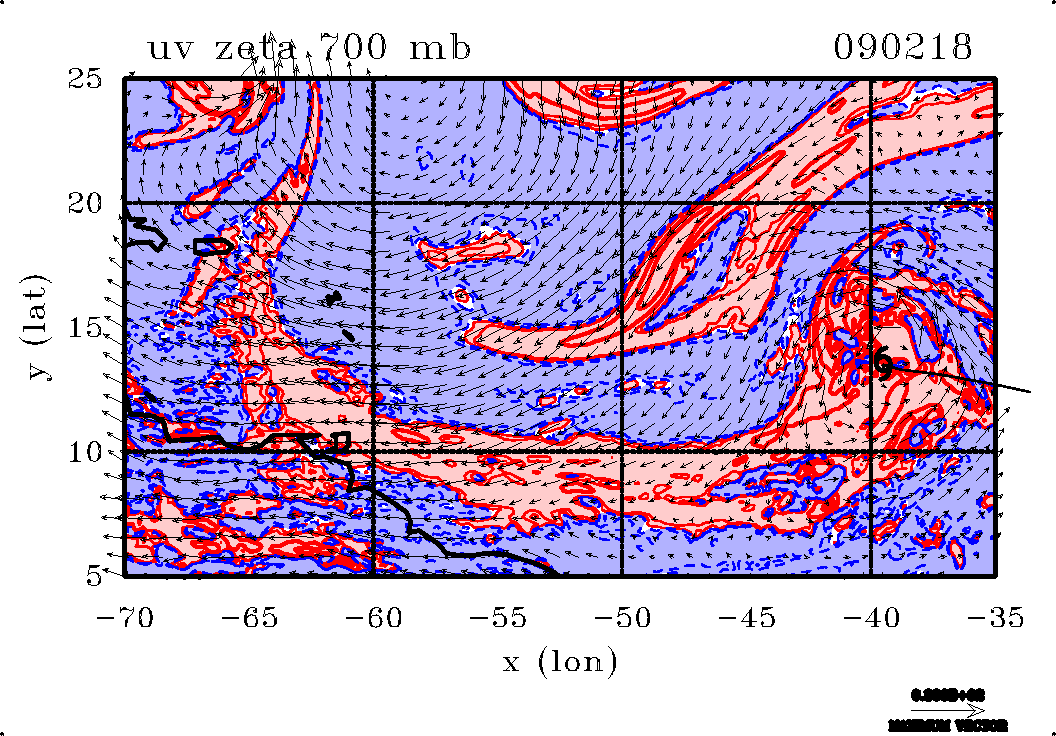
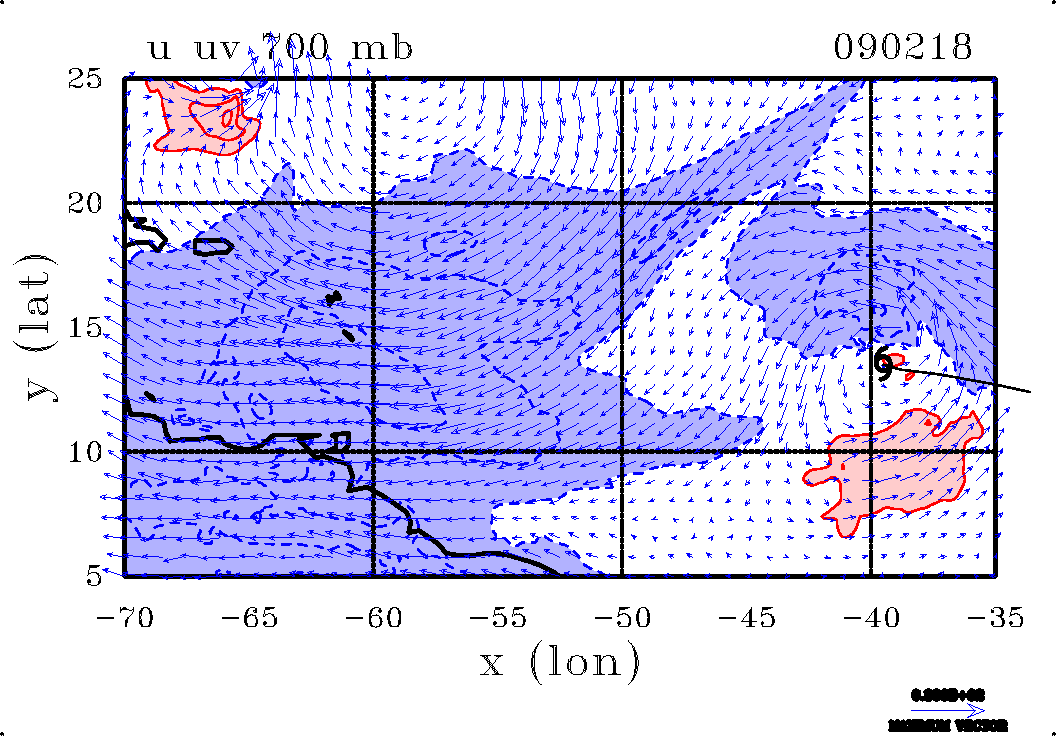
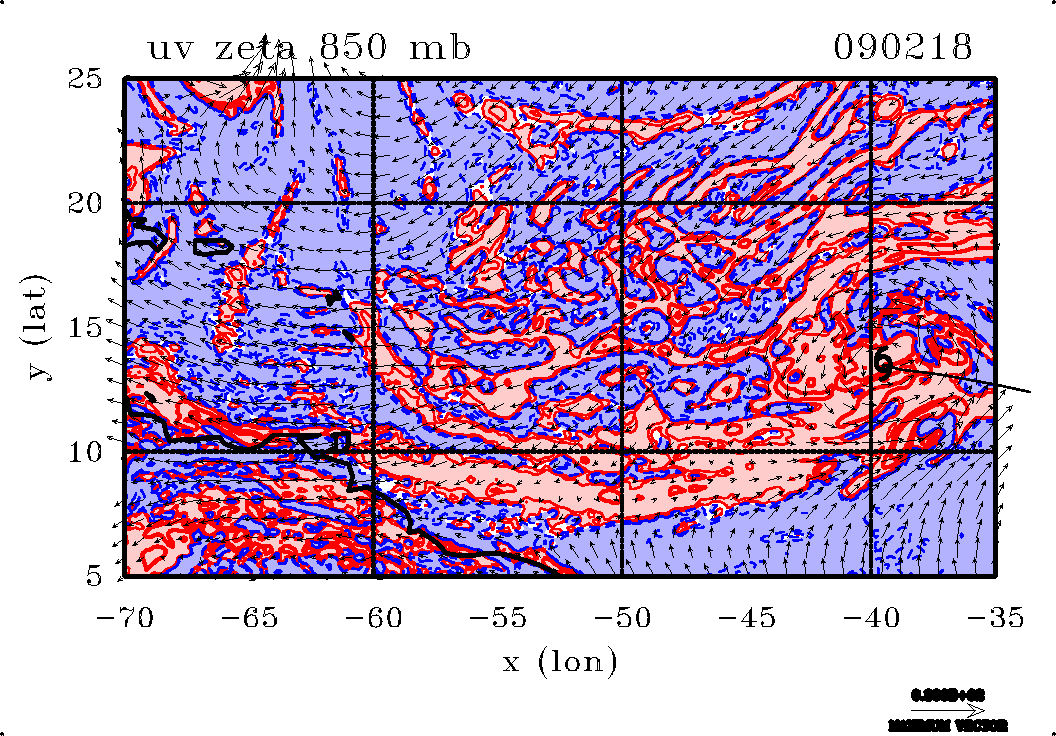
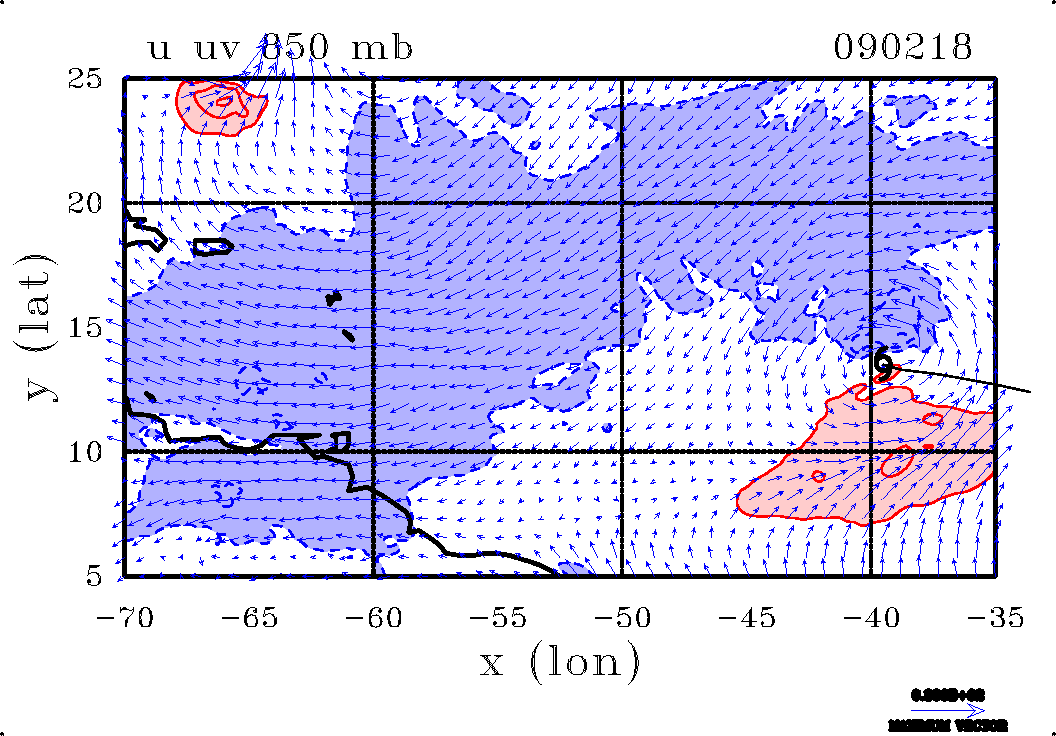
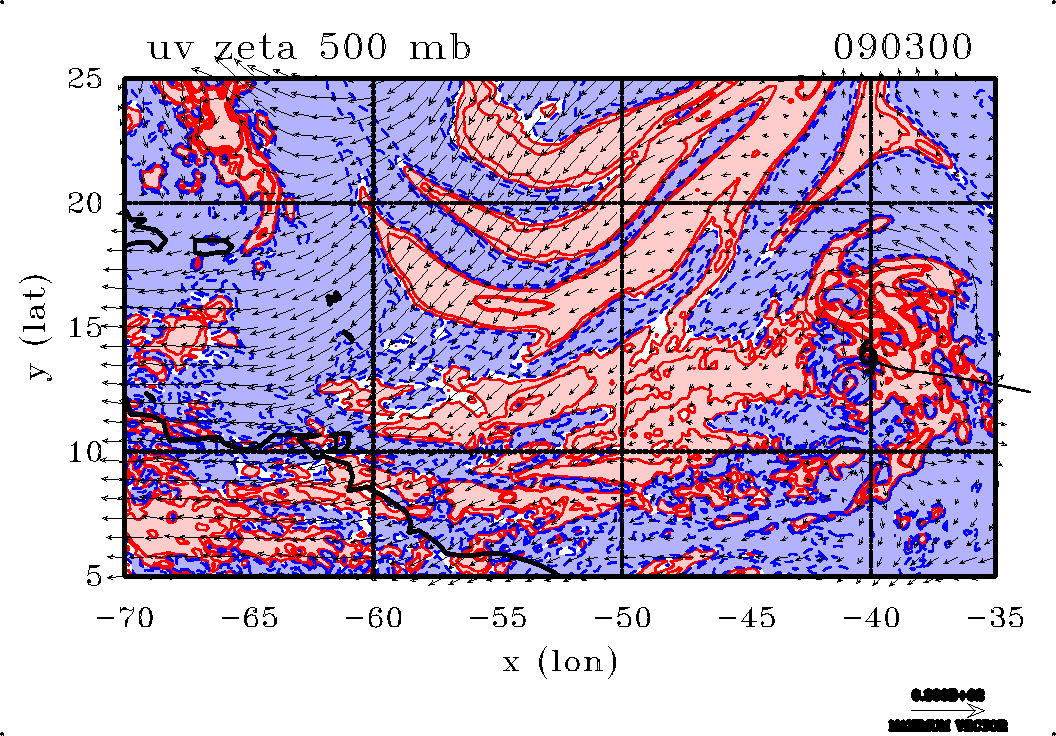
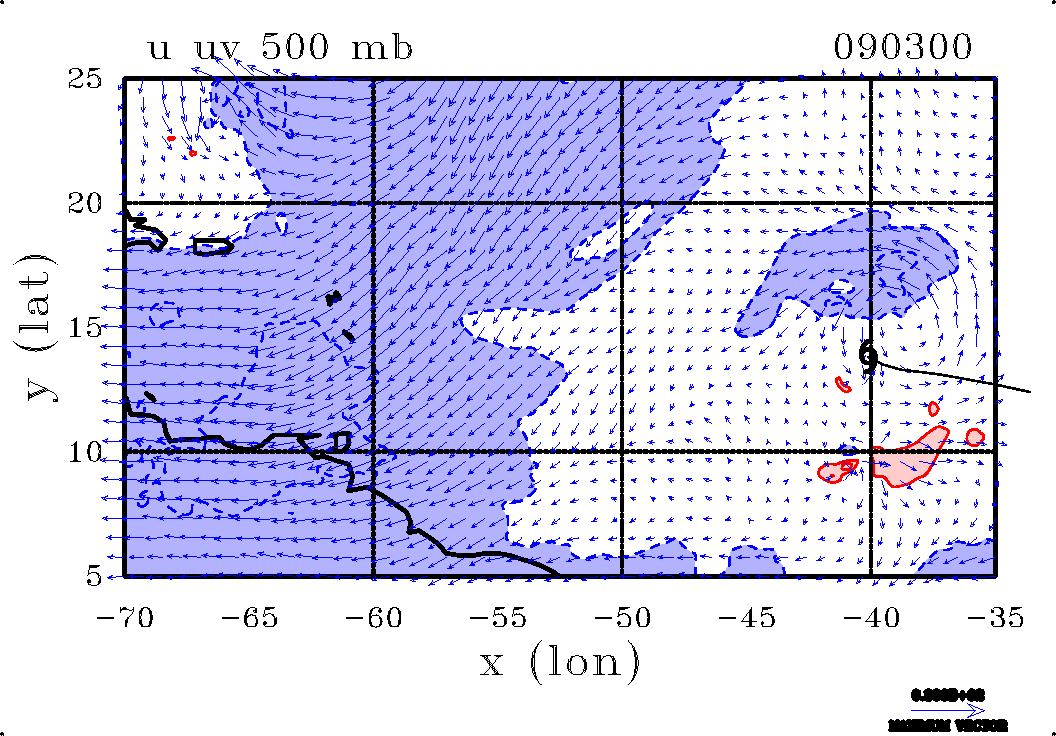
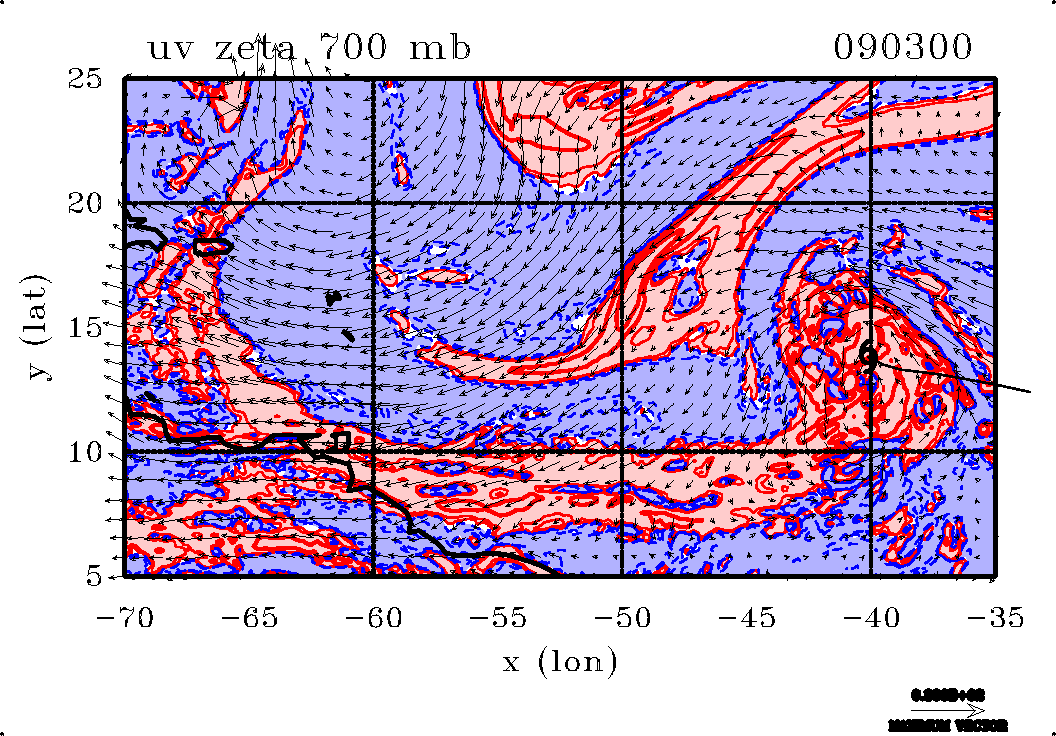
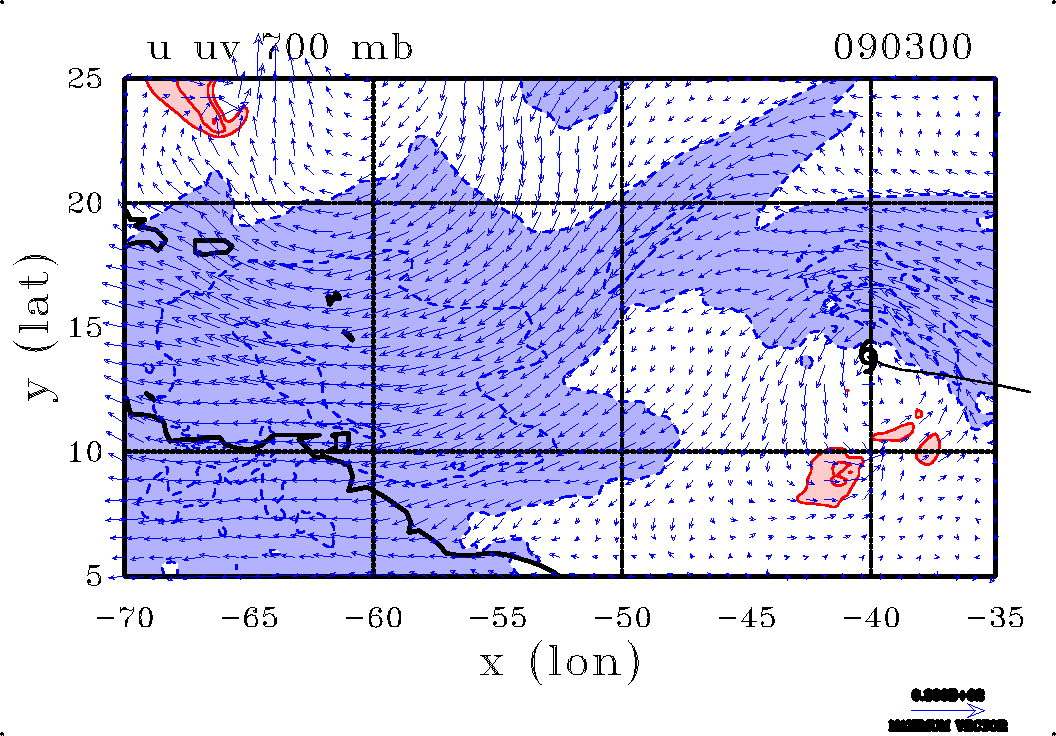
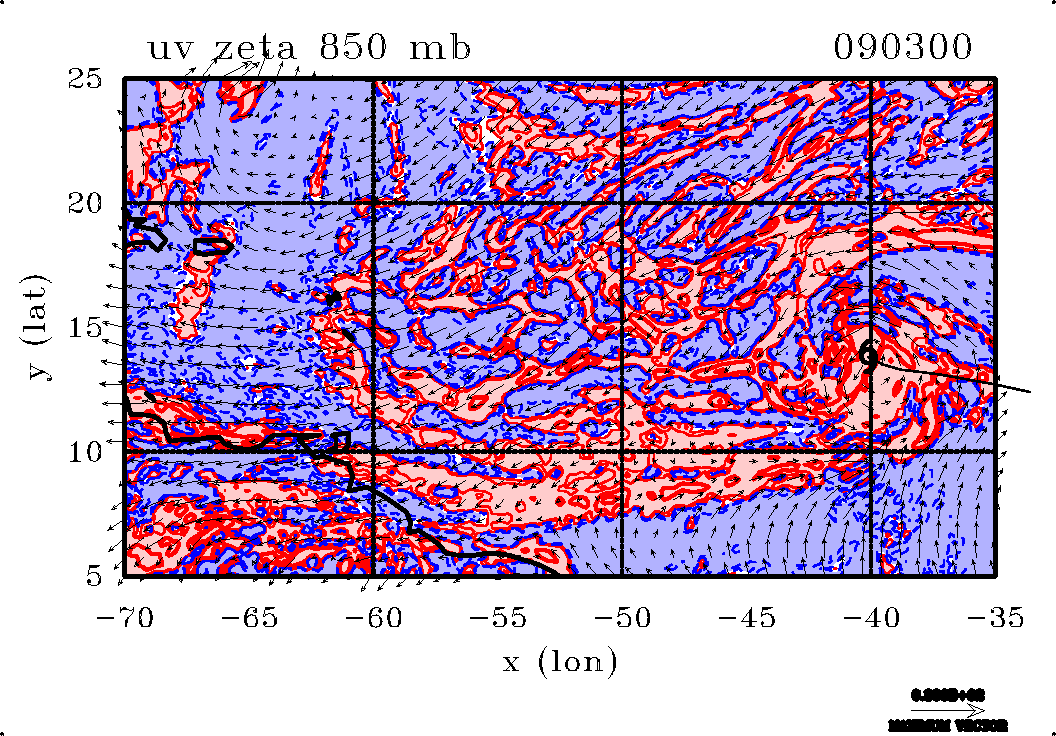
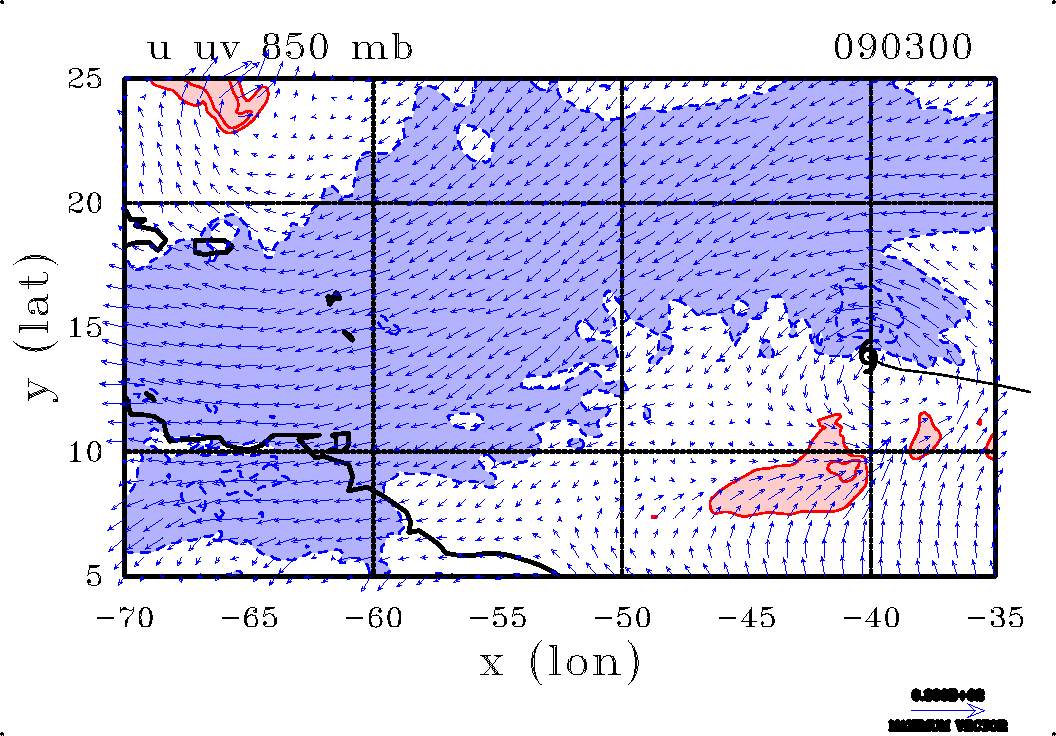
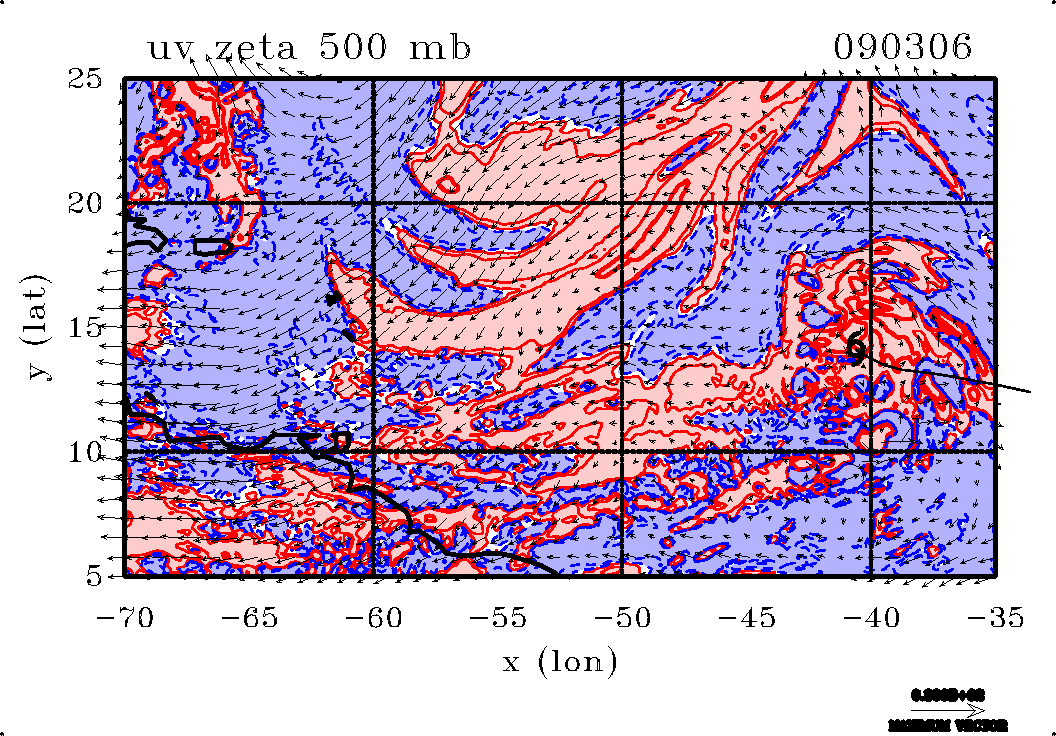
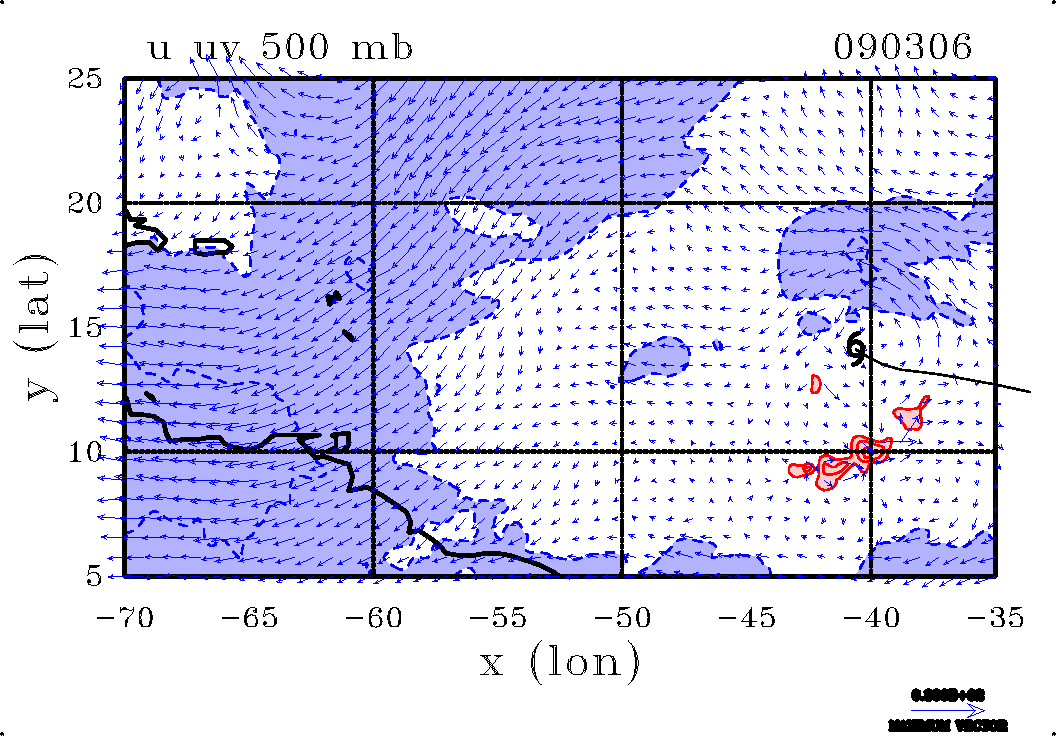
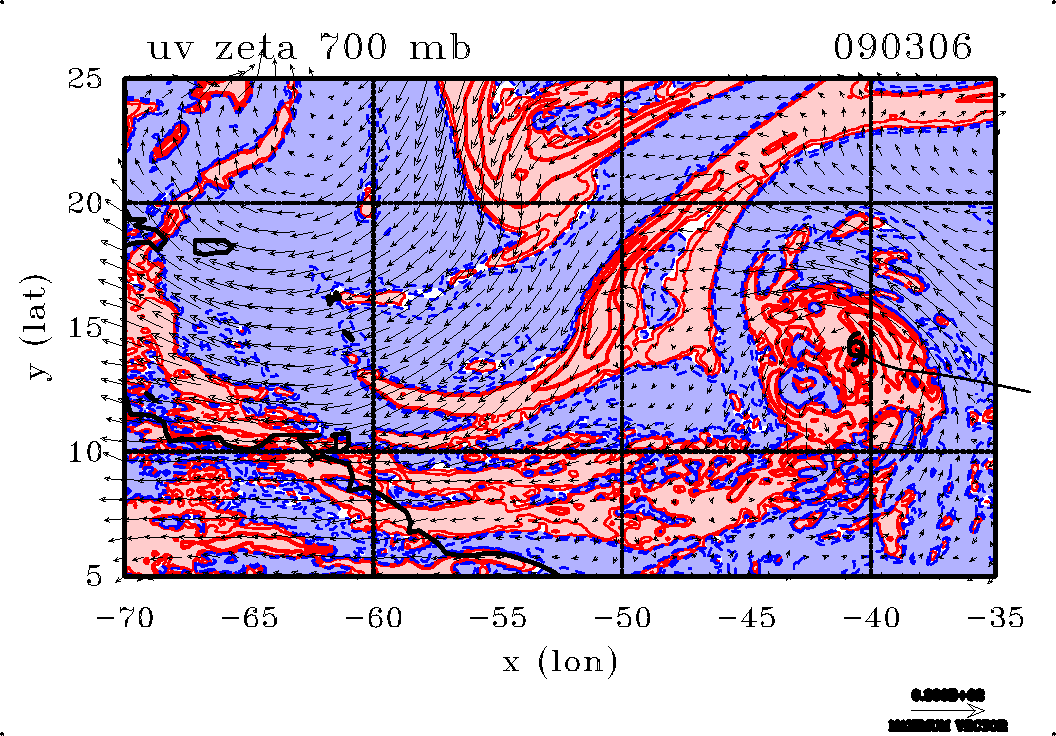
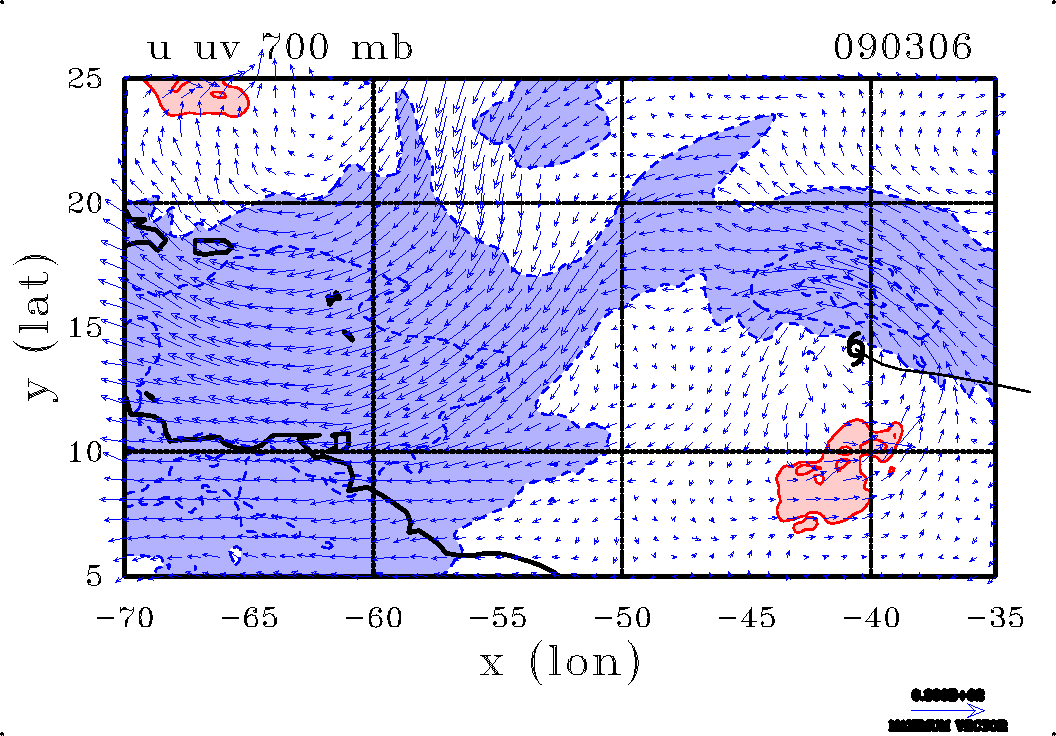
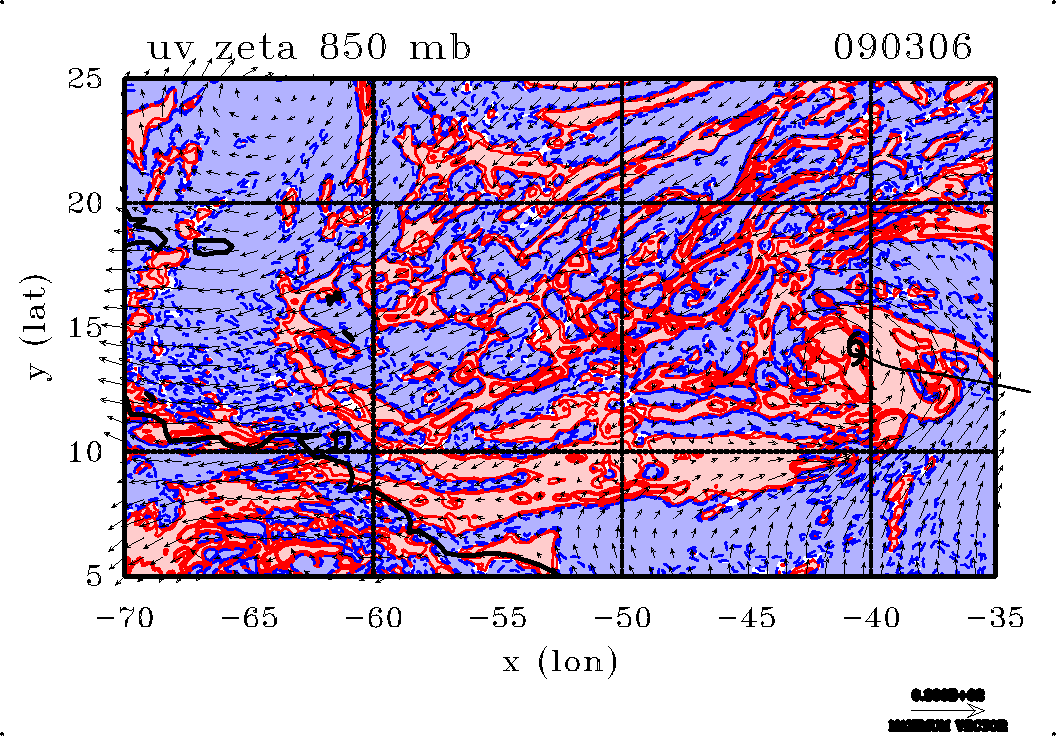
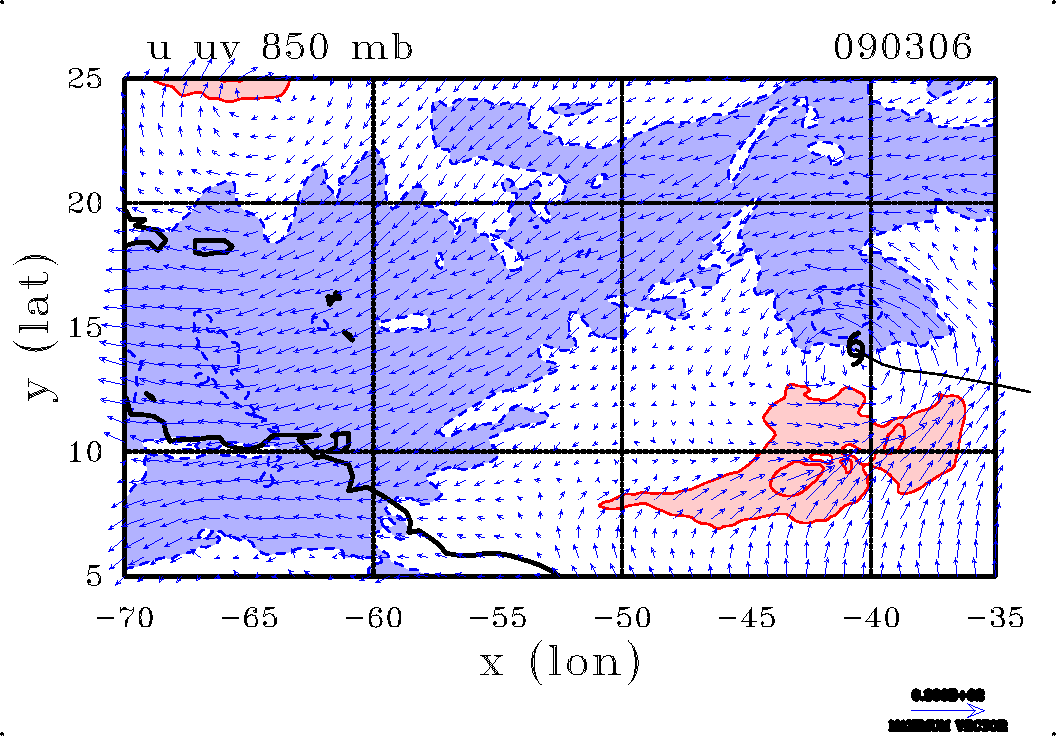
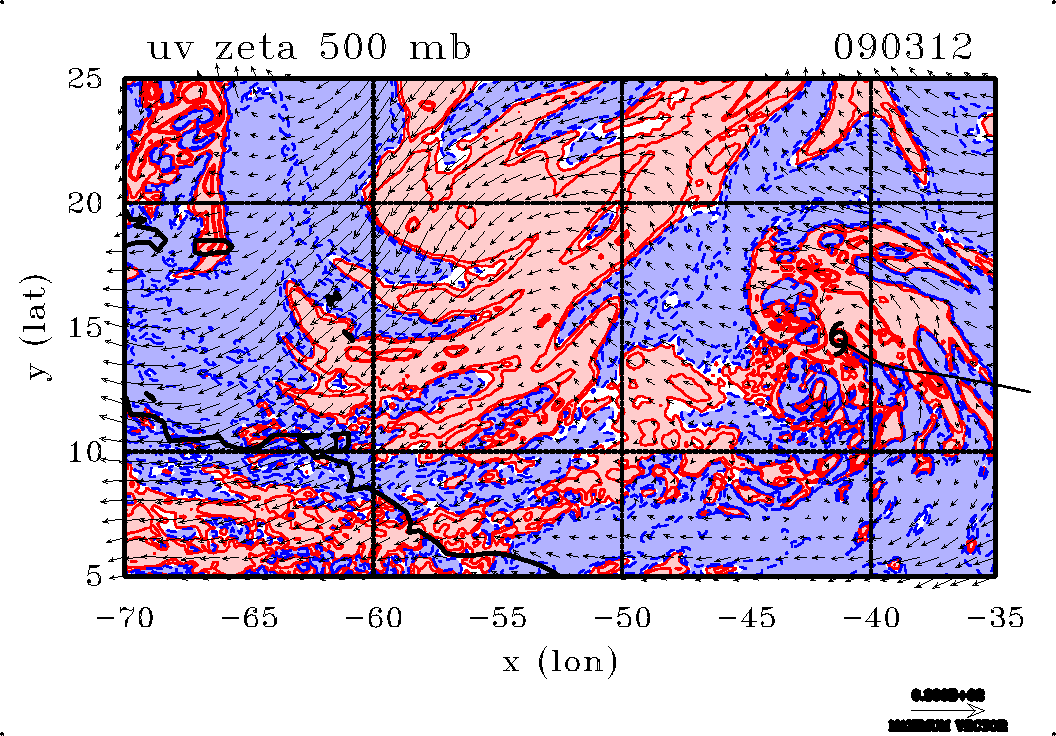
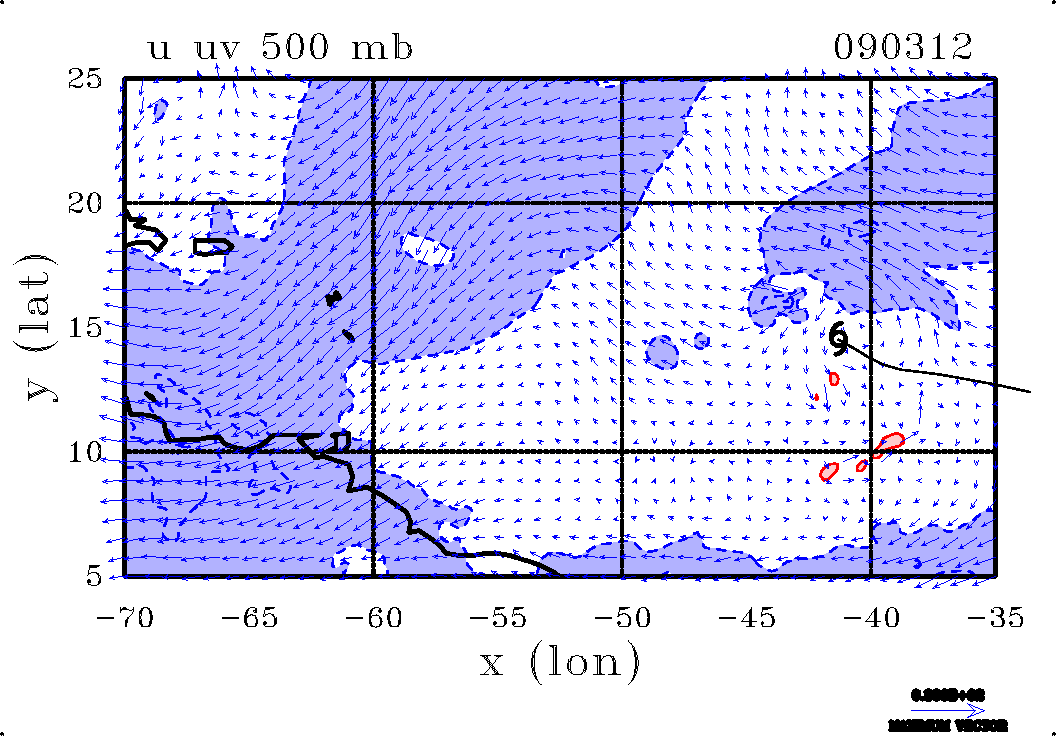
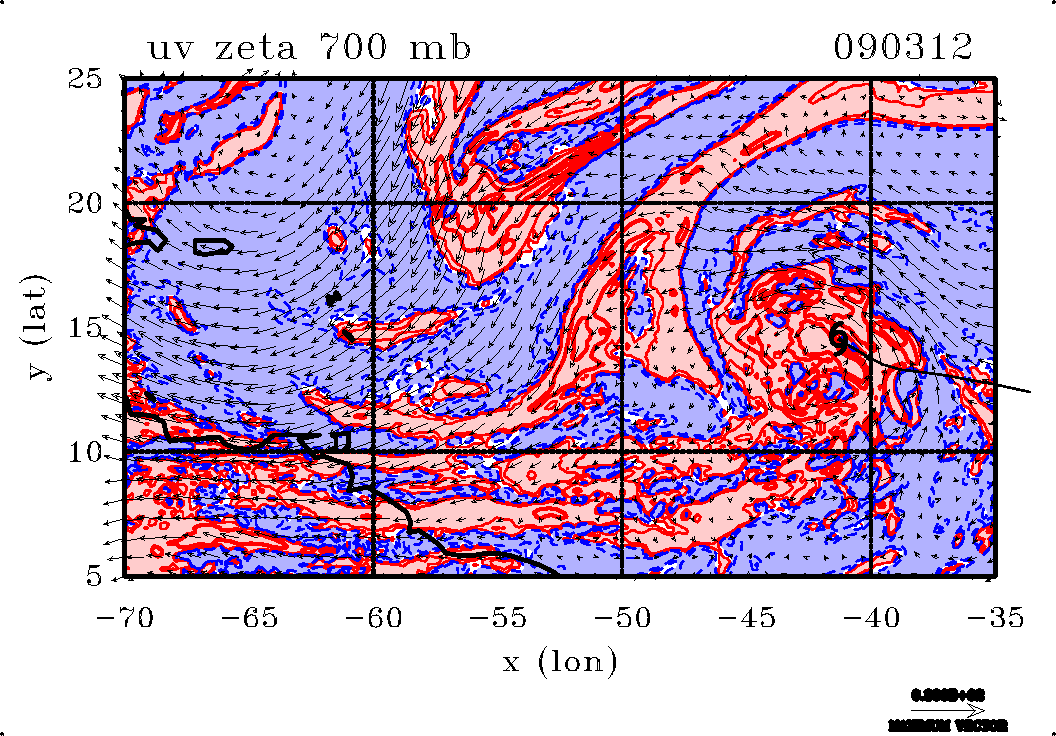
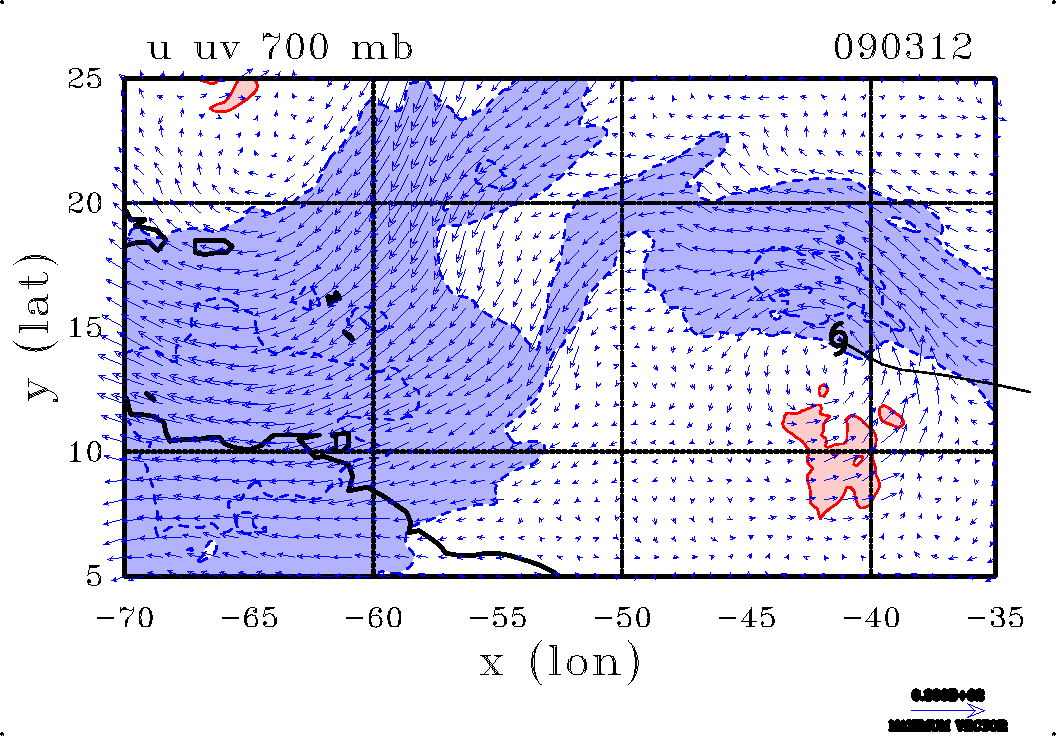
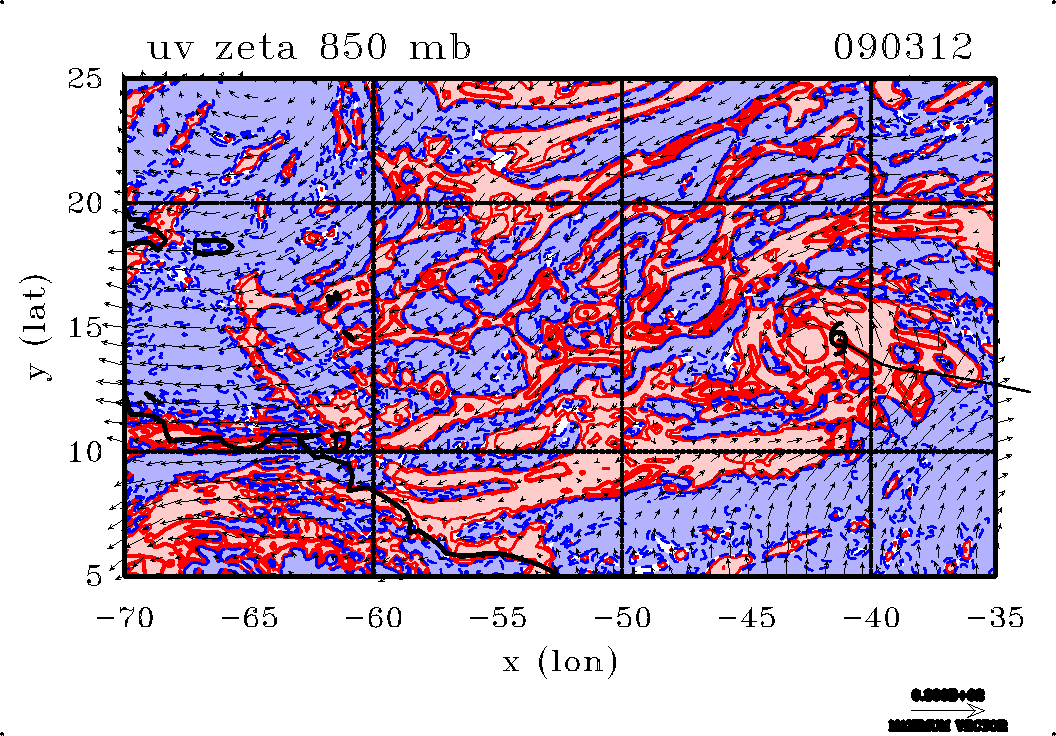
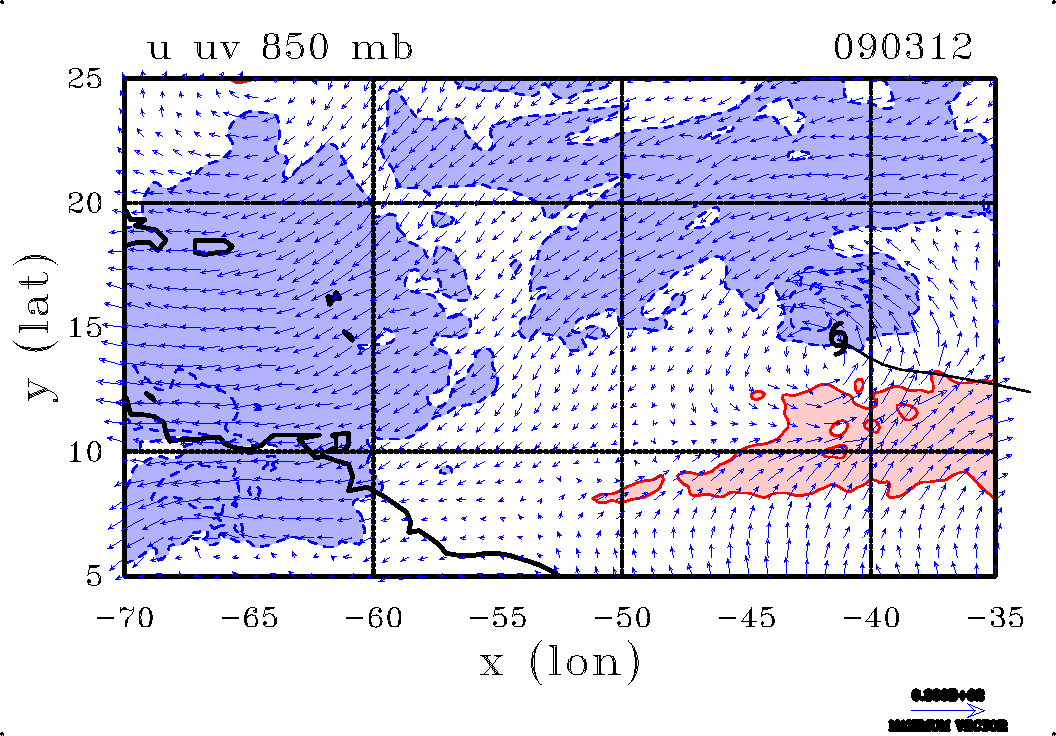
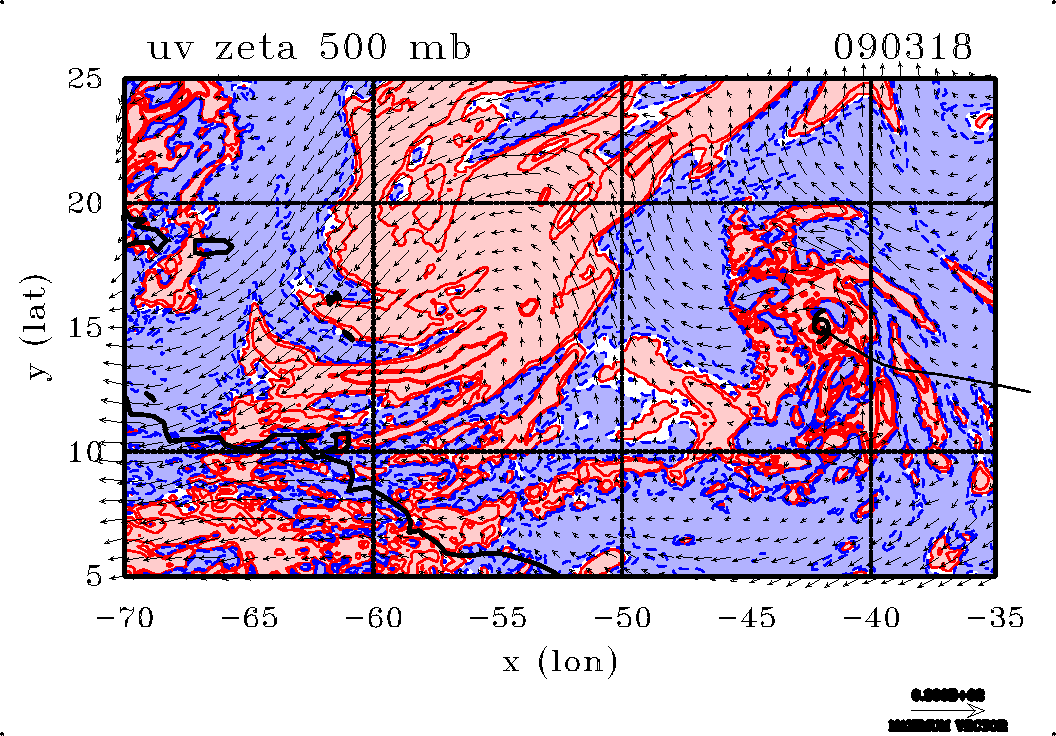
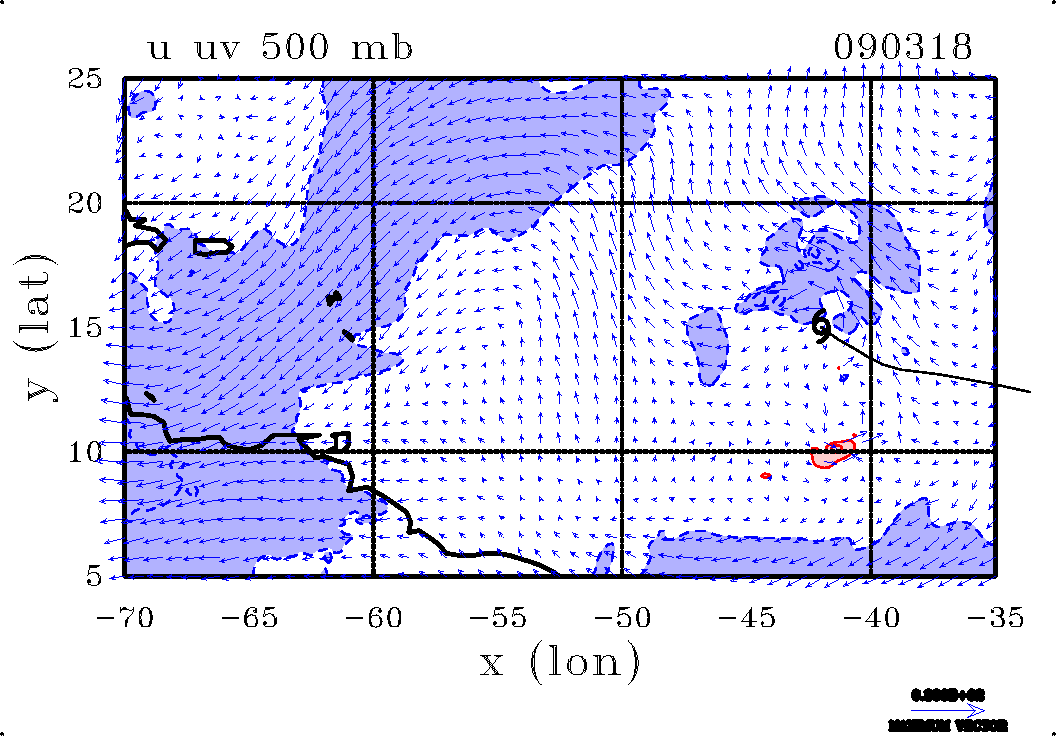
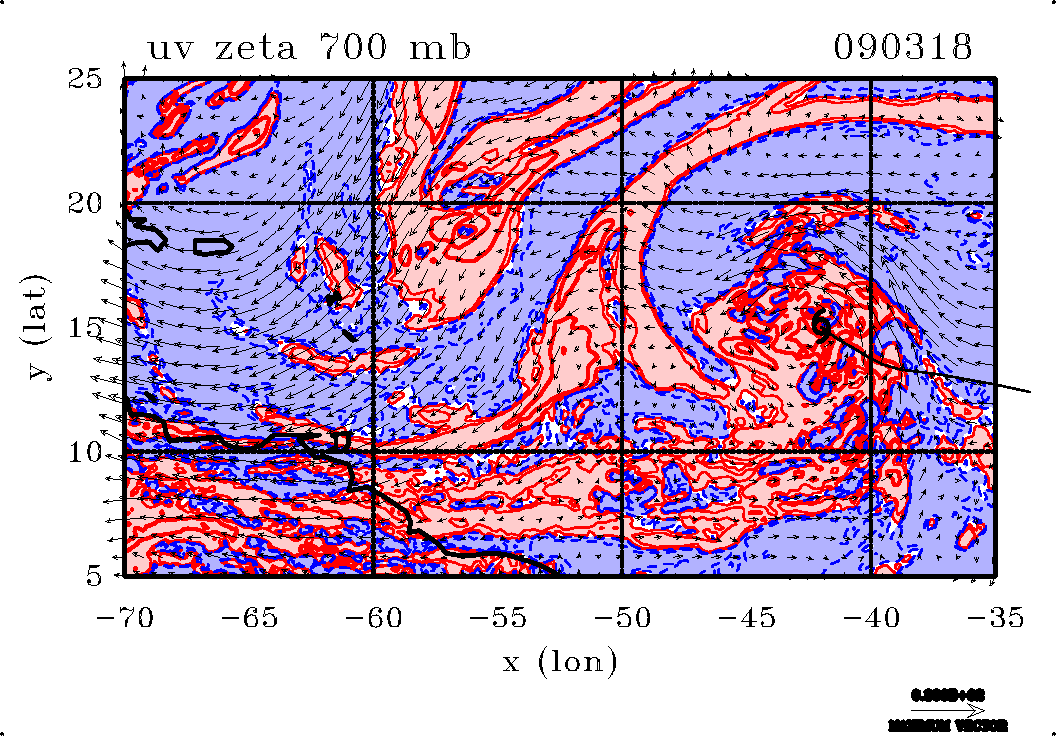
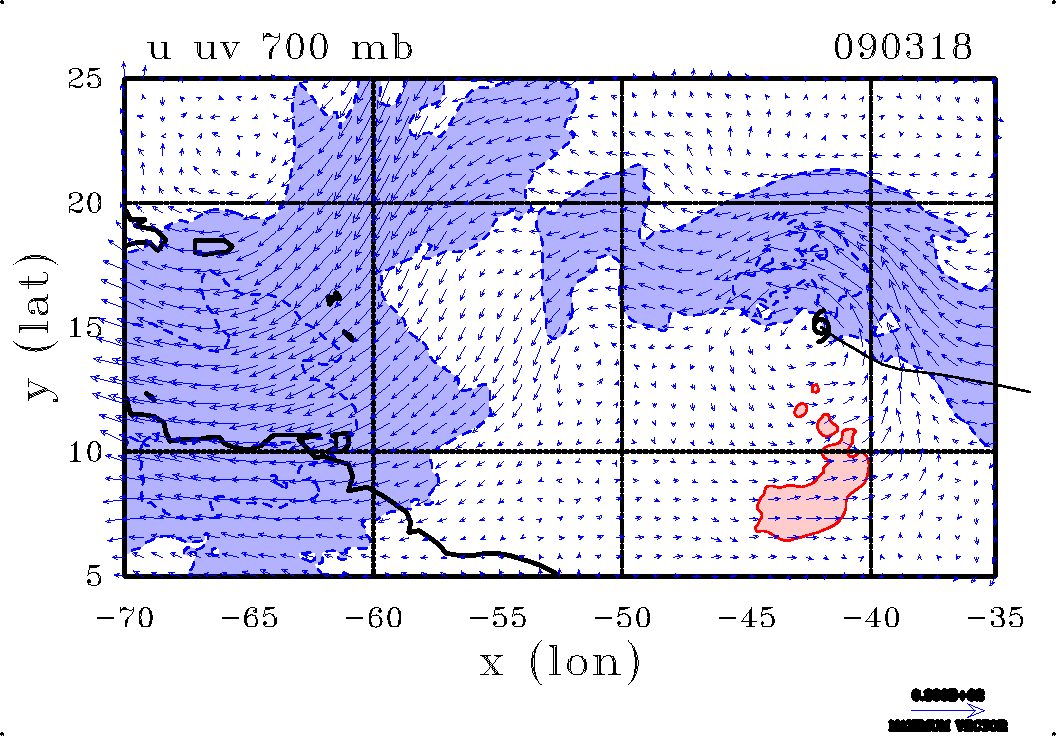
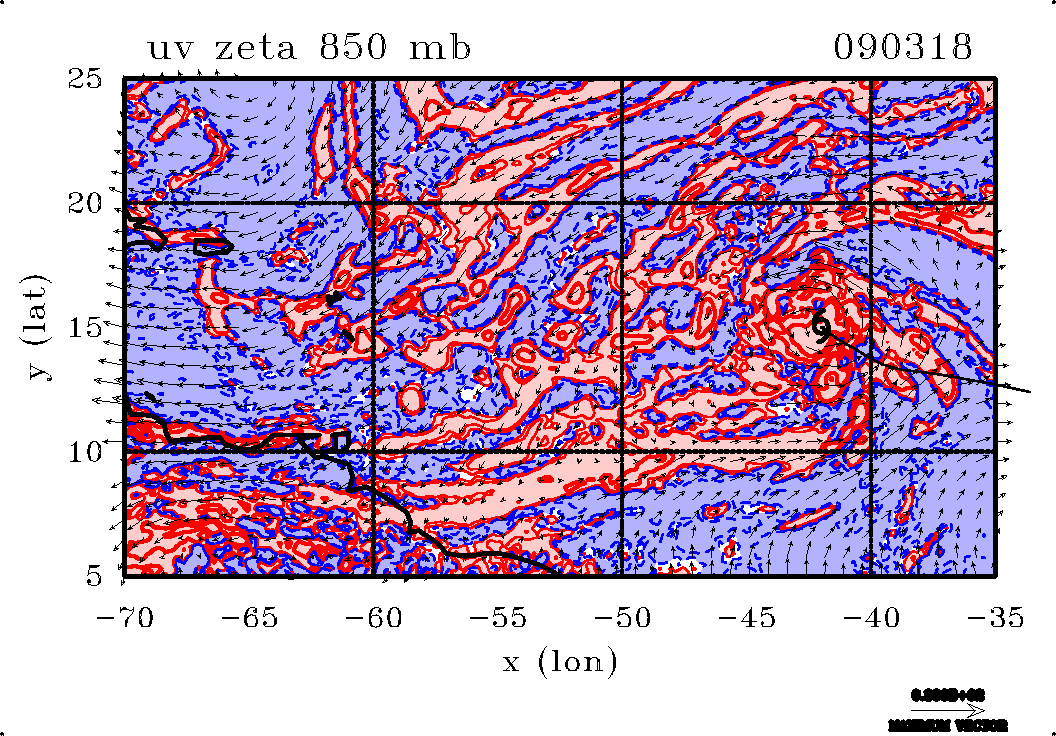
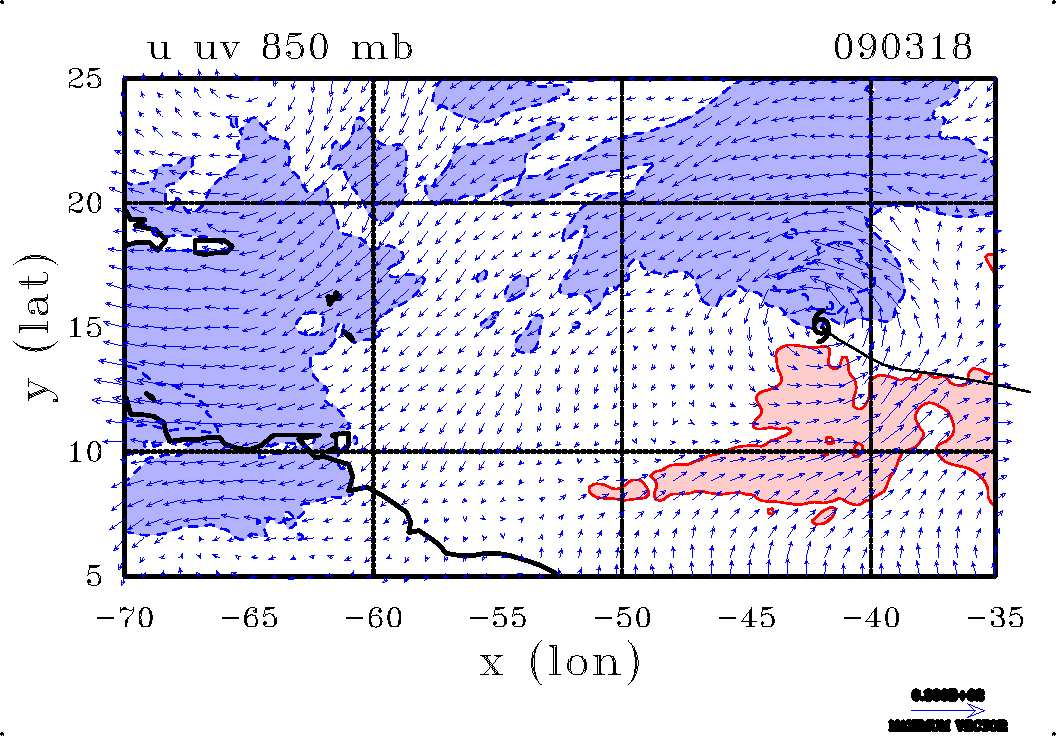
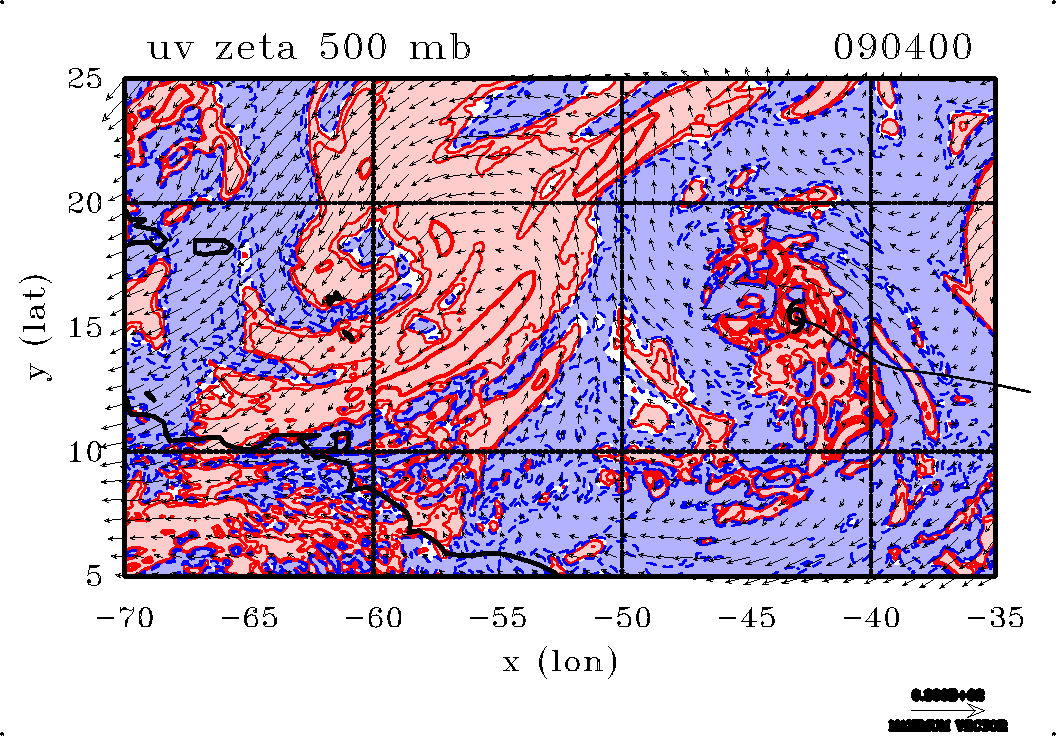
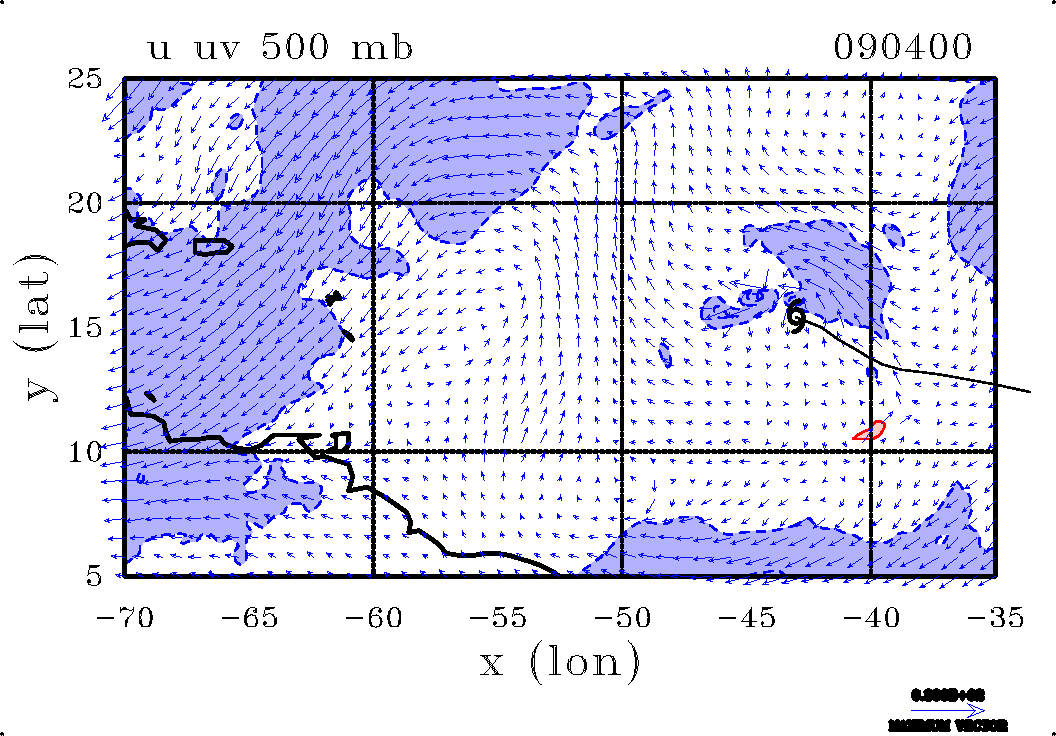
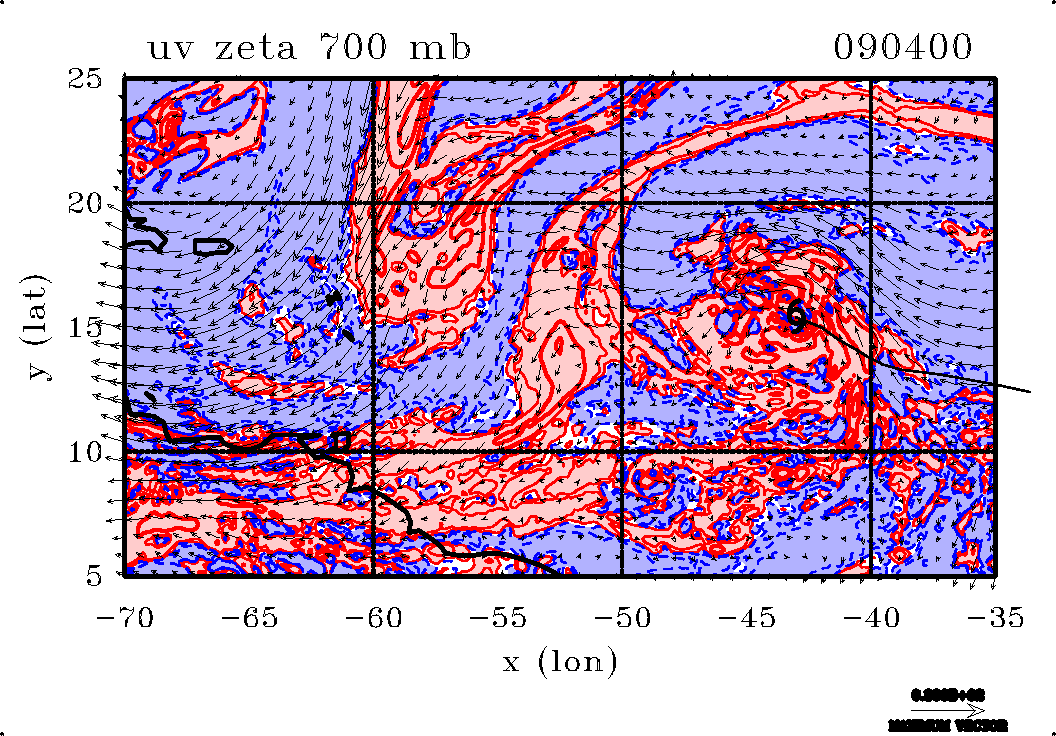
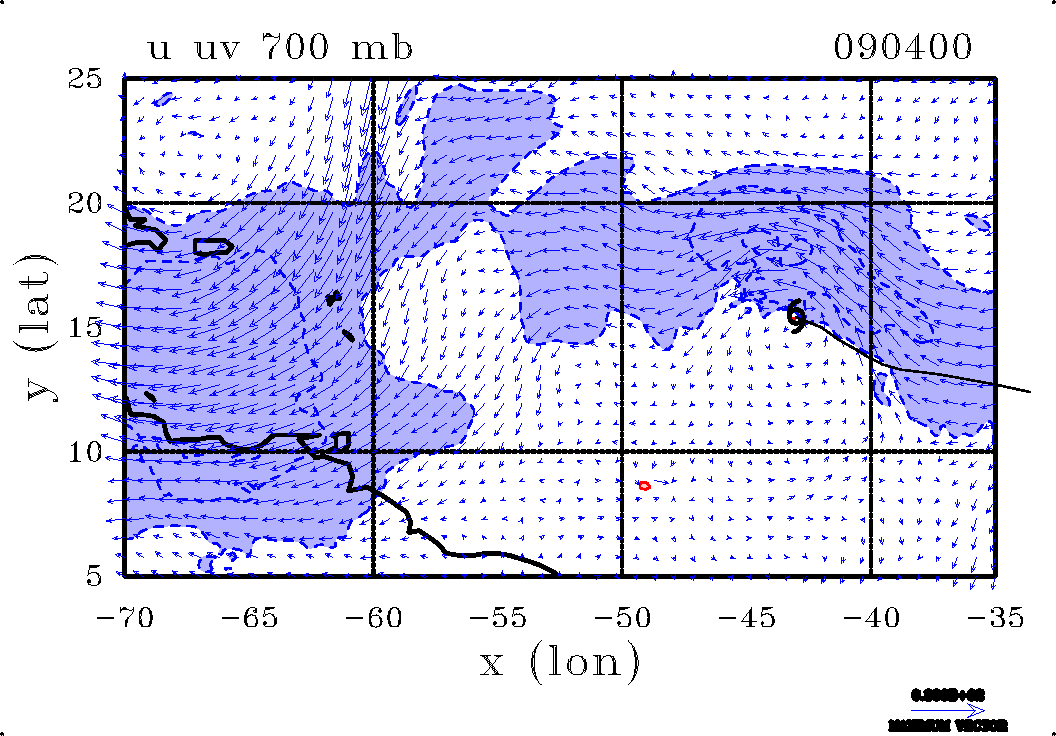
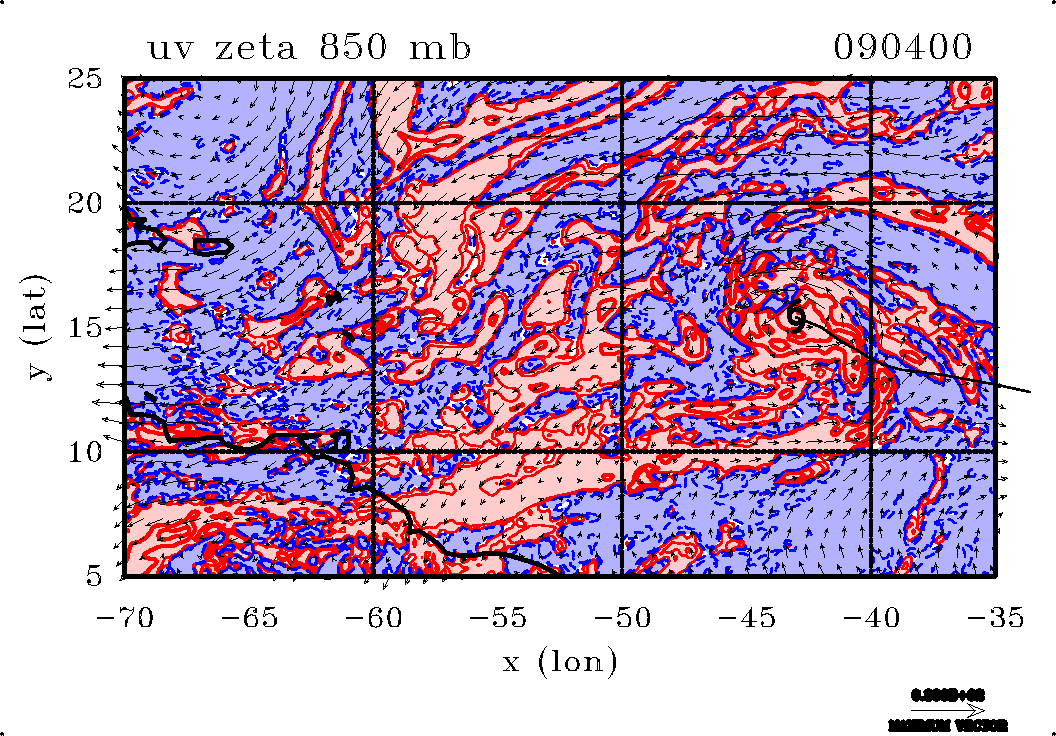
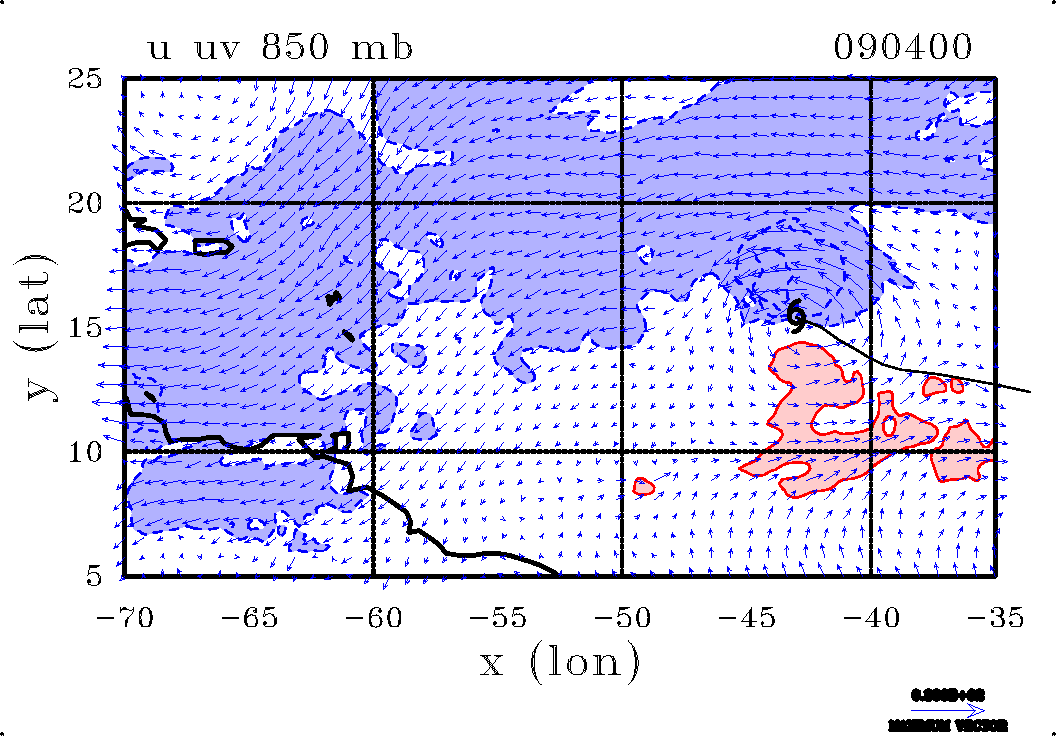
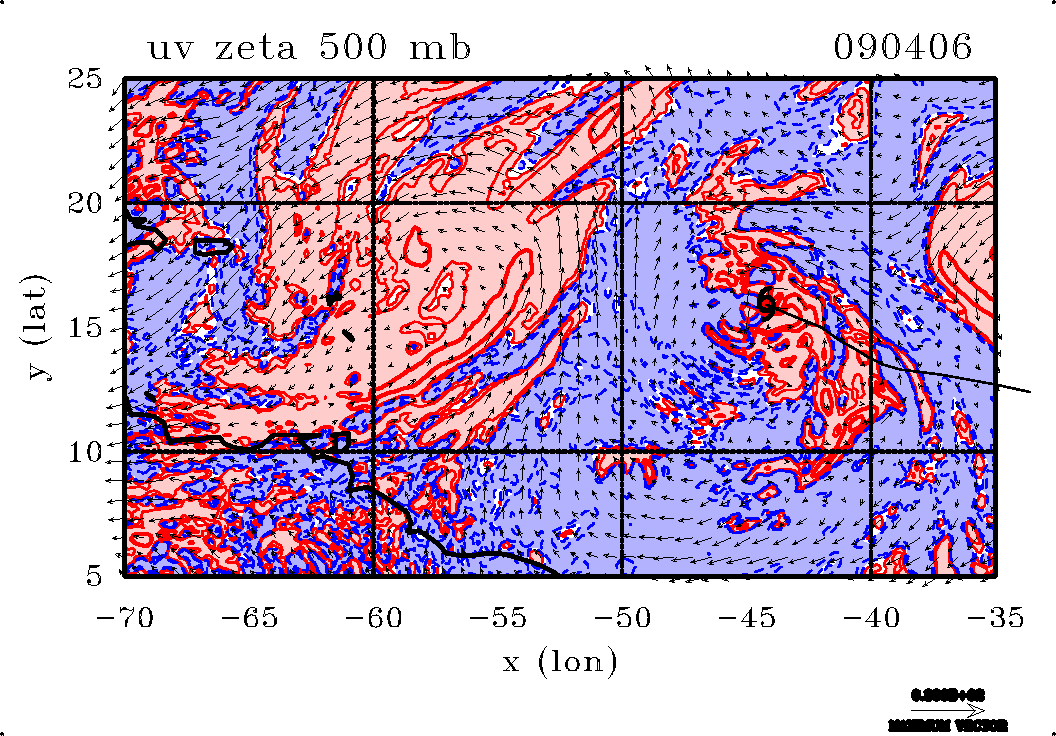
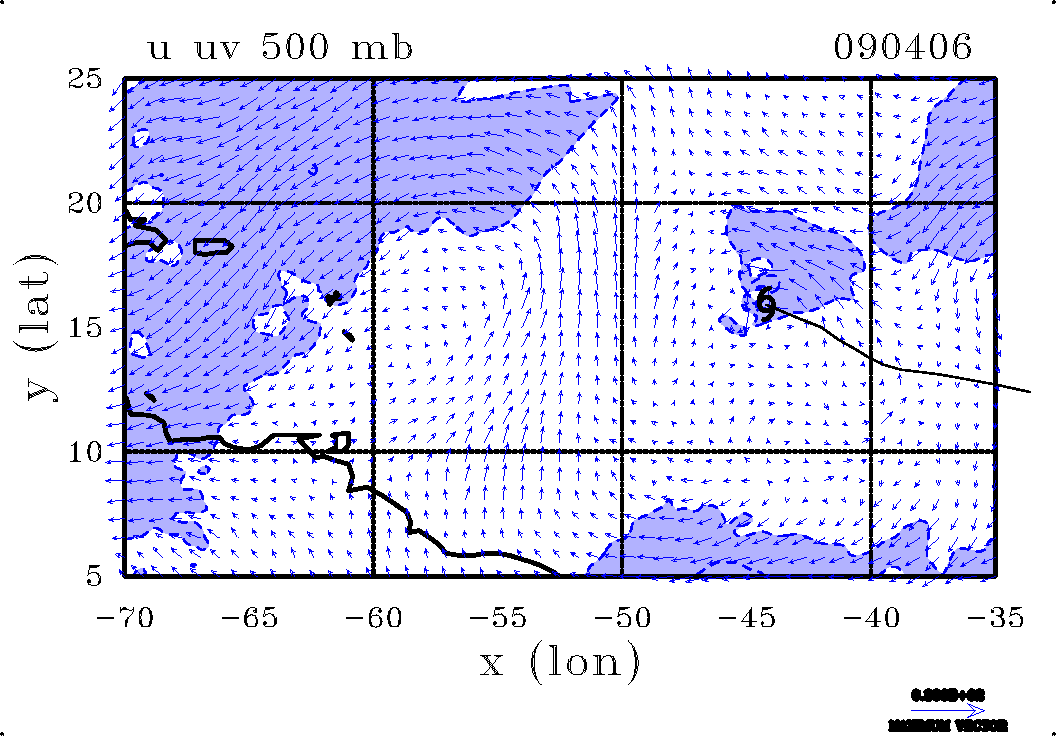
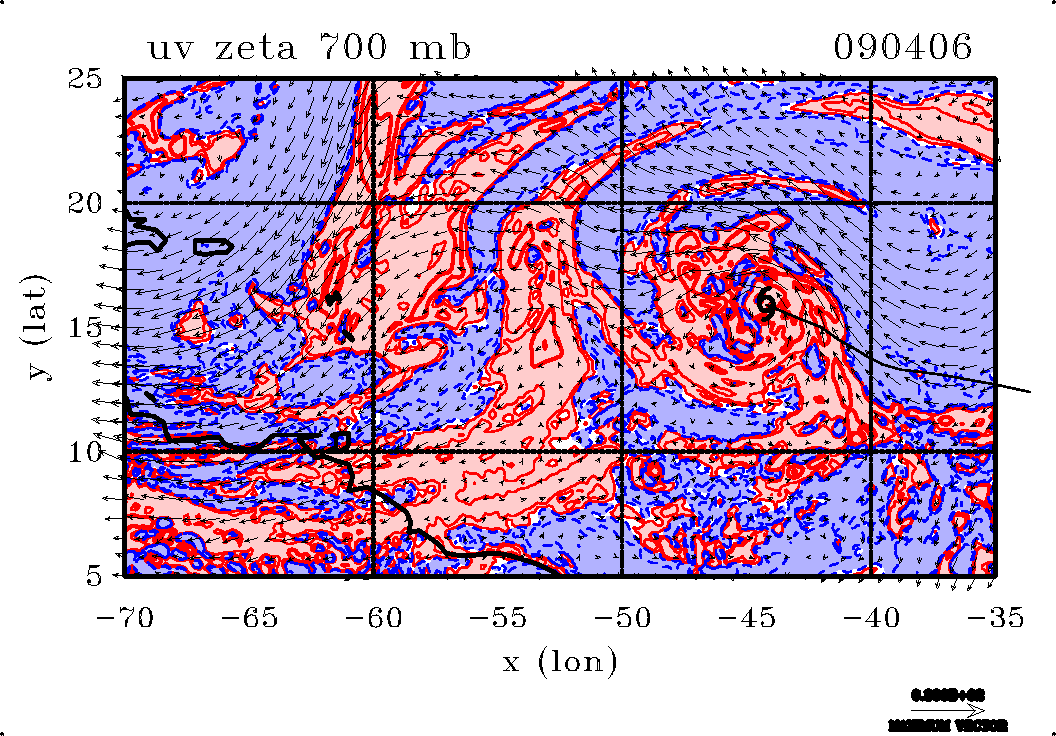
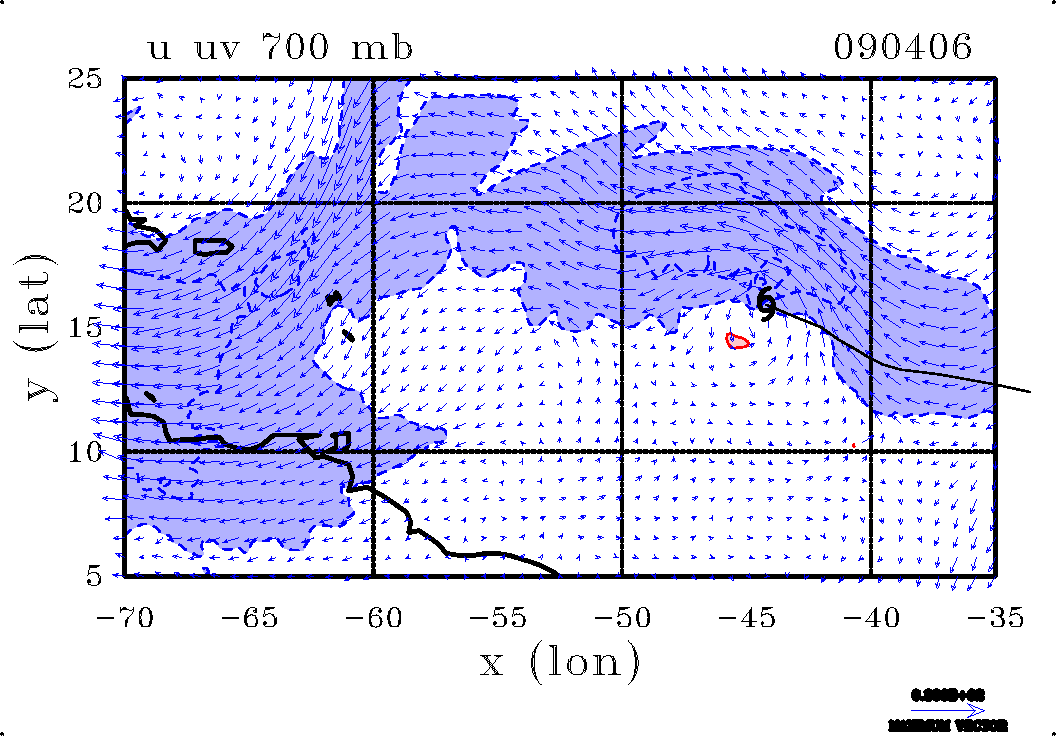
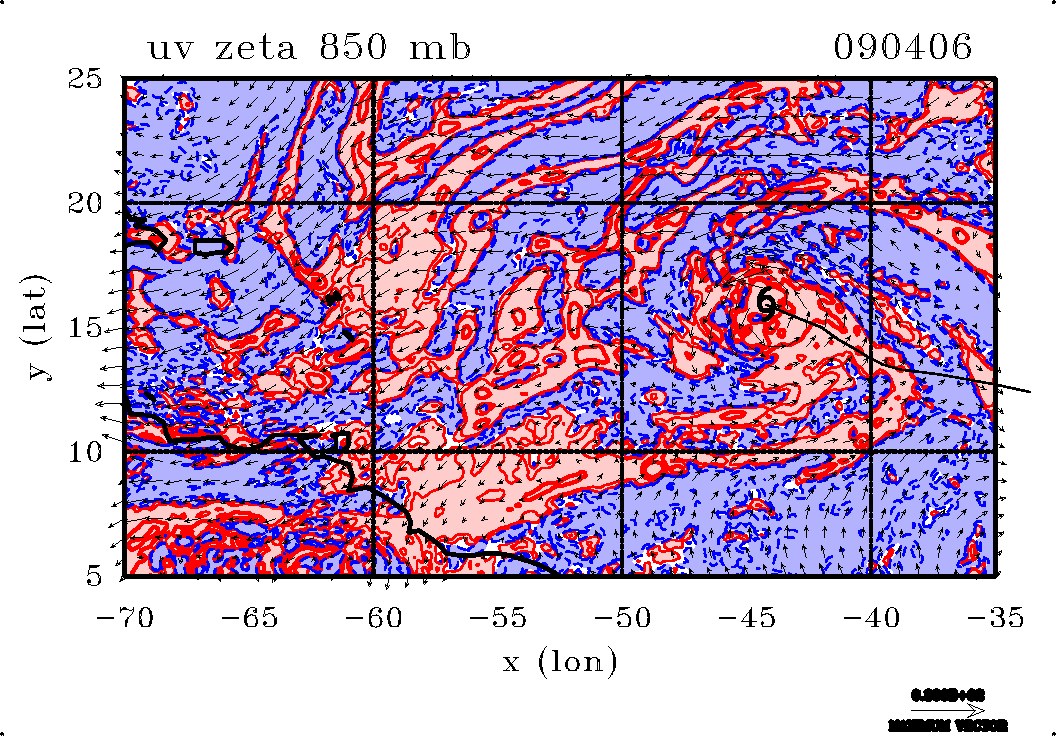
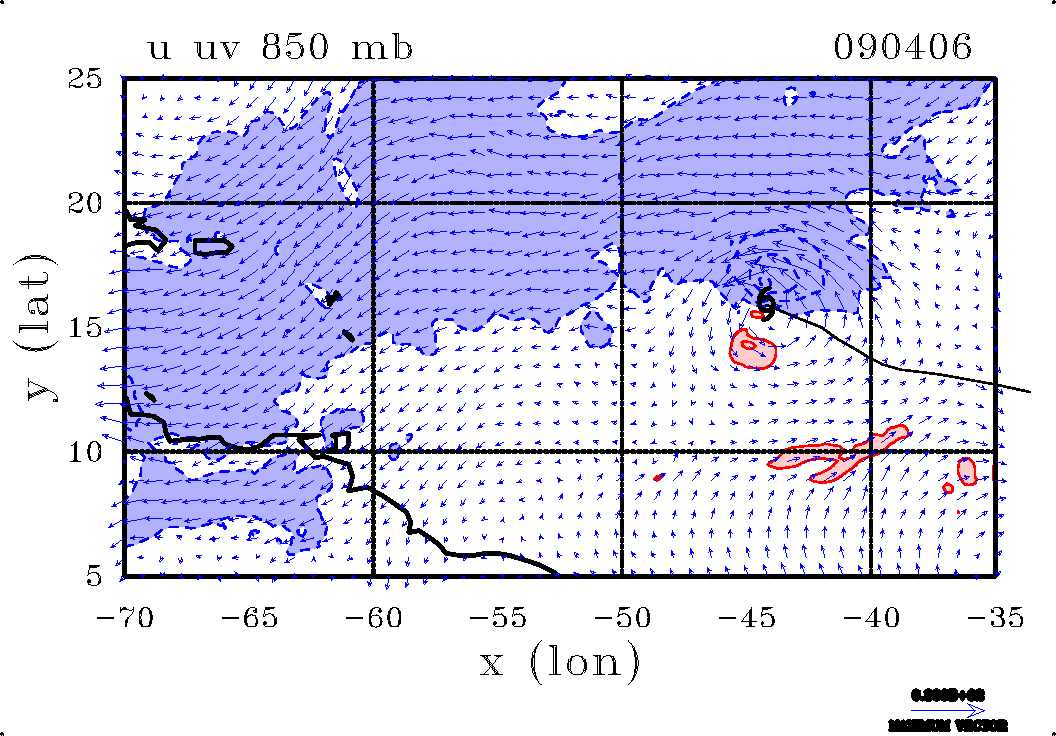
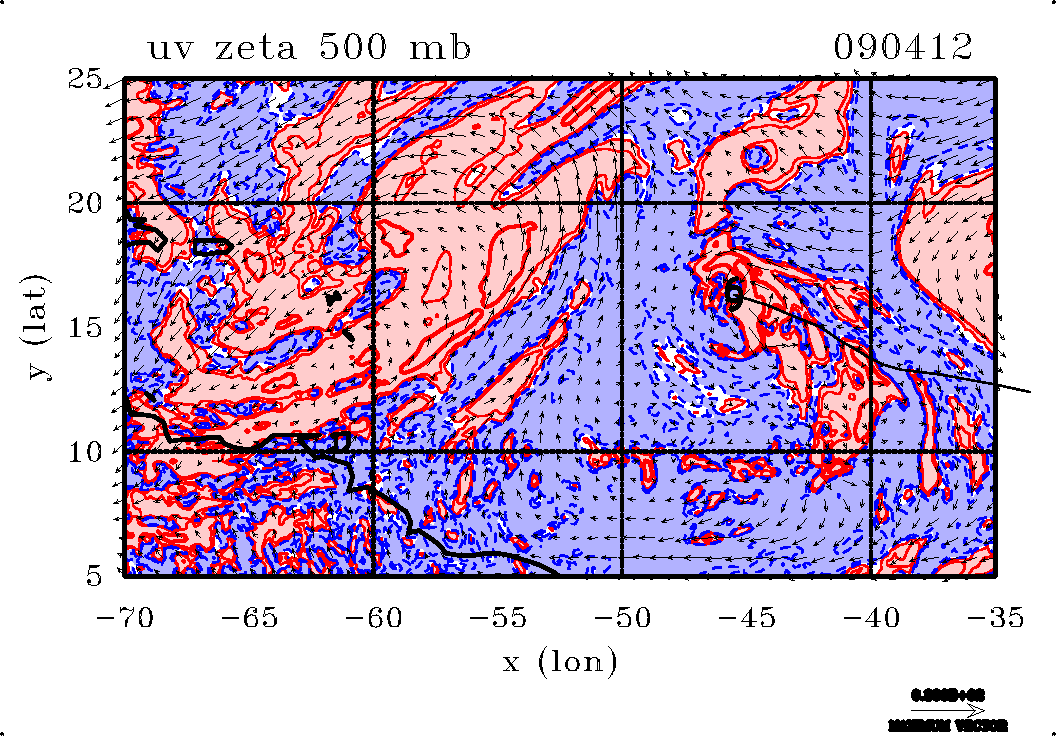
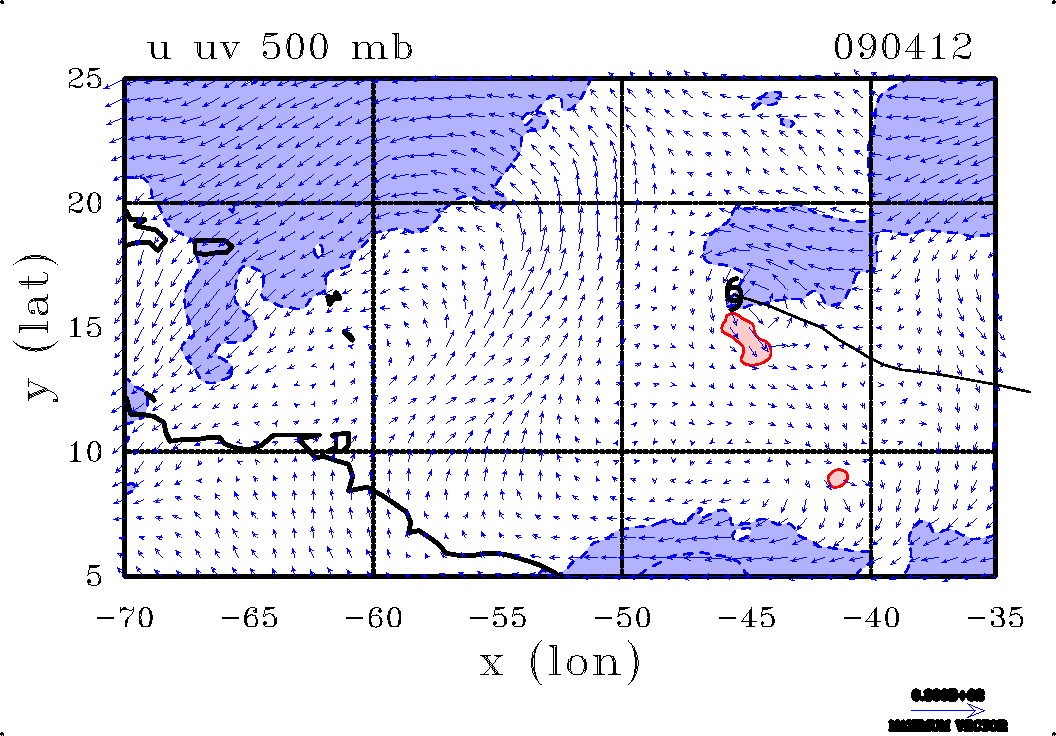
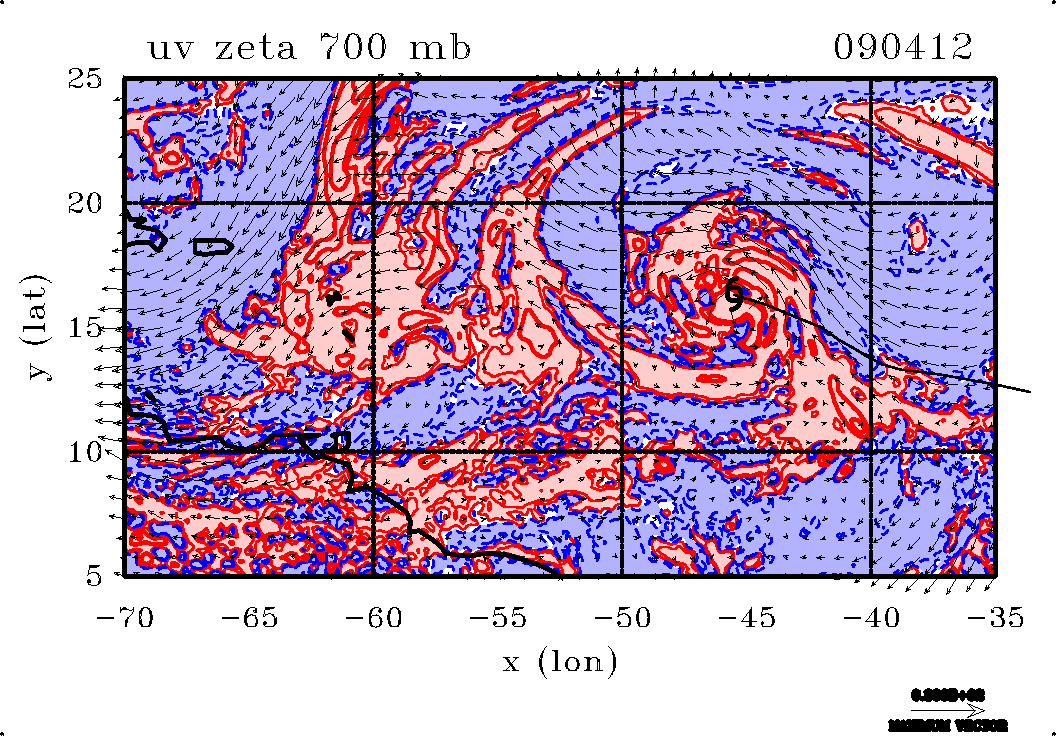
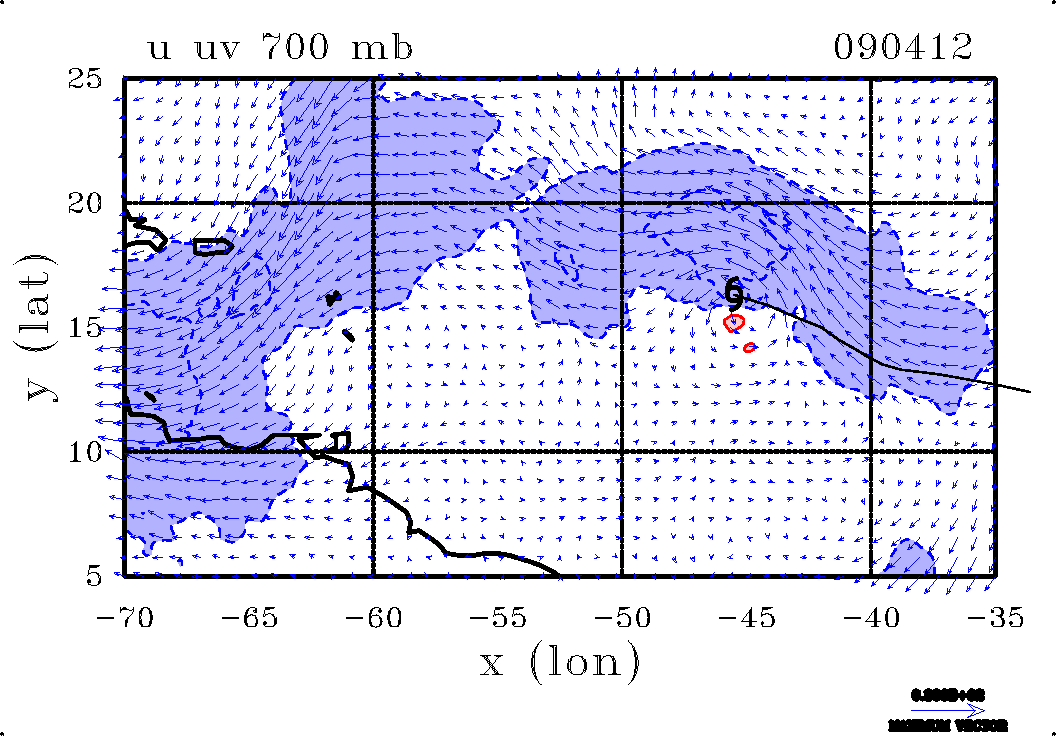
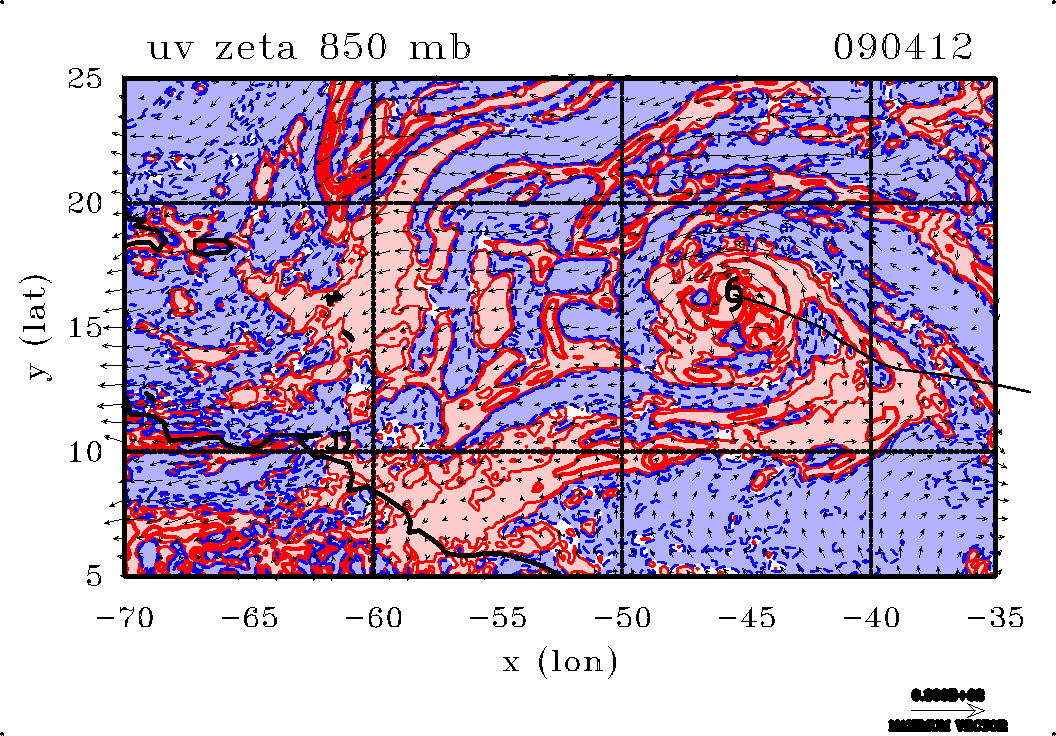
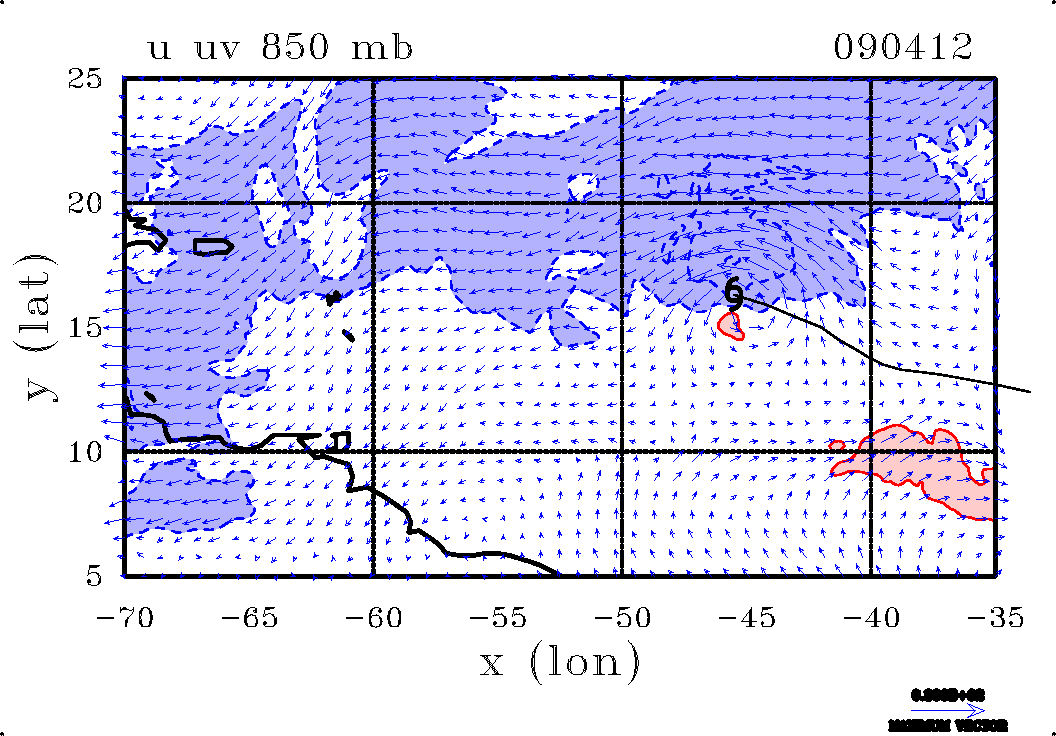
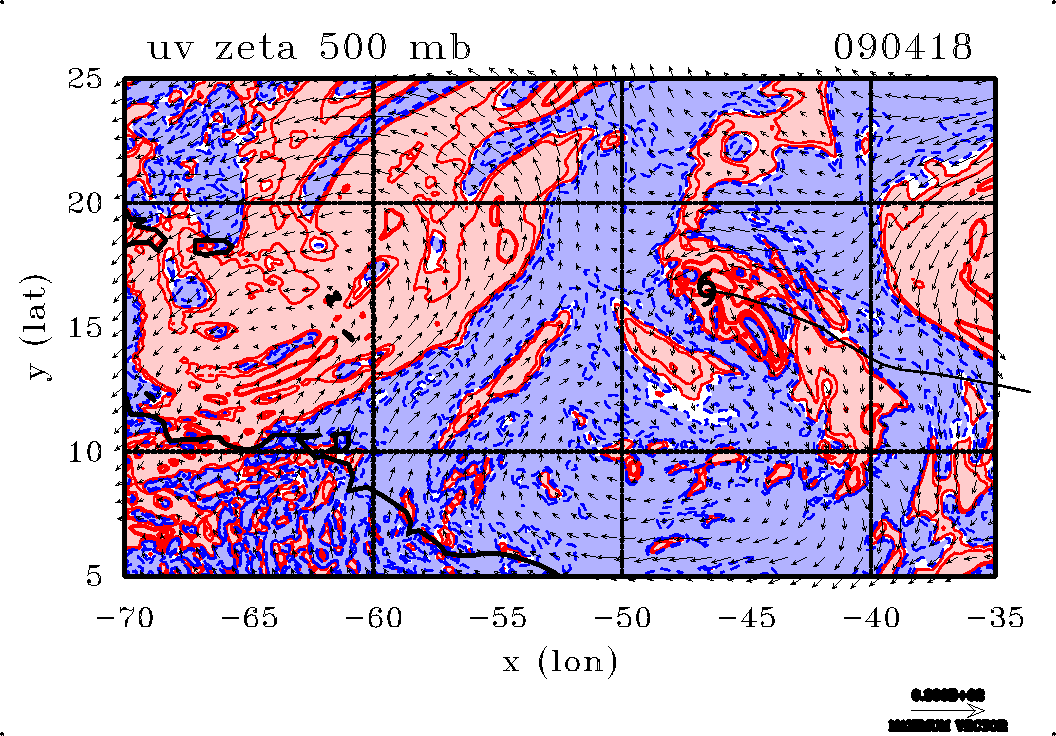
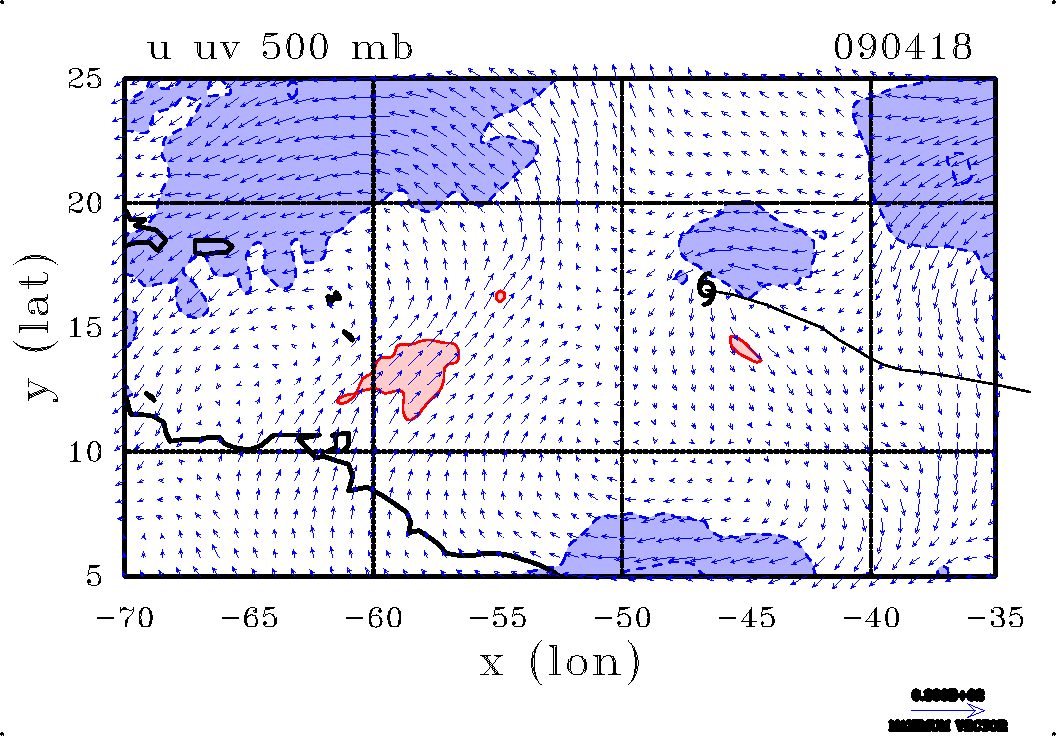
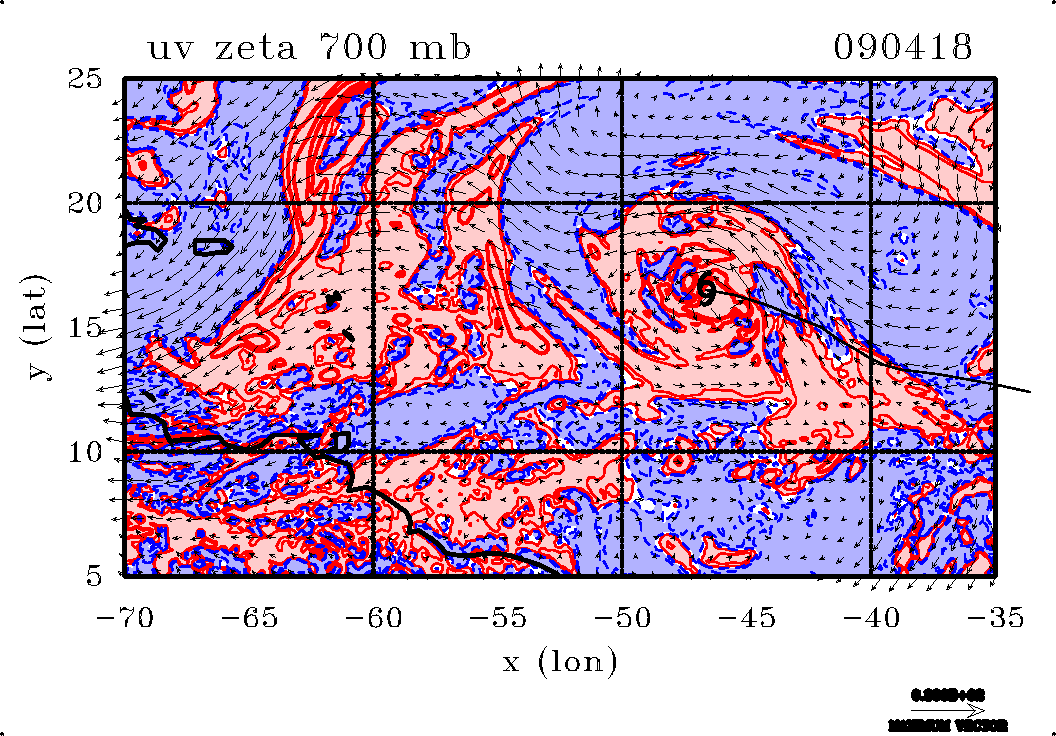
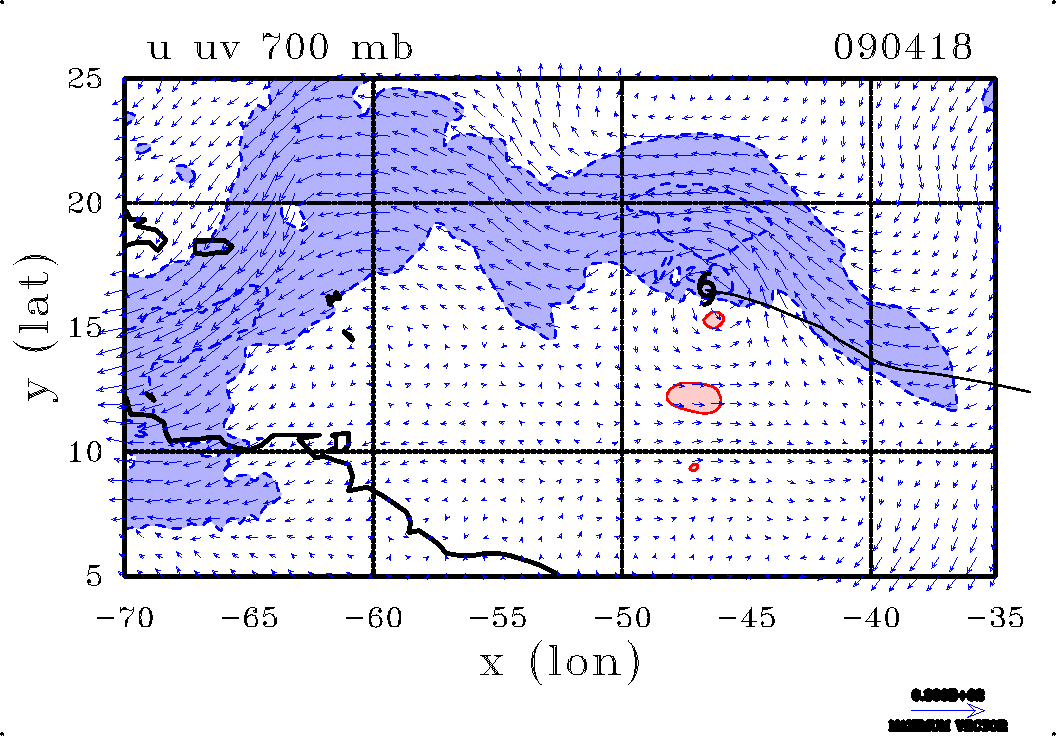
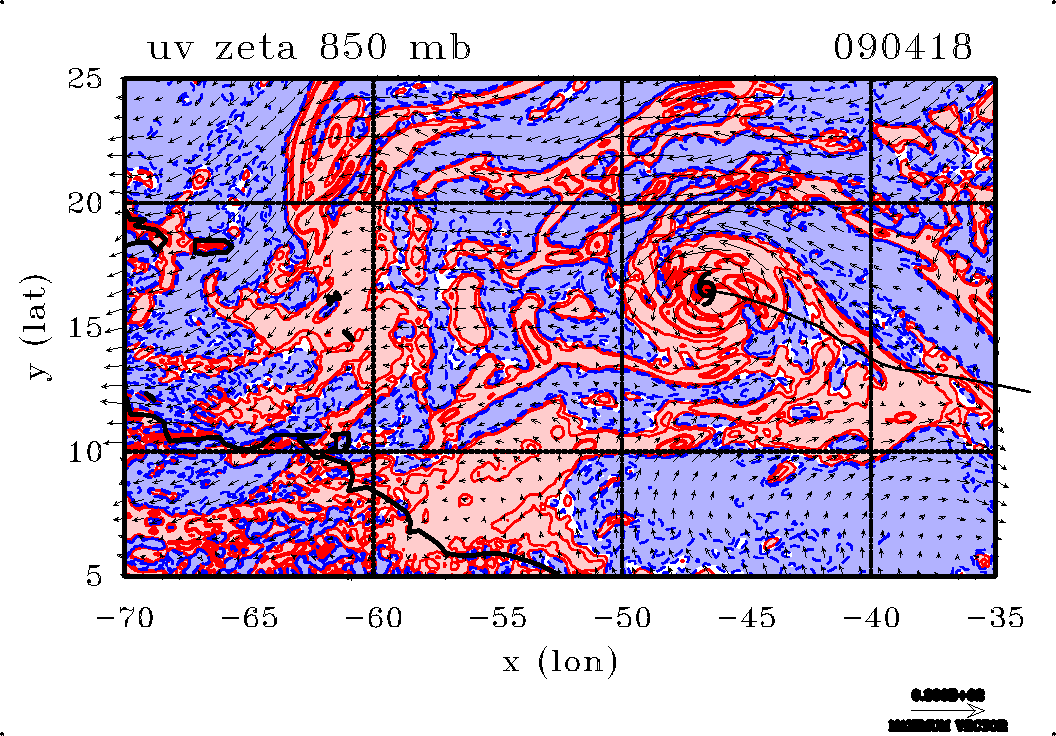
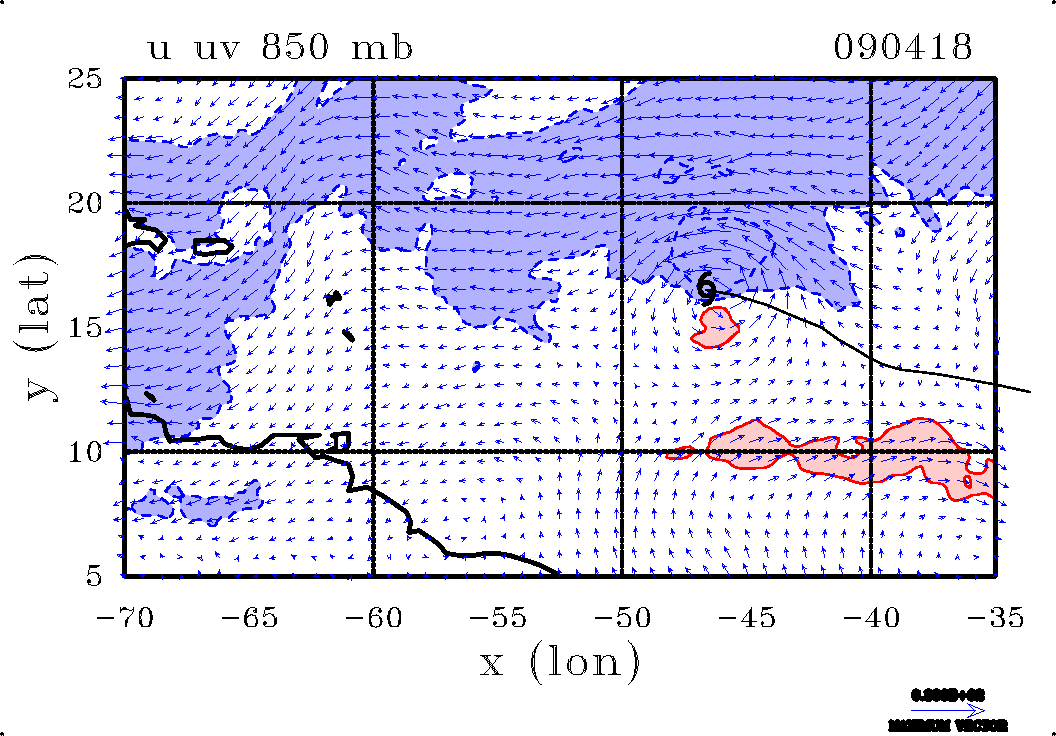
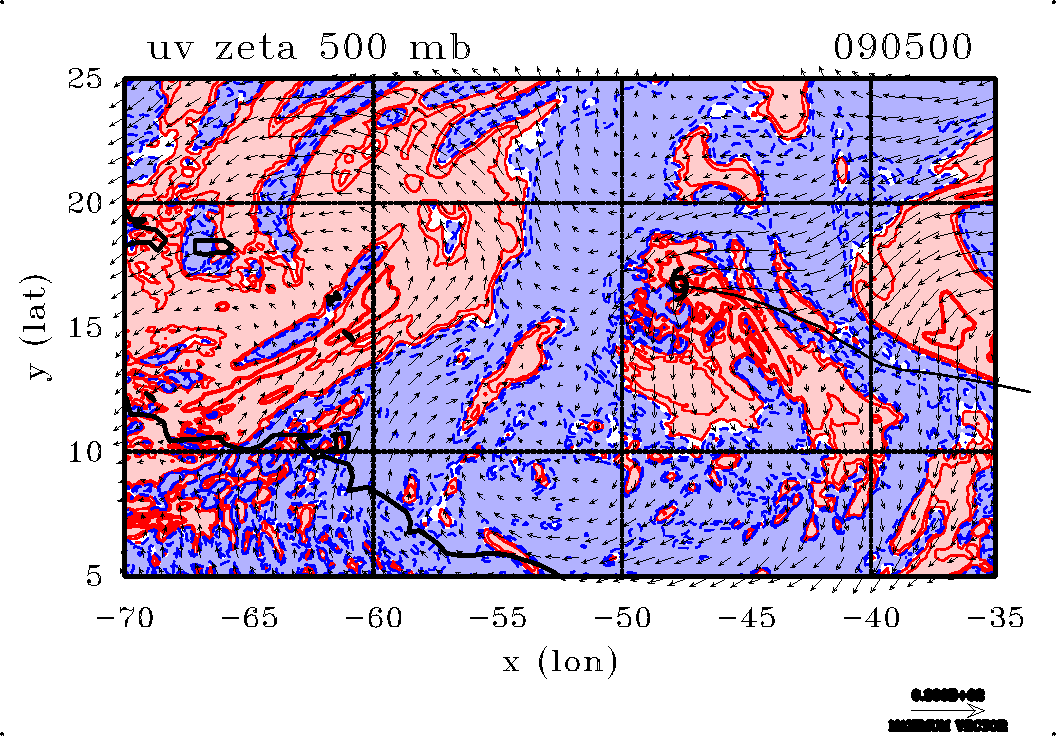
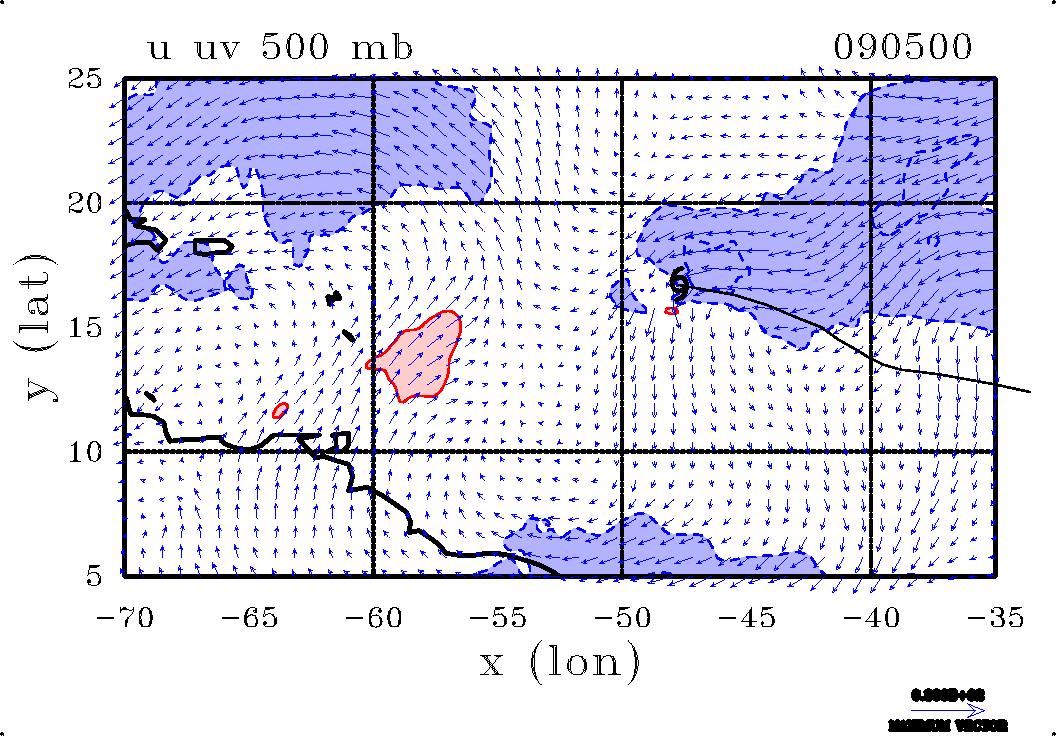
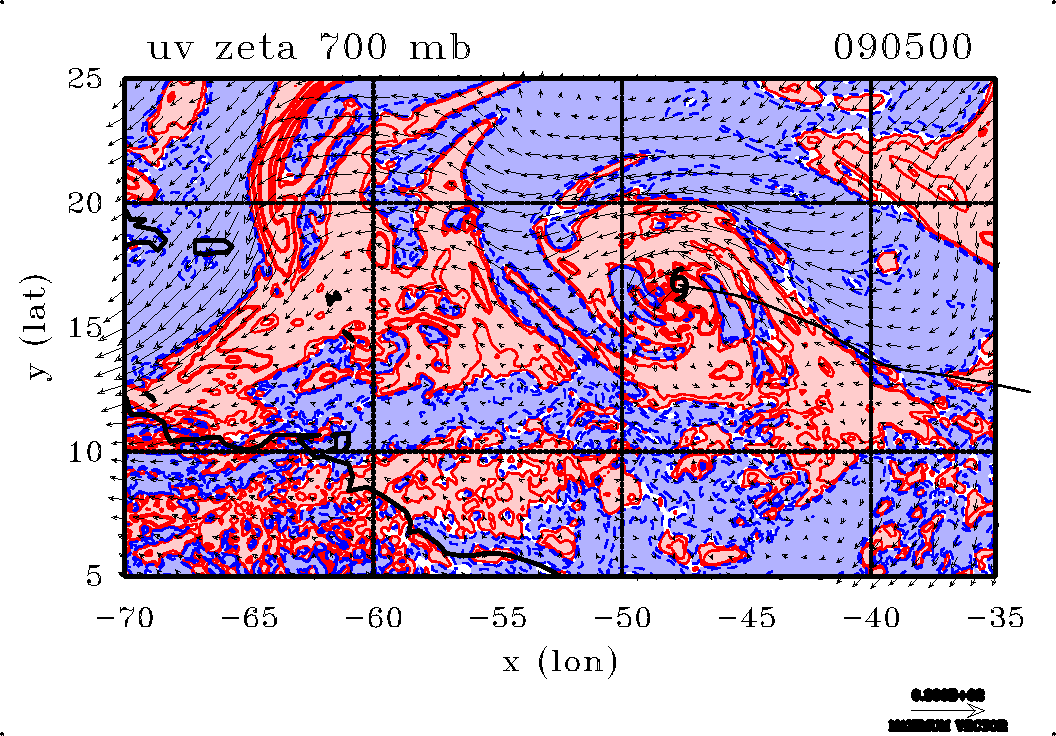
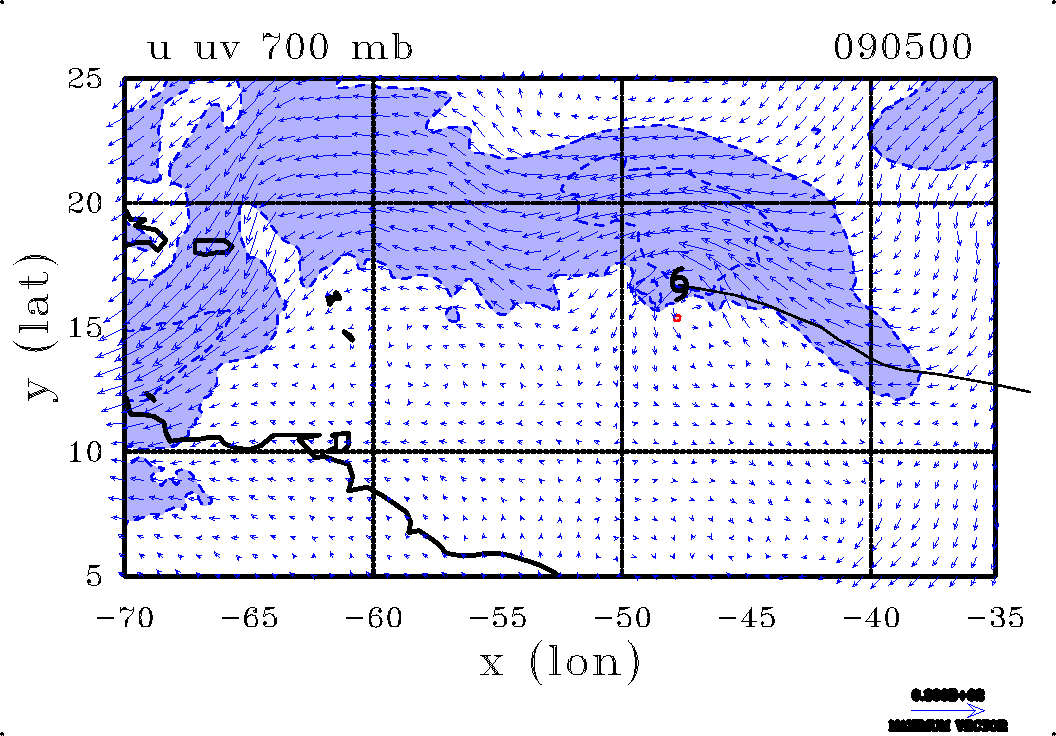
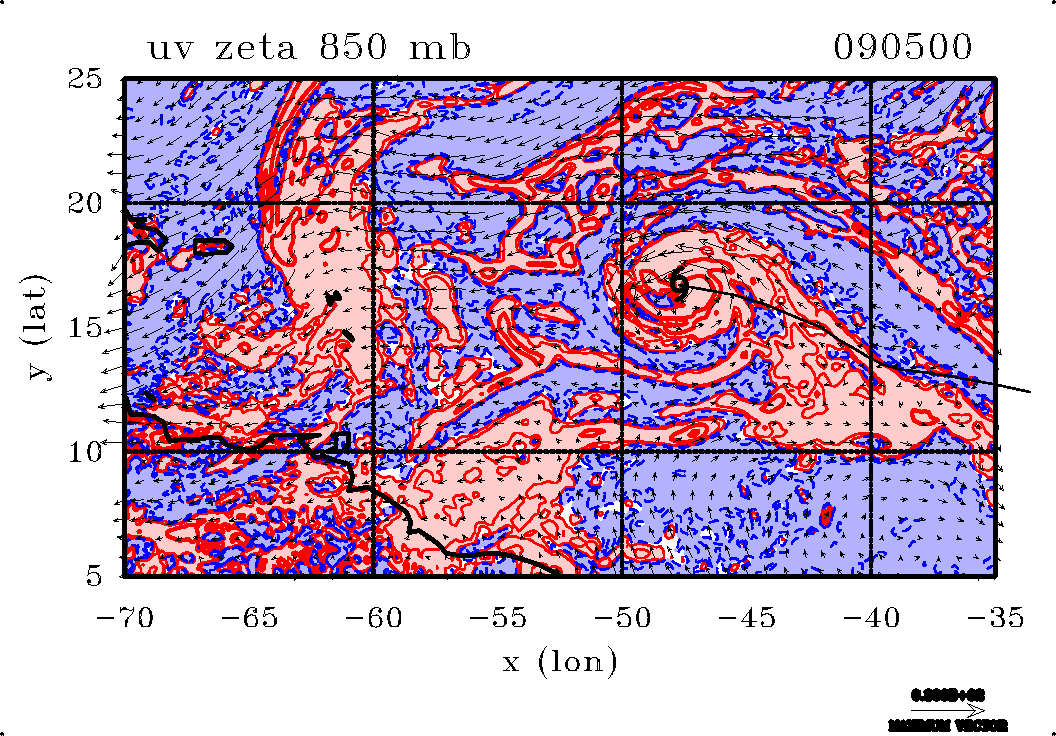
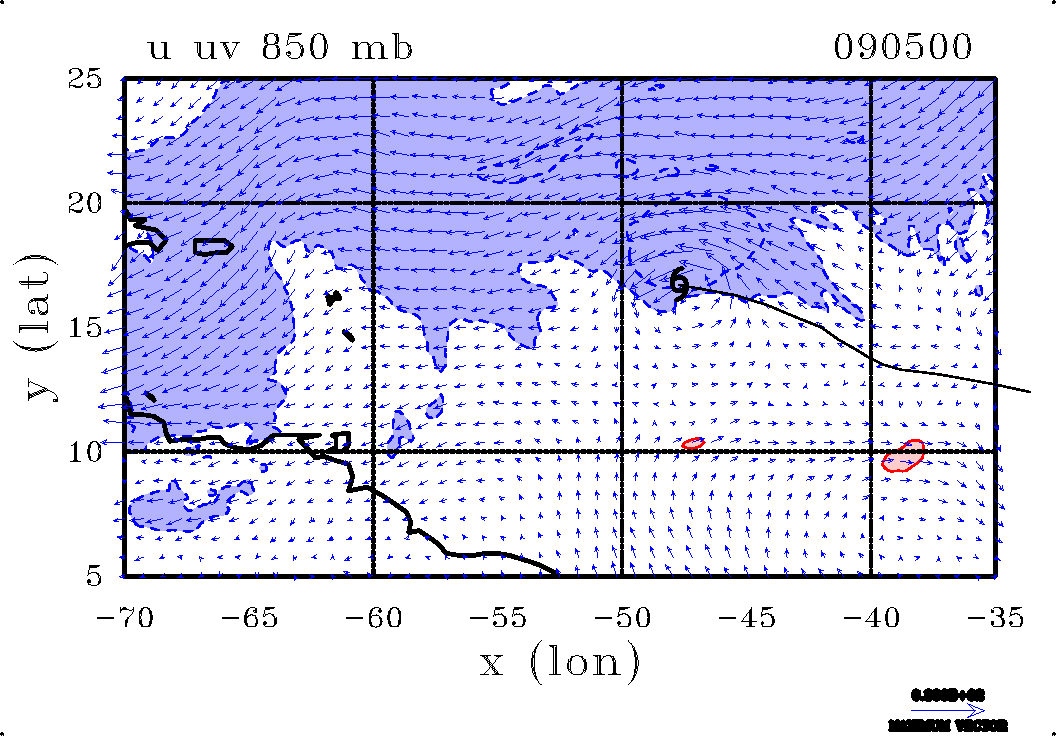
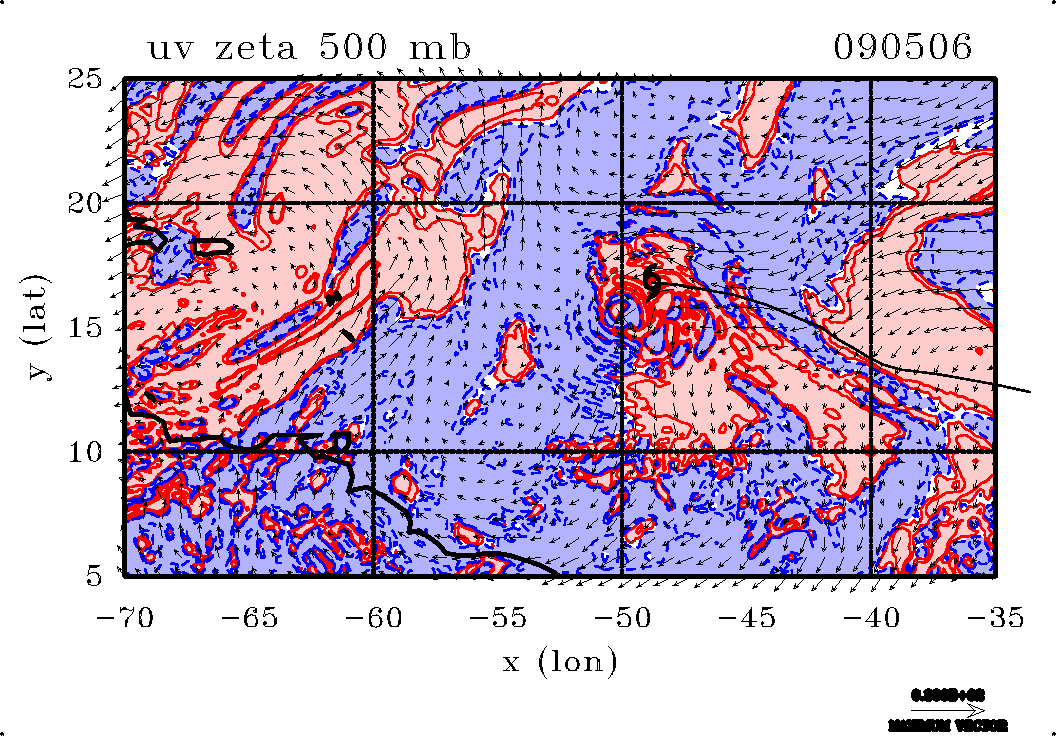
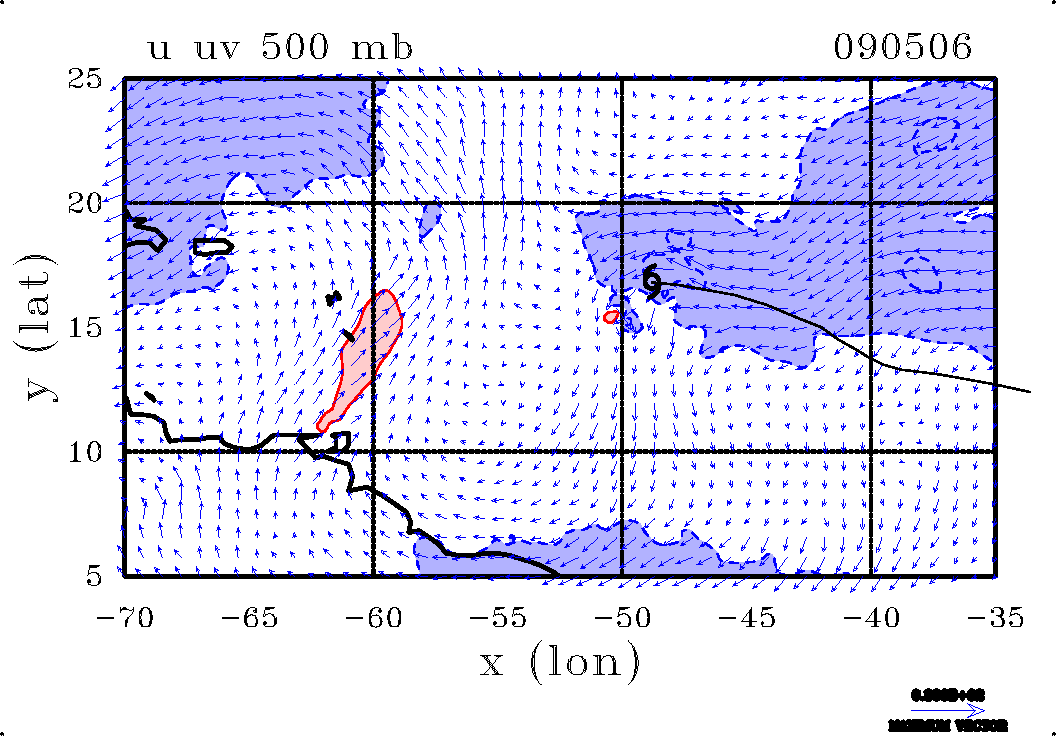
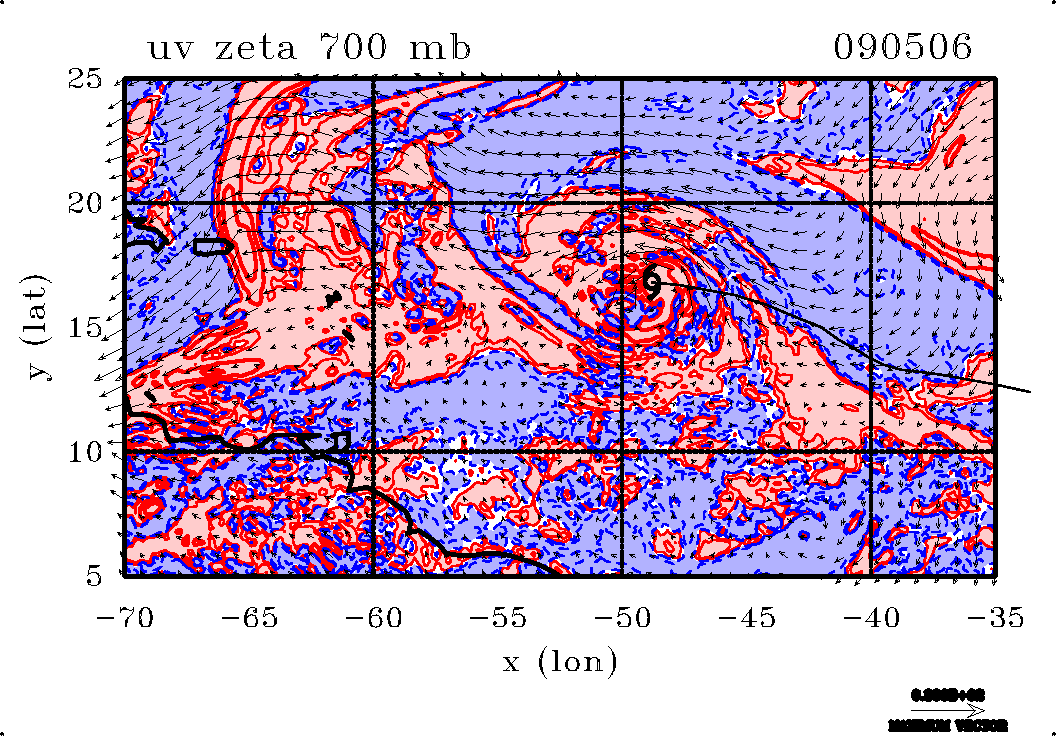
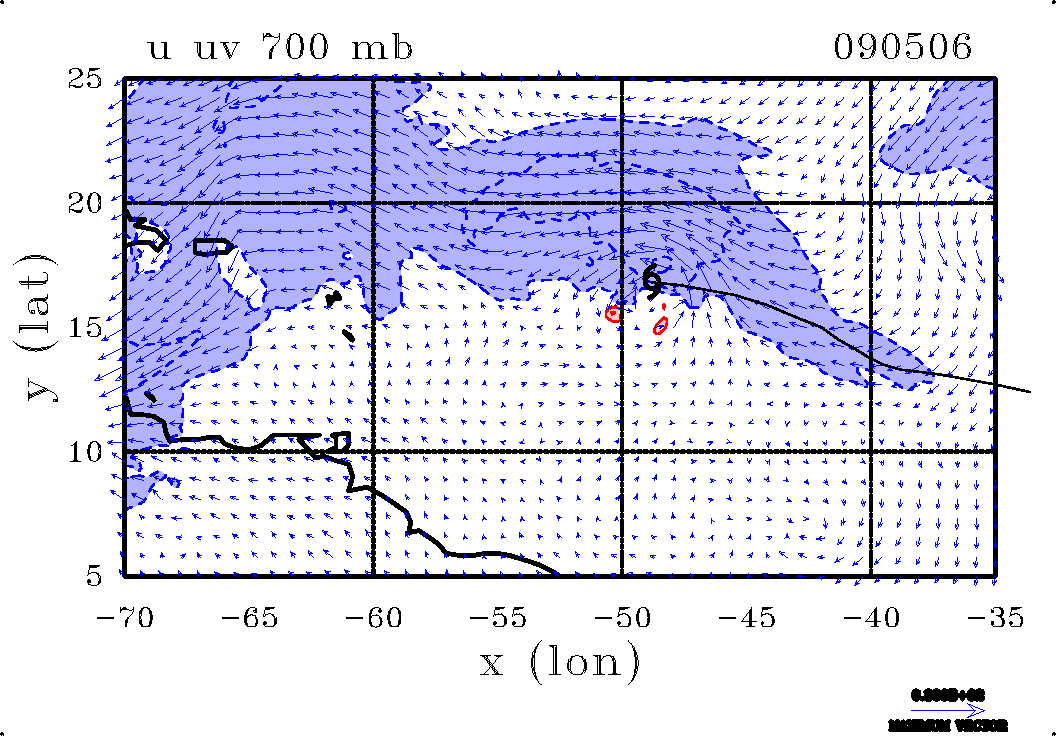
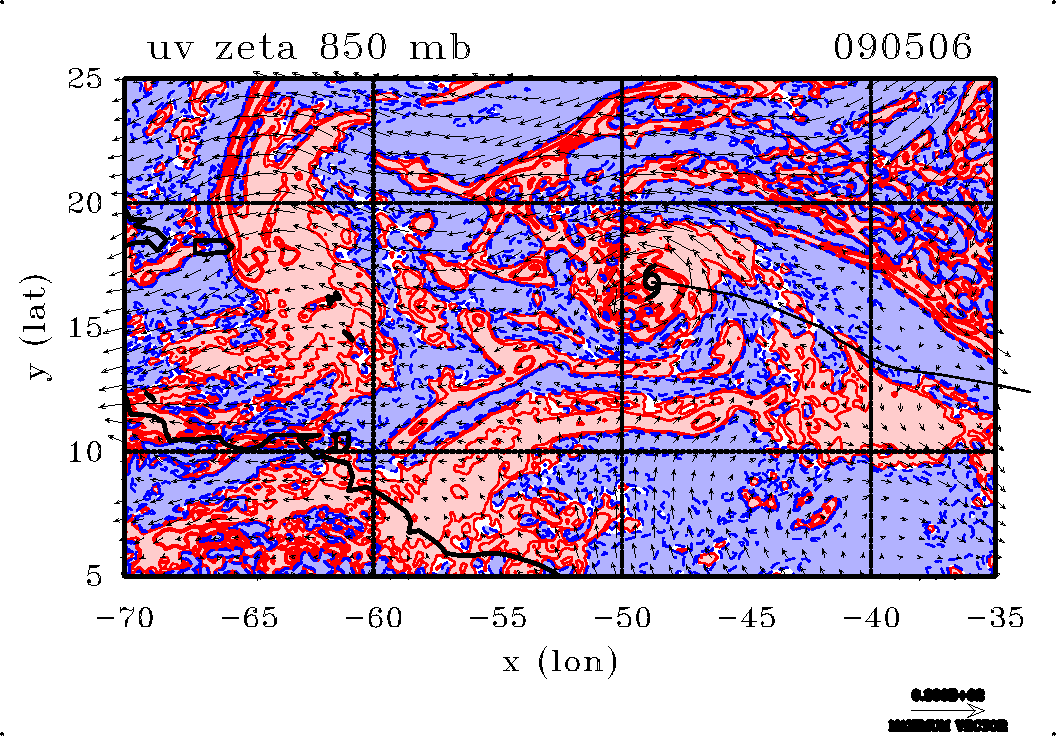
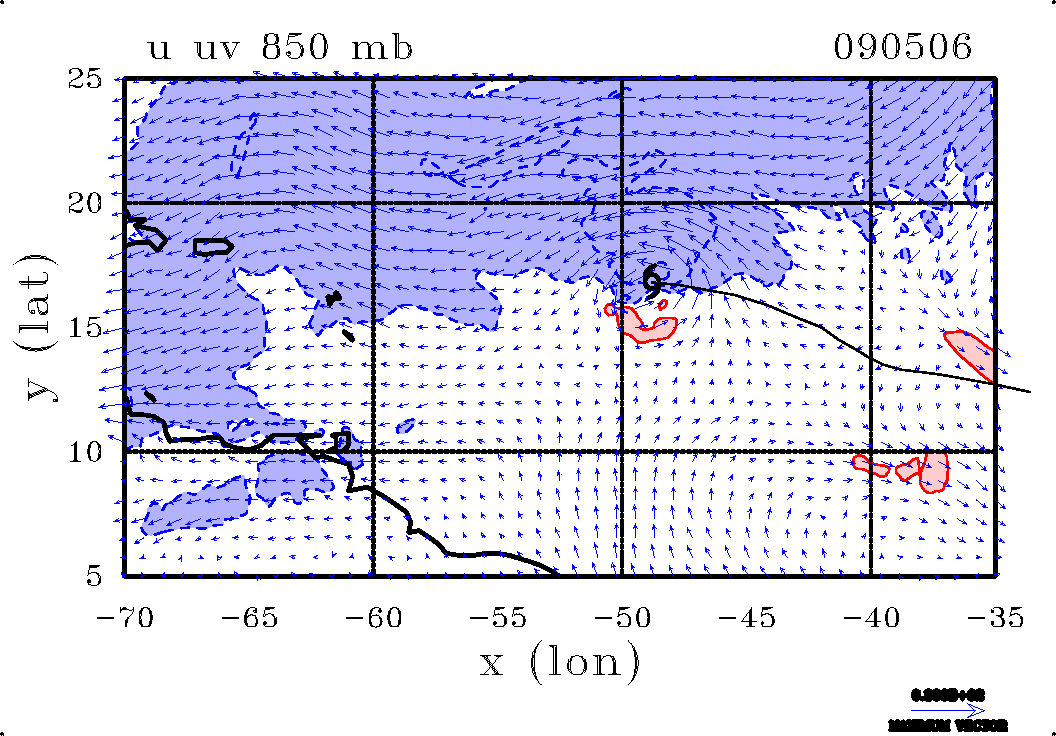
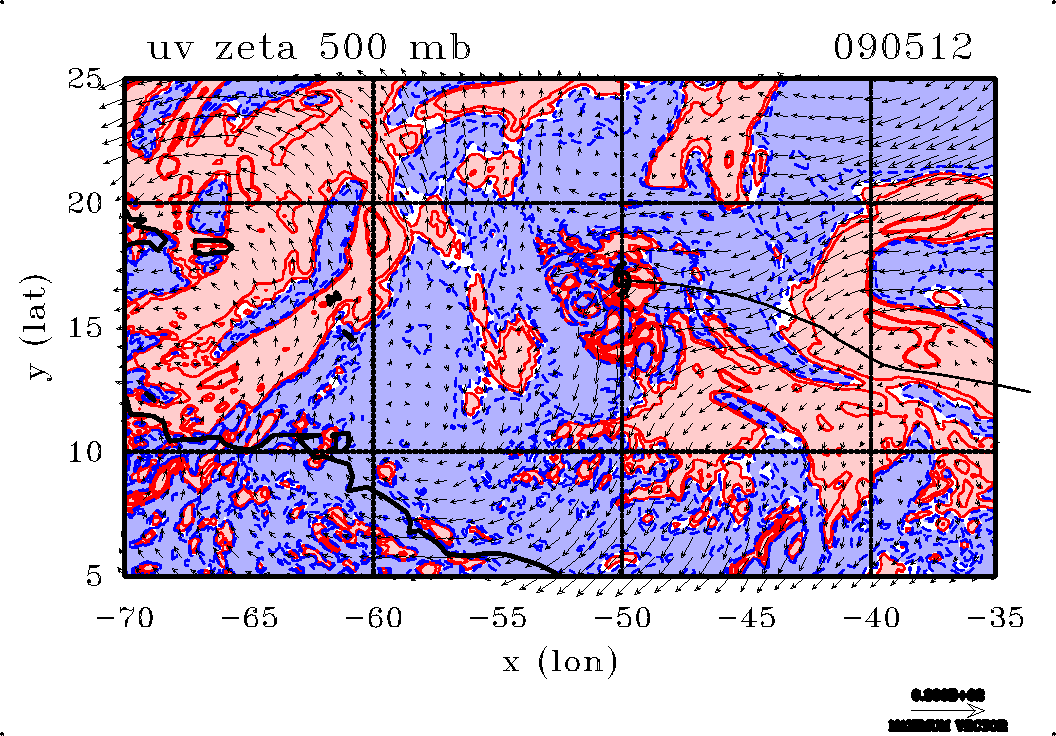
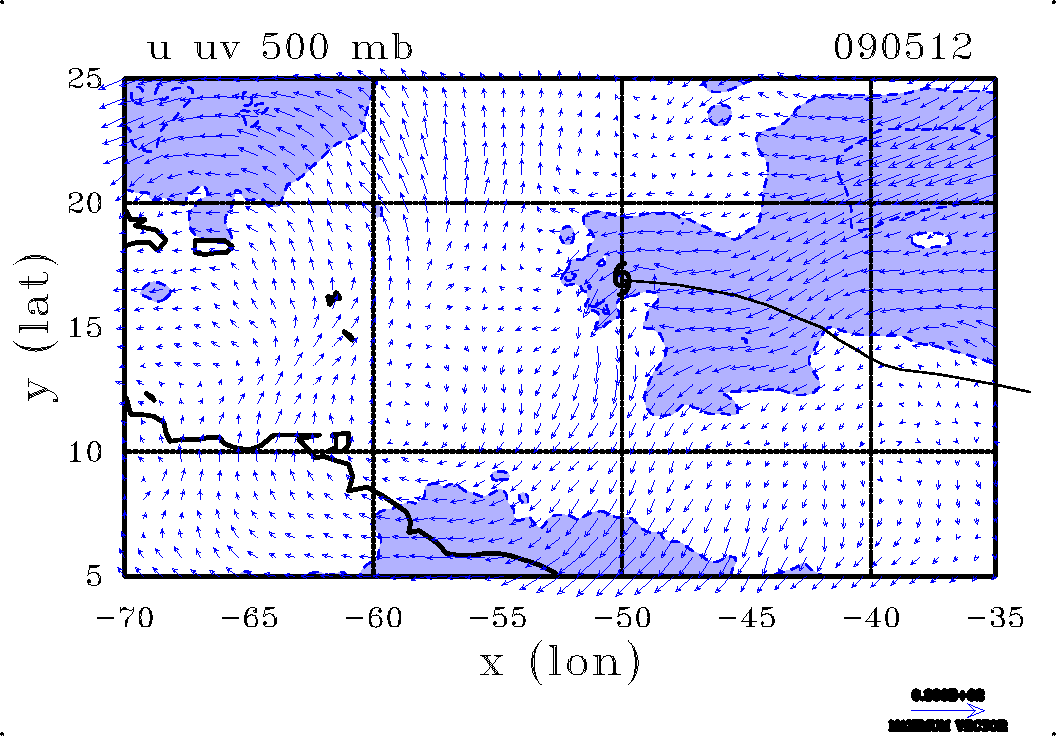
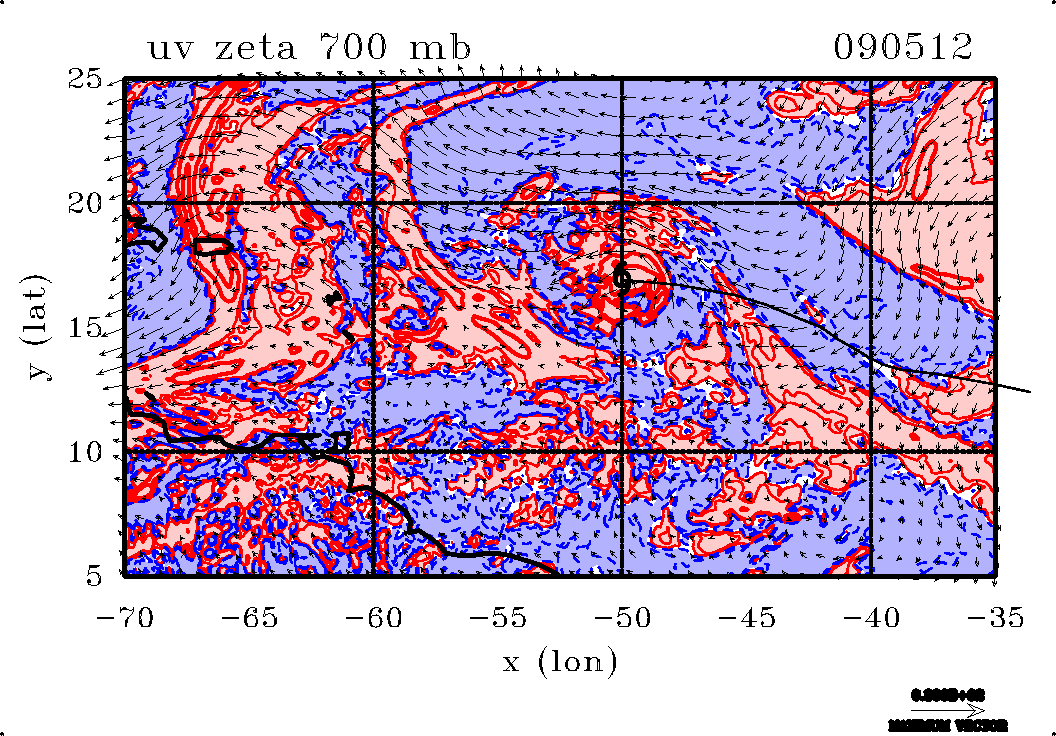
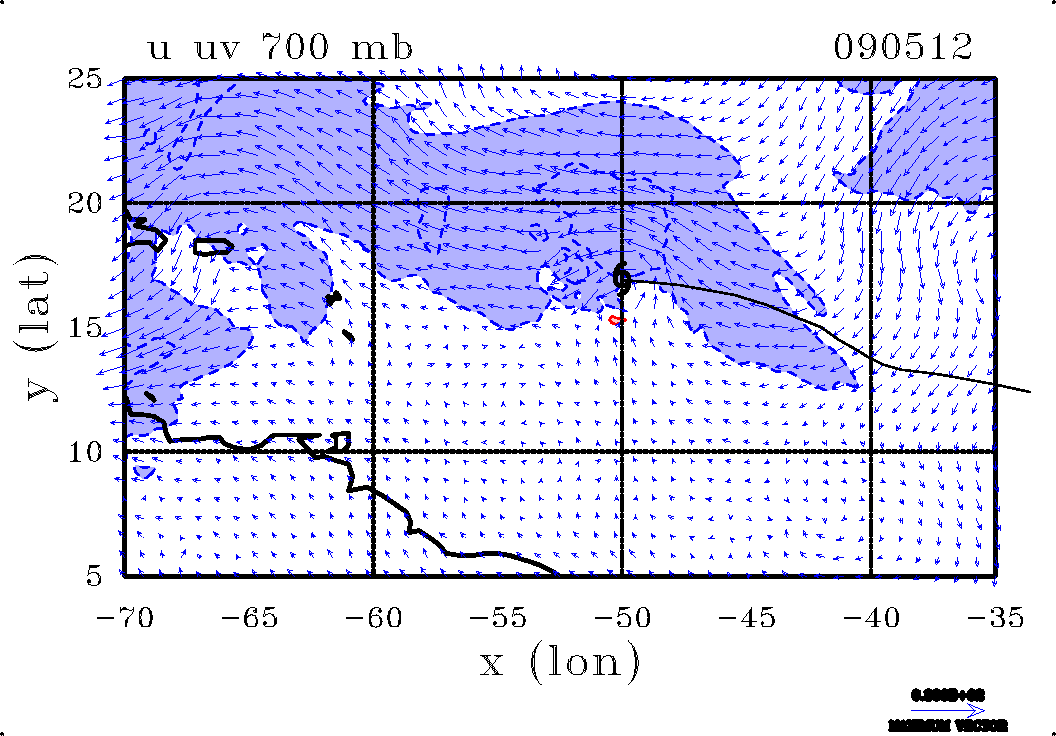
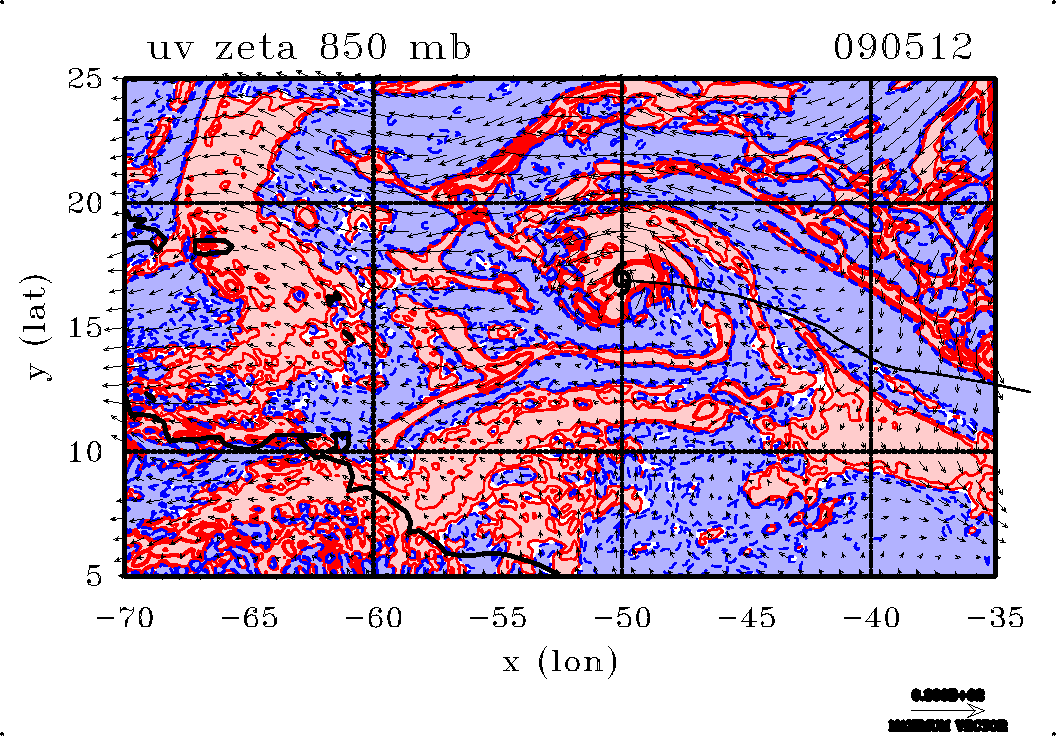
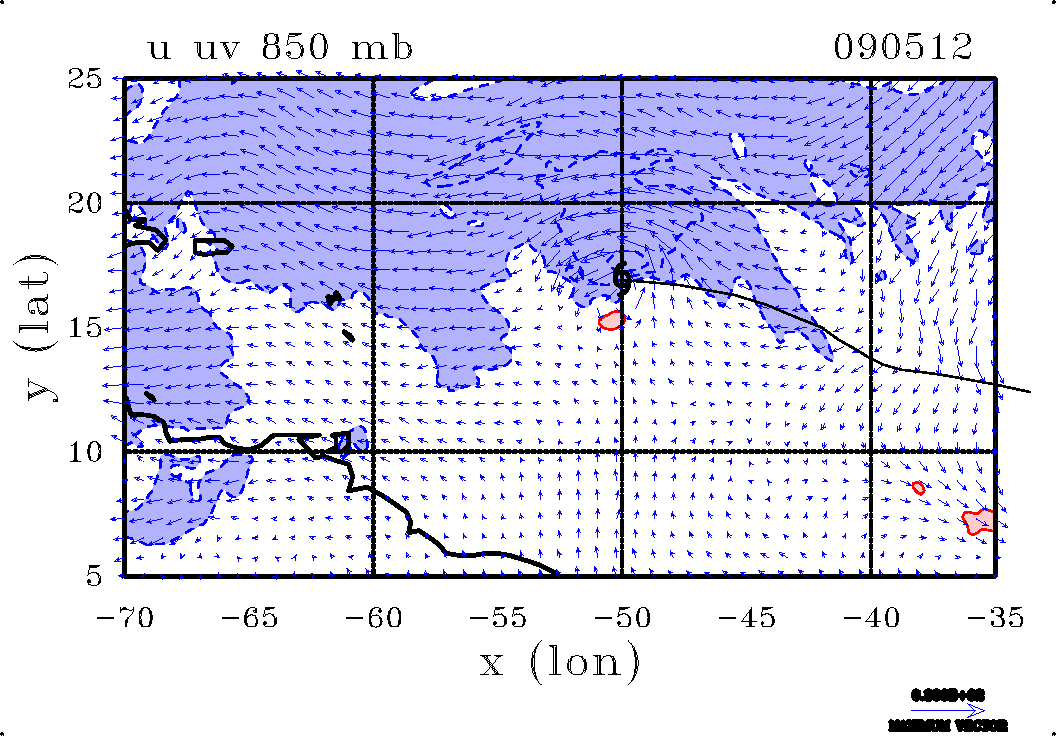
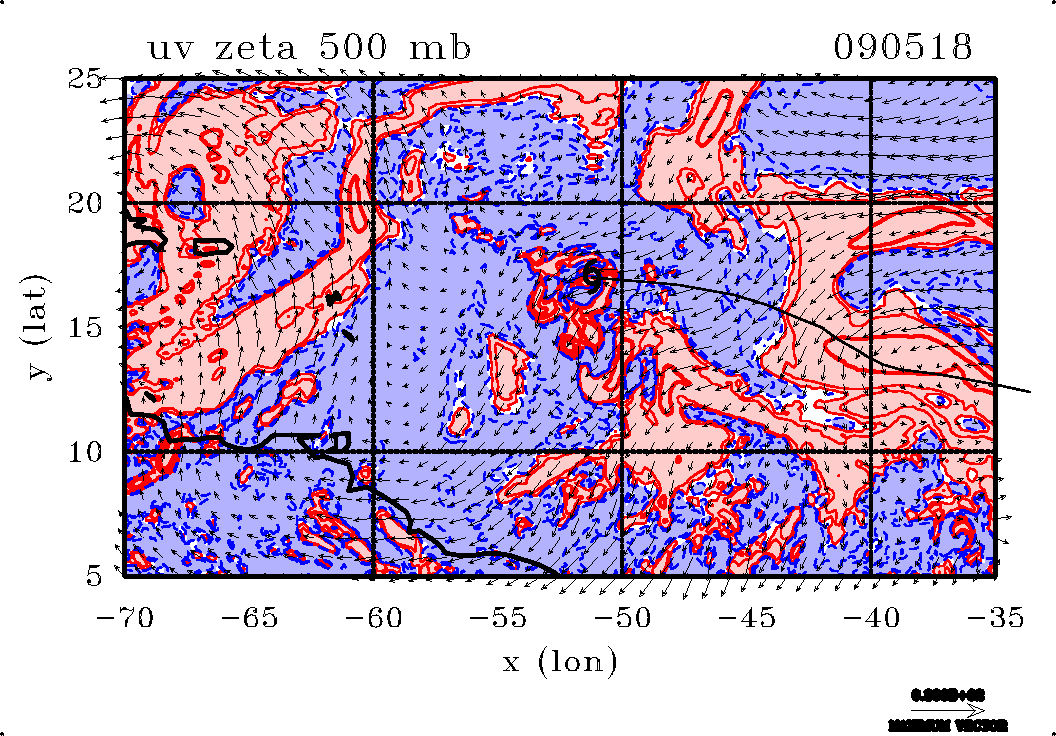
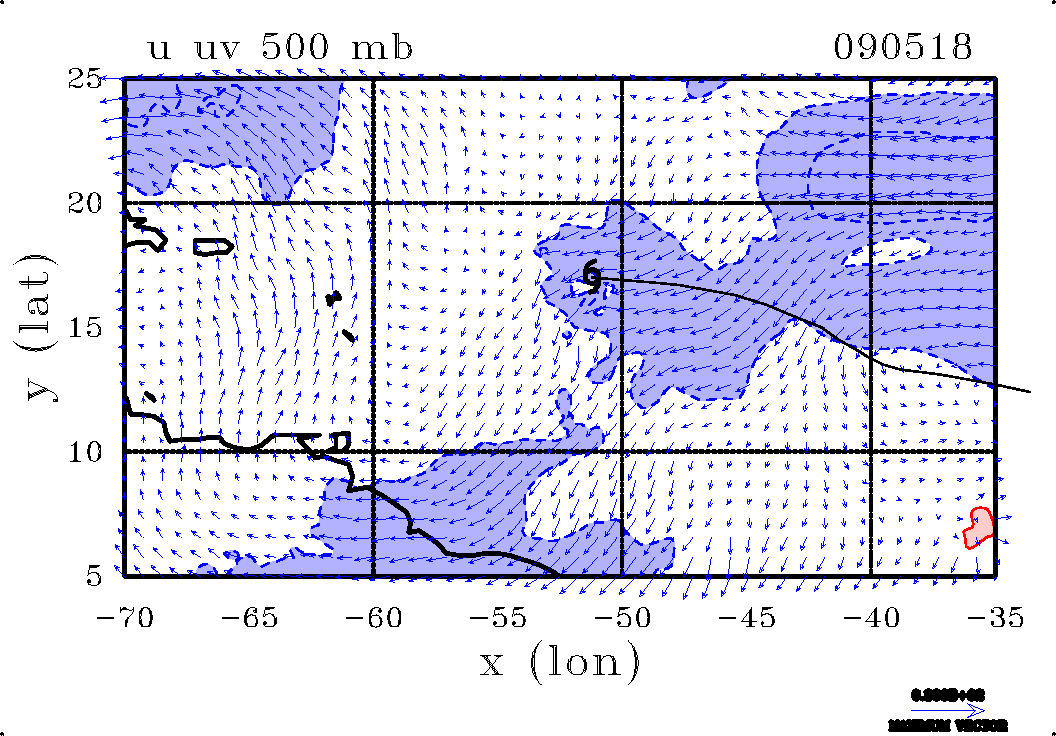
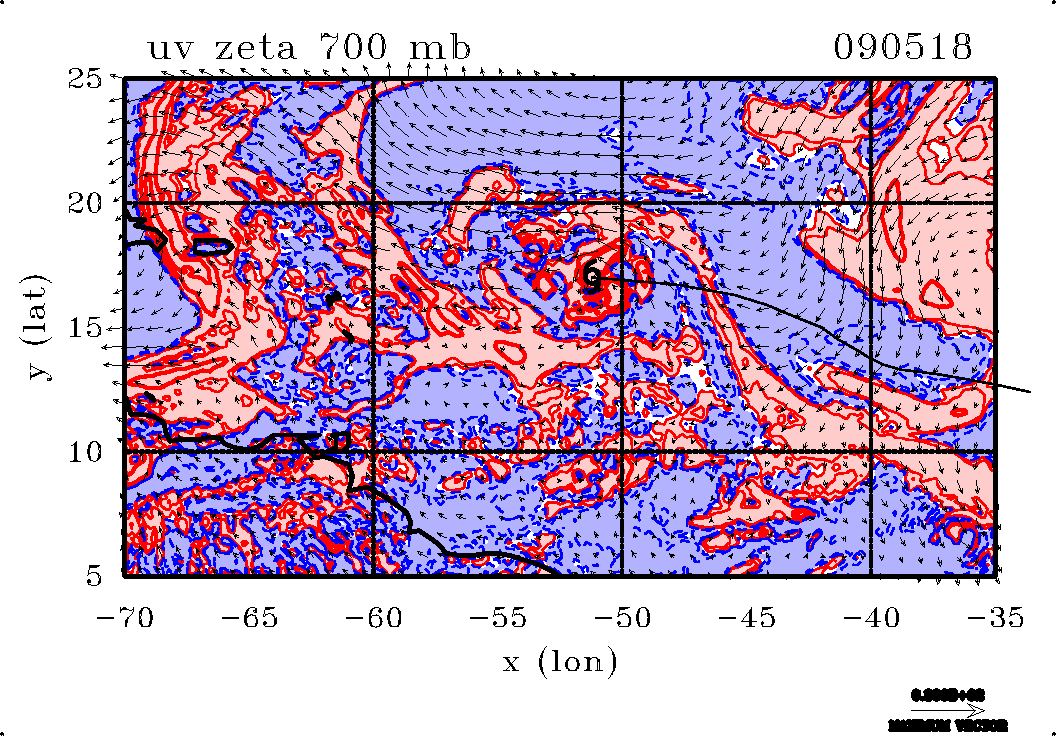
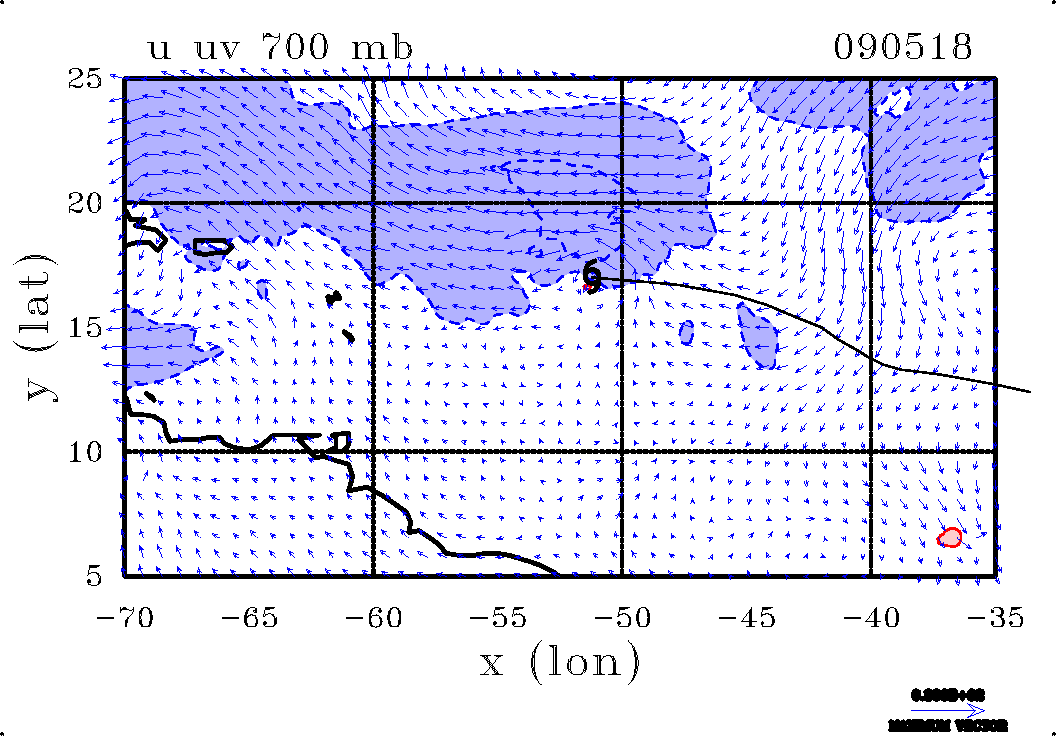
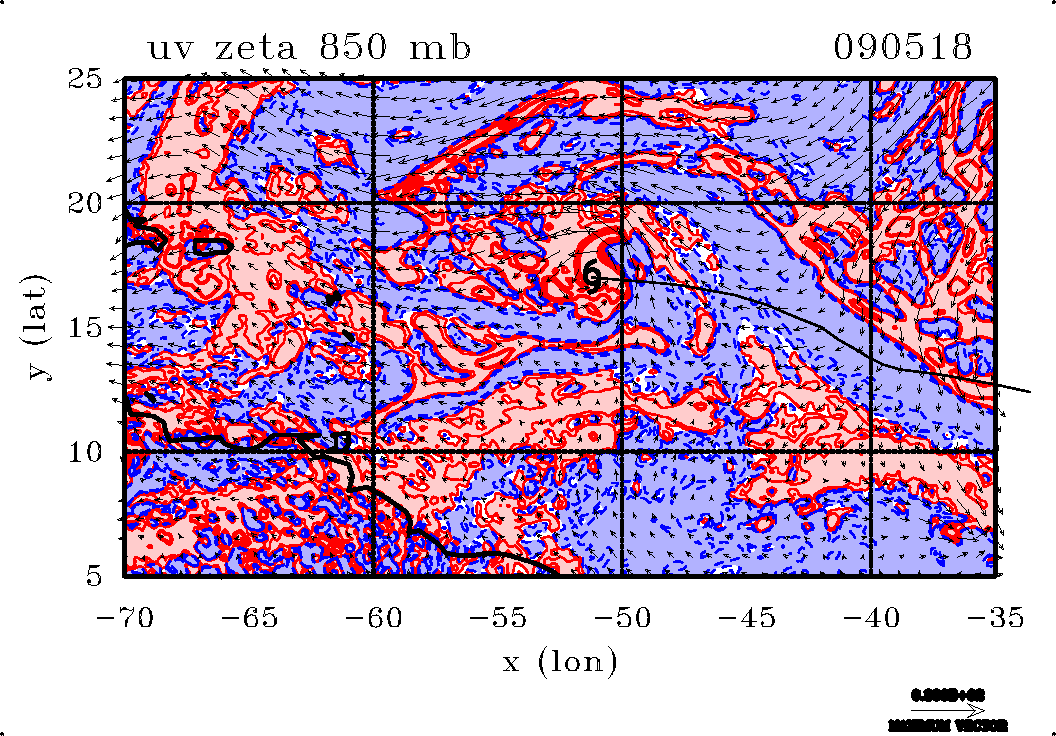
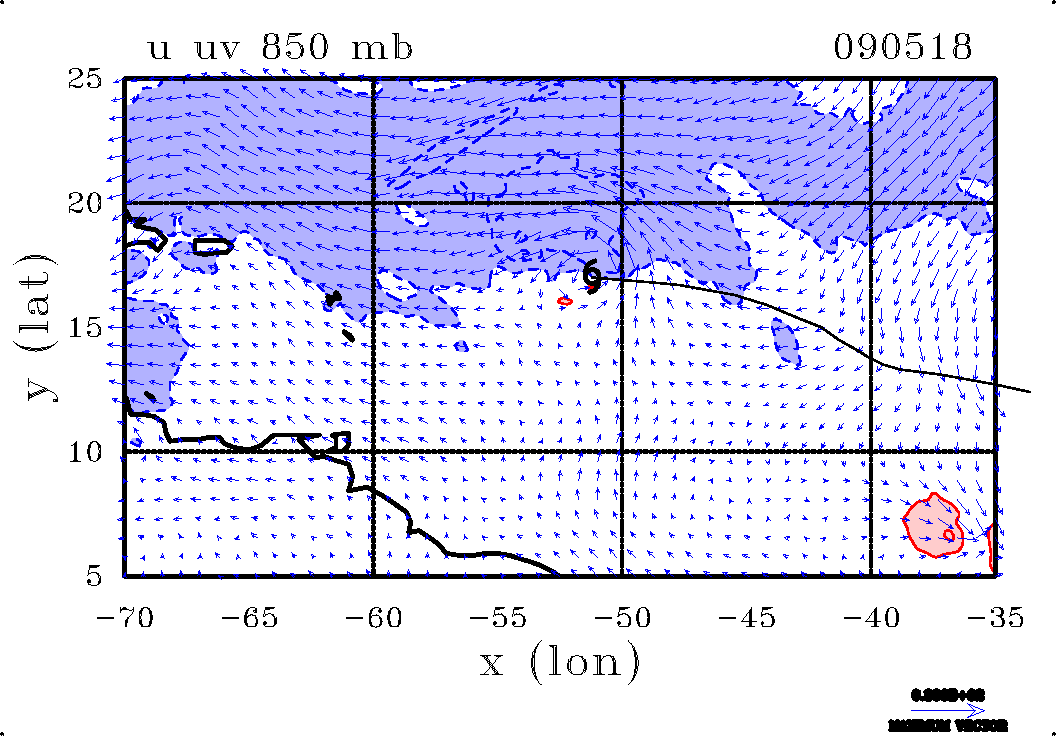
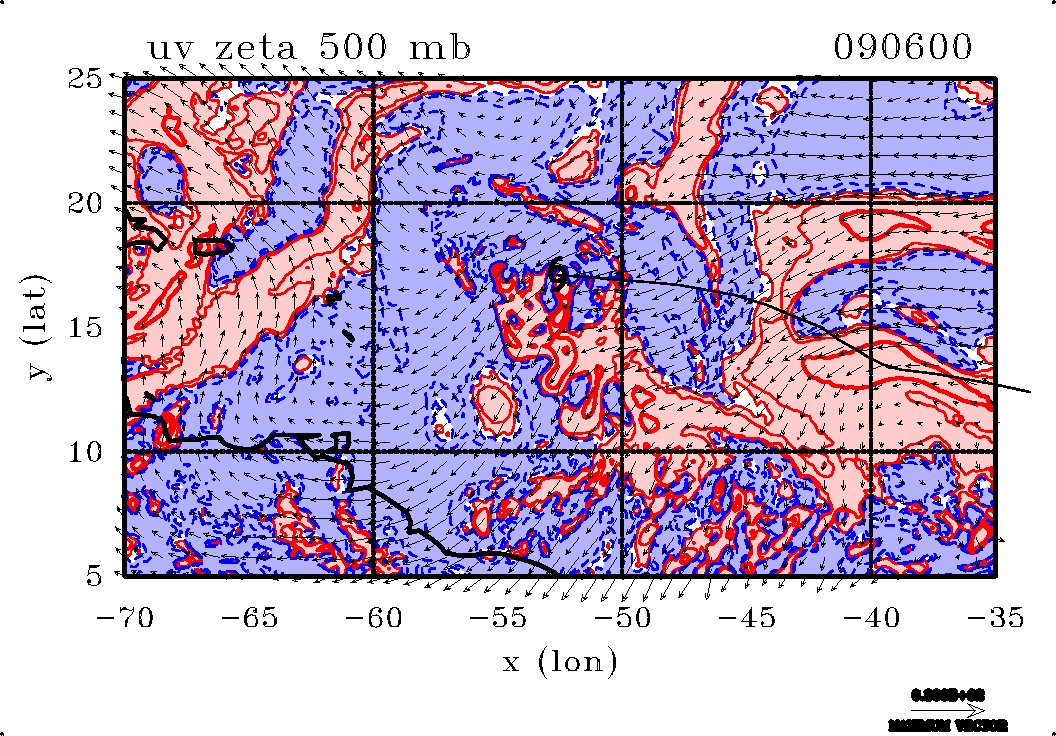
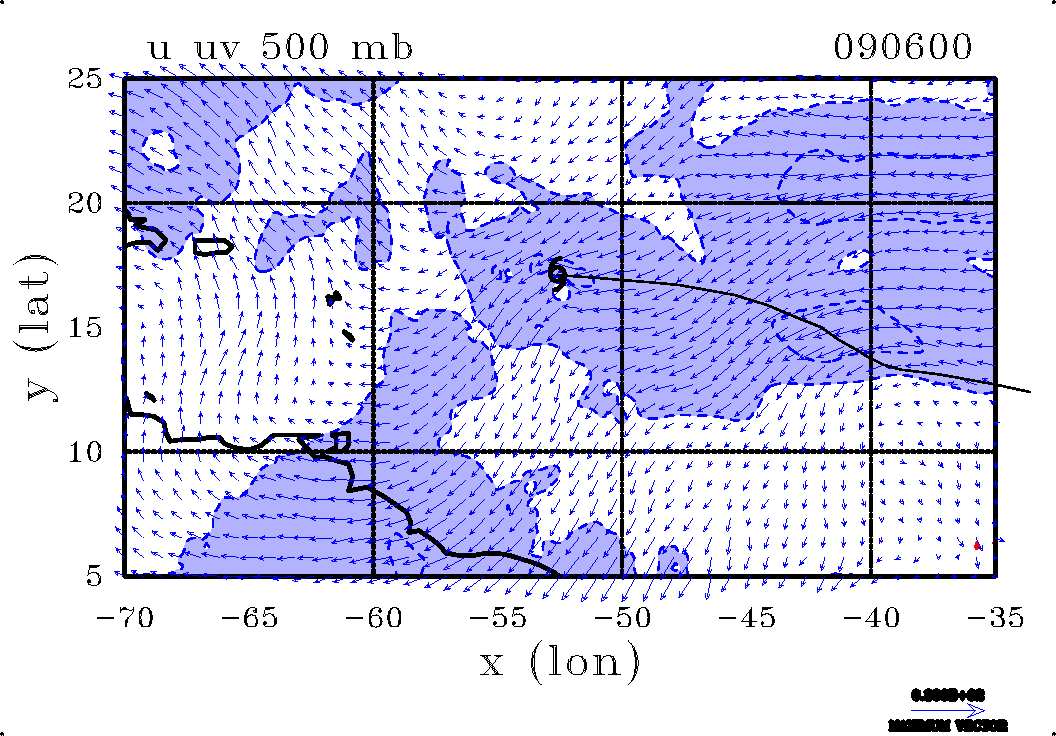
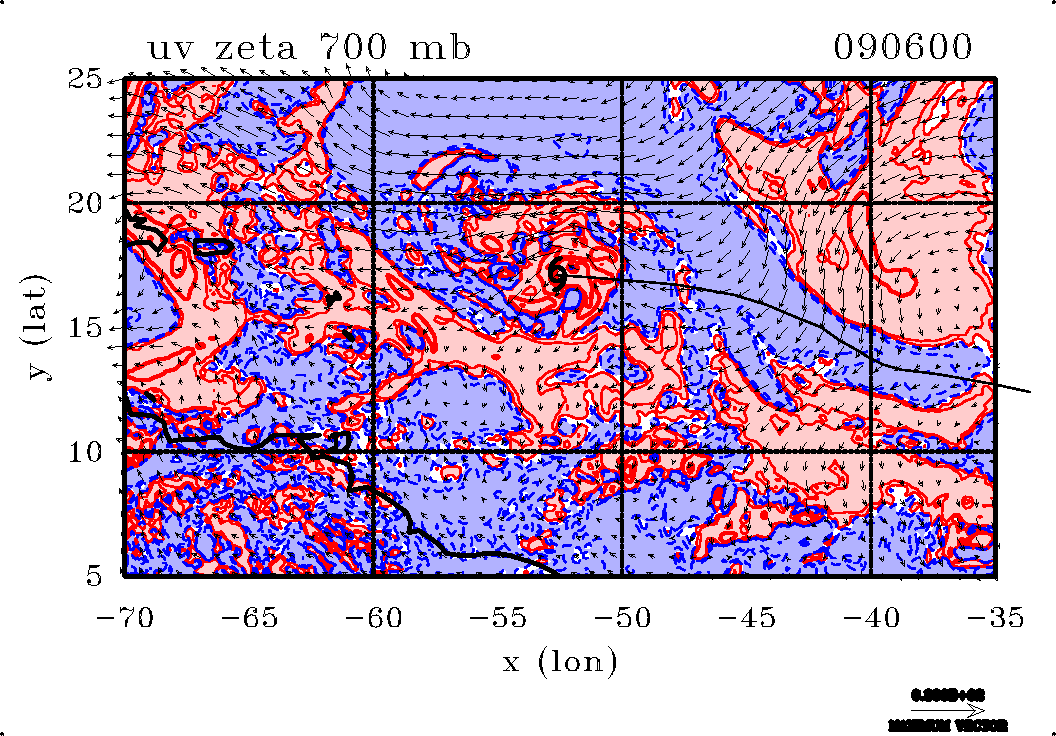
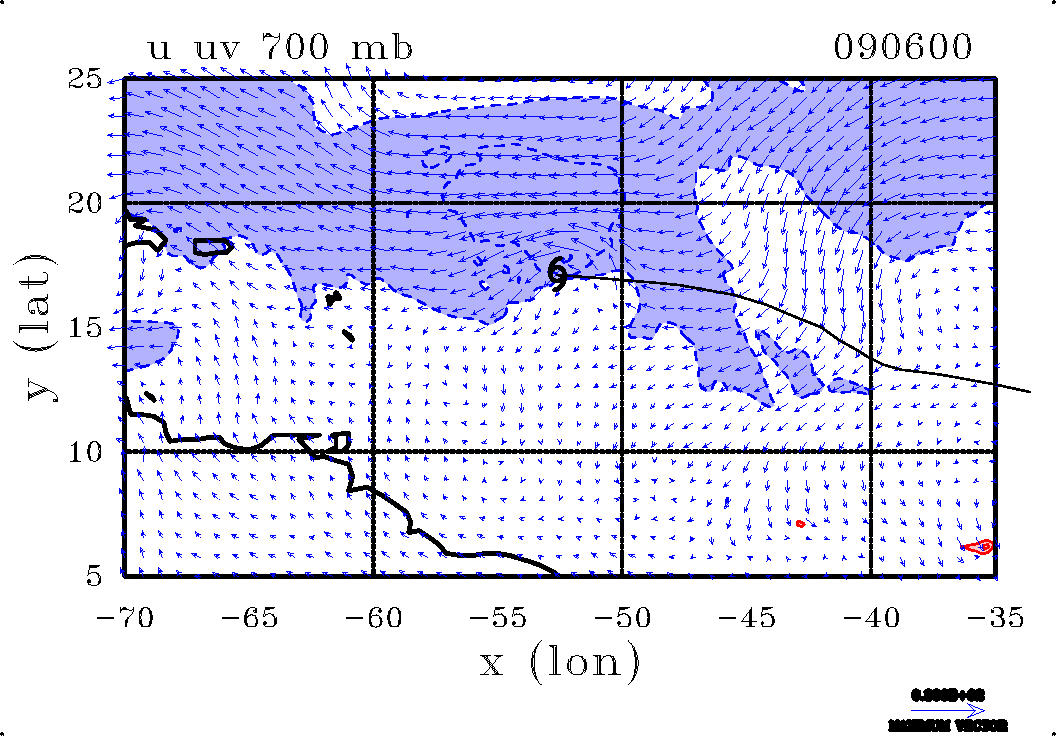
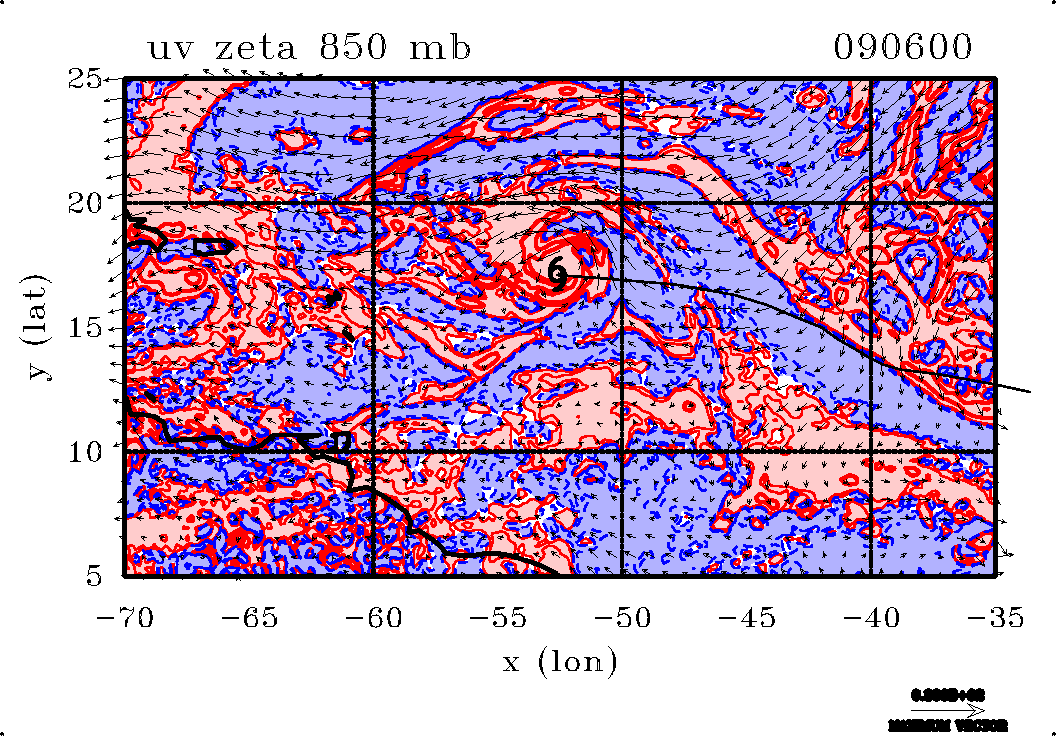
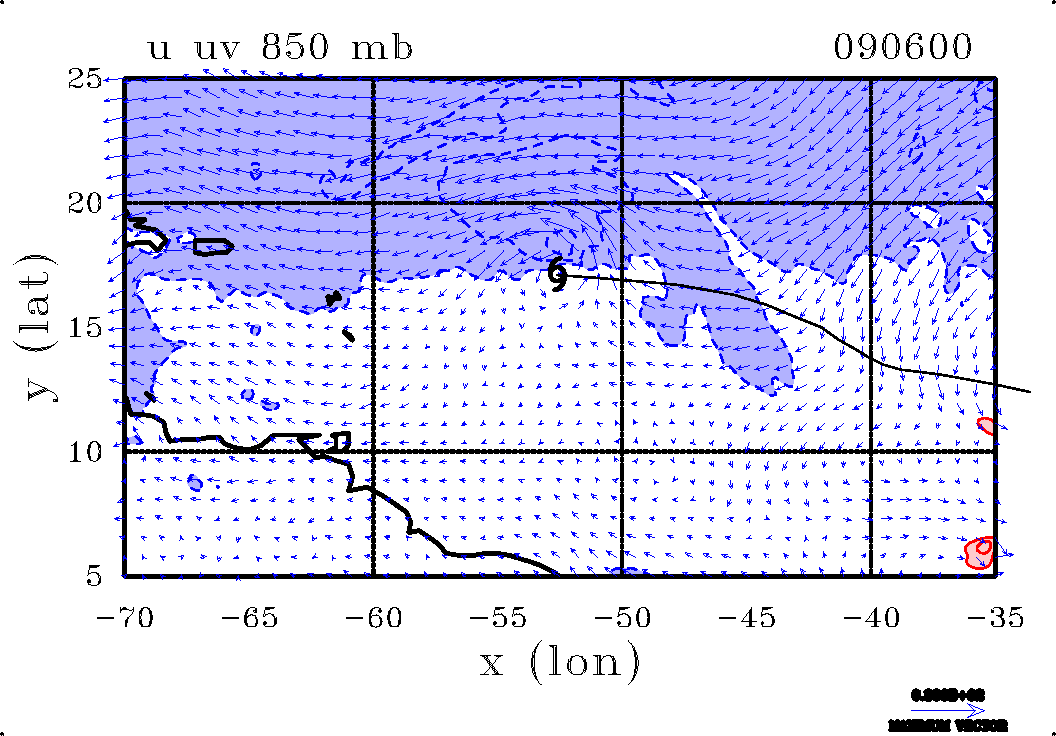
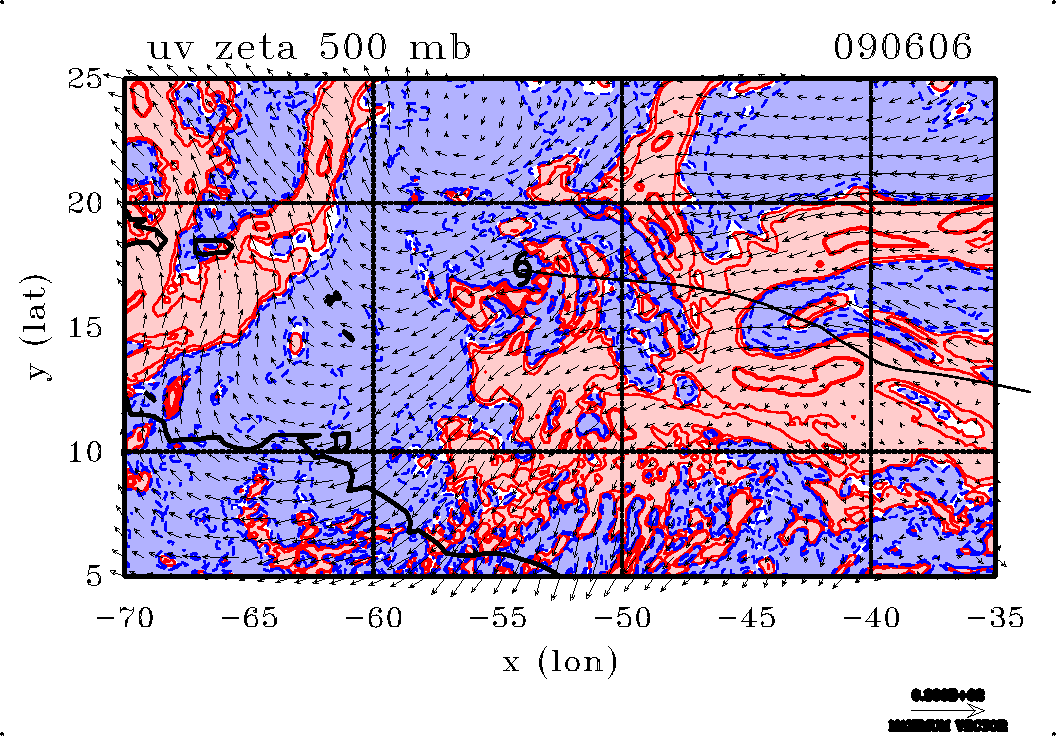
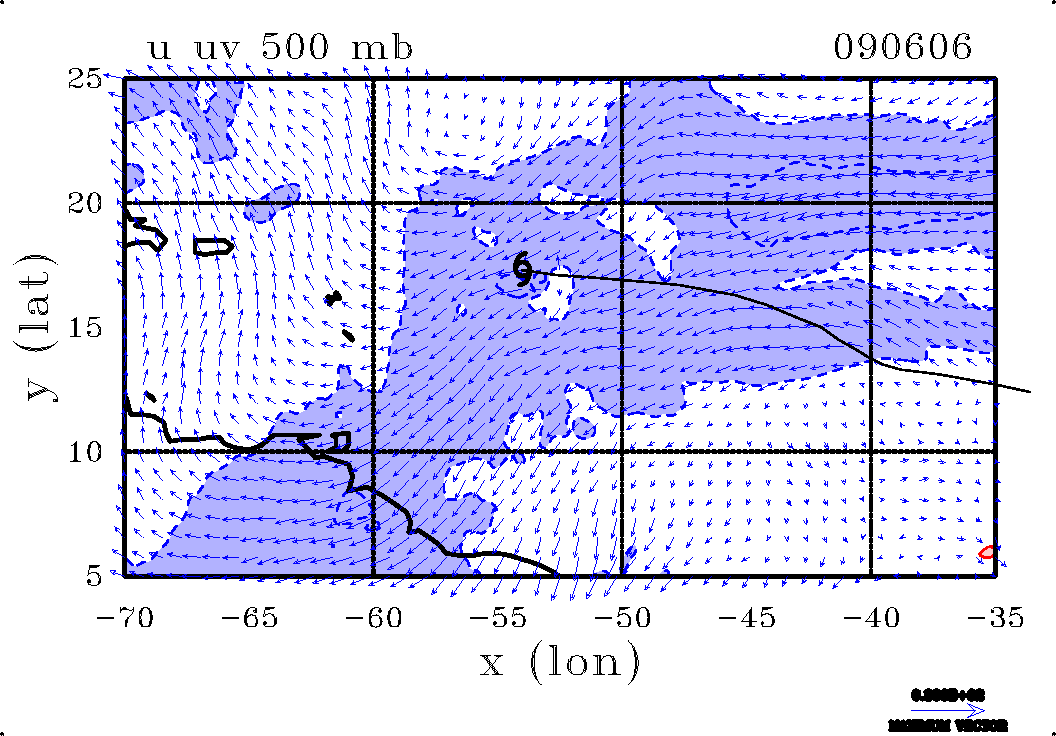
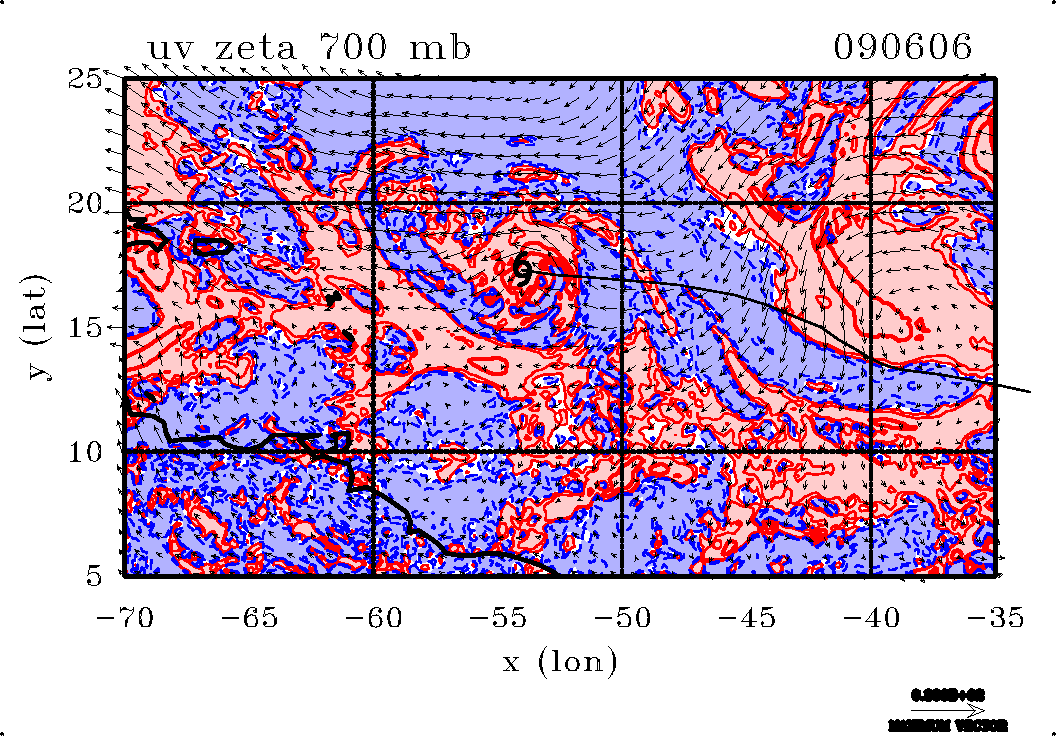
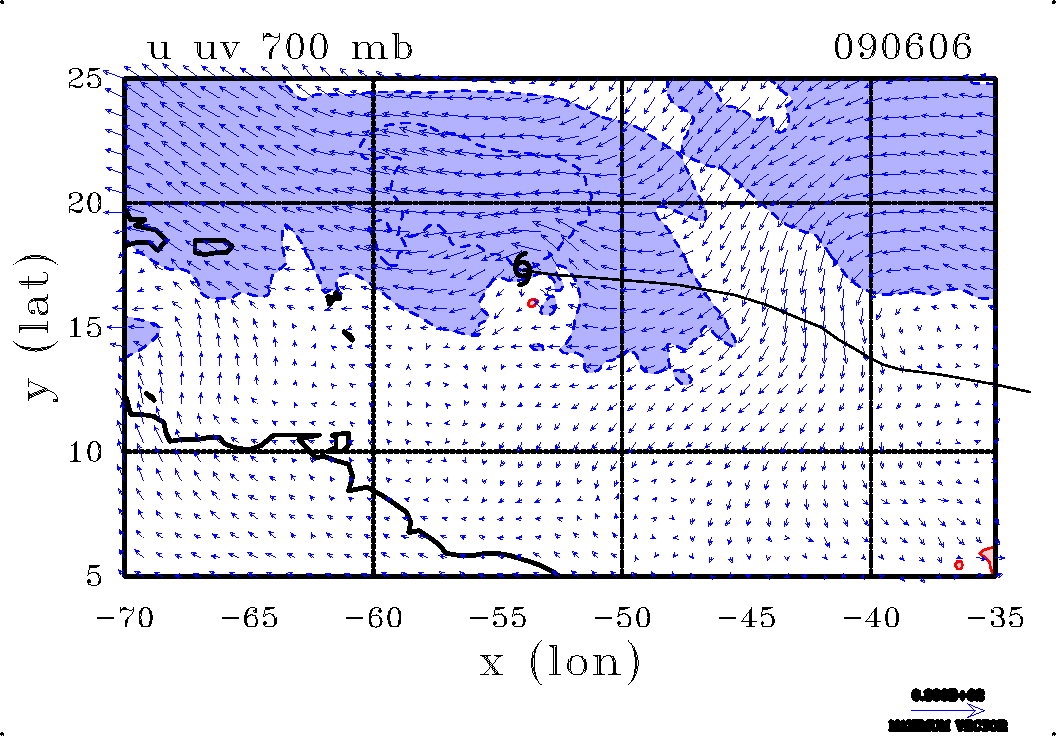
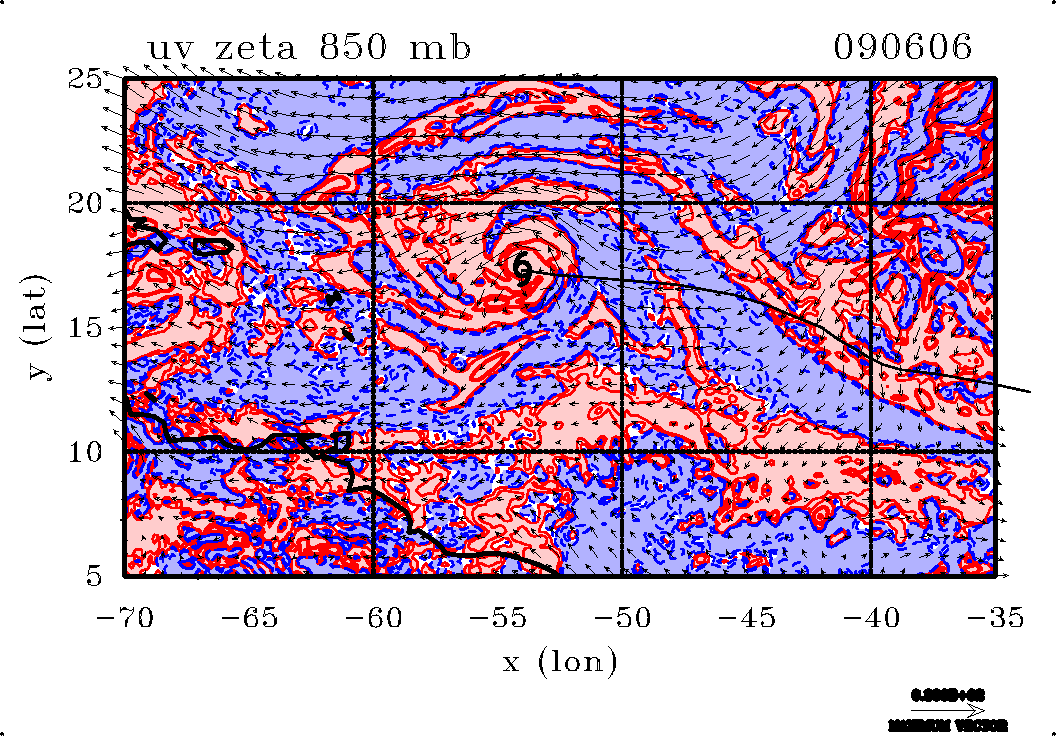
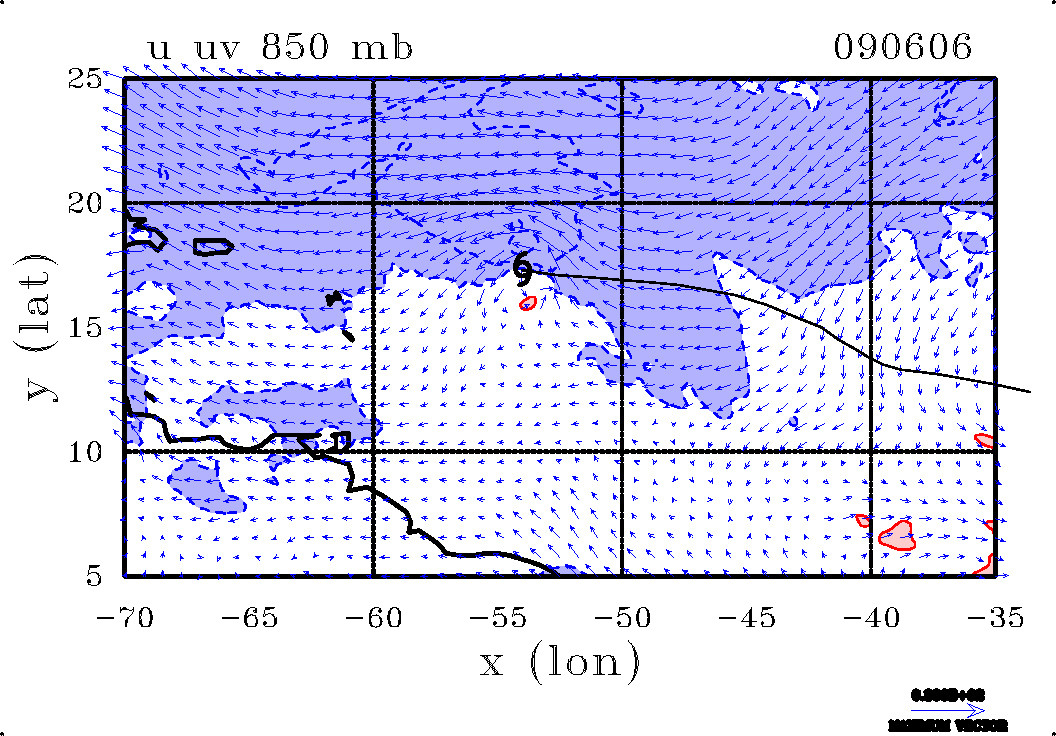
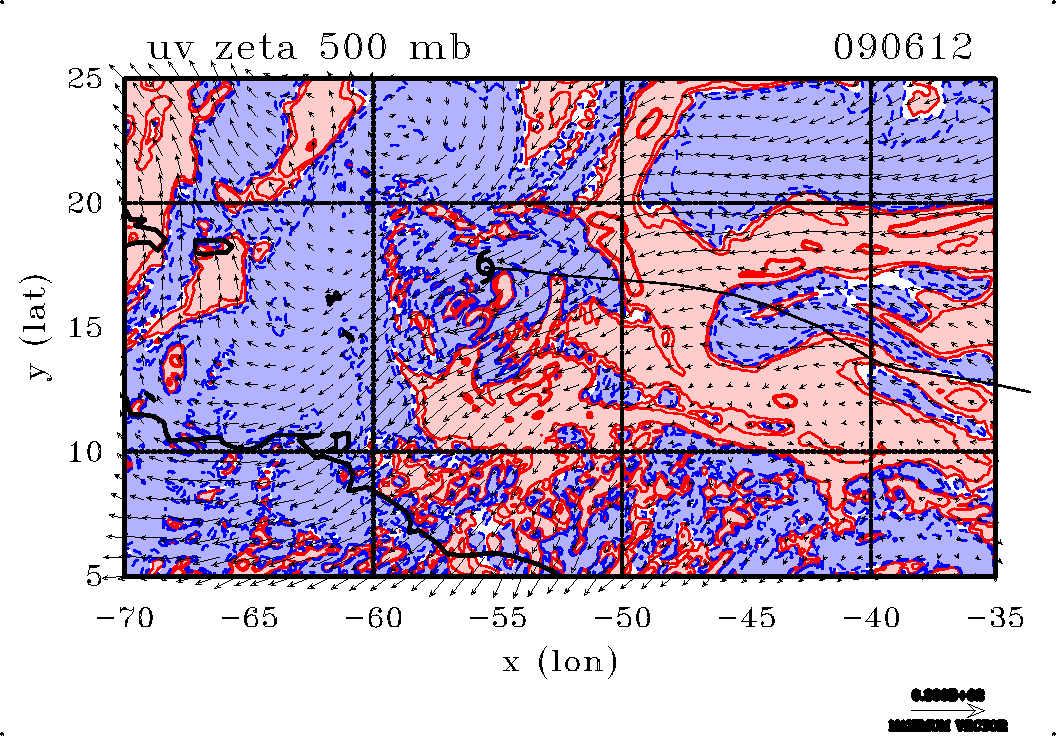
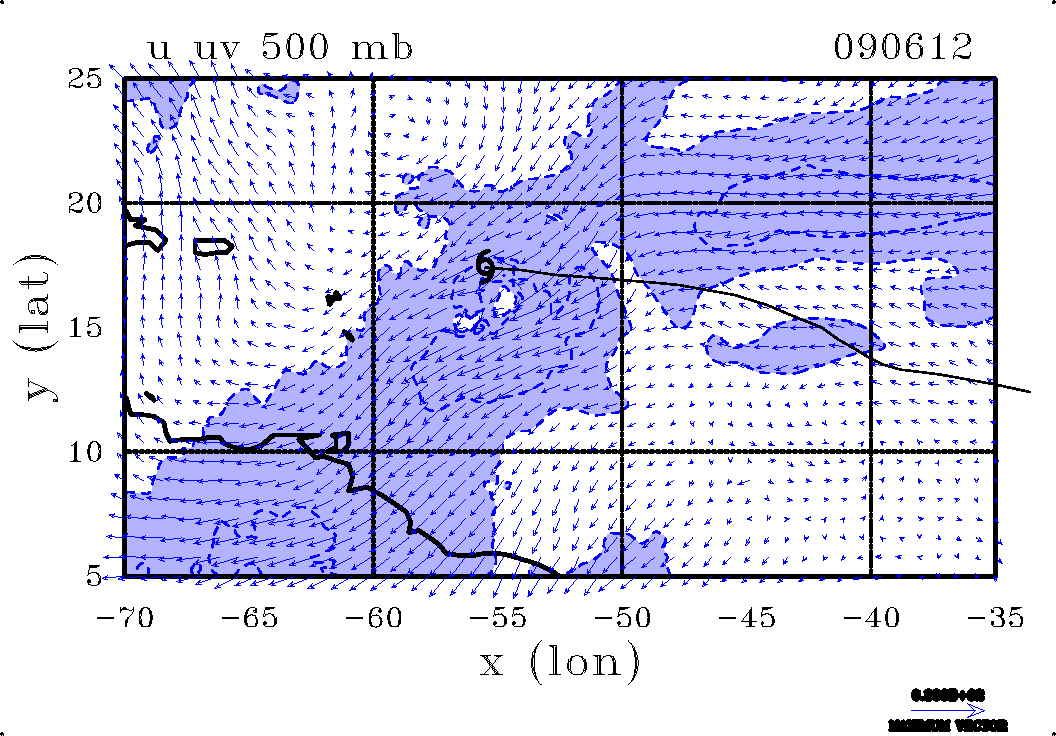
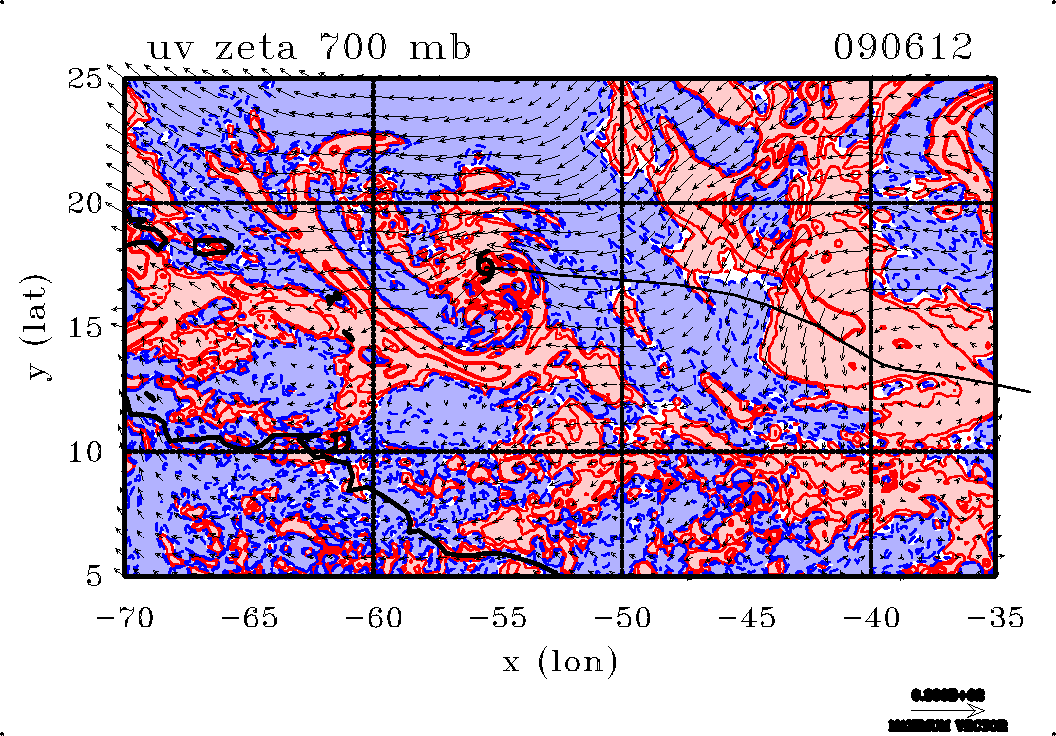
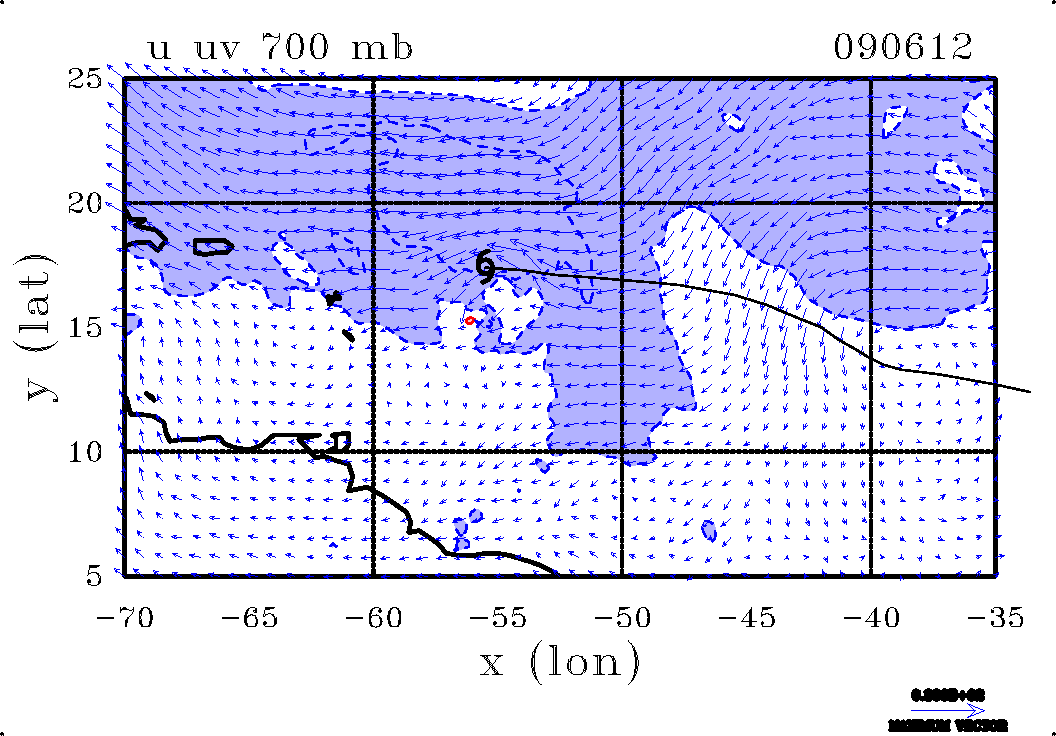
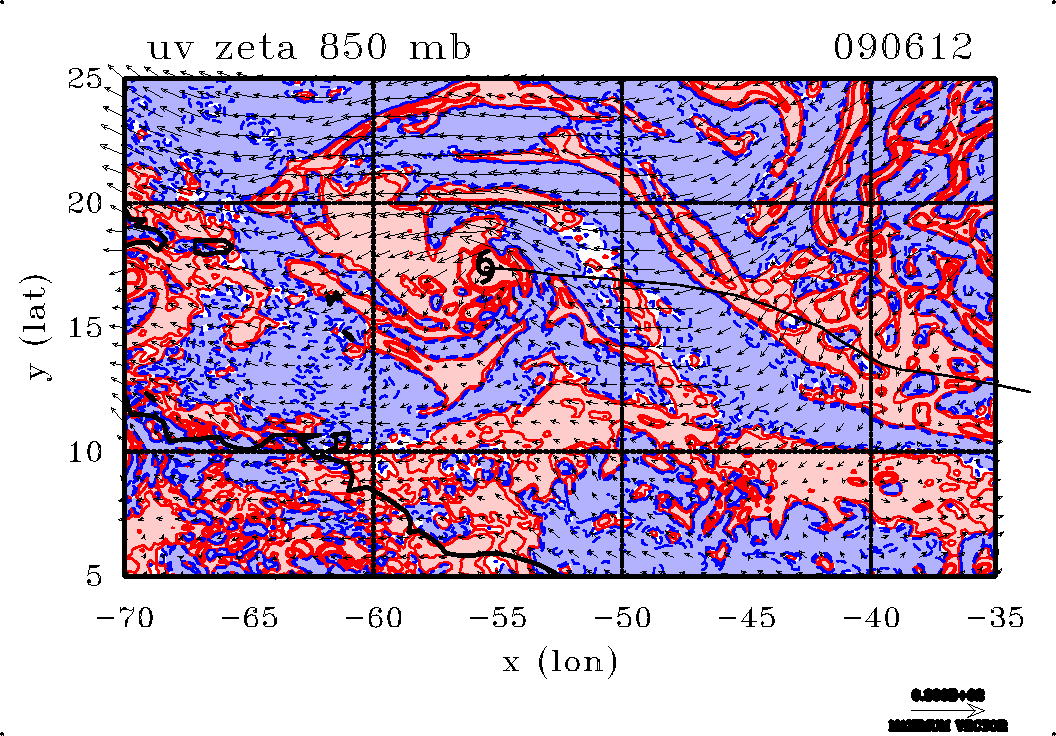
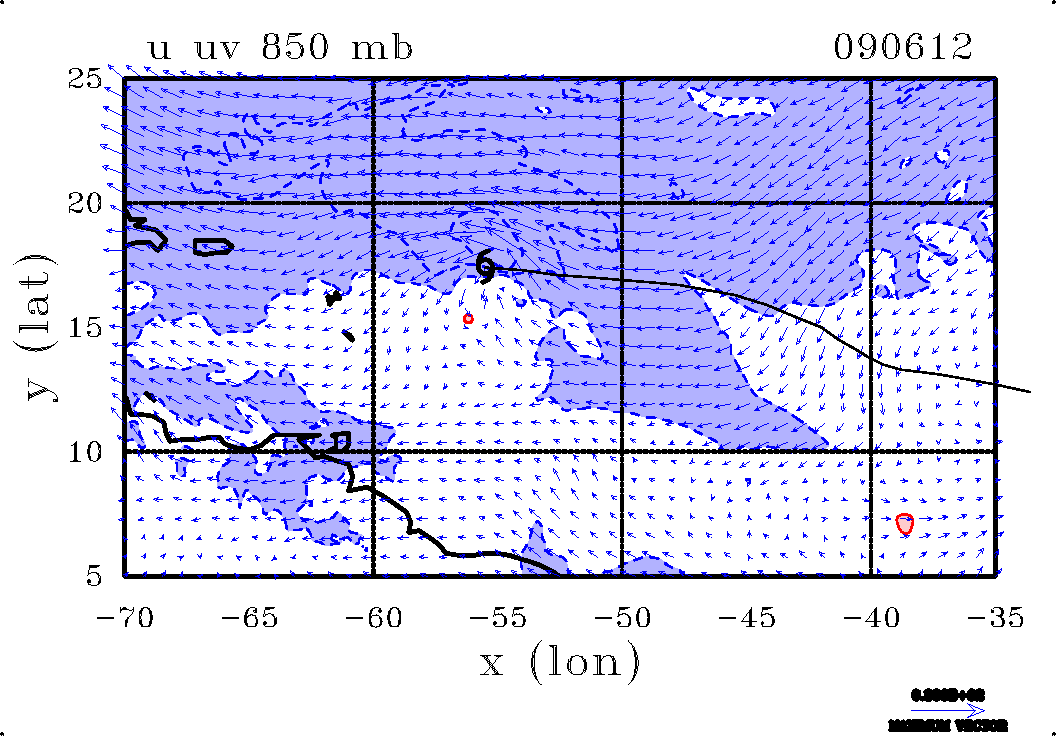
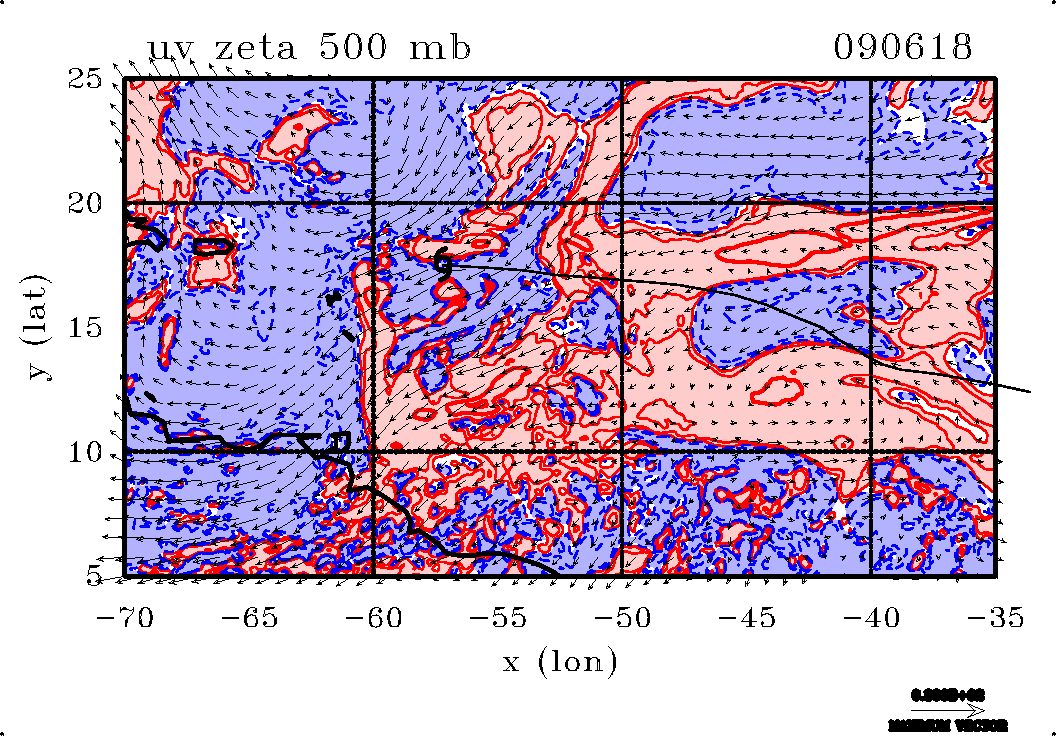
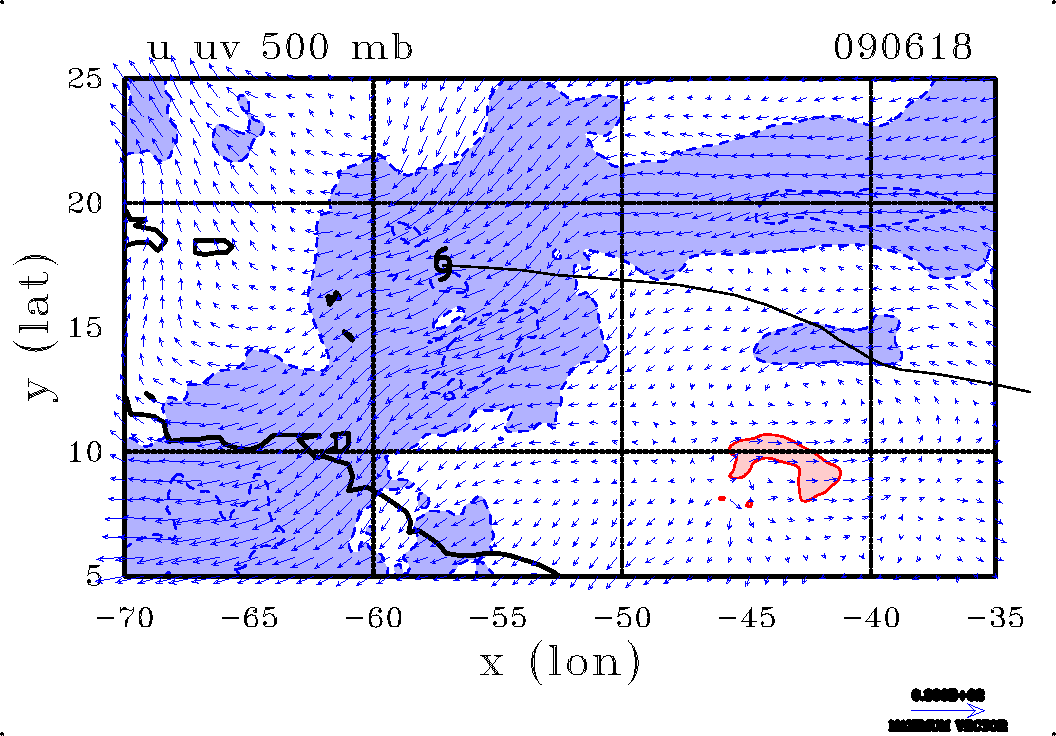
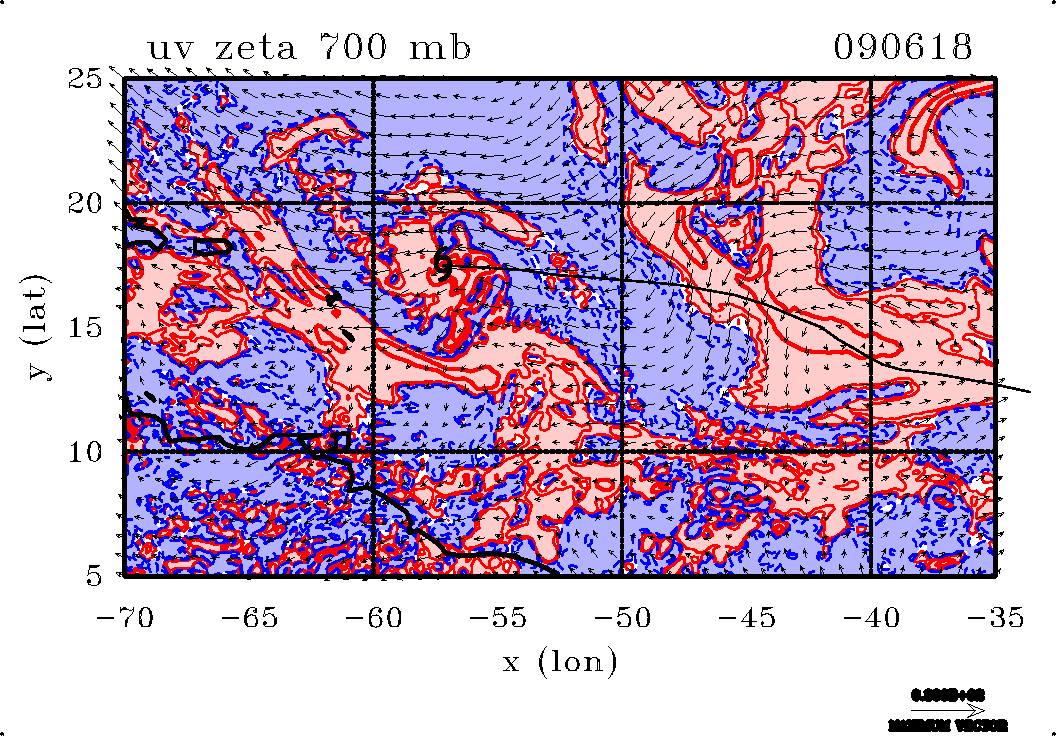
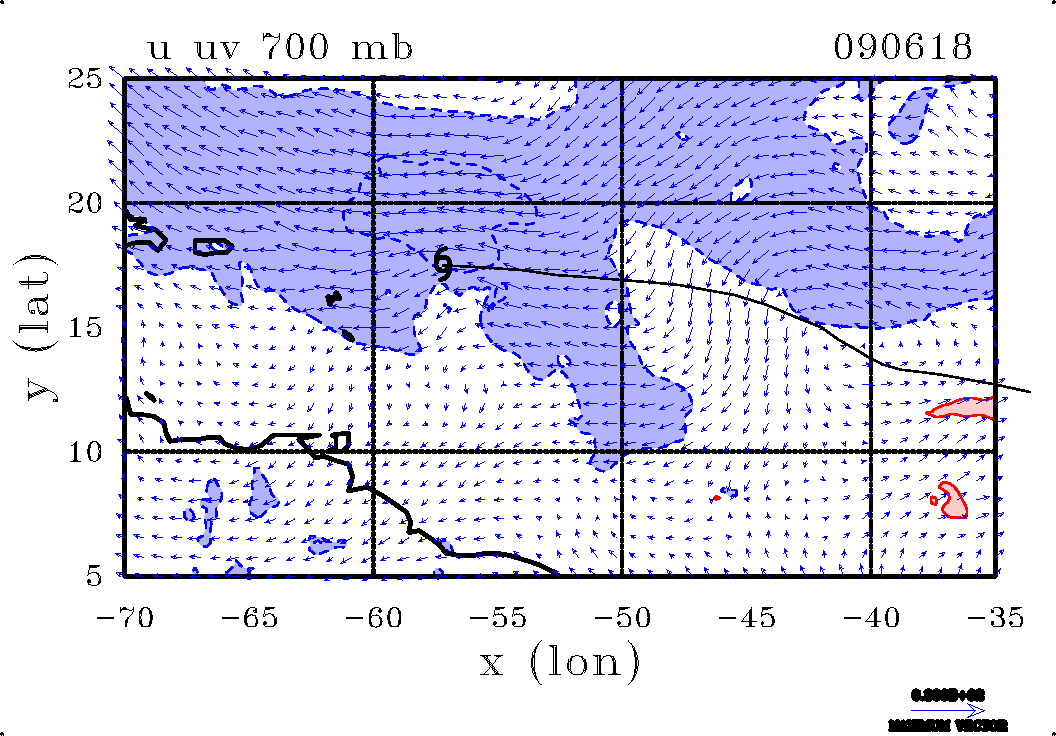
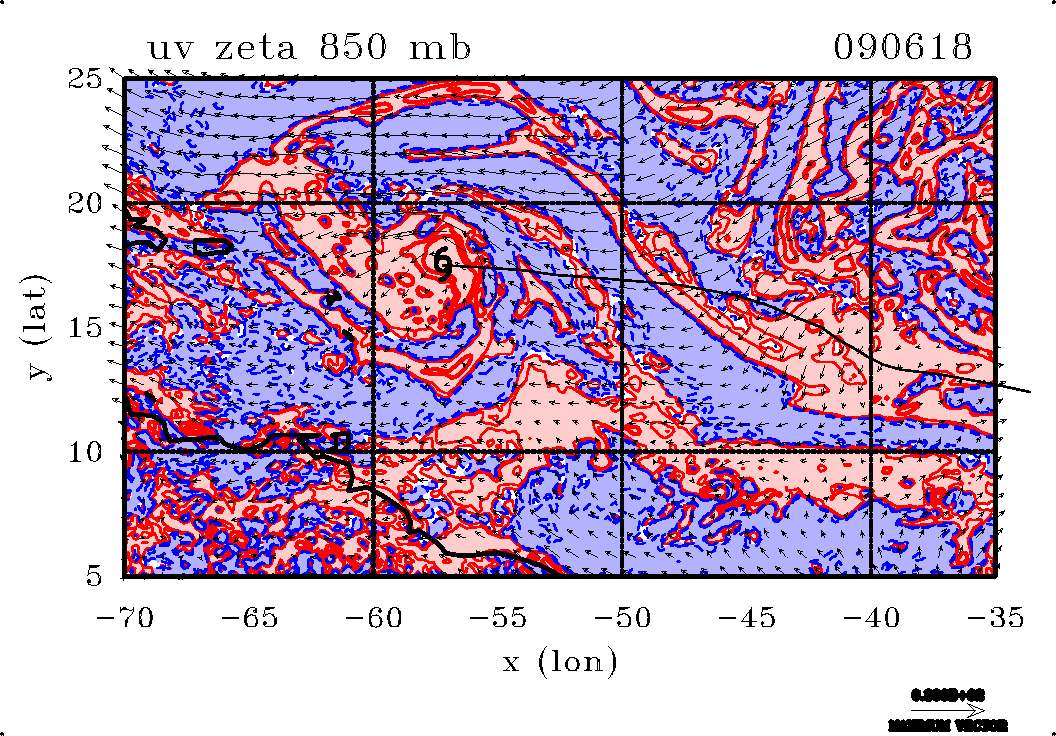
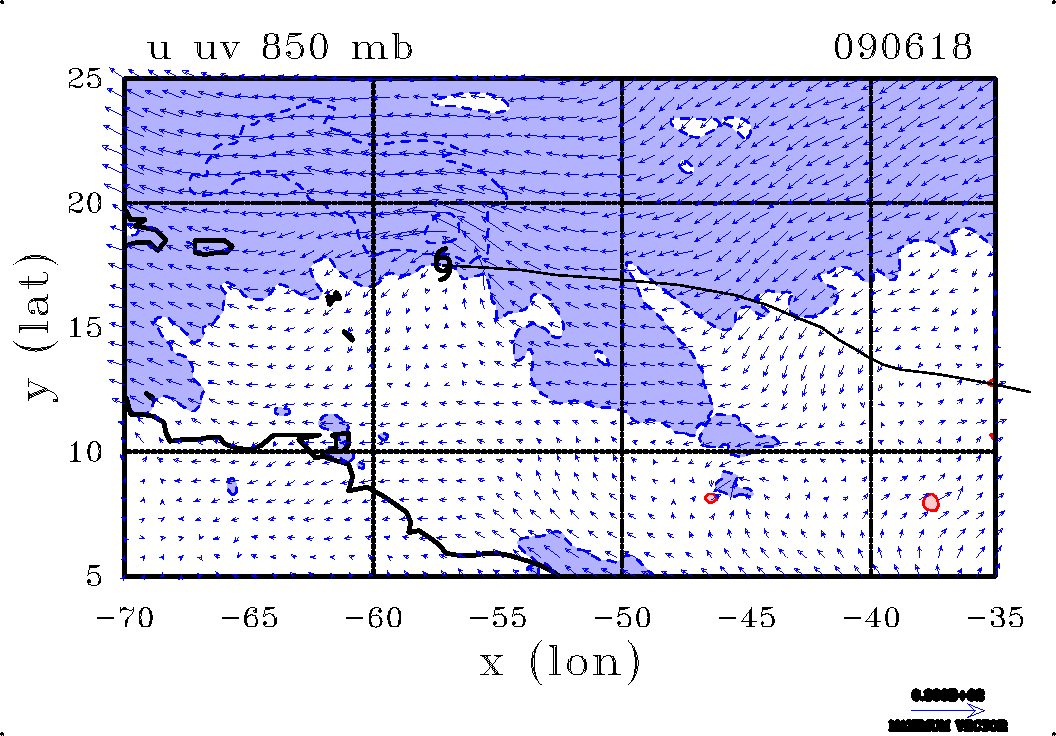
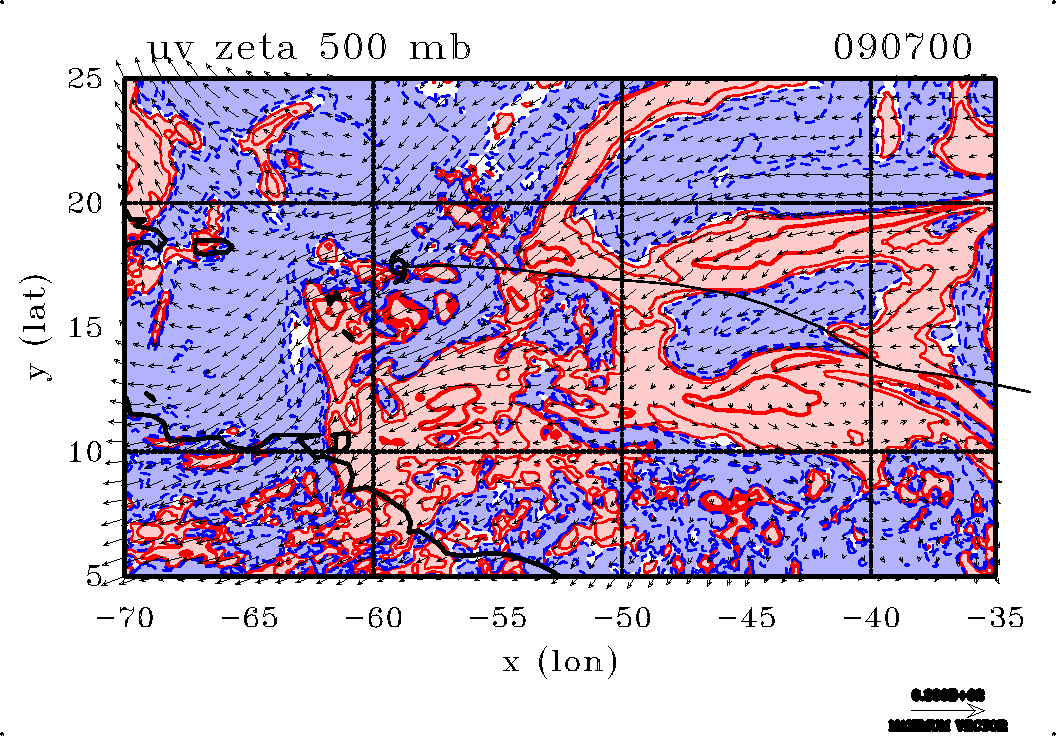
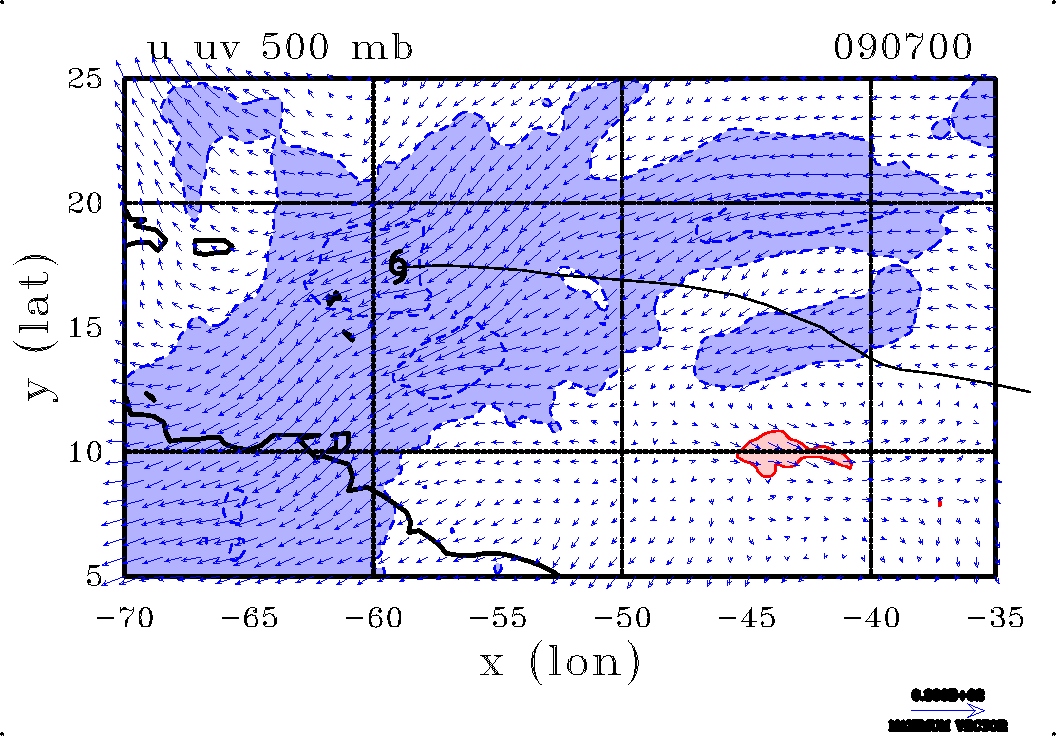
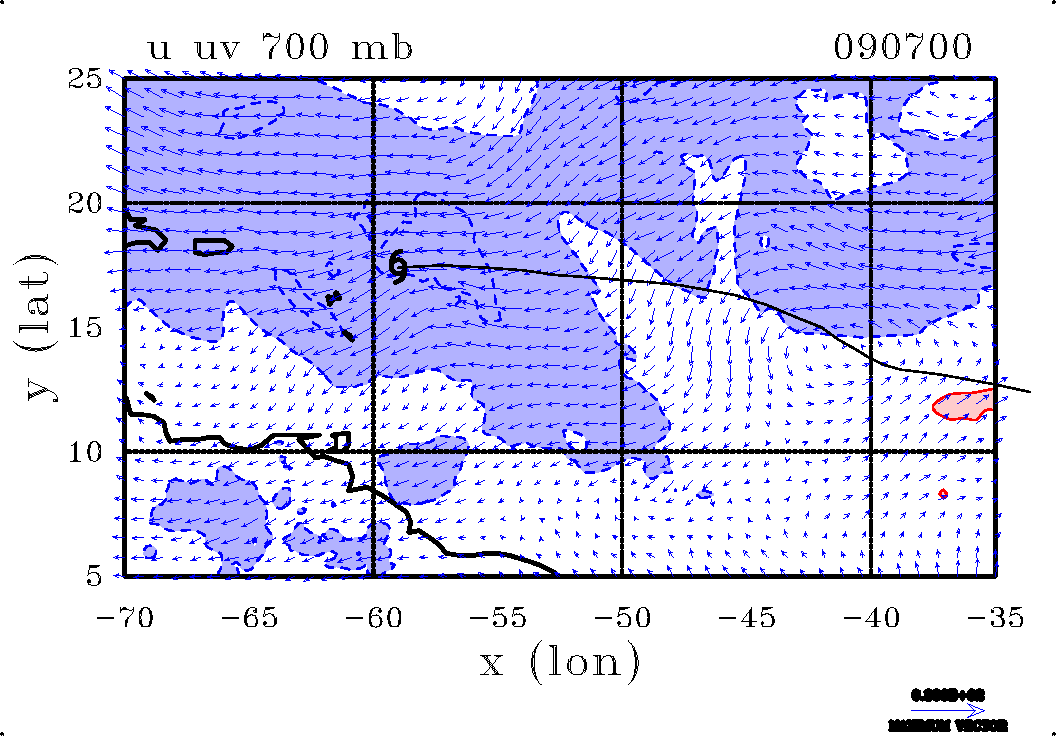
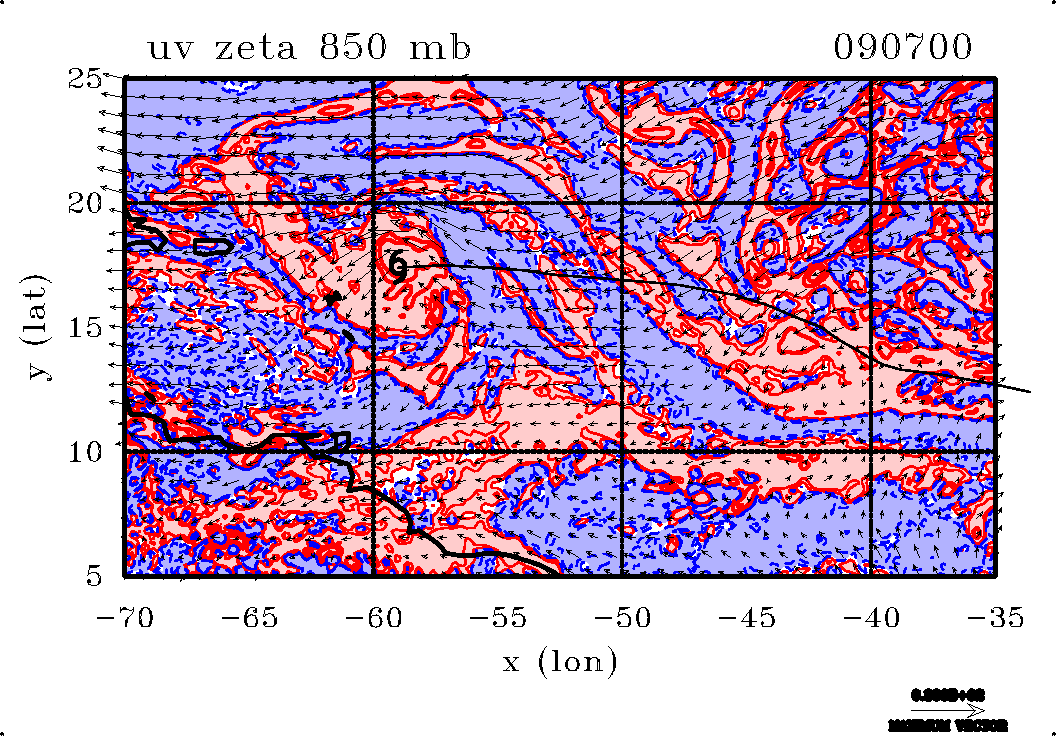
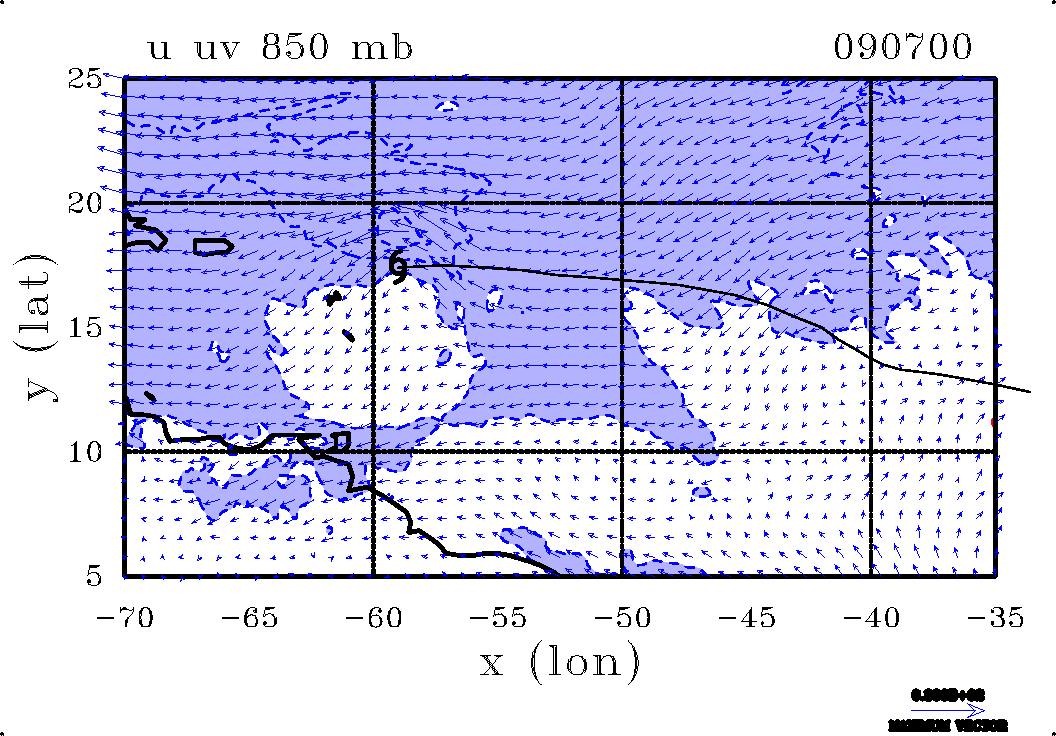
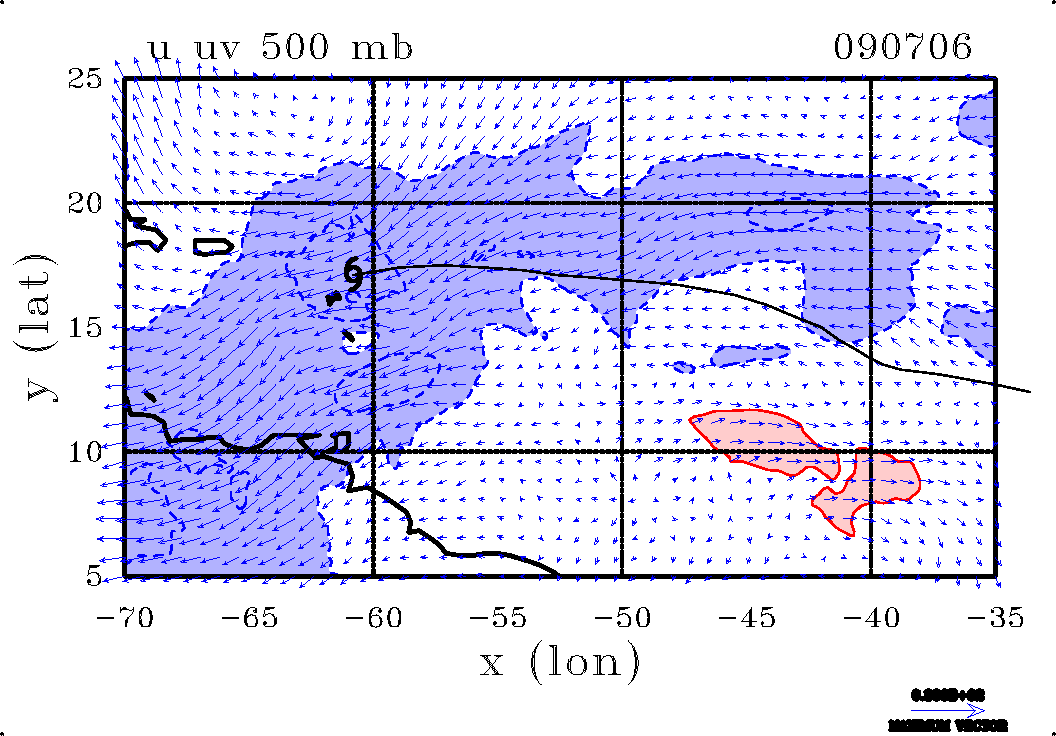
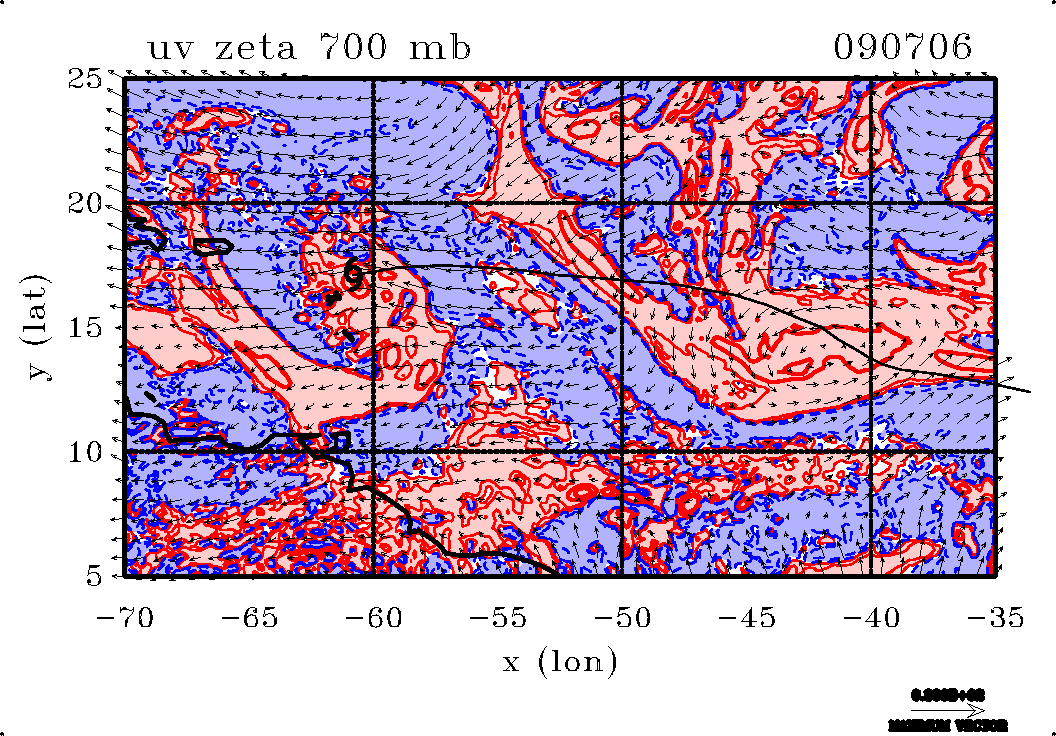
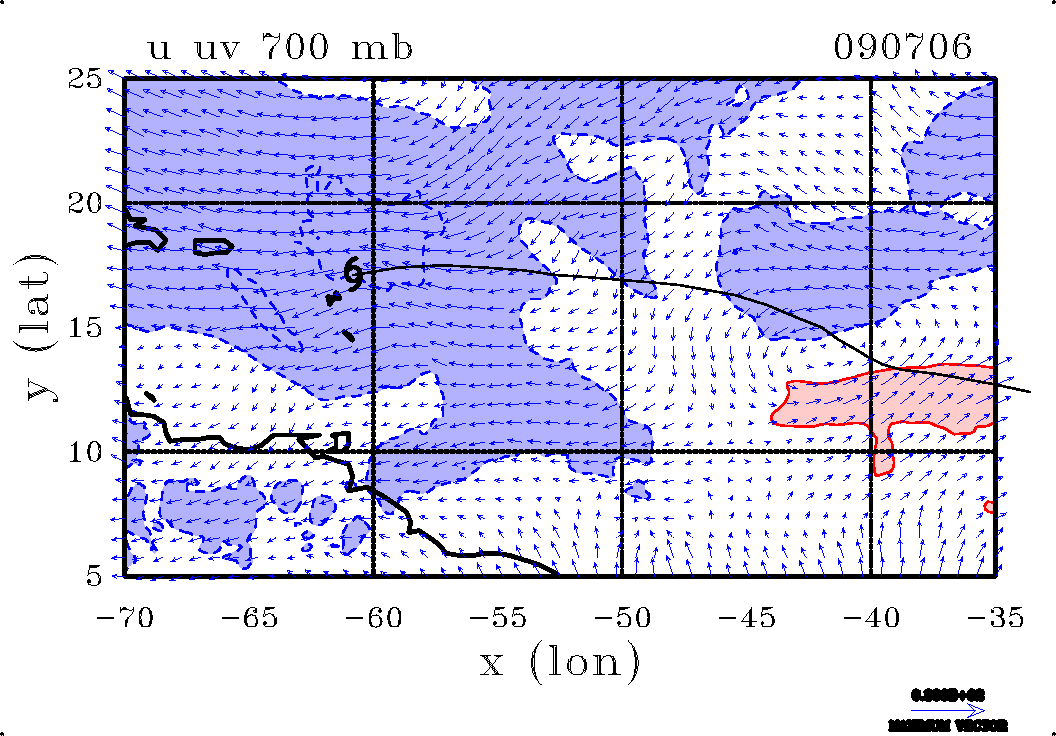
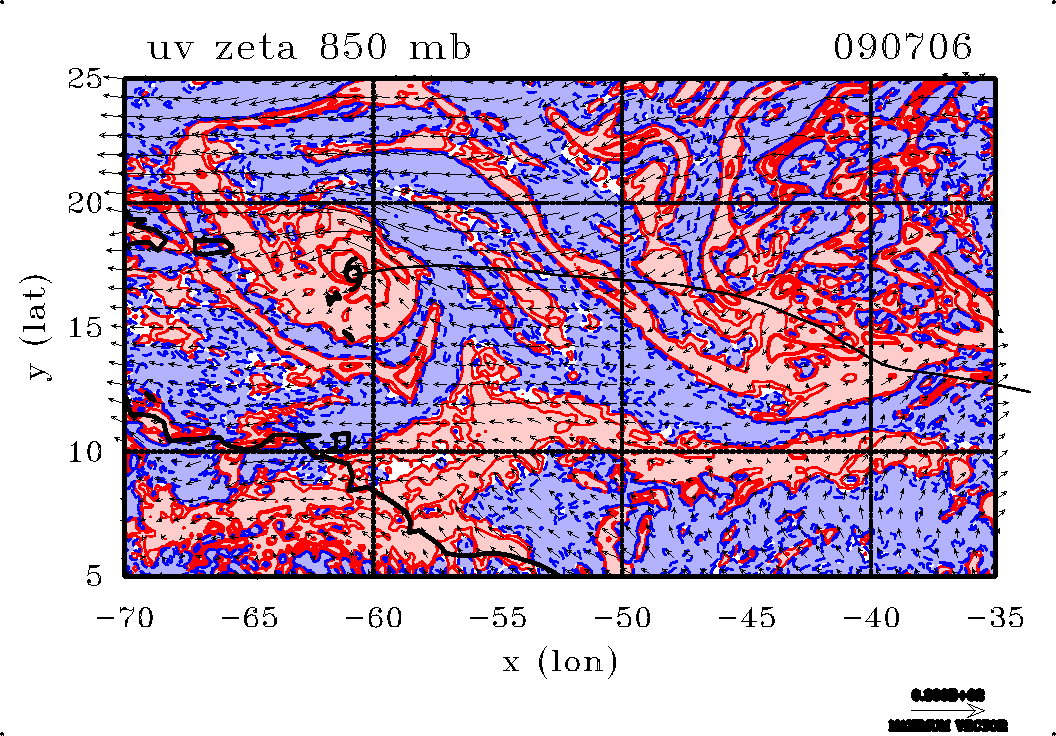
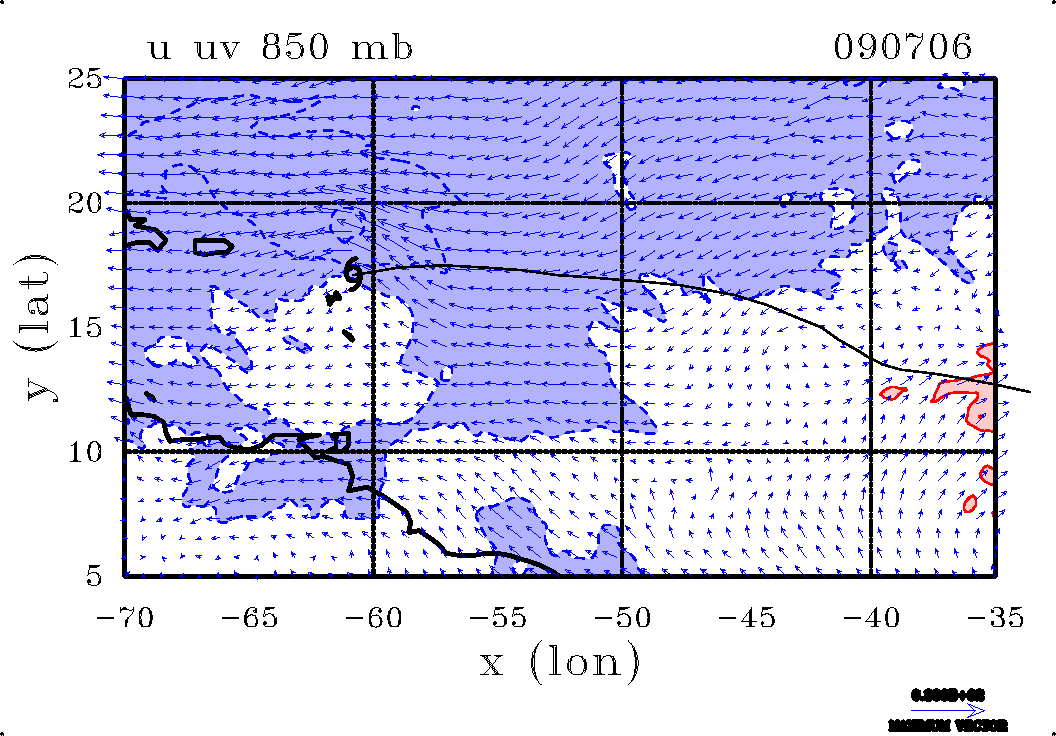
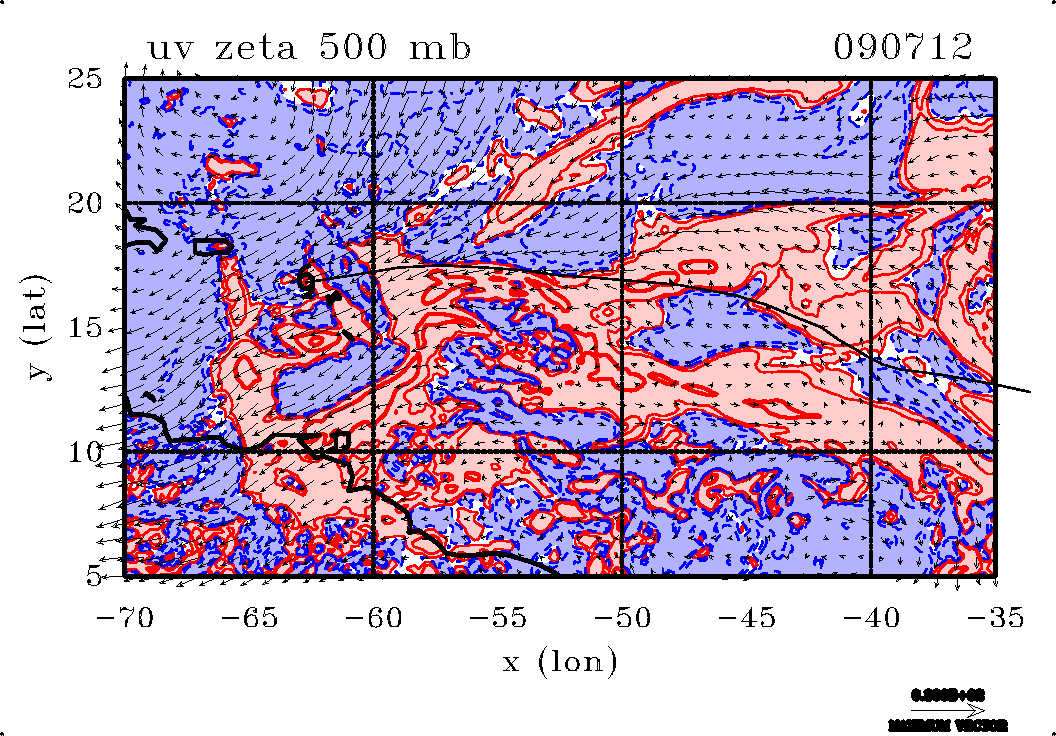
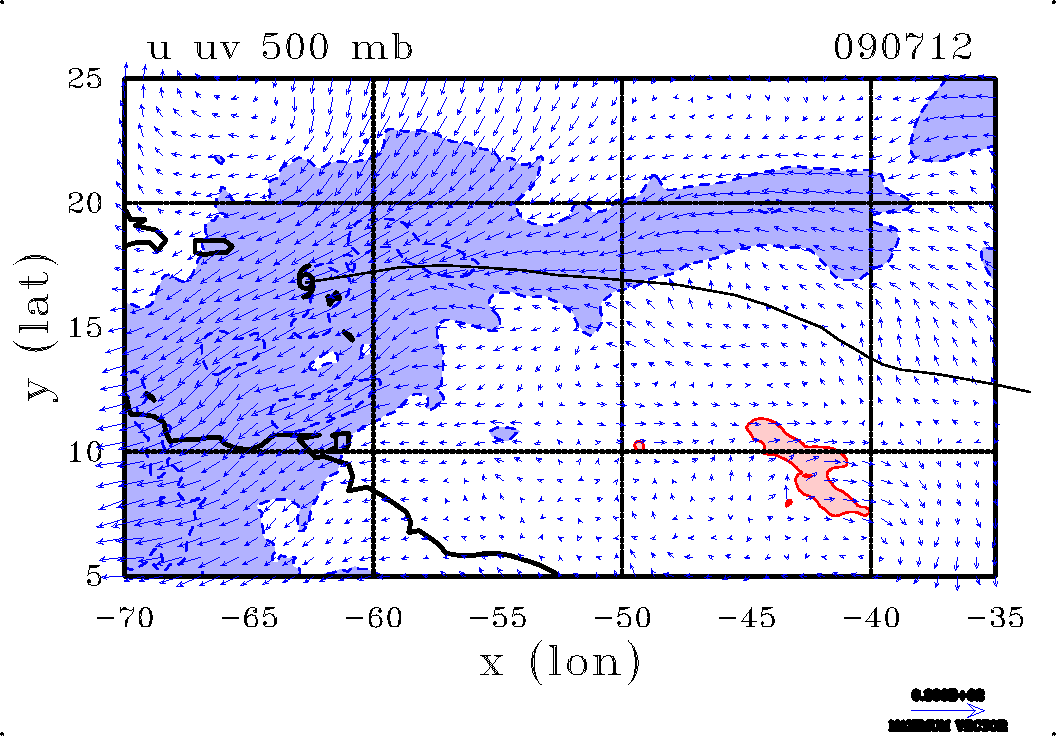
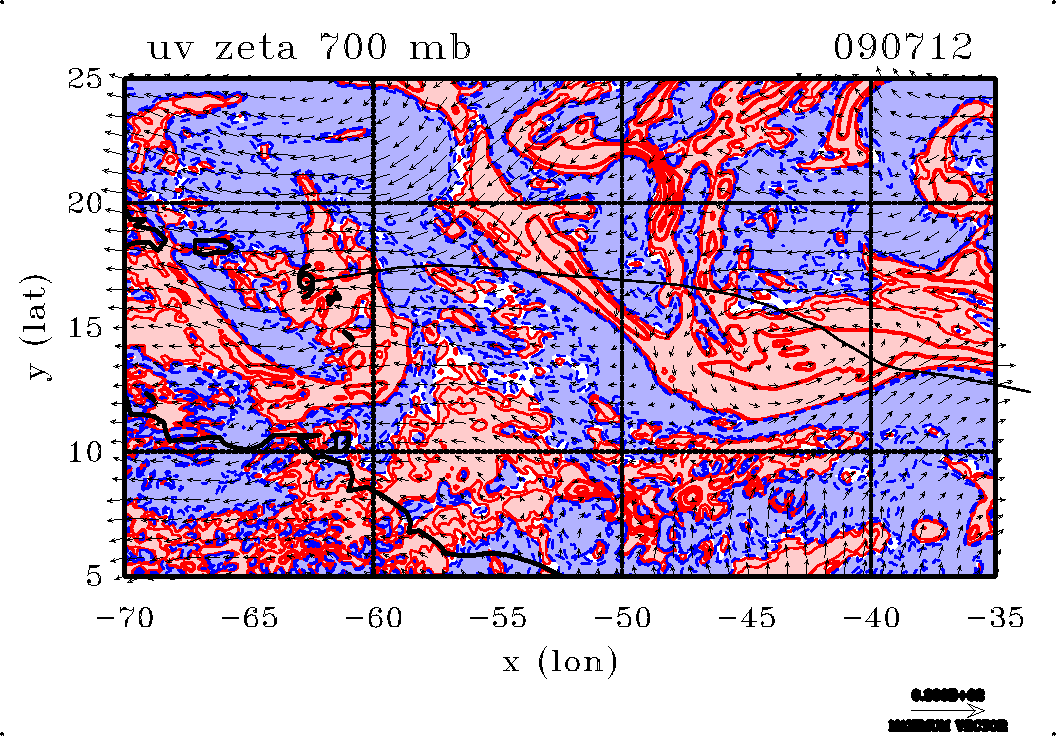
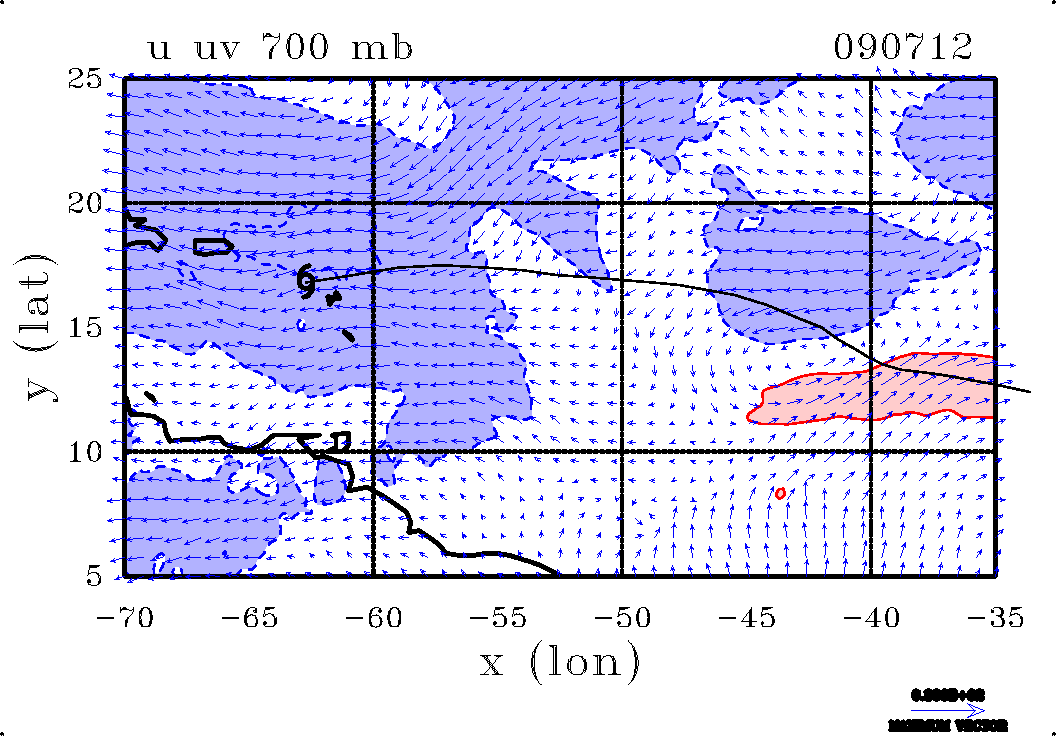
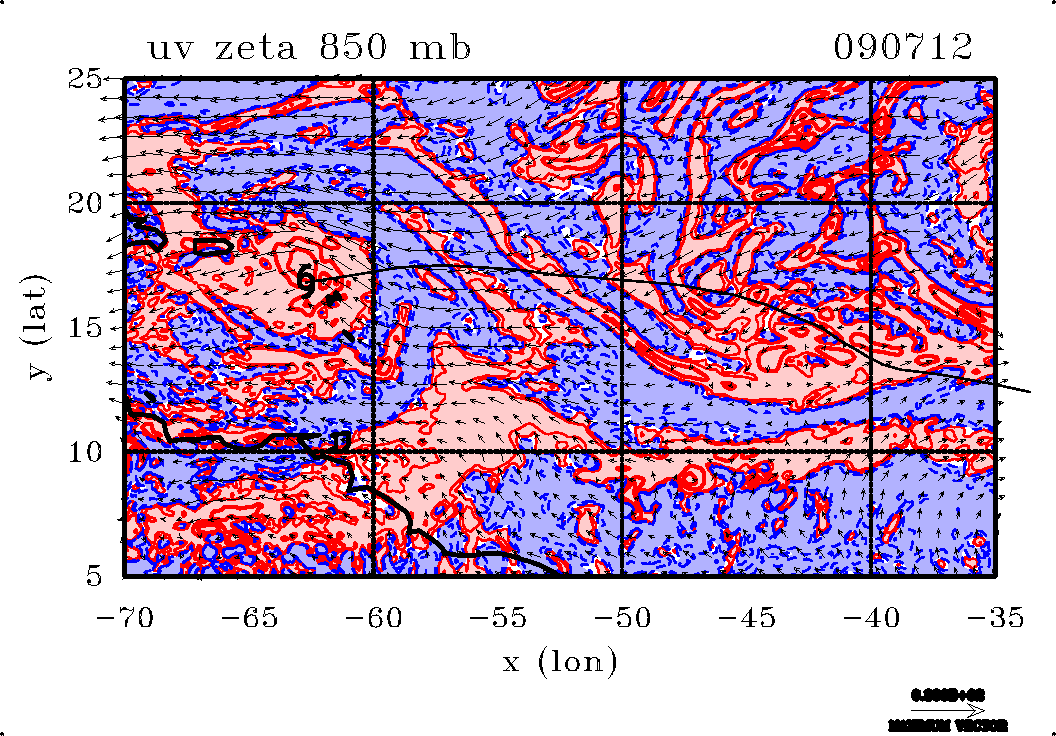
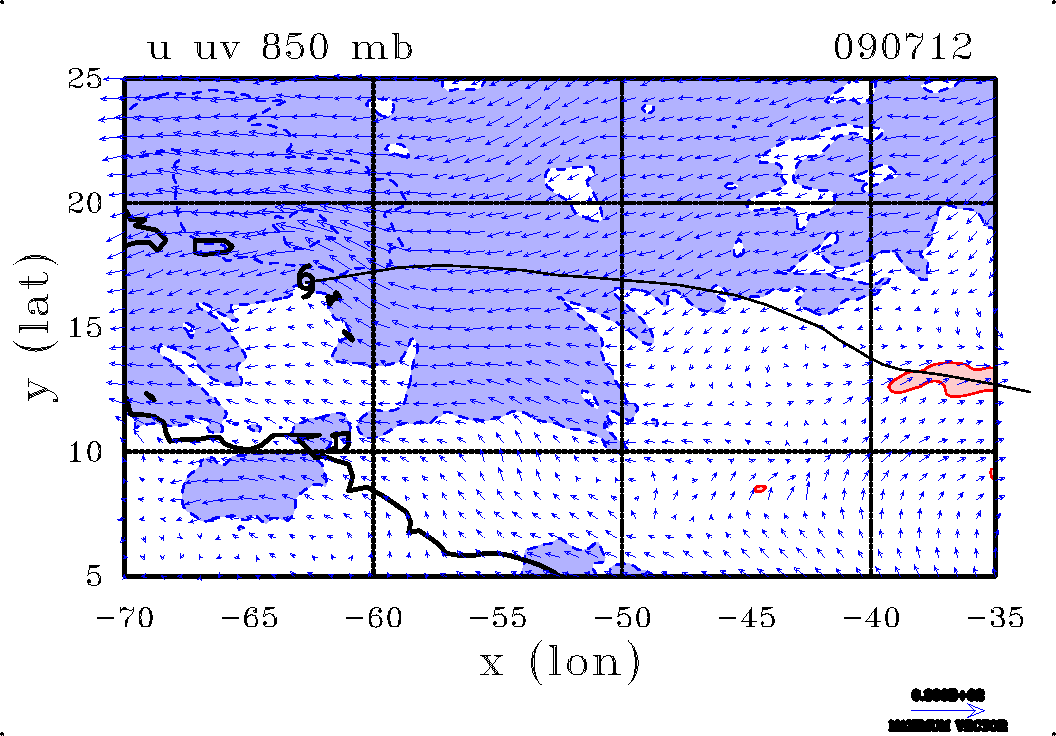
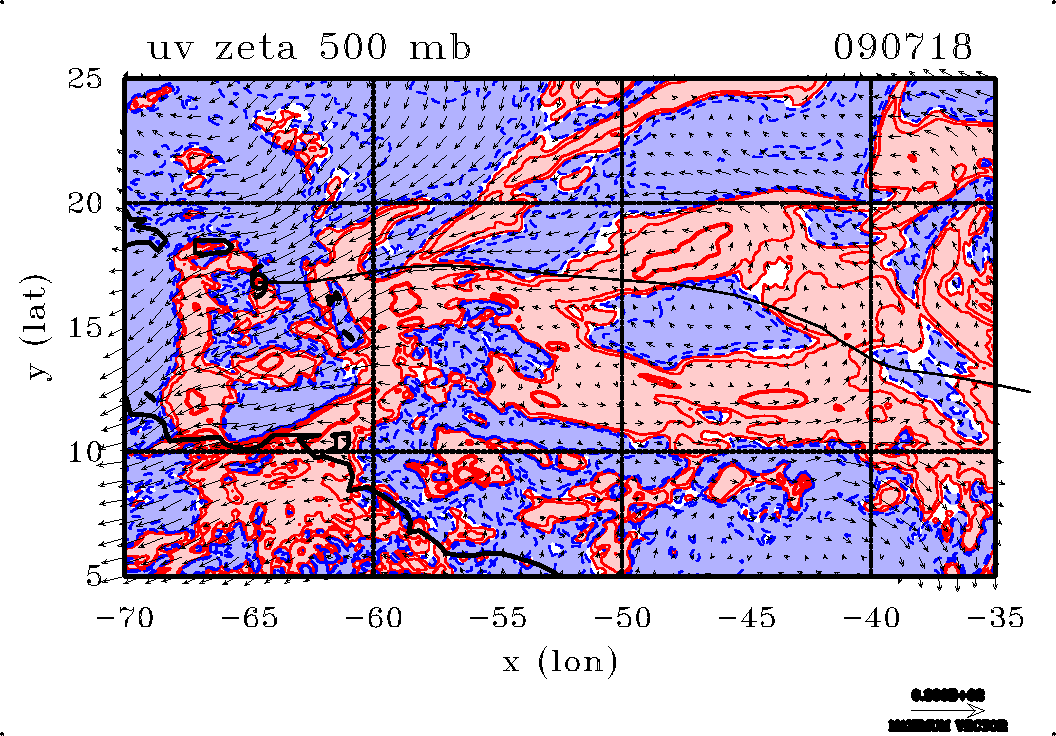
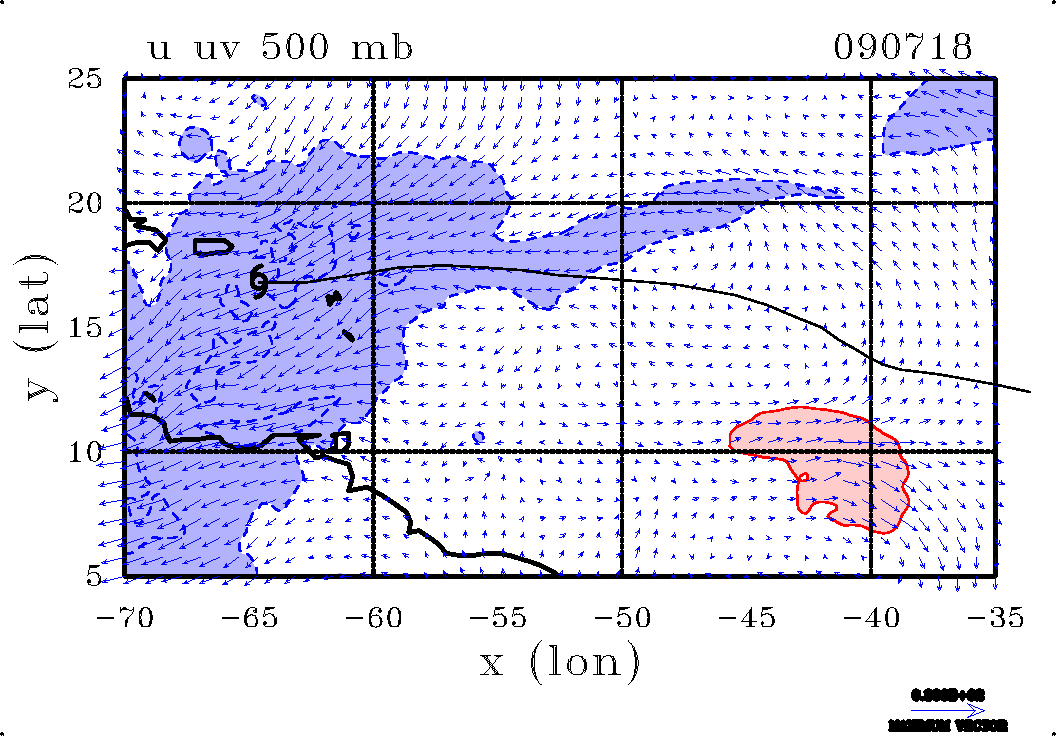
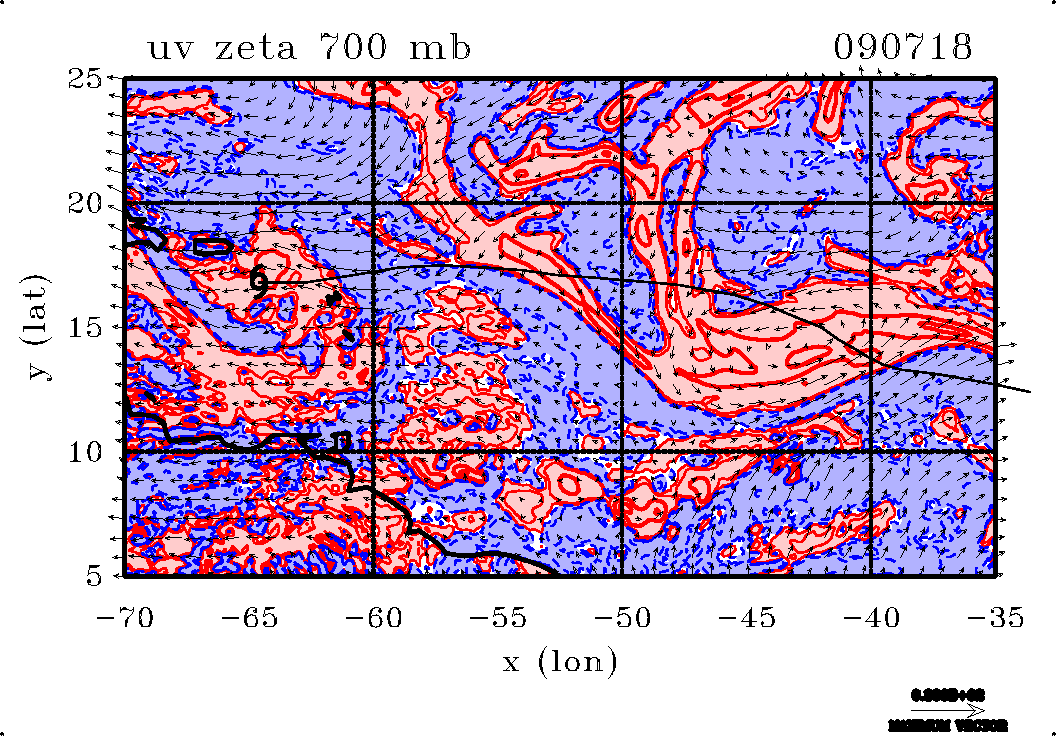
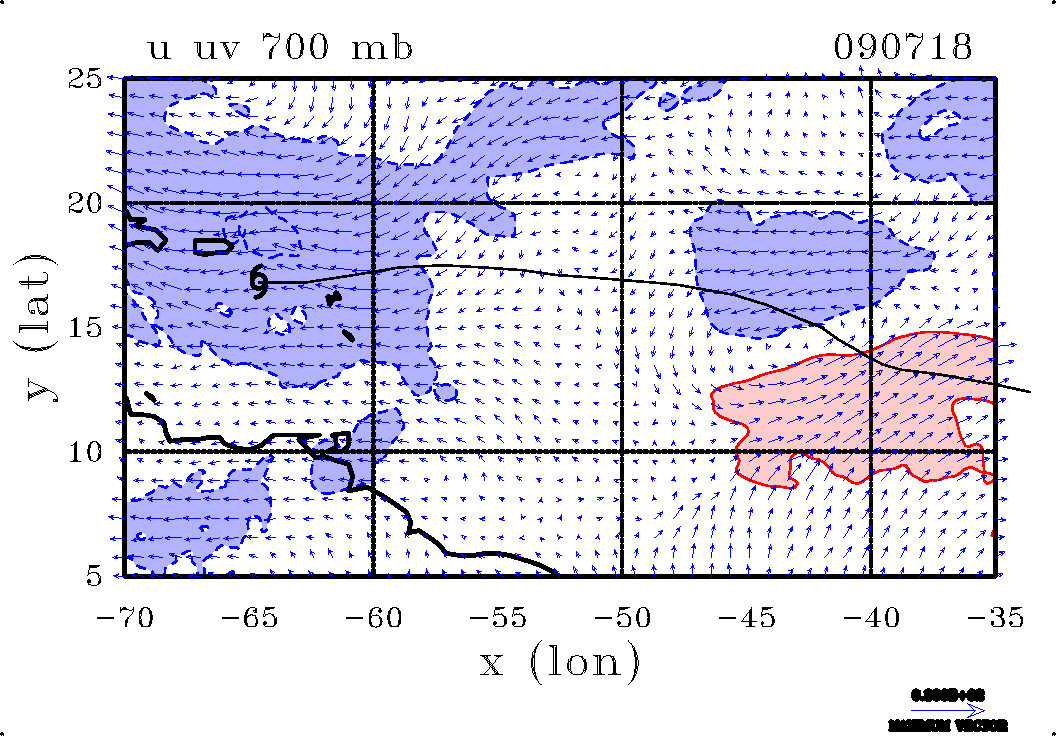
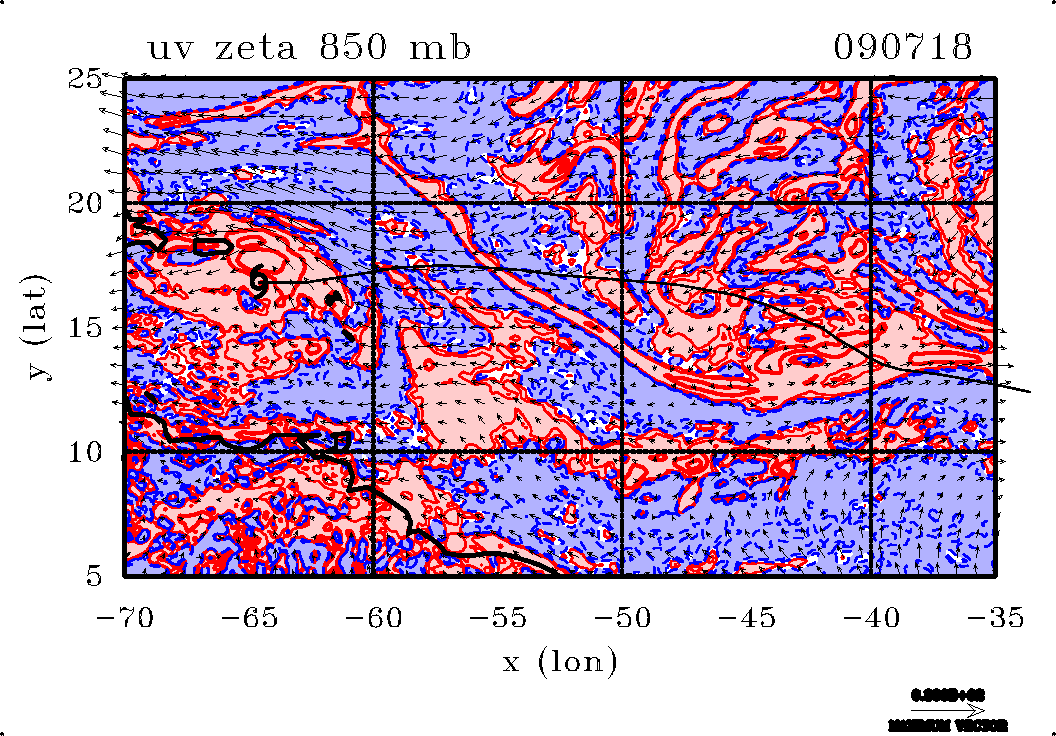
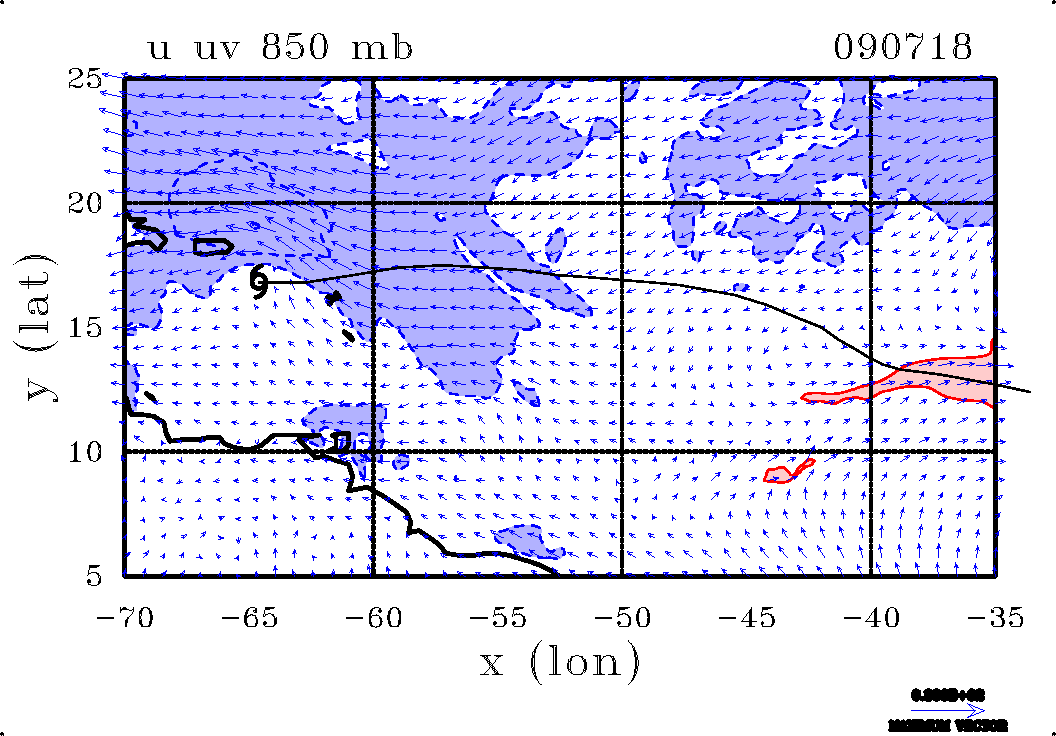
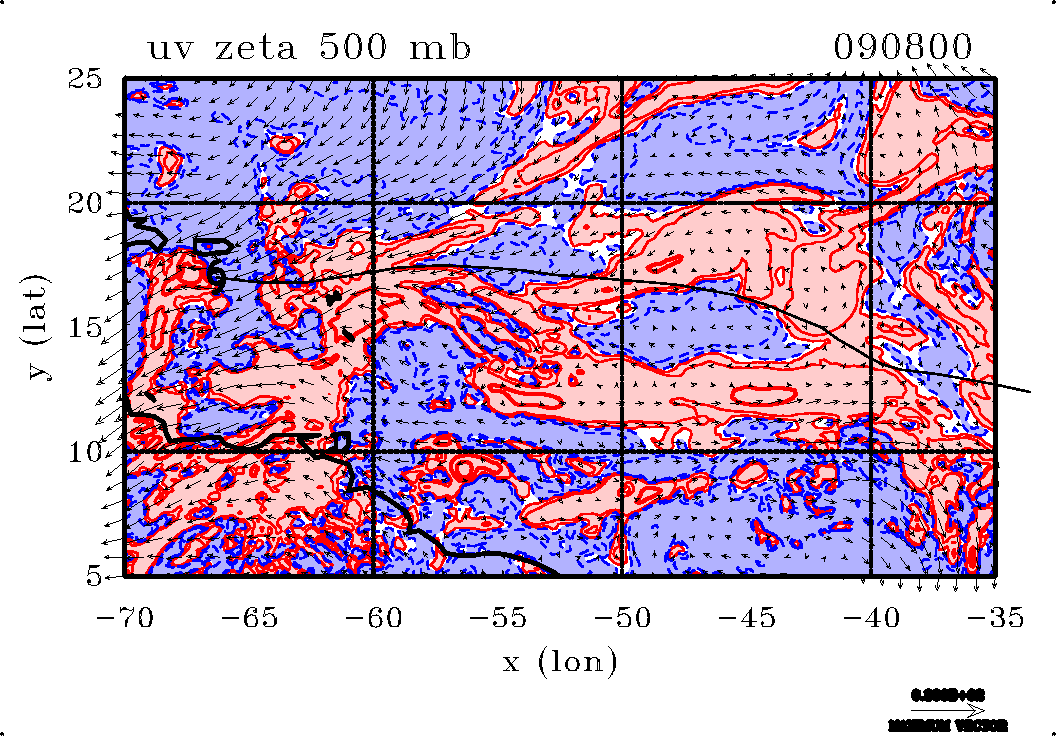
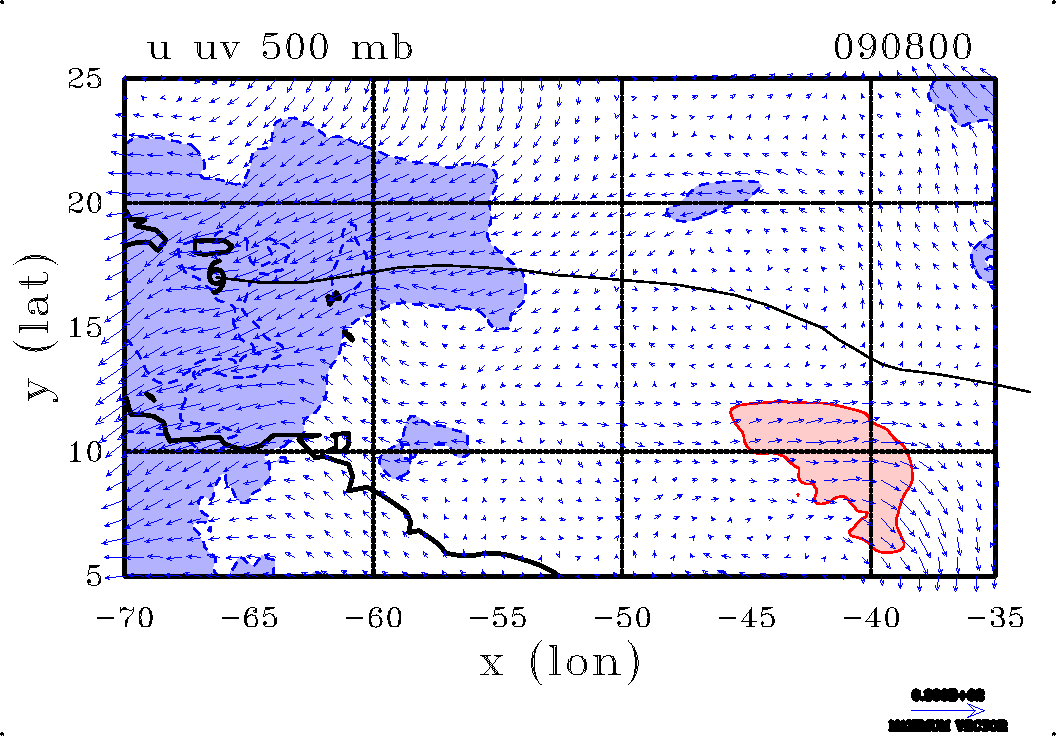
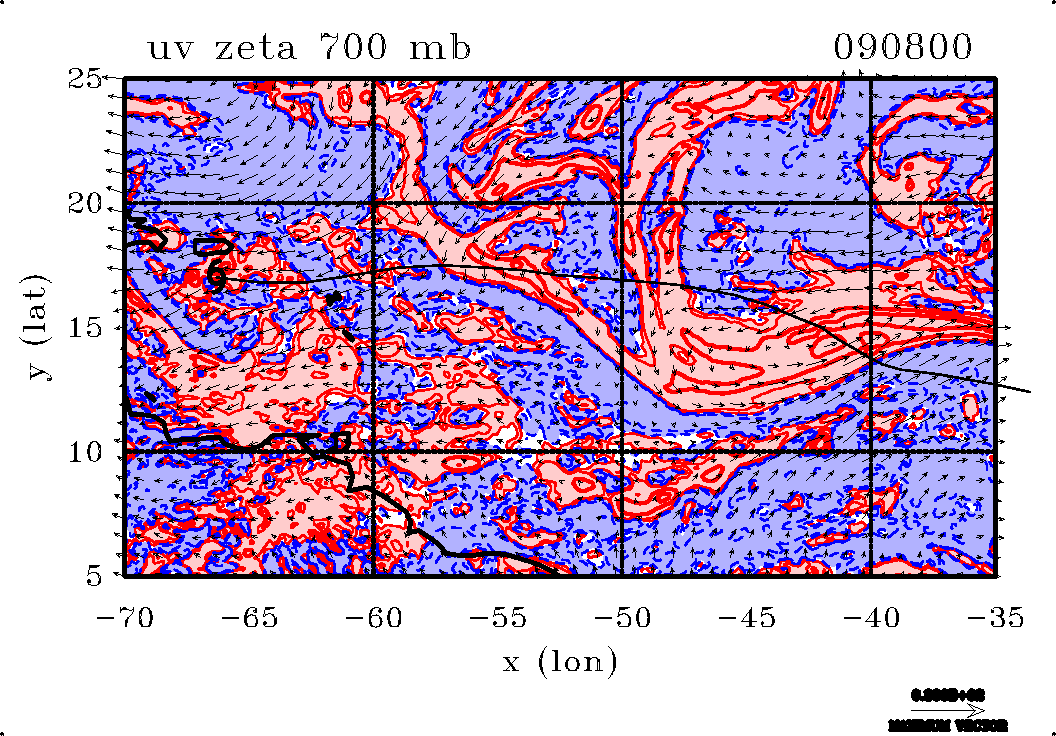
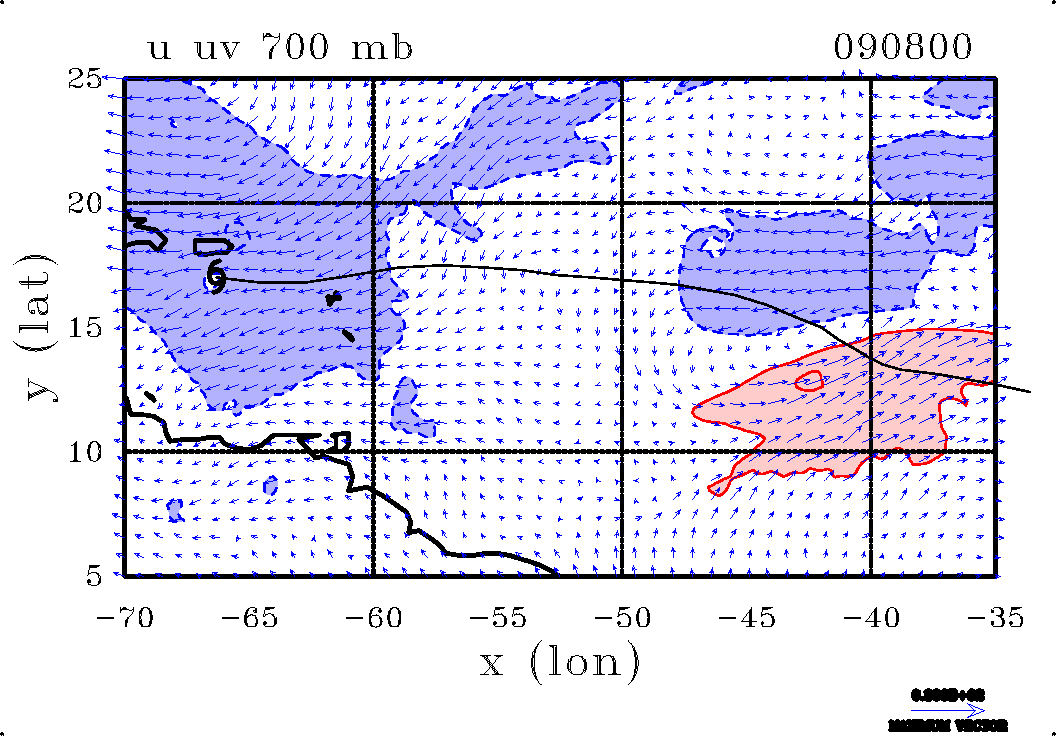
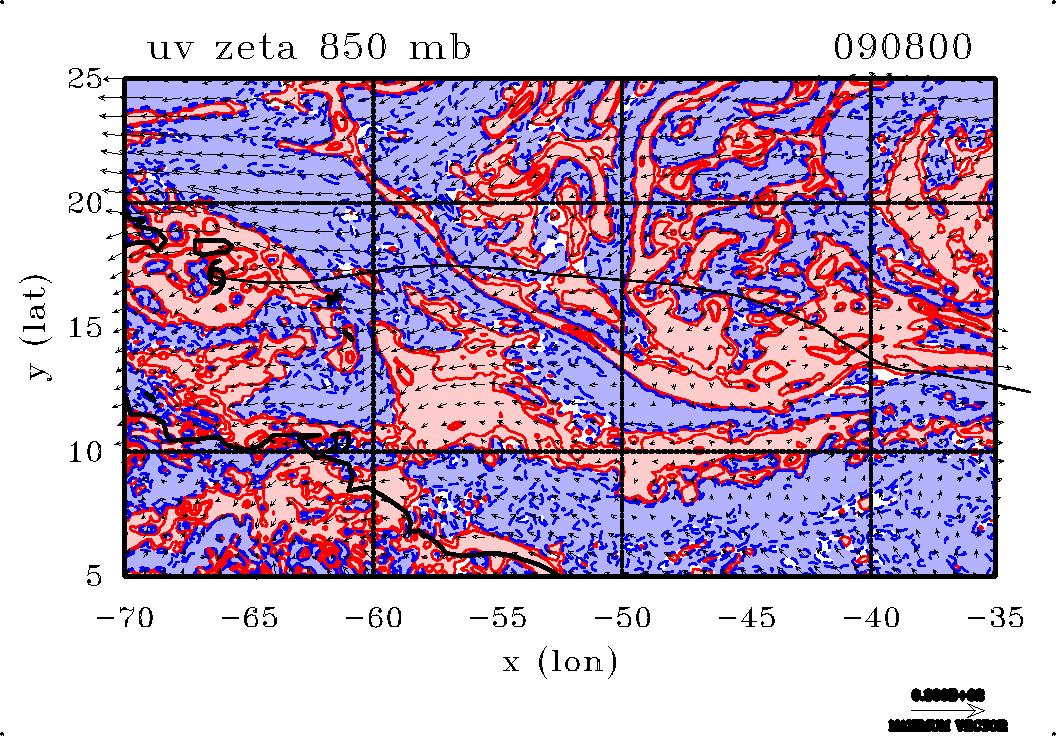
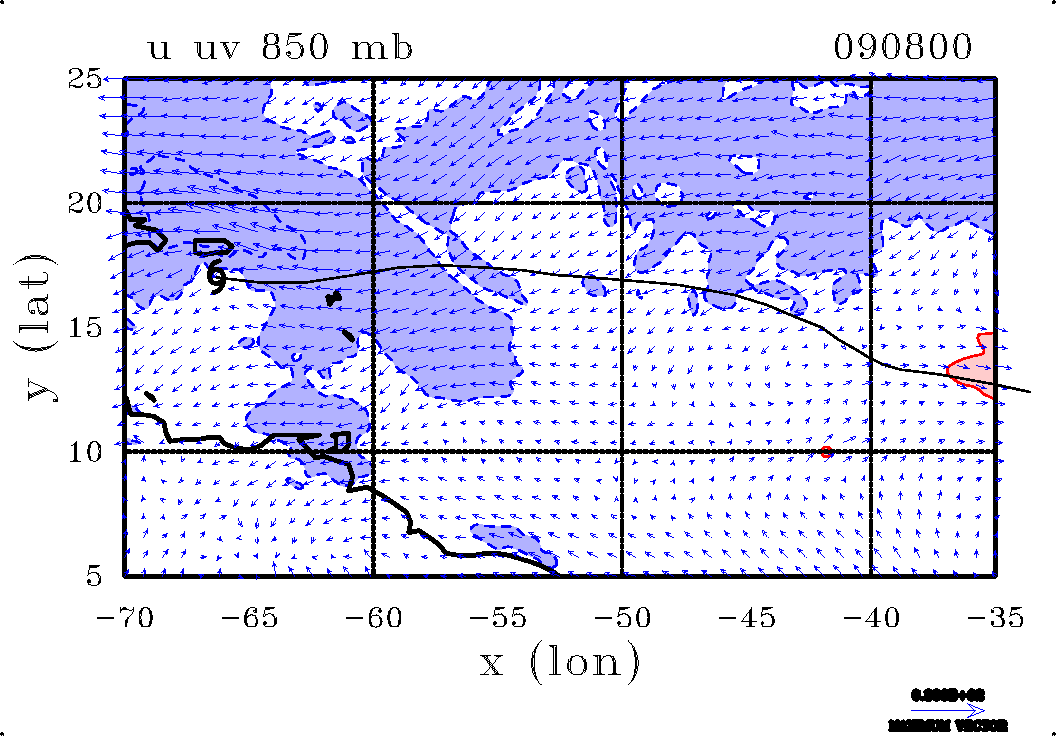
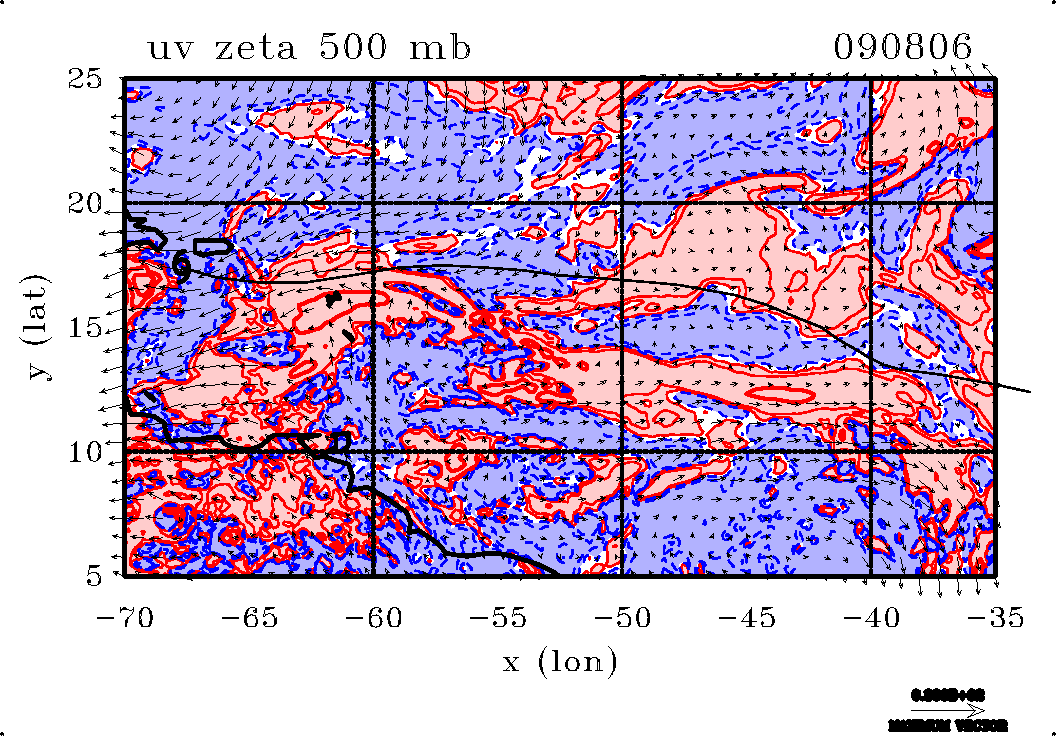
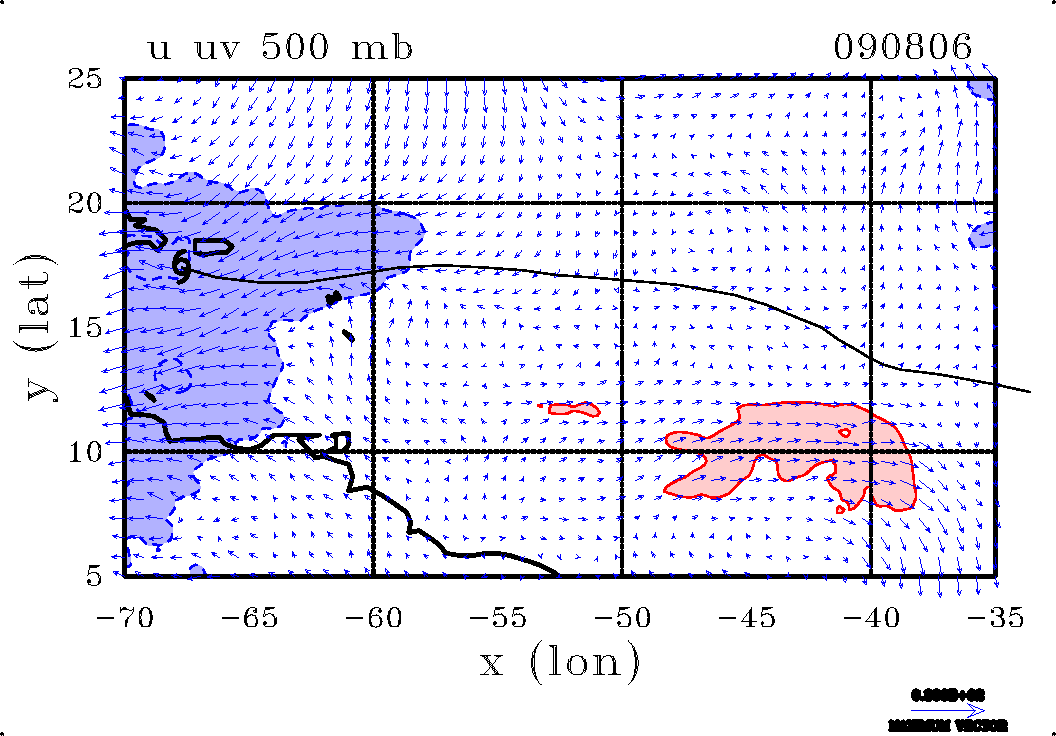
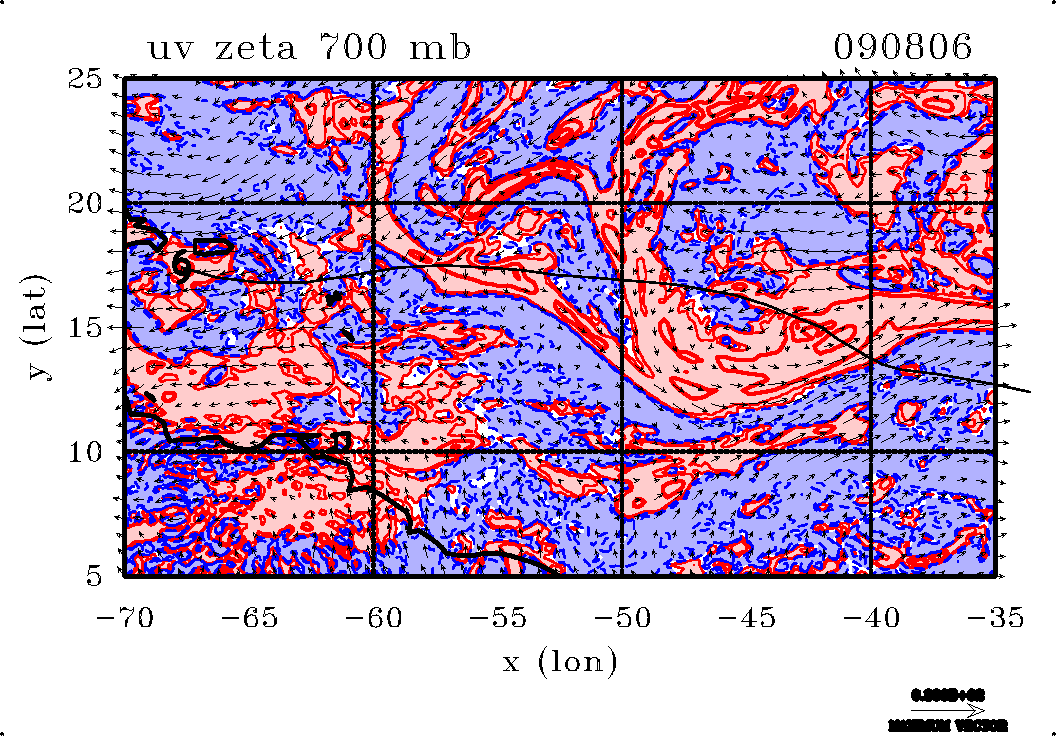
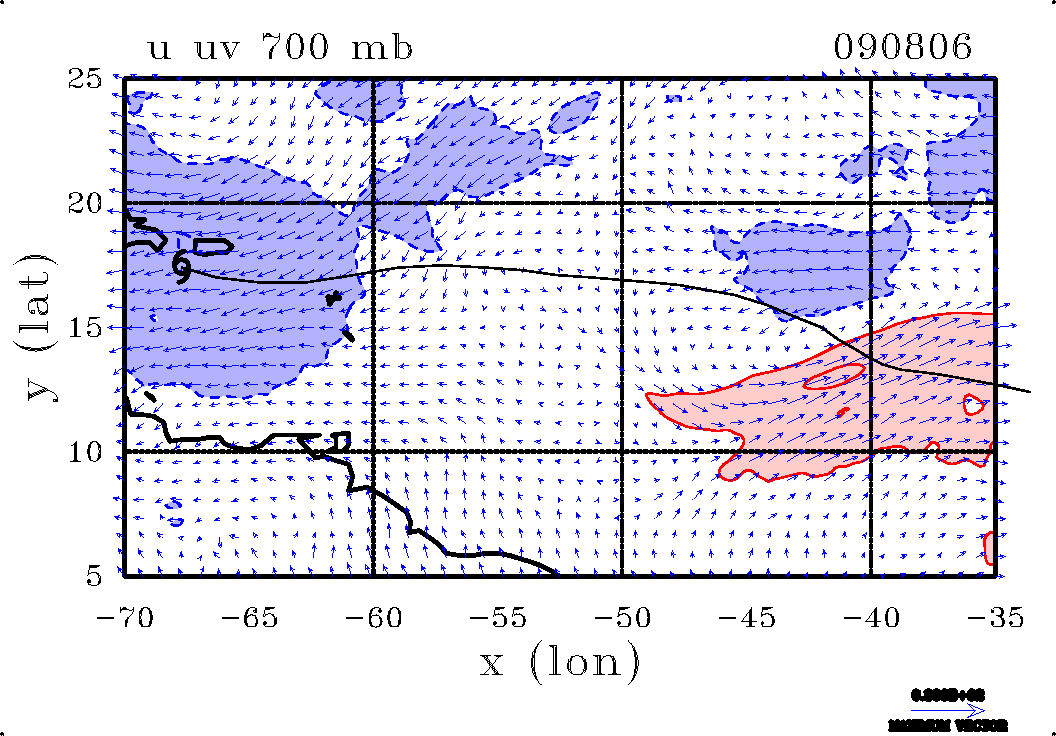
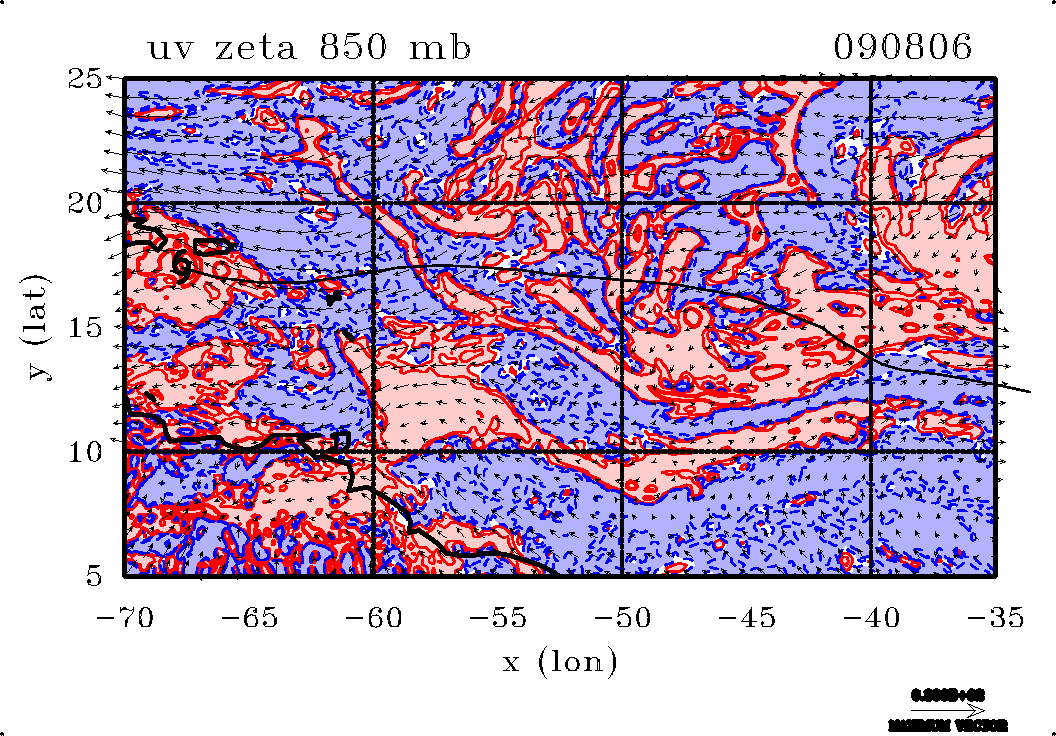
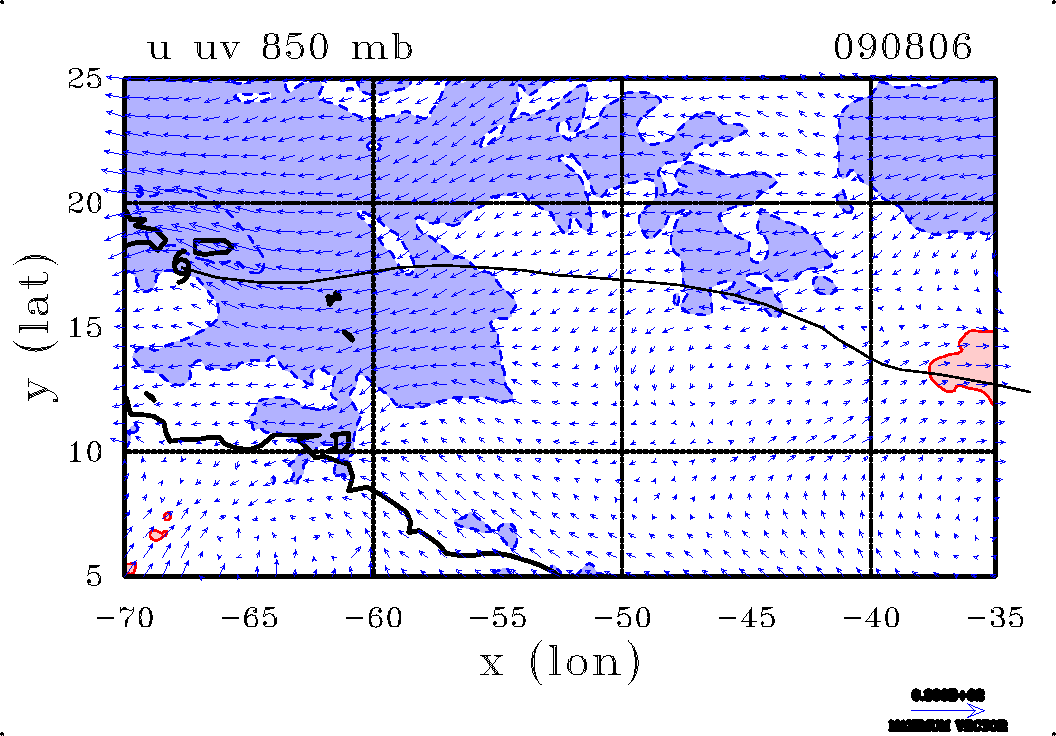
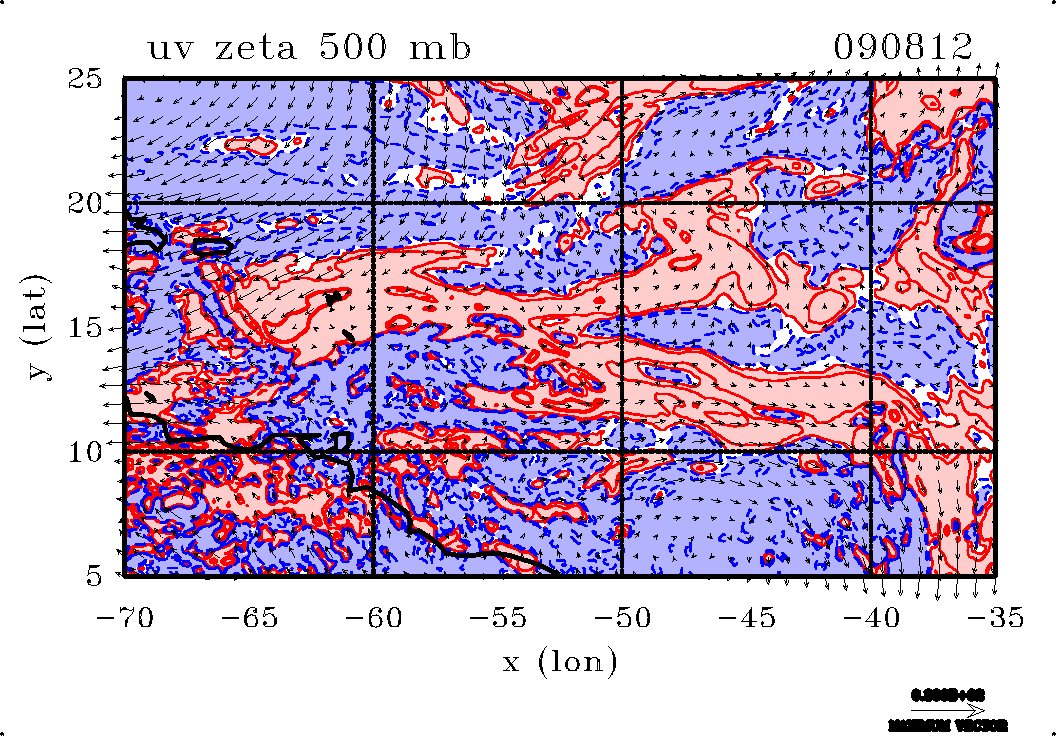
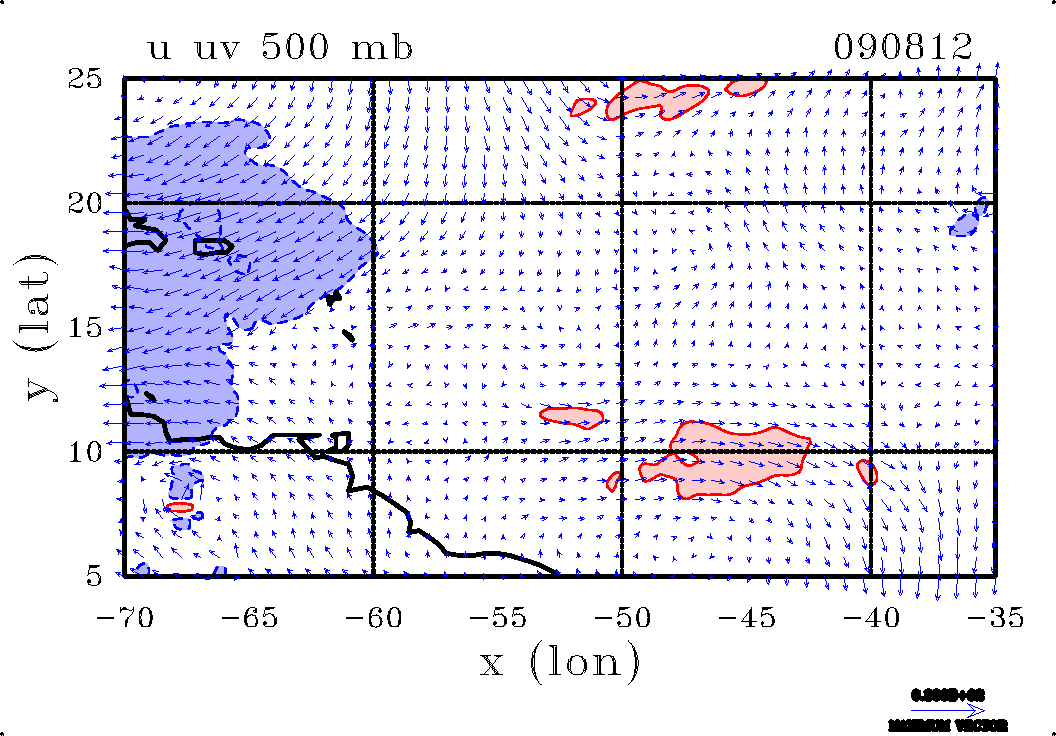
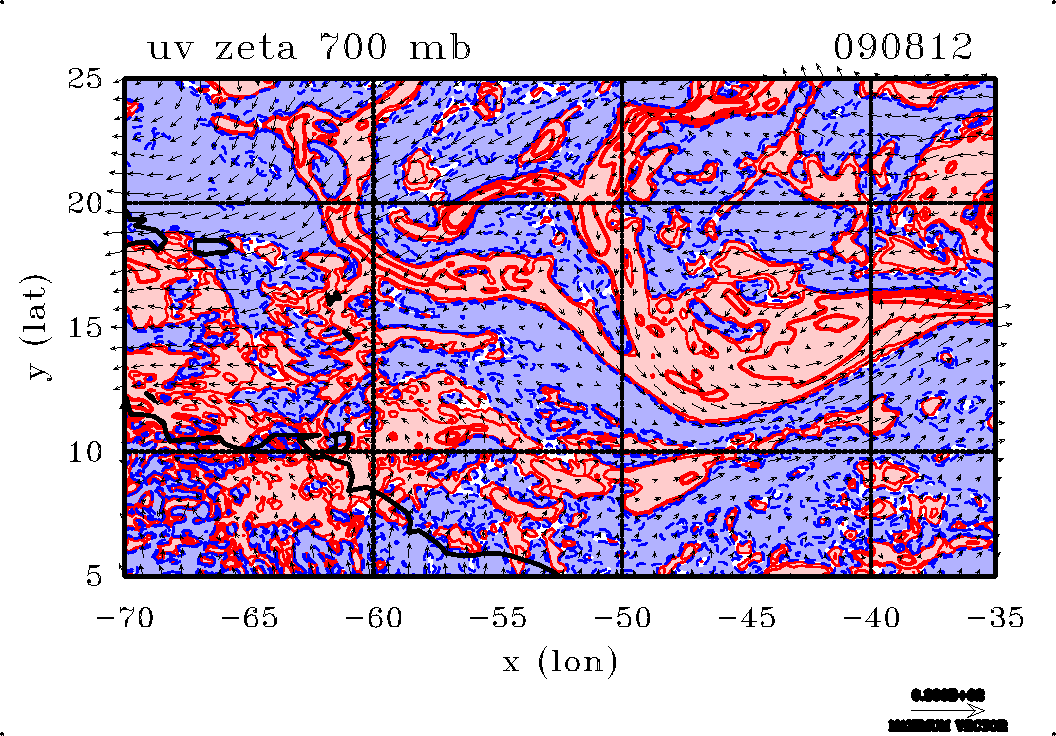
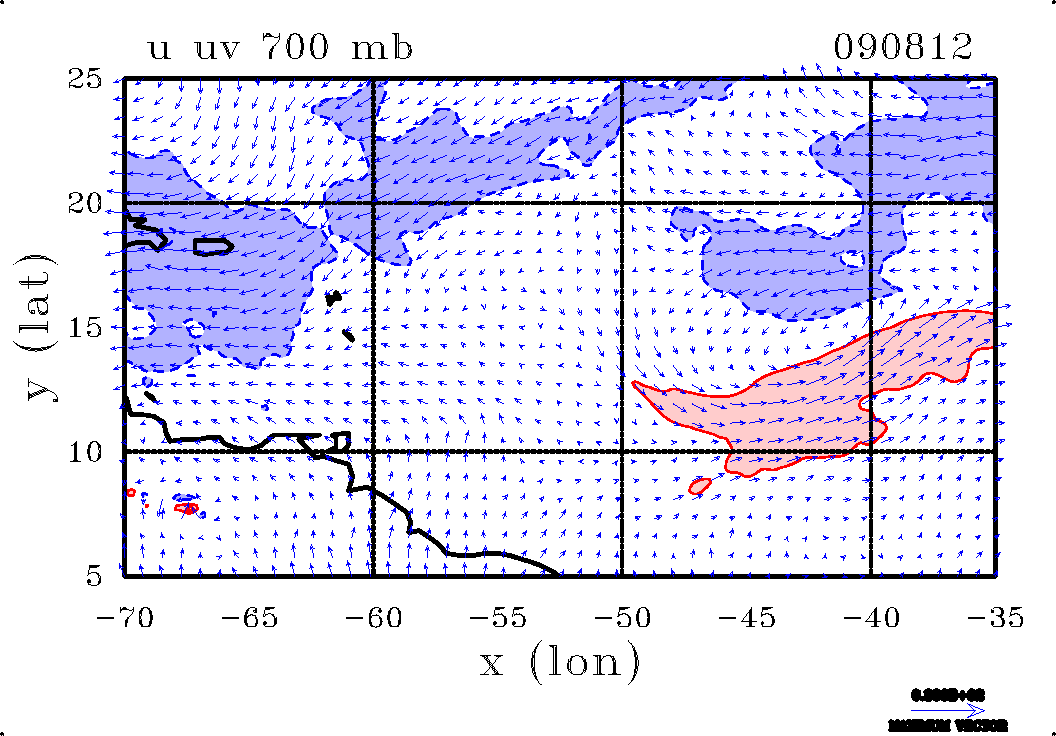
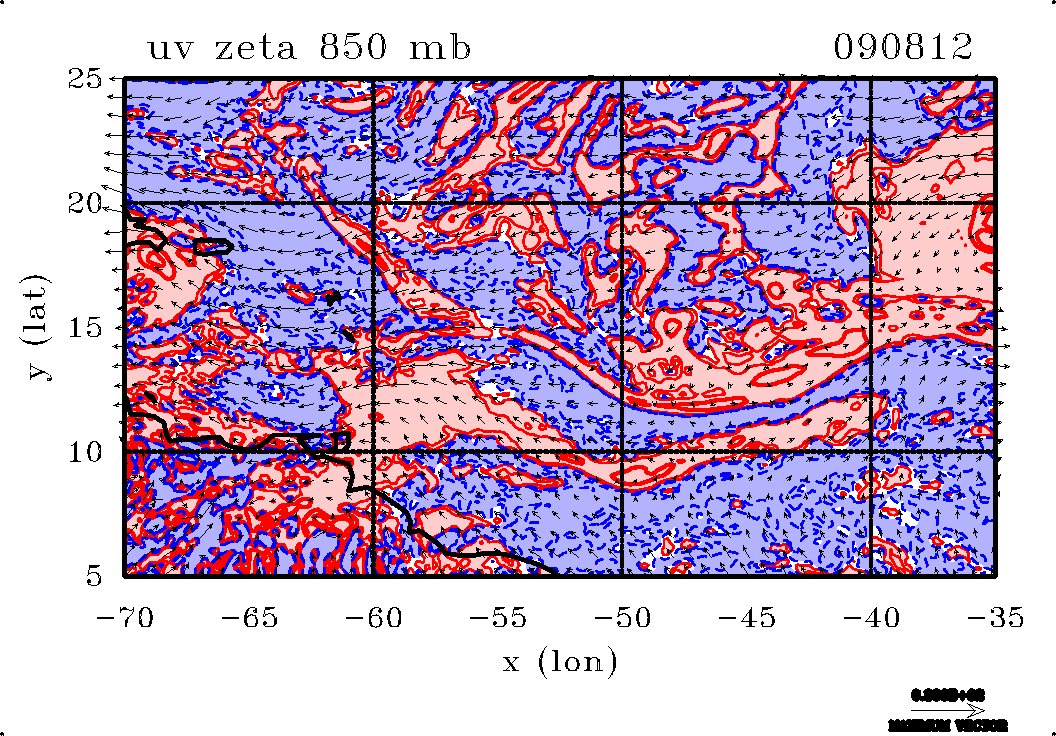
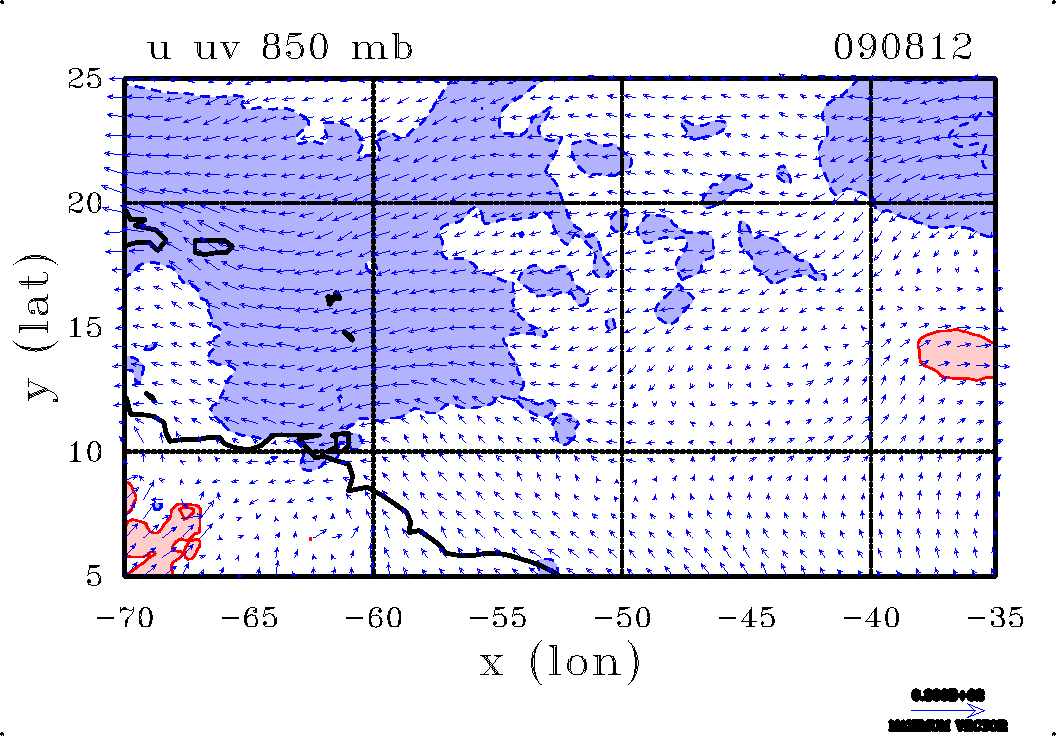
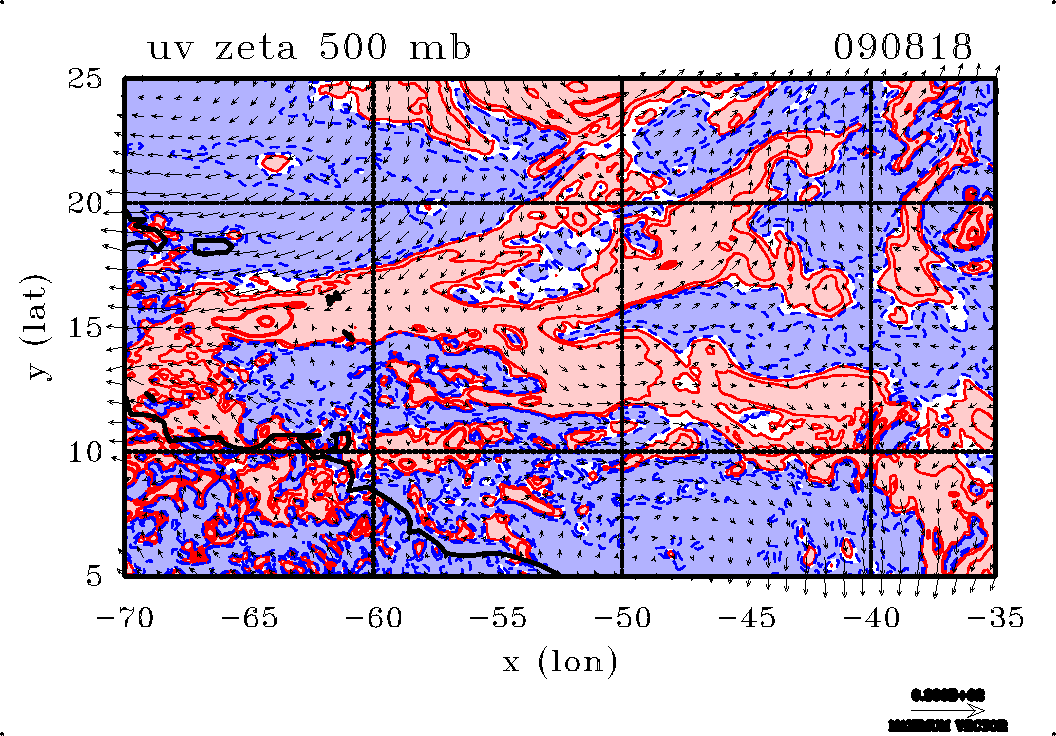
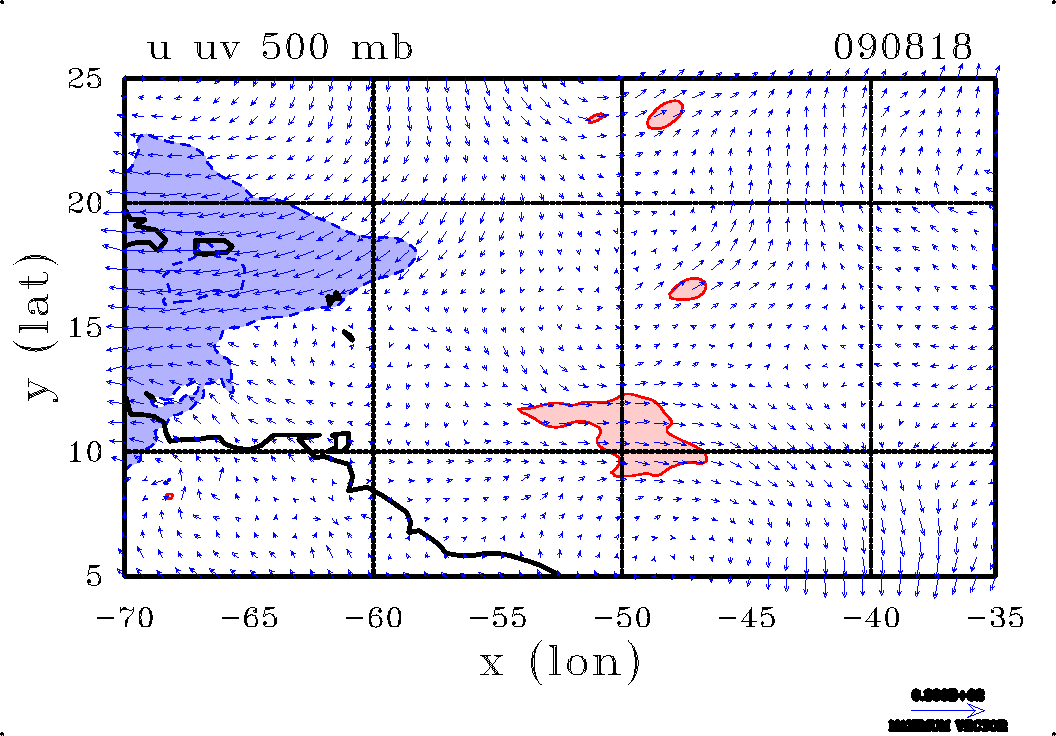
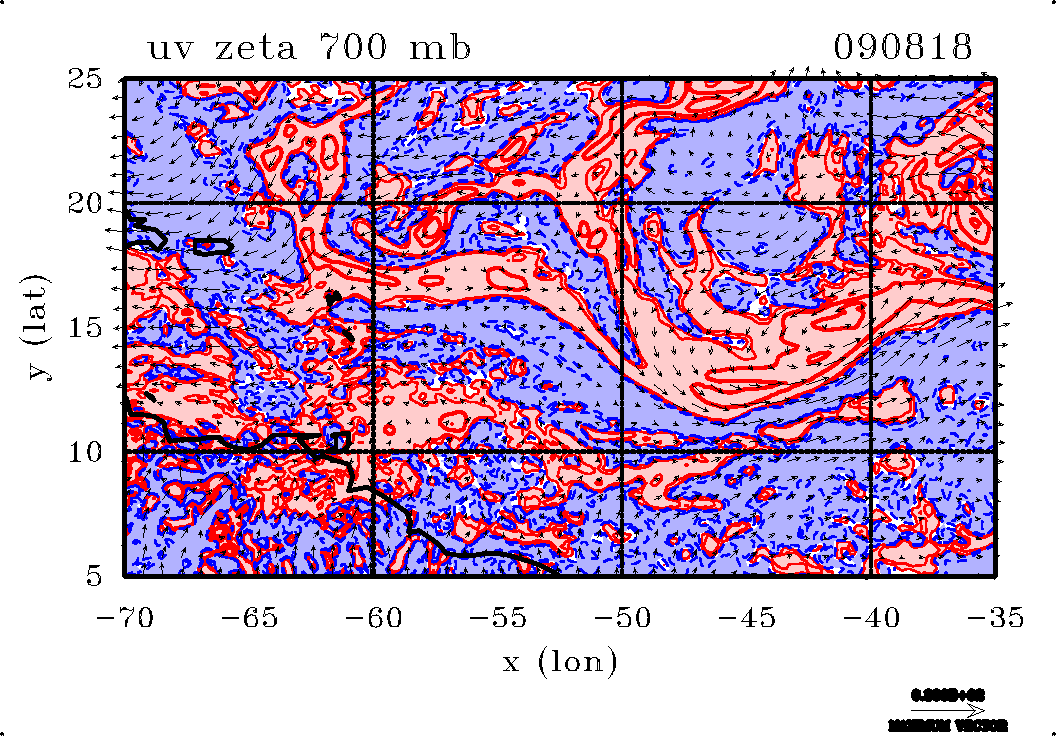
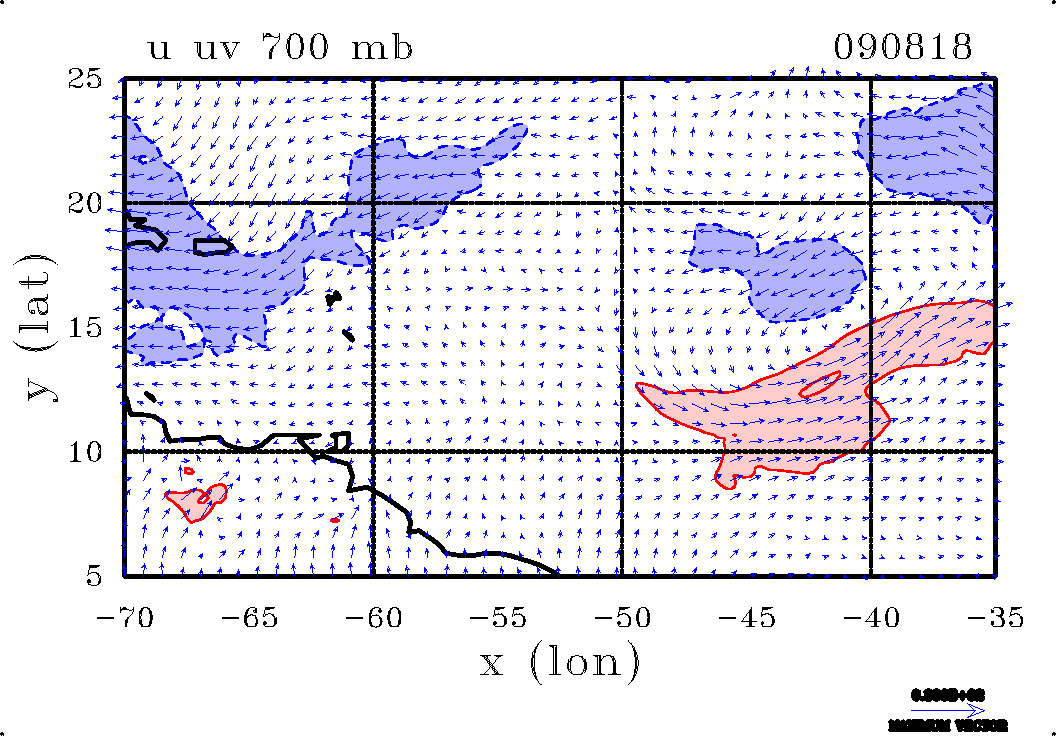
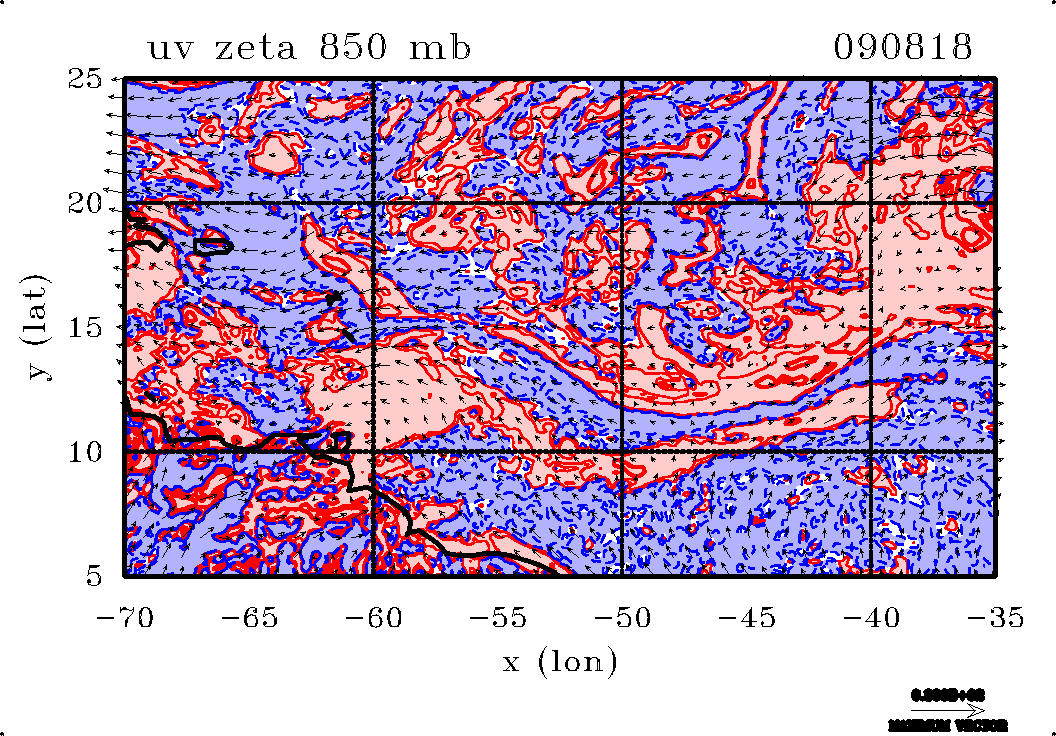
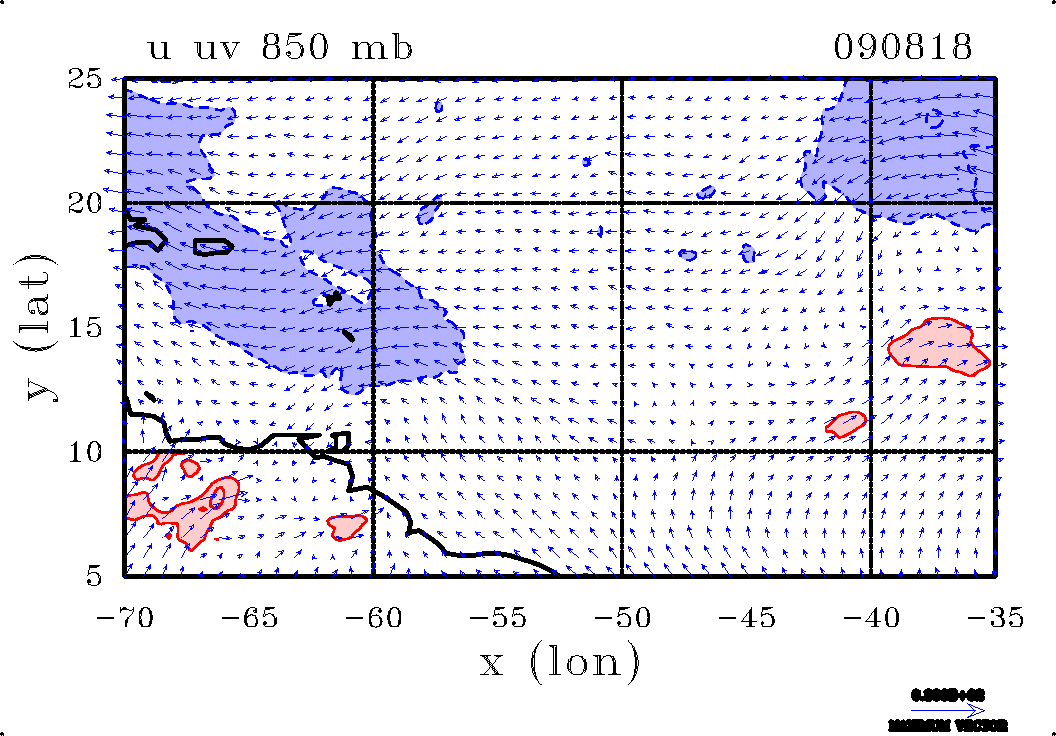
Wind vectors and contours of the vertical component of relative vorticity (left panels) and wind vectors with zonal wind contours (right panels) at selected pressure levels
Contours of relative vorticity: thin contours 2 × 10 -5 s-1 (twice the value of the Coriolis parameter at 20oN), and 1 × 10 m s-4 s-1, thick contours 5 × 10 m s-4 s-1 and 1 × 10 m s-3 s-1. Positive values red/solid, negative values blue/dashed. Regions with values larger than 2 × 10 -5 s-1 are shaded pink, those with values larger than 2 × 10 -5 s-1 are shaded light blue. Contour interval for zonal wind is 5 m s-1. Positive values red/solid, negative values blue/dashed. Regions with westerly winds larger than 5 m s-1 are shaded pink, those with easterly winds larger than 5 m s-1 are shaded light blue. The track in the right panels is that of Tropical storm Gaston and the black cyclone symbols indicate the 6 hourly best track positions of Gaston. The blue cyclone symbol marks the minimum geopotential at the corresponding pressure level at the time of the plot shown at the top right of each panel.
 |  |
 |  |
 |  |
 |  |
 |  |
 |  |
 |  |
 |  |
 |  |
 |  |
 |  |
 |  |
 |  |
 |  |
 |  |
 |  |
 |  |
 |  |
 |  |
 |  |
 |  |
 |  |
 |  |
 |  |
 |  |
 |  |
 |  |
 |  |
 |  |
 |  |
 |  |
 |  |
 |  |
 |  |
 |  |
 |  |
 |  |
 |  |
 |  |
 |  |
 |  |
 |  |
 |  |
 |  |
 |  |
 |  |
 |  |
 |  |
 |  |
 |  |
 |  |
 |  |
 |  |
 |  |
 |  |
 |  |
 |  |
 |  |
 |  |
 |  |
 |  |
 |  |
 |  |
 |  |
 |  |
 |  |
 |  |
 |  |
 |  |
 |  |
 |  |
 |  |
 |  |
 |  |
 |  |
 |  |
 |  |
 |  |
 |  |
 |  |
 |  |
 |  |
 |  |
 |  |
 |  |
 |  |
 |  |
 |  |
 |  |
 |  |
 |  |
 |  |
 |  |
 |  |
 |  |
 |  |
 |  |
 |  |
 |  |
 |  |
 |  |
 |  |
 |  |
 |  |
 |  |
 |  |
 |  |
 |  |
 |  |
 |  |
 |  |
Copyright © Roger Smith